Esperanza, PR Map & Demographics
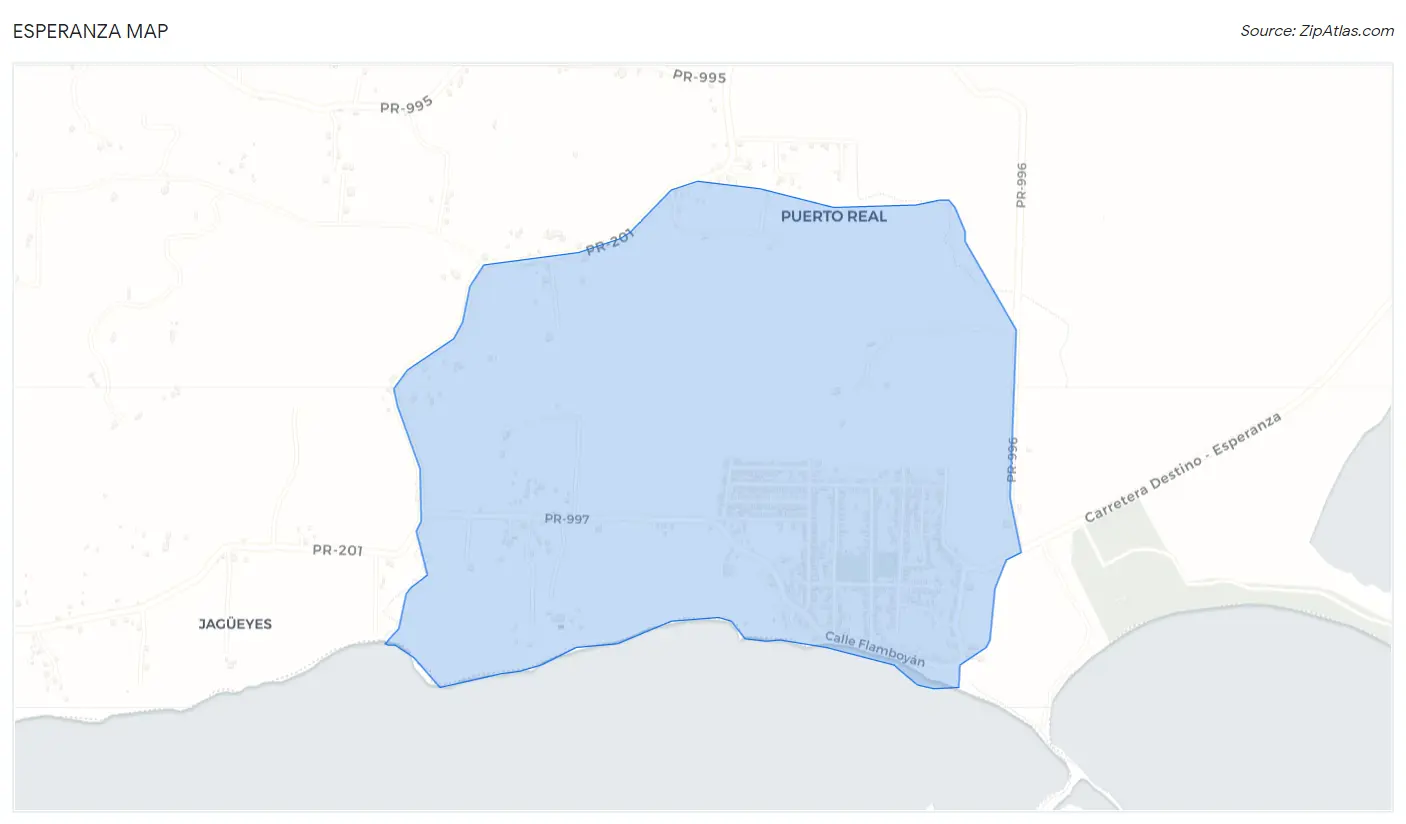
Esperanza Map
Esperanza Overview
$10,847
PER CAPITA INCOME
$32,853
AVG FAMILY INCOME
$33,098
AVG HOUSEHOLD INCOME
0.32
INEQUALITY / GINI INDEX
920
TOTAL POPULATION
287
MALE POPULATION
633
FEMALE POPULATION
45.34
MALES / 100 FEMALES
220.56
FEMALES / 100 MALES
59.4
MEDIAN AGE
4.1
AVG FAMILY SIZE
3.7
AVG HOUSEHOLD SIZE
159
LABOR FORCE [ PEOPLE ]
20.1%
PERCENT IN LABOR FORCE
Income in Esperanza
Income Overview in Esperanza
Per Capita Income in Esperanza is $10,847, while median incomes of families and households are $32,853 and $33,098 respectively.
| Characteristic | Number | Measure |
| Per Capita Income | 920 | $10,847 |
| Median Family Income | 183 | $32,853 |
| Mean Family Income | 183 | $30,742 |
| Median Household Income | 250 | $33,098 |
| Mean Household Income | 250 | $30,670 |
| Income Deficit | 183 | $0 |
| Wage / Income Gap (%) | 920 | 0.00% |
| Wage / Income Gap ($) | 920 | 100.00¢ per $1 |
| Gini / Inequality Index | 920 | 0.32 |
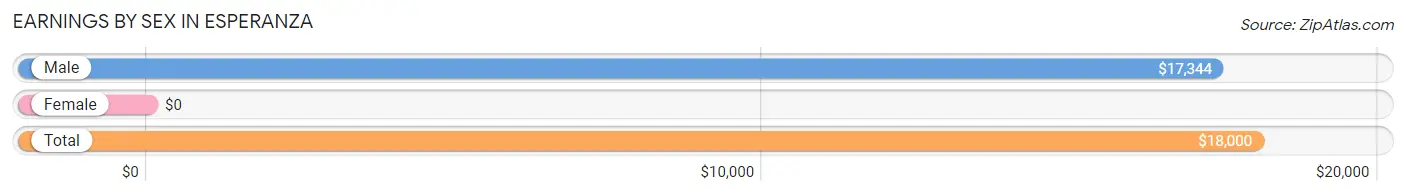
Earnings by Sex in Esperanza
| Sex | Number | Average Earnings |
| Male | 184 (82.1%) | $17,344 |
| Female | 40 (17.9%) | $0 |
| Total | 224 (100.0%) | $18,000 |
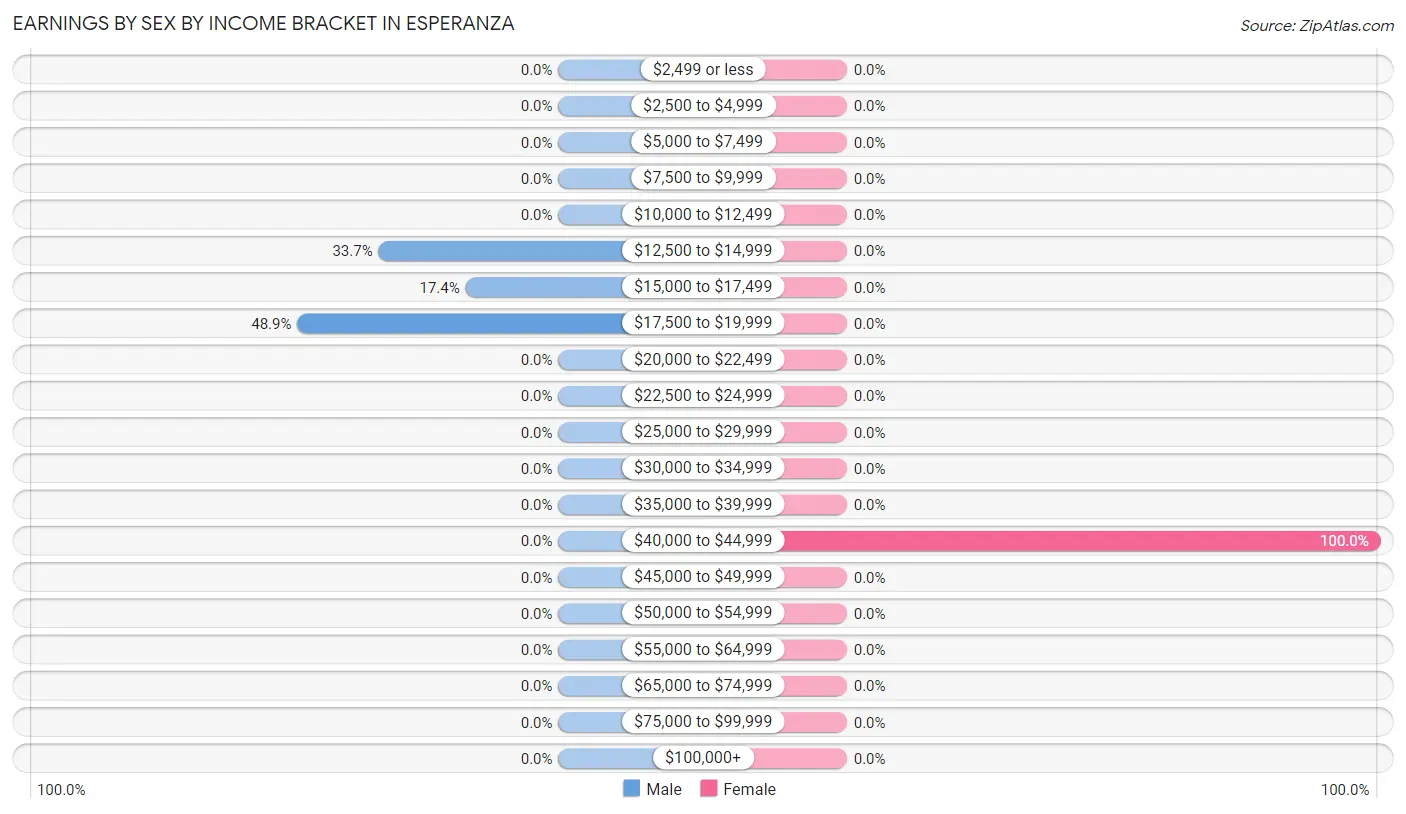
Earnings by Sex by Income Bracket in Esperanza
The most common earnings brackets in Esperanza are $17,500 to $19,999 for men (90 | 48.9%) and $40,000 to $44,999 for women (40 | 100.0%).
| Income | Male | Female |
| $2,499 or less | 0 (0.0%) | 0 (0.0%) |
| $2,500 to $4,999 | 0 (0.0%) | 0 (0.0%) |
| $5,000 to $7,499 | 0 (0.0%) | 0 (0.0%) |
| $7,500 to $9,999 | 0 (0.0%) | 0 (0.0%) |
| $10,000 to $12,499 | 0 (0.0%) | 0 (0.0%) |
| $12,500 to $14,999 | 62 (33.7%) | 0 (0.0%) |
| $15,000 to $17,499 | 32 (17.4%) | 0 (0.0%) |
| $17,500 to $19,999 | 90 (48.9%) | 0 (0.0%) |
| $20,000 to $22,499 | 0 (0.0%) | 0 (0.0%) |
| $22,500 to $24,999 | 0 (0.0%) | 0 (0.0%) |
| $25,000 to $29,999 | 0 (0.0%) | 0 (0.0%) |
| $30,000 to $34,999 | 0 (0.0%) | 0 (0.0%) |
| $35,000 to $39,999 | 0 (0.0%) | 0 (0.0%) |
| $40,000 to $44,999 | 0 (0.0%) | 40 (100.0%) |
| $45,000 to $49,999 | 0 (0.0%) | 0 (0.0%) |
| $50,000 to $54,999 | 0 (0.0%) | 0 (0.0%) |
| $55,000 to $64,999 | 0 (0.0%) | 0 (0.0%) |
| $65,000 to $74,999 | 0 (0.0%) | 0 (0.0%) |
| $75,000 to $99,999 | 0 (0.0%) | 0 (0.0%) |
| $100,000+ | 0 (0.0%) | 0 (0.0%) |
| Total | 184 (100.0%) | 40 (100.0%) |
Earnings by Sex by Educational Attainment in Esperanza
| Educational Attainment | Male Income | Female Income |
| Less than High School | - | - |
| High School Diploma | - | - |
| College or Associate's Degree | - | - |
| Bachelor's Degree | - | - |
| Graduate Degree | - | - |
| Total | $16,758 | $0 |
Family Income in Esperanza
Family Income Brackets in Esperanza
According to the Esperanza family income data, there are 75 families falling into the $25,000 to $34,999 income range, which is the most common income bracket and makes up 41.0% of all families.
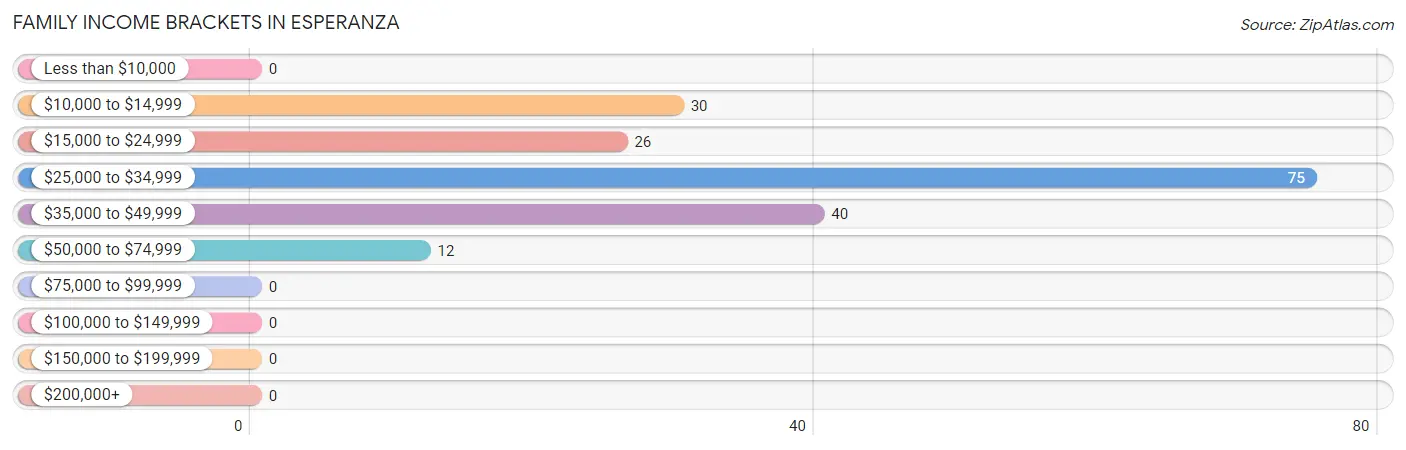
| Income Bracket | # Families | % Families |
| Less than $10,000 | 0 | 0.0% |
| $10,000 to $14,999 | 30 | 16.4% |
| $15,000 to $24,999 | 26 | 14.2% |
| $25,000 to $34,999 | 75 | 41.0% |
| $35,000 to $49,999 | 40 | 21.9% |
| $50,000 to $74,999 | 12 | 6.6% |
| $75,000 to $99,999 | 0 | 0.0% |
| $100,000 to $149,999 | 0 | 0.0% |
| $150,000 to $199,999 | 0 | 0.0% |
| $200,000+ | 0 | 0.0% |
Family Income by Famaliy Size in Esperanza
2-person families (153 | 83.6%) account for the highest median family income in Esperanza with $33,668 per family, while 2-person families (153 | 83.6%) have the highest median income of $16,834 per family member.
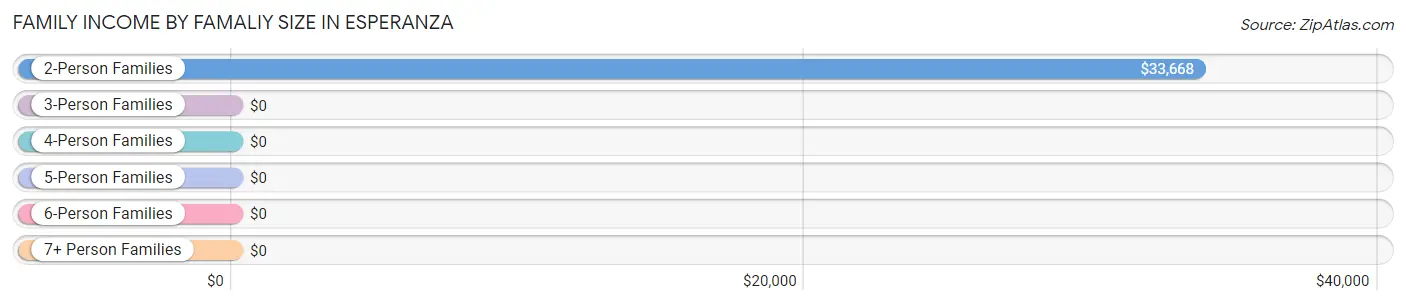
| Income Bracket | # Families | Median Income |
| 2-Person Families | 153 (83.6%) | $33,668 |
| 3-Person Families | 0 (0.0%) | $0 |
| 4-Person Families | 0 (0.0%) | $0 |
| 5-Person Families | 30 (16.4%) | $0 |
| 6-Person Families | 0 (0.0%) | $0 |
| 7+ Person Families | 0 (0.0%) | $0 |
| Total | 183 (100.0%) | $32,853 |
Family Income by Number of Earners in Esperanza
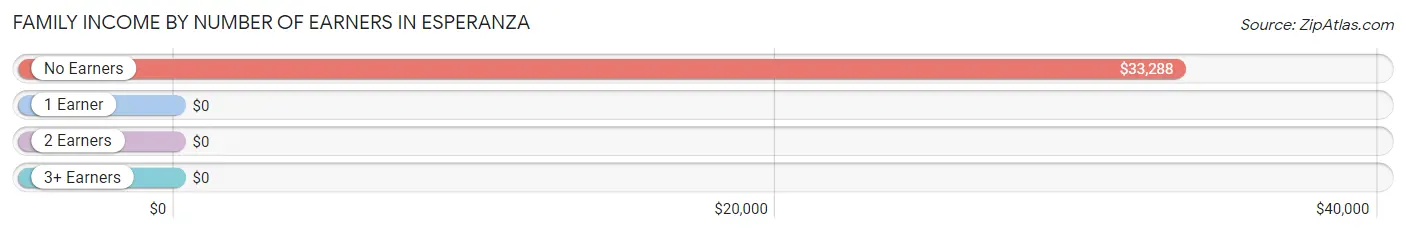
| Number of Earners | # Families | Median Income |
| No Earners | 87 (47.5%) | $33,288 |
| 1 Earner | 96 (52.5%) | $0 |
| 2 Earners | 0 (0.0%) | $0 |
| 3+ Earners | 0 (0.0%) | $0 |
| Total | 183 (100.0%) | $32,853 |
Household Income in Esperanza
Household Income Brackets in Esperanza
With 75 households falling in the category, the $25,000 to $34,999 income range is the most frequent in Esperanza, accounting for 30.0% of all households.
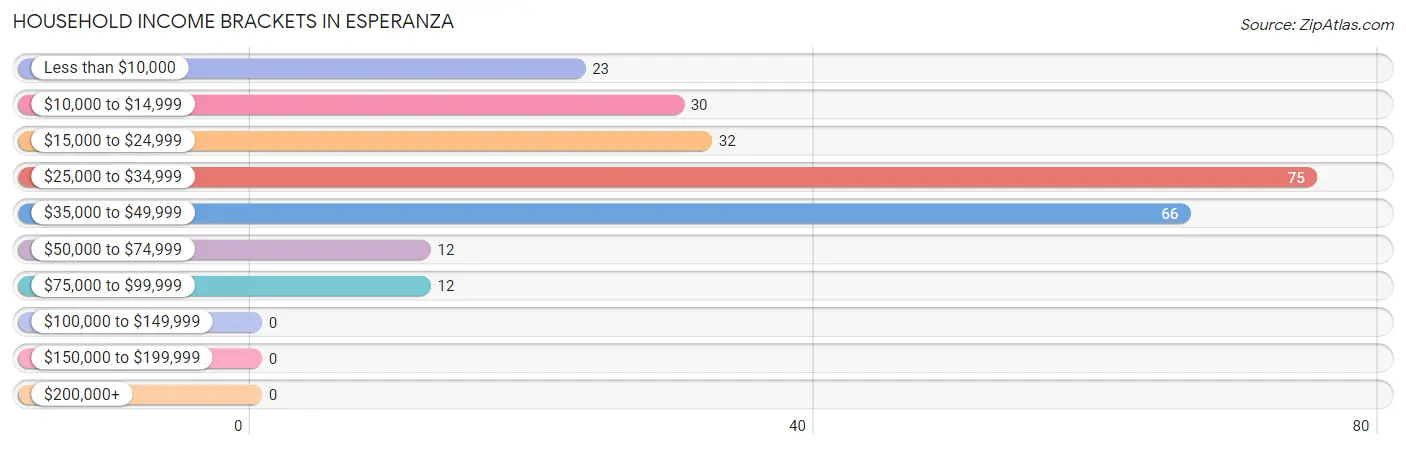
| Income Bracket | # Households | % Households |
| Less than $10,000 | 23 | 9.2% |
| $10,000 to $14,999 | 30 | 12.0% |
| $15,000 to $24,999 | 32 | 12.8% |
| $25,000 to $34,999 | 75 | 30.0% |
| $35,000 to $49,999 | 66 | 26.4% |
| $50,000 to $74,999 | 12 | 4.8% |
| $75,000 to $99,999 | 12 | 4.8% |
| $100,000 to $149,999 | 0 | 0.0% |
| $150,000 to $199,999 | 0 | 0.0% |
| $200,000+ | 0 | 0.0% |
Household Income by Householder Age in Esperanza
The median household income in Esperanza is $33,098, with the highest median household income of $33,614 found in the 65+ years age bracket for the primary householder. A total of 99 households (39.6%) fall into this category.
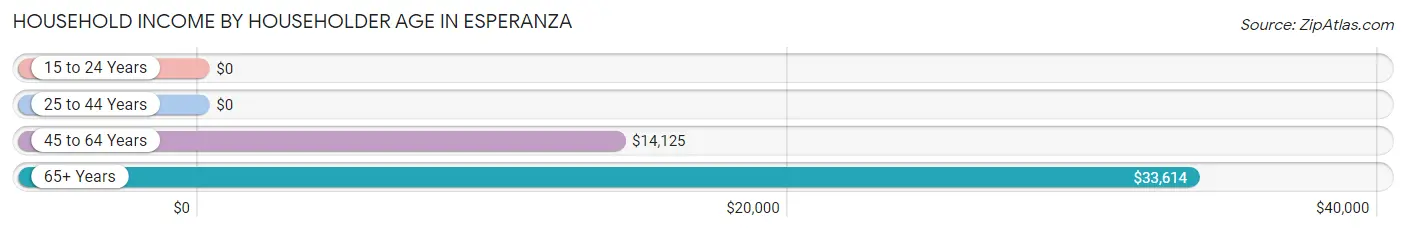
| Income Bracket | # Households | Median Income |
| 15 to 24 Years | 0 (0.0%) | $0 |
| 25 to 44 Years | 66 (26.4%) | $0 |
| 45 to 64 Years | 85 (34.0%) | $14,125 |
| 65+ Years | 99 (39.6%) | $33,614 |
| Total | 250 (100.0%) | $33,098 |
Poverty in Esperanza
Income Below Poverty by Sex and Age in Esperanza
With 48.1% poverty level for males and 51.0% for females among the residents of Esperanza, 18 to 24 year old males and 12 to 14 year old females are the most vulnerable to poverty, with 115 males (100.0%) and 41 females (100.0%) in their respective age groups living below the poverty level.
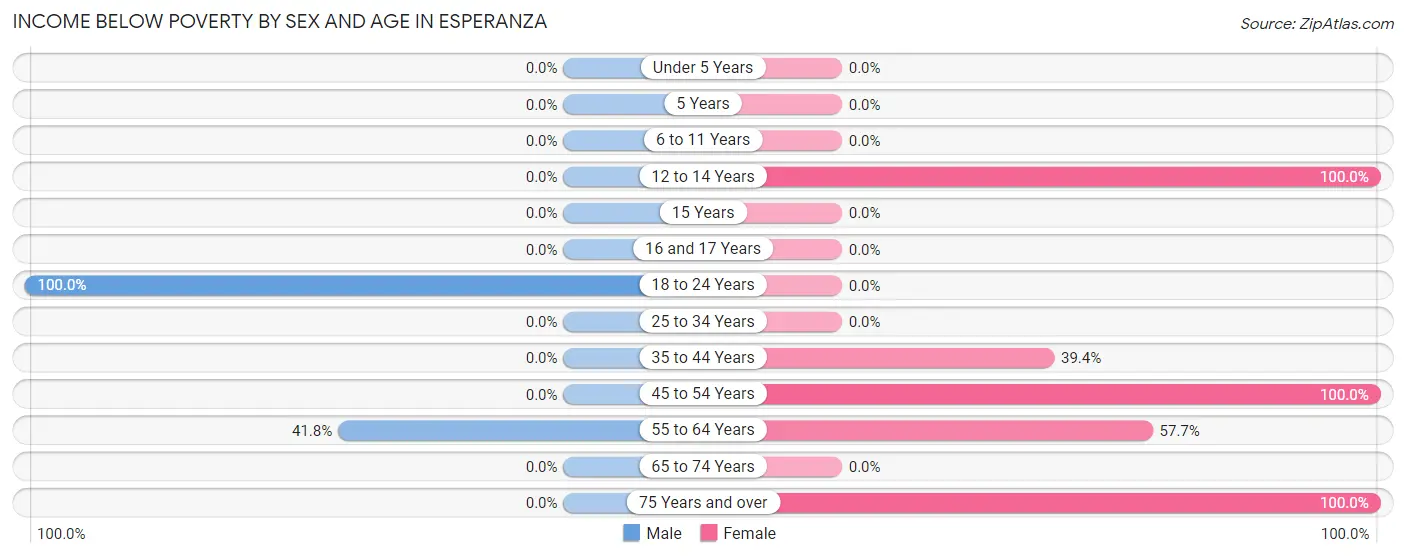
| Age Bracket | Male | Female |
| Under 5 Years | 0 (0.0%) | 0 (0.0%) |
| 5 Years | 0 (0.0%) | 0 (0.0%) |
| 6 to 11 Years | 0 (0.0%) | 0 (0.0%) |
| 12 to 14 Years | 0 (0.0%) | 41 (100.0%) |
| 15 Years | 0 (0.0%) | 0 (0.0%) |
| 16 and 17 Years | 0 (0.0%) | 0 (0.0%) |
| 18 to 24 Years | 115 (100.0%) | 0 (0.0%) |
| 25 to 34 Years | 0 (0.0%) | 0 (0.0%) |
| 35 to 44 Years | 0 (0.0%) | 26 (39.4%) |
| 45 to 54 Years | 0 (0.0%) | 91 (100.0%) |
| 55 to 64 Years | 23 (41.8%) | 30 (57.7%) |
| 65 to 74 Years | 0 (0.0%) | 0 (0.0%) |
| 75 Years and over | 0 (0.0%) | 135 (100.0%) |
| Total | 138 (48.1%) | 323 (51.0%) |
Income Above Poverty by Sex and Age in Esperanza
According to the poverty statistics in Esperanza, males aged 25 to 34 years and females aged 6 to 11 years are the age groups that are most secure financially, with 100.0% of males and 100.0% of females in these age groups living above the poverty line.
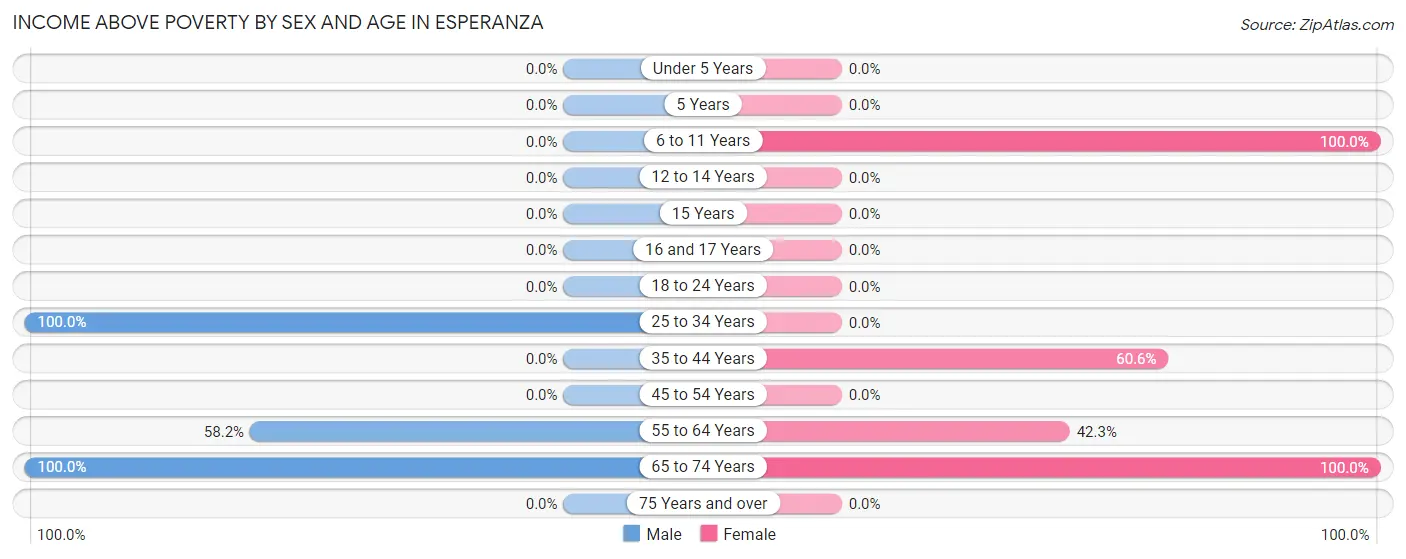
| Age Bracket | Male | Female |
| Under 5 Years | 0 (0.0%) | 0 (0.0%) |
| 5 Years | 0 (0.0%) | 0 (0.0%) |
| 6 to 11 Years | 0 (0.0%) | 86 (100.0%) |
| 12 to 14 Years | 0 (0.0%) | 0 (0.0%) |
| 15 Years | 0 (0.0%) | 0 (0.0%) |
| 16 and 17 Years | 0 (0.0%) | 0 (0.0%) |
| 18 to 24 Years | 0 (0.0%) | 0 (0.0%) |
| 25 to 34 Years | 25 (100.0%) | 0 (0.0%) |
| 35 to 44 Years | 0 (0.0%) | 40 (60.6%) |
| 45 to 54 Years | 0 (0.0%) | 0 (0.0%) |
| 55 to 64 Years | 32 (58.2%) | 22 (42.3%) |
| 65 to 74 Years | 92 (100.0%) | 162 (100.0%) |
| 75 Years and over | 0 (0.0%) | 0 (0.0%) |
| Total | 149 (51.9%) | 310 (49.0%) |
Income Below Poverty Among Married-Couple Families in Esperanza
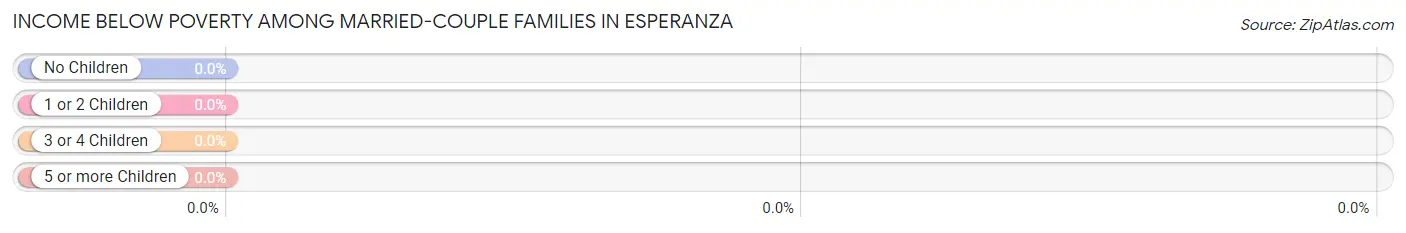
| Children | Above Poverty | Below Poverty |
| No Children | 87 (100.0%) | 0 (0.0%) |
| 1 or 2 Children | 0 (0.0%) | 0 (0.0%) |
| 3 or 4 Children | 0 (0.0%) | 0 (0.0%) |
| 5 or more Children | 0 (0.0%) | 0 (0.0%) |
| Total | 87 (100.0%) | 0 (0.0%) |
Income Below Poverty Among Single-Parent Households in Esperanza
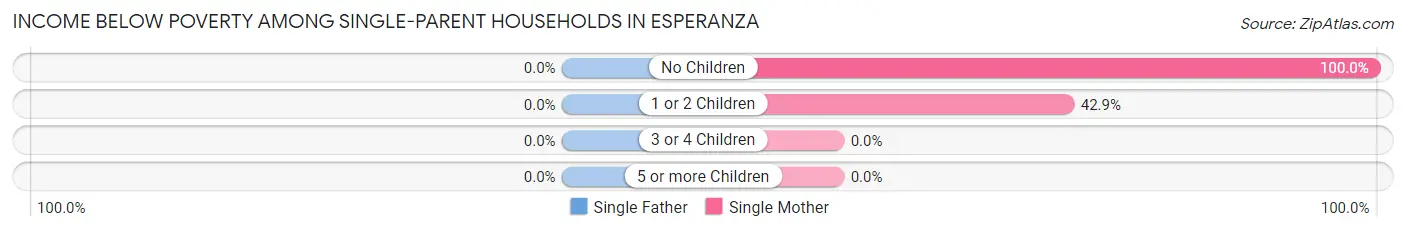
| Children | Single Father | Single Mother |
| No Children | 0 (0.0%) | 26 (100.0%) |
| 1 or 2 Children | 0 (0.0%) | 30 (42.9%) |
| 3 or 4 Children | 0 (0.0%) | 0 (0.0%) |
| 5 or more Children | 0 (0.0%) | 0 (0.0%) |
| Total | 0 (0.0%) | 56 (58.3%) |
Income Below Poverty Among Married-Couple vs Single-Parent Households in Esperanza
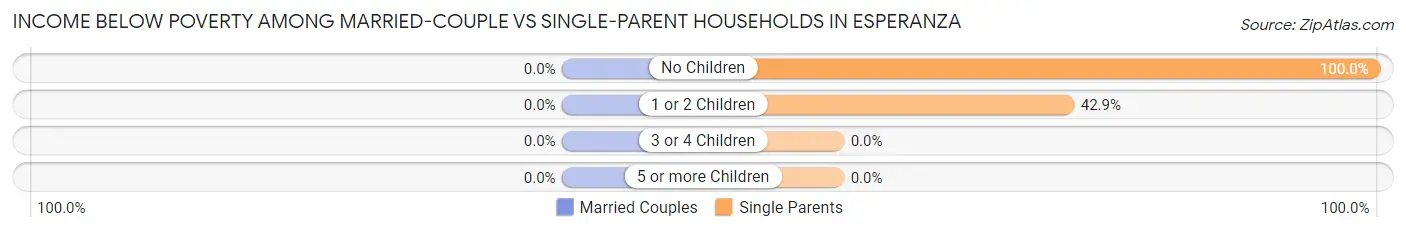
| Children | Married-Couple Families | Single-Parent Households |
| No Children | 0 (0.0%) | 26 (100.0%) |
| 1 or 2 Children | 0 (0.0%) | 30 (42.9%) |
| 3 or 4 Children | 0 (0.0%) | 0 (0.0%) |
| 5 or more Children | 0 (0.0%) | 0 (0.0%) |
| Total | 0 (0.0%) | 56 (58.3%) |
Race in Esperanza
The most populous races in Esperanza are Hispanic or Latino (920 | 100.0%), Some other Race (533 | 57.9%), and White / Caucasian (341 | 37.1%).
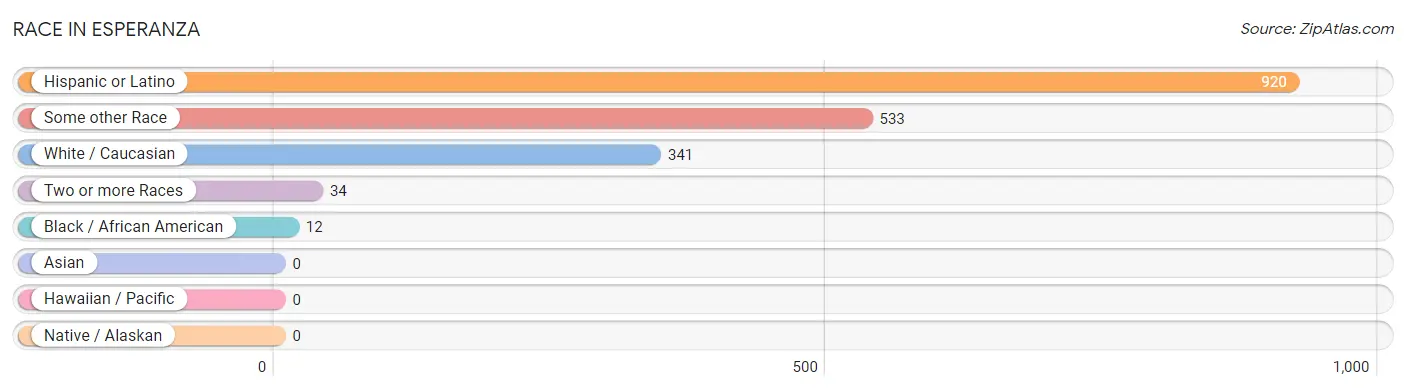
| Race | # Population | % Population |
| Asian | 0 | 0.0% |
| Black / African American | 12 | 1.3% |
| Hawaiian / Pacific | 0 | 0.0% |
| Hispanic or Latino | 920 | 100.0% |
| Native / Alaskan | 0 | 0.0% |
| White / Caucasian | 341 | 37.1% |
| Two or more Races | 34 | 3.7% |
| Some other Race | 533 | 57.9% |
| Total | 920 | 100.0% |
Ancestry in Esperanza
The most populous ancestries reported in Esperanza are , and Puerto Rican (920 | 100.0%), together accounting for 100.0% of all Esperanza residents.

| Ancestry | # Population | % Population |
| Puerto Rican | 920 | 100.0% | View All 1 Rows |
Immigrants in Esperanza

| Immigration Origin | # Population | % Population | View All 0 Rows |
Sex and Age in Esperanza
Sex and Age in Esperanza
The most populous age groups in Esperanza are 20 to 24 Years (115 | 40.1%) for men and 80 to 84 Years (135 | 21.3%) for women.
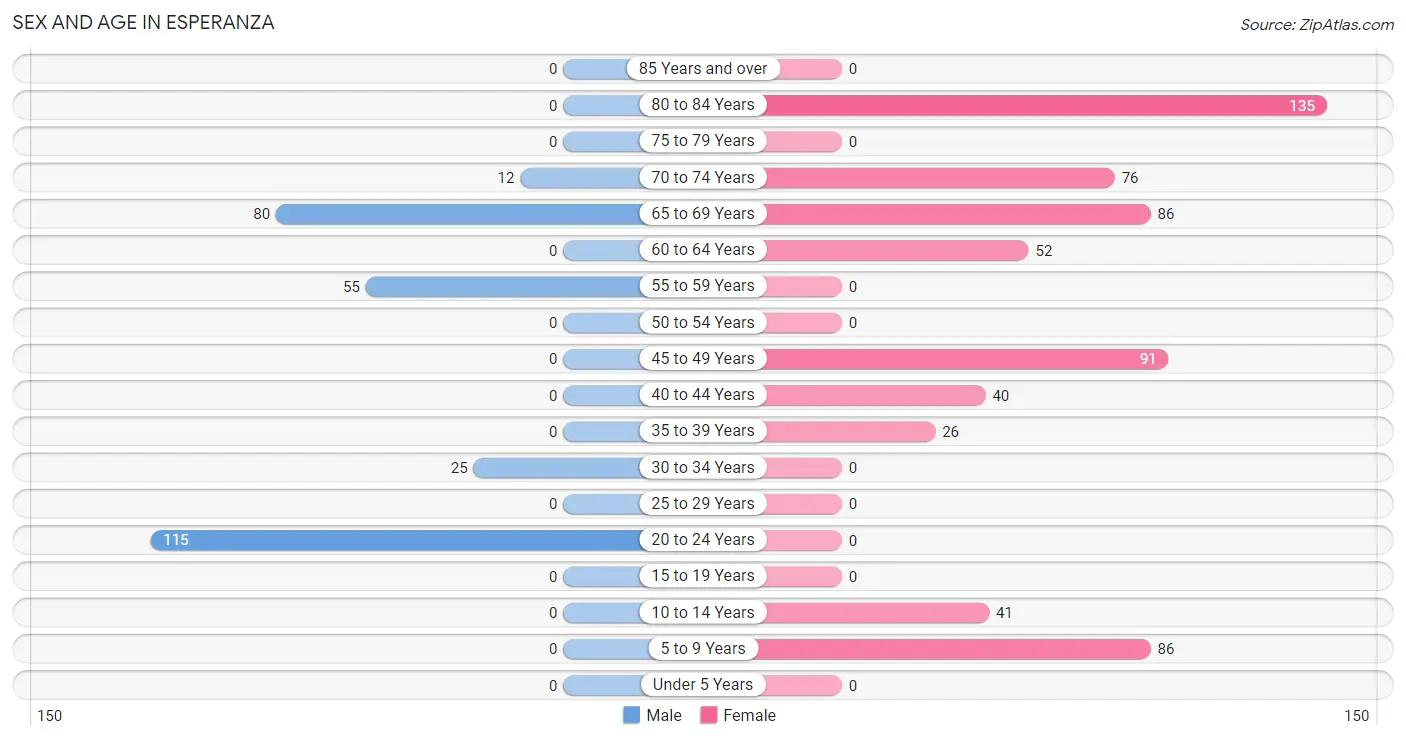
| Age Bracket | Male | Female |
| Under 5 Years | 0 (0.0%) | 0 (0.0%) |
| 5 to 9 Years | 0 (0.0%) | 86 (13.6%) |
| 10 to 14 Years | 0 (0.0%) | 41 (6.5%) |
| 15 to 19 Years | 0 (0.0%) | 0 (0.0%) |
| 20 to 24 Years | 115 (40.1%) | 0 (0.0%) |
| 25 to 29 Years | 0 (0.0%) | 0 (0.0%) |
| 30 to 34 Years | 25 (8.7%) | 0 (0.0%) |
| 35 to 39 Years | 0 (0.0%) | 26 (4.1%) |
| 40 to 44 Years | 0 (0.0%) | 40 (6.3%) |
| 45 to 49 Years | 0 (0.0%) | 91 (14.4%) |
| 50 to 54 Years | 0 (0.0%) | 0 (0.0%) |
| 55 to 59 Years | 55 (19.2%) | 0 (0.0%) |
| 60 to 64 Years | 0 (0.0%) | 52 (8.2%) |
| 65 to 69 Years | 80 (27.9%) | 86 (13.6%) |
| 70 to 74 Years | 12 (4.2%) | 76 (12.0%) |
| 75 to 79 Years | 0 (0.0%) | 0 (0.0%) |
| 80 to 84 Years | 0 (0.0%) | 135 (21.3%) |
| 85 Years and over | 0 (0.0%) | 0 (0.0%) |
| Total | 287 (100.0%) | 633 (100.0%) |
Families and Households in Esperanza
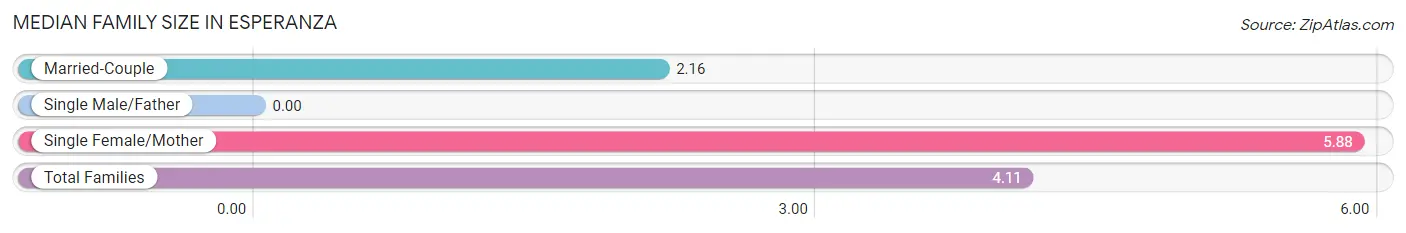
Median Family Size in Esperanza
| Family Type | # Families | Family Size |
| Married-Couple | 87 (47.5%) | 2.16 |
| Single Male/Father | 0 (0.0%) | - |
| Single Female/Mother | 96 (52.5%) | 5.88 |
| Total Families | 183 (100.0%) | 4.11 |
Median Household Size in Esperanza
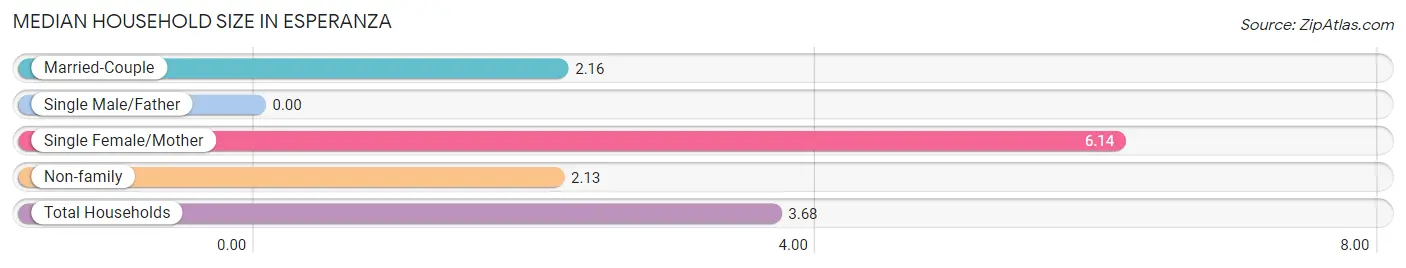
| Household Type | # Households | Household Size |
| Married-Couple | 87 (34.8%) | 2.16 |
| Single Male/Father | 0 (0.0%) | - |
| Single Female/Mother | 96 (38.4%) | 6.14 |
| Non-family | 67 (26.8%) | 2.13 |
| Total Households | 250 (100.0%) | 3.68 |
Household Size by Marriage Status in Esperanza
Out of a total of 250 households in Esperanza, 183 (73.2%) are family households, while 67 (26.8%) are nonfamily households. The most numerous type of family households are 2-person households, comprising 127, and the most common type of nonfamily households are 1-person households, comprising 55.
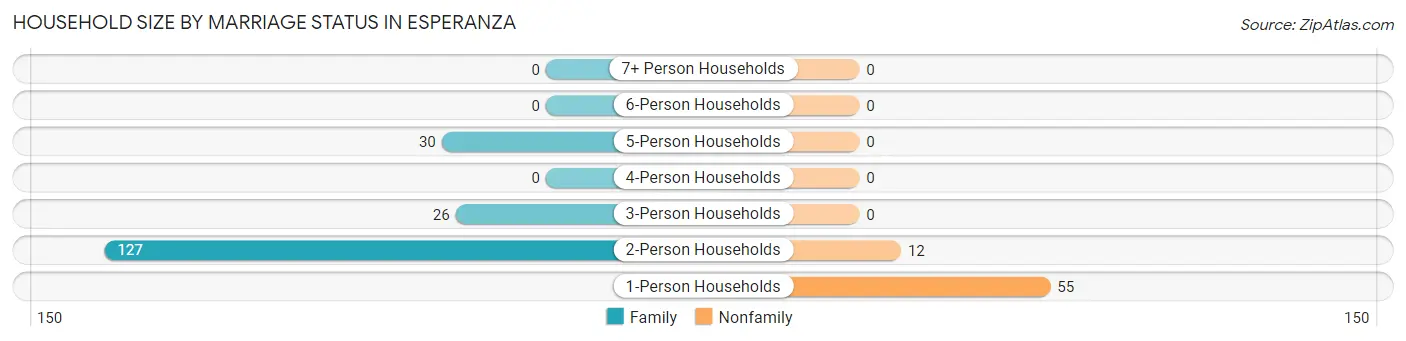
| Household Size | Family Households | Nonfamily Households |
| 1-Person Households | - | 55 (22.0%) |
| 2-Person Households | 127 (50.8%) | 12 (4.8%) |
| 3-Person Households | 26 (10.4%) | 0 (0.0%) |
| 4-Person Households | 0 (0.0%) | 0 (0.0%) |
| 5-Person Households | 30 (12.0%) | 0 (0.0%) |
| 6-Person Households | 0 (0.0%) | 0 (0.0%) |
| 7+ Person Households | 0 (0.0%) | 0 (0.0%) |
| Total | 183 (73.2%) | 67 (26.8%) |
Female Fertility in Esperanza
Fertility by Age in Esperanza
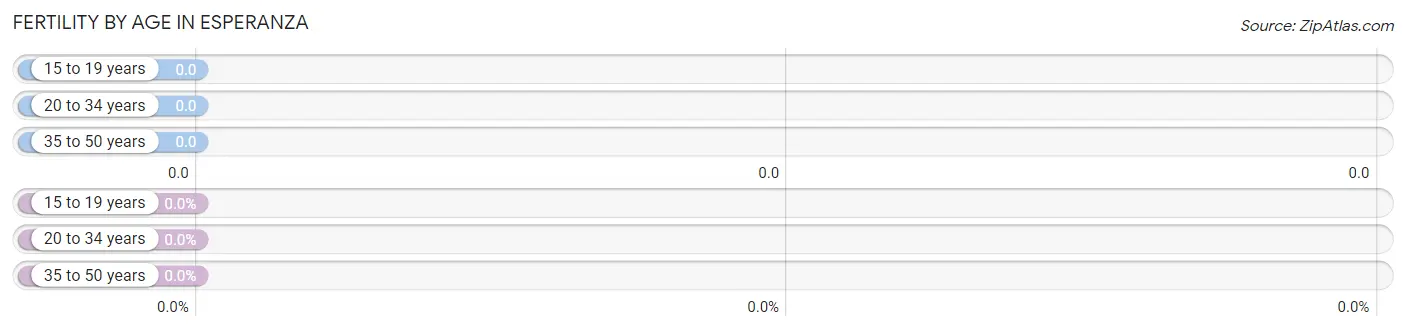
| Age Bracket | Women with Births | Births / 1,000 Women |
| 15 to 19 years | 0 (0.0%) | 0.0 |
| 20 to 34 years | 0 (0.0%) | 0.0 |
| 35 to 50 years | 0 (0.0%) | 0.0 |
| Total | 0 (0.0%) | 0.0 |
Fertility by Age by Marriage Status in Esperanza
| Age Bracket | Married | Unmarried |
| 15 to 19 years | 0 (0.0%) | 0 (0.0%) |
| 20 to 34 years | 0 (0.0%) | 0 (0.0%) |
| 35 to 50 years | 0 (0.0%) | 0 (0.0%) |
| Total | 0 (0.0%) | 0 (0.0%) |
Fertility by Education in Esperanza
| Educational Attainment | Women with Births | Births / 1,000 Women |
| Less than High School | 0 (0.0%) | 0.0 |
| High School Diploma | 0 (0.0%) | 0.0 |
| College or Associate's Degree | 0 (0.0%) | 0.0 |
| Bachelor's Degree | 0 (0.0%) | 0.0 |
| Graduate Degree | 0 (0.0%) | 0.0 |
| Total | 0 (0.0%) | 0.0 |
Fertility by Education by Marriage Status in Esperanza
| Educational Attainment | Married | Unmarried |
| Less than High School | 0 (0.0%) | 0 (0.0%) |
| High School Diploma | 0 (0.0%) | 0 (0.0%) |
| College or Associate's Degree | 0 (0.0%) | 0 (0.0%) |
| Bachelor's Degree | 0 (0.0%) | 0 (0.0%) |
| Graduate Degree | 0 (0.0%) | 0 (0.0%) |
| Total | 0 (0.0%) | 0 (0.0%) |
Employment Characteristics in Esperanza
Employment by Class of Employer in Esperanza
Among the 159 employed individuals in Esperanza, local government employees (75 | 47.2%), state government employees (40 | 25.2%), and self-employed (not incorporated) (32 | 20.1%) make up the most common classes of employment.
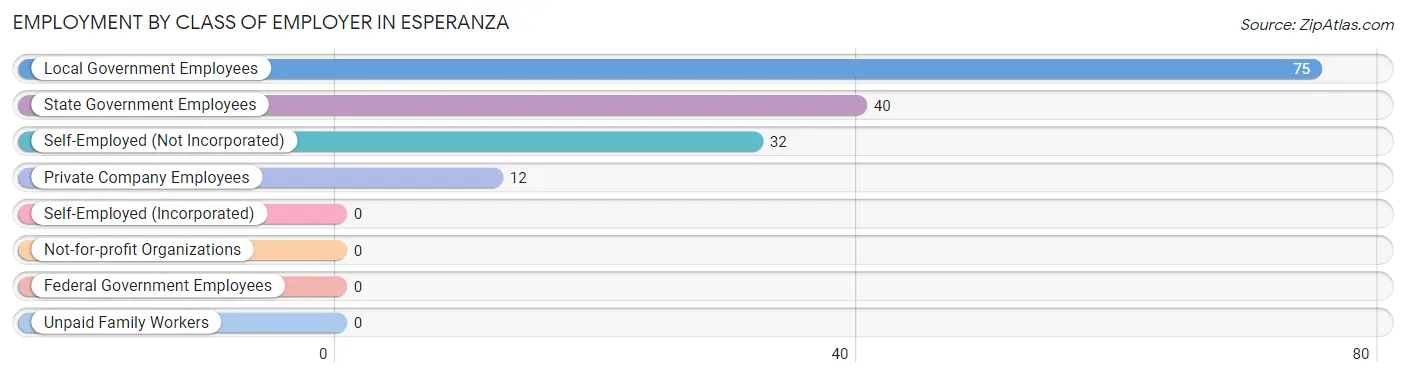
| Employer Class | # Employees | % Employees |
| Private Company Employees | 12 | 7.5% |
| Self-Employed (Incorporated) | 0 | 0.0% |
| Self-Employed (Not Incorporated) | 32 | 20.1% |
| Not-for-profit Organizations | 0 | 0.0% |
| Local Government Employees | 75 | 47.2% |
| State Government Employees | 40 | 25.2% |
| Federal Government Employees | 0 | 0.0% |
| Unpaid Family Workers | 0 | 0.0% |
| Total | 159 | 100.0% |
Employment Status by Age in Esperanza
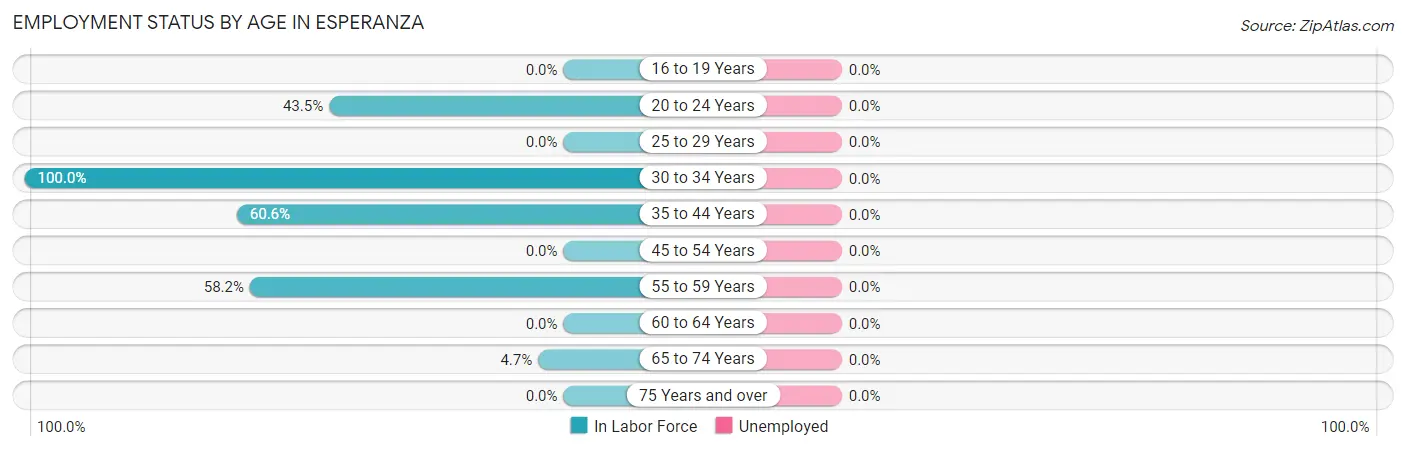
| Age Bracket | In Labor Force | Unemployed |
| 16 to 19 Years | 0 (0.0%) | 0 (0.0%) |
| 20 to 24 Years | 50 (43.5%) | 0 (0.0%) |
| 25 to 29 Years | 0 (0.0%) | 0 (0.0%) |
| 30 to 34 Years | 25 (100.0%) | 0 (0.0%) |
| 35 to 44 Years | 40 (60.6%) | 0 (0.0%) |
| 45 to 54 Years | 0 (0.0%) | 0 (0.0%) |
| 55 to 59 Years | 32 (58.2%) | 0 (0.0%) |
| 60 to 64 Years | 0 (0.0%) | 0 (0.0%) |
| 65 to 74 Years | 12 (4.7%) | 0 (0.0%) |
| 75 Years and over | 0 (0.0%) | 0 (0.0%) |
| Total | 159 (20.1%) | 0 (0.0%) |
Employment Status by Educational Attainment in Esperanza
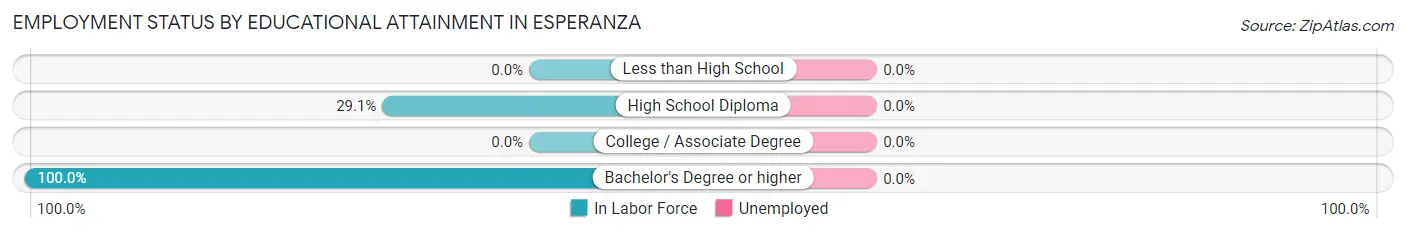
| Educational Attainment | In Labor Force | Unemployed |
| Less than High School | 0 (0.0%) | 0 (0.0%) |
| High School Diploma | 57 (29.1%) | 0 (0.0%) |
| College / Associate Degree | 0 (0.0%) | 0 (0.0%) |
| Bachelor's Degree or higher | 40 (100.0%) | 0 (0.0%) |
| Total | 97 (33.6%) | 0 (0.0%) |
Employment Occupations by Sex in Esperanza
Management, Business, Science and Arts Occupations
The most common Management, Business, Science and Arts occupations in Esperanza are , and Business & Financial (40 | 25.2%).
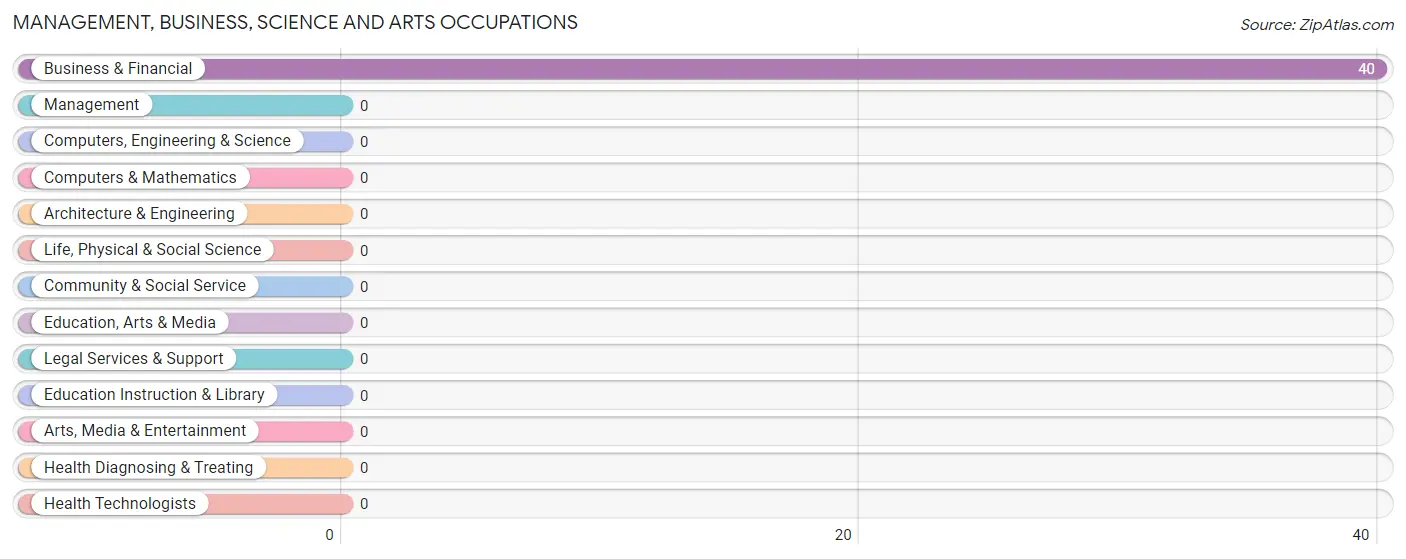
Management, Business, Science and Arts Occupations by Sex
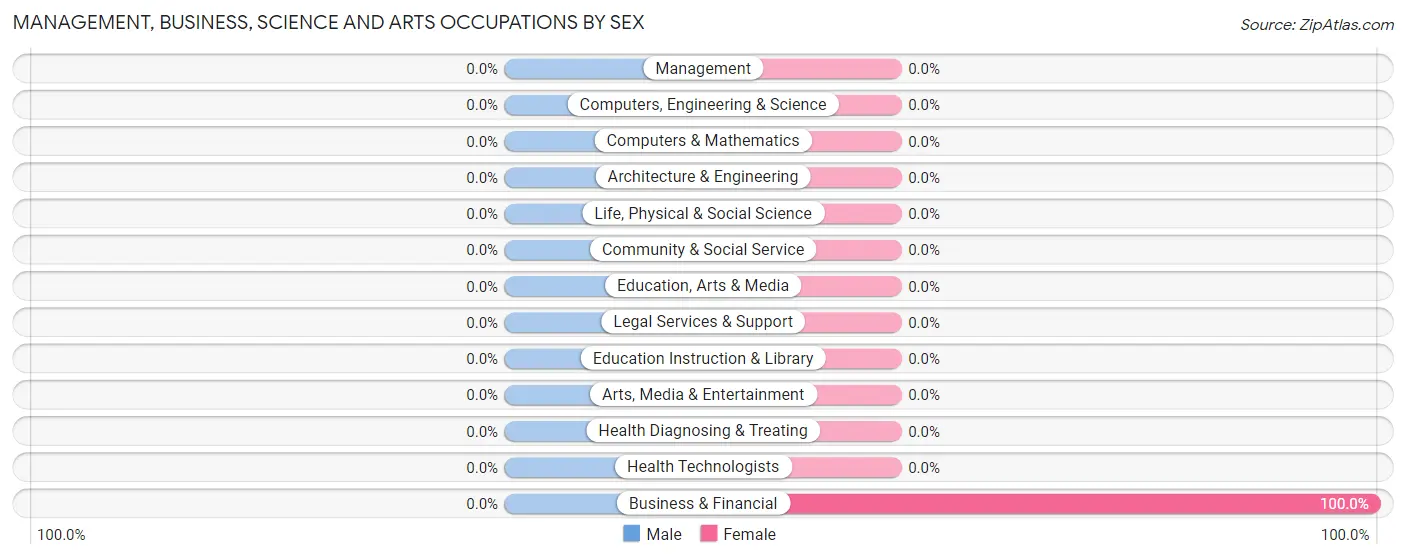
| Occupation | Male | Female |
| Management | 0 (0.0%) | 0 (0.0%) |
| Business & Financial | 0 (0.0%) | 40 (100.0%) |
| Computers, Engineering & Science | 0 (0.0%) | 0 (0.0%) |
| Computers & Mathematics | 0 (0.0%) | 0 (0.0%) |
| Architecture & Engineering | 0 (0.0%) | 0 (0.0%) |
| Life, Physical & Social Science | 0 (0.0%) | 0 (0.0%) |
| Community & Social Service | 0 (0.0%) | 0 (0.0%) |
| Education, Arts & Media | 0 (0.0%) | 0 (0.0%) |
| Legal Services & Support | 0 (0.0%) | 0 (0.0%) |
| Education Instruction & Library | 0 (0.0%) | 0 (0.0%) |
| Arts, Media & Entertainment | 0 (0.0%) | 0 (0.0%) |
| Health Diagnosing & Treating | 0 (0.0%) | 0 (0.0%) |
| Health Technologists | 0 (0.0%) | 0 (0.0%) |
| Total (Category) | 0 (0.0%) | 40 (100.0%) |
| Total (Overall) | 119 (74.8%) | 40 (25.2%) |
Services Occupations
The most common Services occupations in Esperanza are Personal Care & Service (25 | 15.7%), Security & Protection (12 | 7.5%), and Firefighting & Prevention (12 | 7.5%).
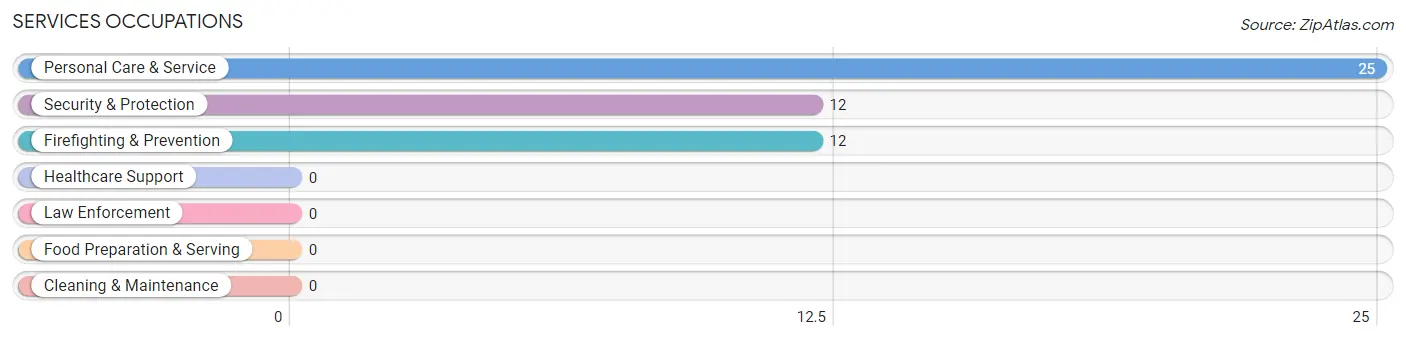
Services Occupations by Sex
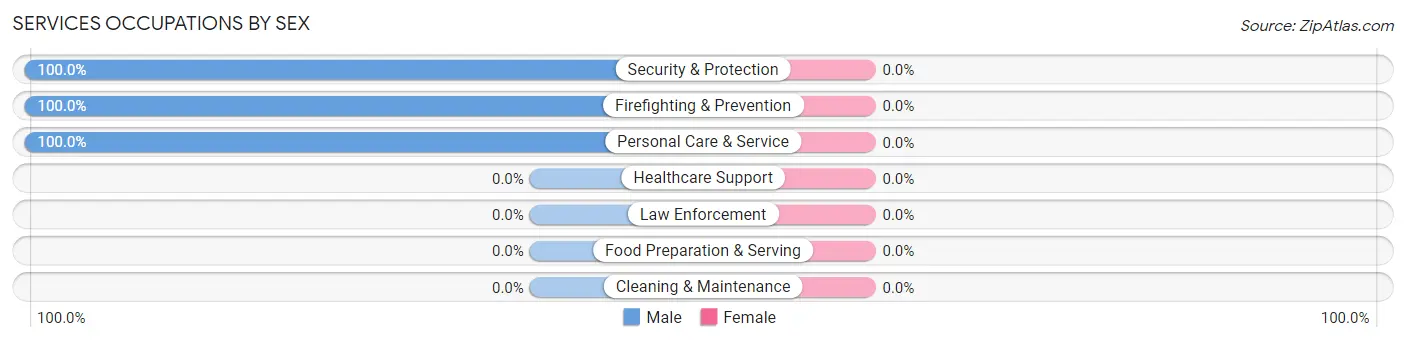
| Occupation | Male | Female |
| Healthcare Support | 0 (0.0%) | 0 (0.0%) |
| Security & Protection | 12 (100.0%) | 0 (0.0%) |
| Firefighting & Prevention | 12 (100.0%) | 0 (0.0%) |
| Law Enforcement | 0 (0.0%) | 0 (0.0%) |
| Food Preparation & Serving | 0 (0.0%) | 0 (0.0%) |
| Cleaning & Maintenance | 0 (0.0%) | 0 (0.0%) |
| Personal Care & Service | 25 (100.0%) | 0 (0.0%) |
| Total (Category) | 37 (100.0%) | 0 (0.0%) |
| Total (Overall) | 119 (74.8%) | 40 (25.2%) |
Sales and Office Occupations
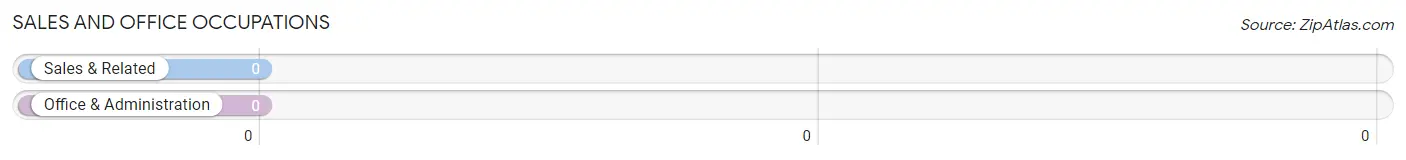
Sales and Office Occupations by Sex
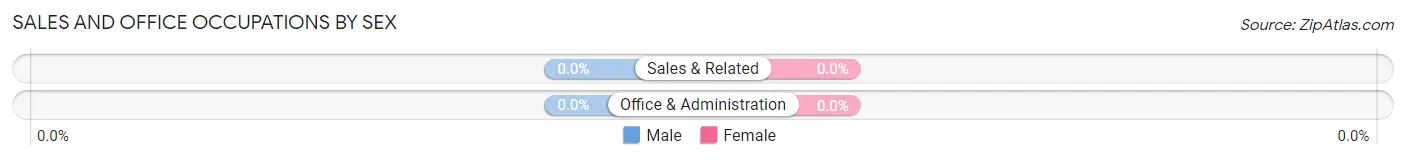
| Occupation | Male | Female |
| Sales & Related | 0 (0.0%) | 0 (0.0%) |
| Office & Administration | 0 (0.0%) | 0 (0.0%) |
| Total (Category) | 0 (0.0%) | 0 (0.0%) |
| Total (Overall) | 119 (74.8%) | 40 (25.2%) |
Natural Resources, Construction and Maintenance Occupations
The most common Natural Resources, Construction and Maintenance occupations in Esperanza are , and Construction & Extraction (50 | 31.5%).
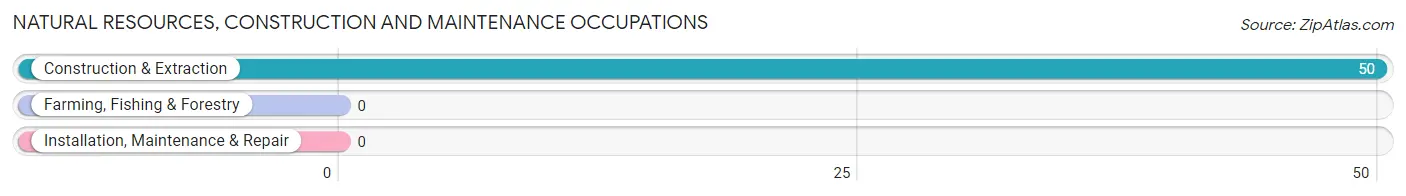
Natural Resources, Construction and Maintenance Occupations by Sex
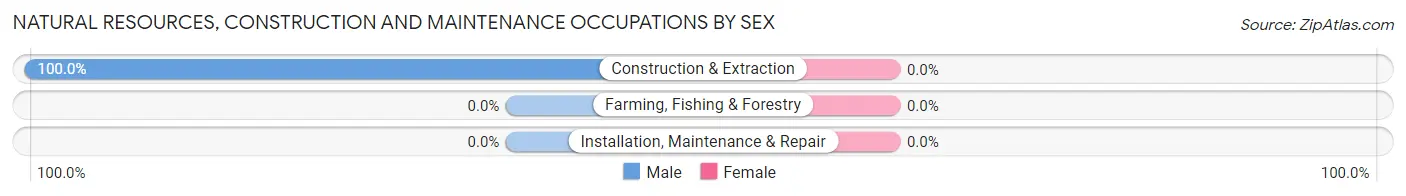
| Occupation | Male | Female |
| Farming, Fishing & Forestry | 0 (0.0%) | 0 (0.0%) |
| Construction & Extraction | 50 (100.0%) | 0 (0.0%) |
| Installation, Maintenance & Repair | 0 (0.0%) | 0 (0.0%) |
| Total (Category) | 50 (100.0%) | 0 (0.0%) |
| Total (Overall) | 119 (74.8%) | 40 (25.2%) |
Production, Transportation and Moving Occupations
The most common Production, Transportation and Moving occupations in Esperanza are , and Production (32 | 20.1%).
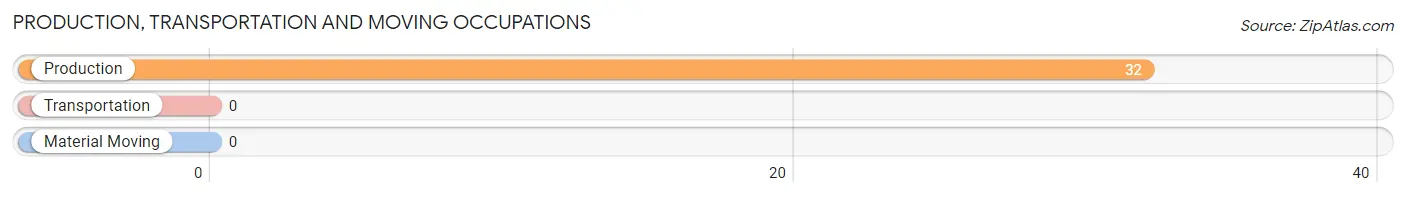
Production, Transportation and Moving Occupations by Sex
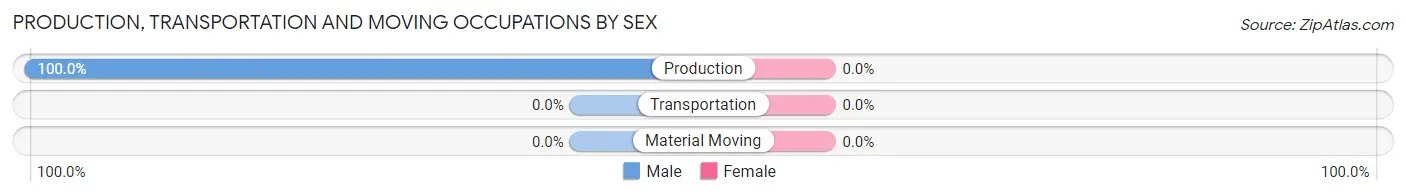
| Occupation | Male | Female |
| Production | 32 (100.0%) | 0 (0.0%) |
| Transportation | 0 (0.0%) | 0 (0.0%) |
| Material Moving | 0 (0.0%) | 0 (0.0%) |
| Total (Category) | 32 (100.0%) | 0 (0.0%) |
| Total (Overall) | 119 (74.8%) | 40 (25.2%) |
Employment Industries by Sex in Esperanza
Employment Industries in Esperanza
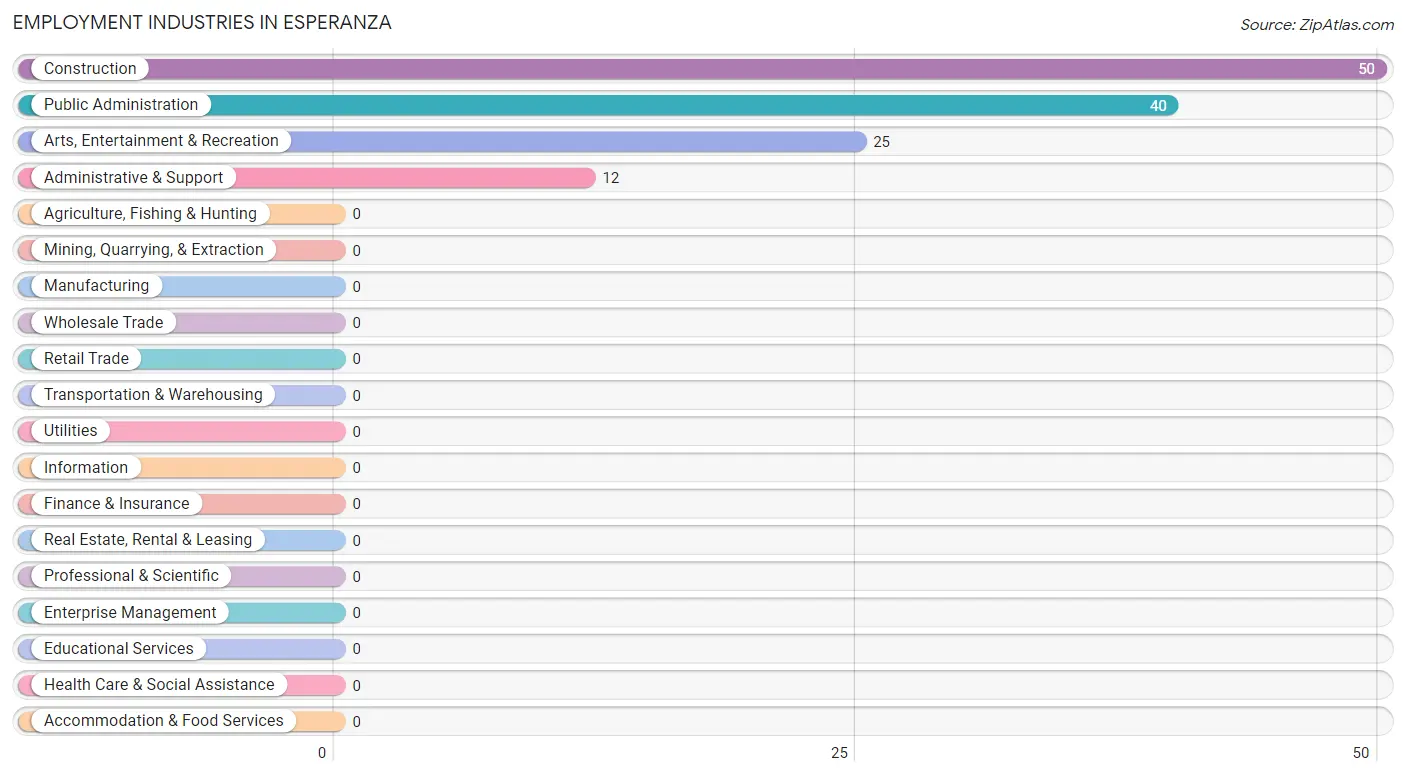
The major employment industries in Esperanza include Construction (50 | 31.5%), Public Administration (40 | 25.2%), Arts, Entertainment & Recreation (25 | 15.7%), and Administrative & Support (12 | 7.5%).
Employment Industries by Sex in Esperanza
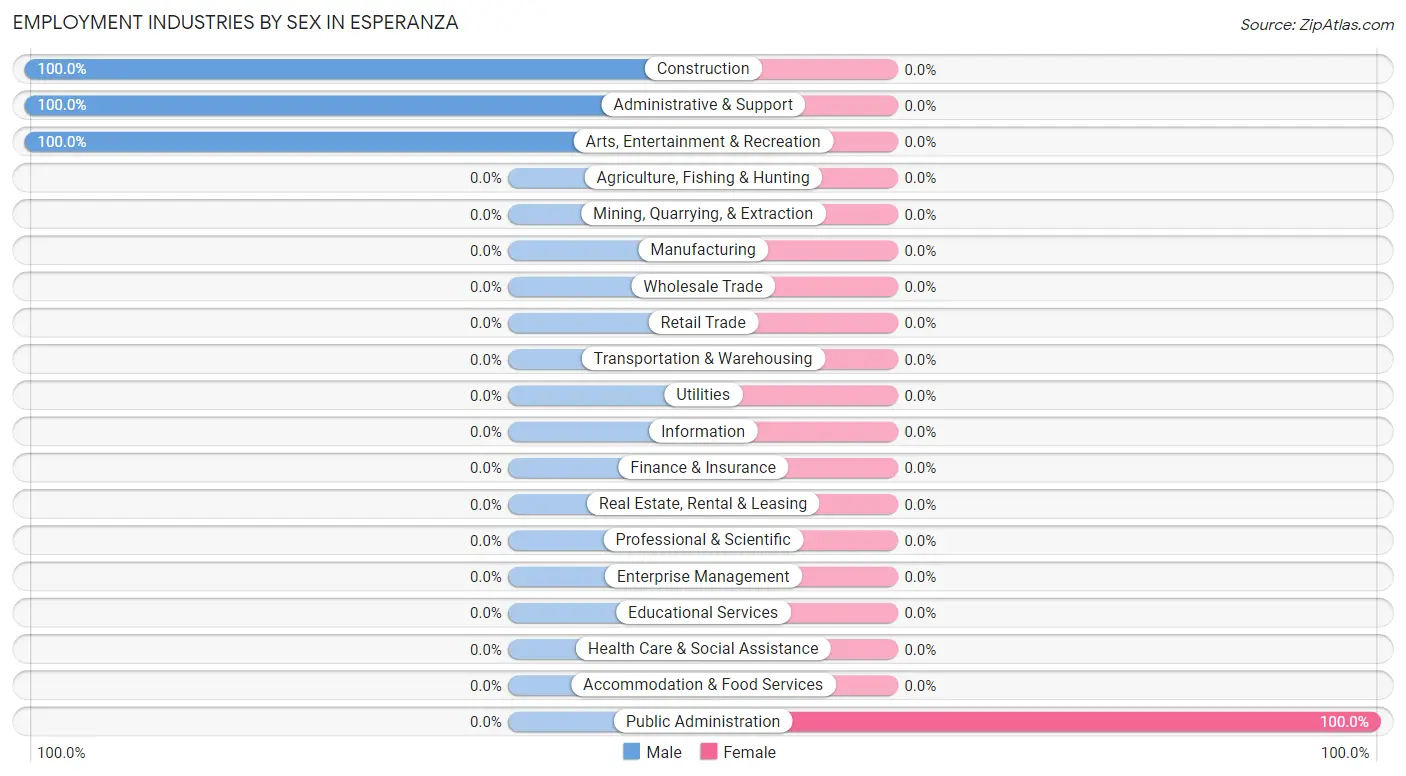
| Industry | Male | Female |
| Agriculture, Fishing & Hunting | 0 (0.0%) | 0 (0.0%) |
| Mining, Quarrying, & Extraction | 0 (0.0%) | 0 (0.0%) |
| Construction | 50 (100.0%) | 0 (0.0%) |
| Manufacturing | 0 (0.0%) | 0 (0.0%) |
| Wholesale Trade | 0 (0.0%) | 0 (0.0%) |
| Retail Trade | 0 (0.0%) | 0 (0.0%) |
| Transportation & Warehousing | 0 (0.0%) | 0 (0.0%) |
| Utilities | 0 (0.0%) | 0 (0.0%) |
| Information | 0 (0.0%) | 0 (0.0%) |
| Finance & Insurance | 0 (0.0%) | 0 (0.0%) |
| Real Estate, Rental & Leasing | 0 (0.0%) | 0 (0.0%) |
| Professional & Scientific | 0 (0.0%) | 0 (0.0%) |
| Enterprise Management | 0 (0.0%) | 0 (0.0%) |
| Administrative & Support | 12 (100.0%) | 0 (0.0%) |
| Educational Services | 0 (0.0%) | 0 (0.0%) |
| Health Care & Social Assistance | 0 (0.0%) | 0 (0.0%) |
| Arts, Entertainment & Recreation | 25 (100.0%) | 0 (0.0%) |
| Accommodation & Food Services | 0 (0.0%) | 0 (0.0%) |
| Public Administration | 0 (0.0%) | 40 (100.0%) |
| Total | 119 (74.8%) | 40 (25.2%) |
Education in Esperanza
School Enrollment in Esperanza
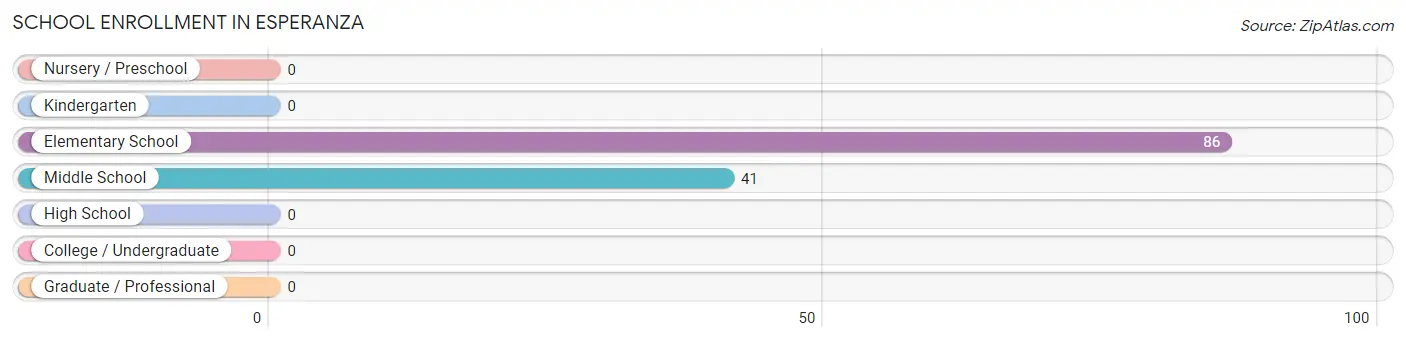
The most common levels of schooling among the 127 students in Esperanza are elementary school (86 | 67.7%), and middle school (41 | 32.3%).
| School Level | # Students | % Students |
| Nursery / Preschool | 0 | 0.0% |
| Kindergarten | 0 | 0.0% |
| Elementary School | 86 | 67.7% |
| Middle School | 41 | 32.3% |
| High School | 0 | 0.0% |
| College / Undergraduate | 0 | 0.0% |
| Graduate / Professional | 0 | 0.0% |
| Total | 127 | 100.0% |
School Enrollment by Age by Funding Source in Esperanza
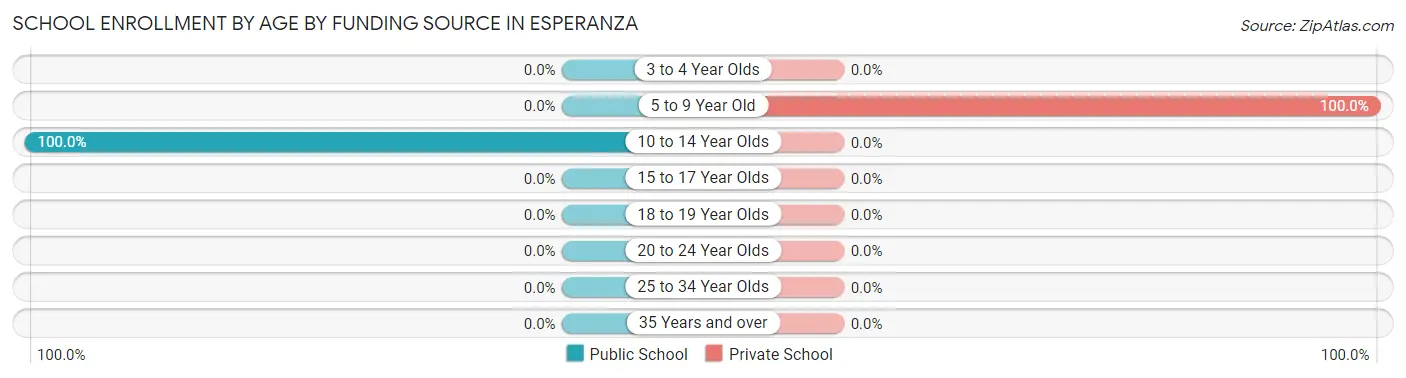
Out of a total of 127 students who are enrolled in schools in Esperanza, 86 (67.7%) attend a private institution, while the remaining 41 (32.3%) are enrolled in public schools. The age group of 5 to 9 year old has the highest likelihood of being enrolled in private schools, with 86 (100.0% in the age bracket) enrolled. Conversely, the age group of 10 to 14 year olds has the lowest likelihood of being enrolled in a private school, with 41 (100.0% in the age bracket) attending a public institution.
| Age Bracket | Public School | Private School |
| 3 to 4 Year Olds | 0 (0.0%) | 0 (0.0%) |
| 5 to 9 Year Old | 0 (0.0%) | 86 (100.0%) |
| 10 to 14 Year Olds | 41 (100.0%) | 0 (0.0%) |
| 15 to 17 Year Olds | 0 (0.0%) | 0 (0.0%) |
| 18 to 19 Year Olds | 0 (0.0%) | 0 (0.0%) |
| 20 to 24 Year Olds | 0 (0.0%) | 0 (0.0%) |
| 25 to 34 Year Olds | 0 (0.0%) | 0 (0.0%) |
| 35 Years and over | 0 (0.0%) | 0 (0.0%) |
| Total | 41 (32.3%) | 86 (67.7%) |
Educational Attainment by Field of Study in Esperanza
Psychology (40 | 50.0%), and science & technology (40 | 50.0%) are the most common fields of study among 80 individuals in Esperanza who have obtained a bachelor's degree or higher.
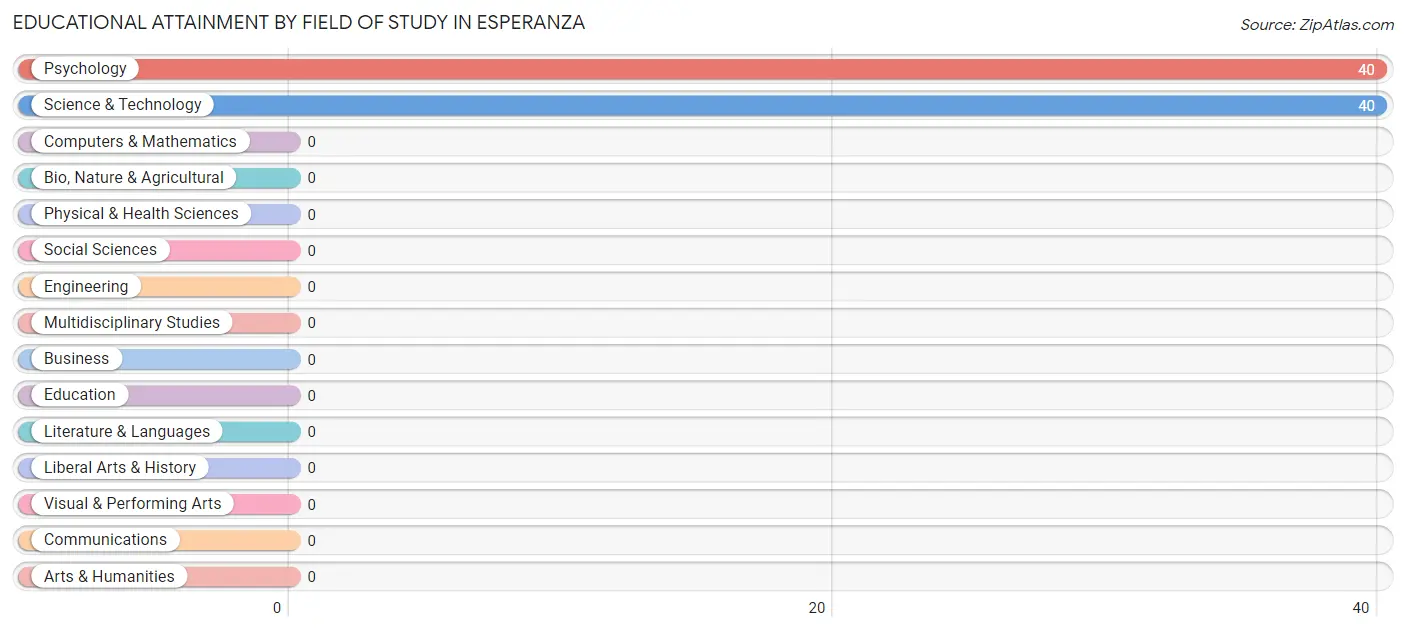
| Field of Study | # Graduates | % Graduates |
| Computers & Mathematics | 0 | 0.0% |
| Bio, Nature & Agricultural | 0 | 0.0% |
| Physical & Health Sciences | 0 | 0.0% |
| Psychology | 40 | 50.0% |
| Social Sciences | 0 | 0.0% |
| Engineering | 0 | 0.0% |
| Multidisciplinary Studies | 0 | 0.0% |
| Science & Technology | 40 | 50.0% |
| Business | 0 | 0.0% |
| Education | 0 | 0.0% |
| Literature & Languages | 0 | 0.0% |
| Liberal Arts & History | 0 | 0.0% |
| Visual & Performing Arts | 0 | 0.0% |
| Communications | 0 | 0.0% |
| Arts & Humanities | 0 | 0.0% |
| Total | 80 | 100.0% |
Transportation & Commute in Esperanza
Vehicle Availability by Sex in Esperanza
The most prevalent vehicle ownership categories in Esperanza are males with 1 vehicle (62, accounting for 52.1%) and females with 1 vehicle (40, making up 155.0%).
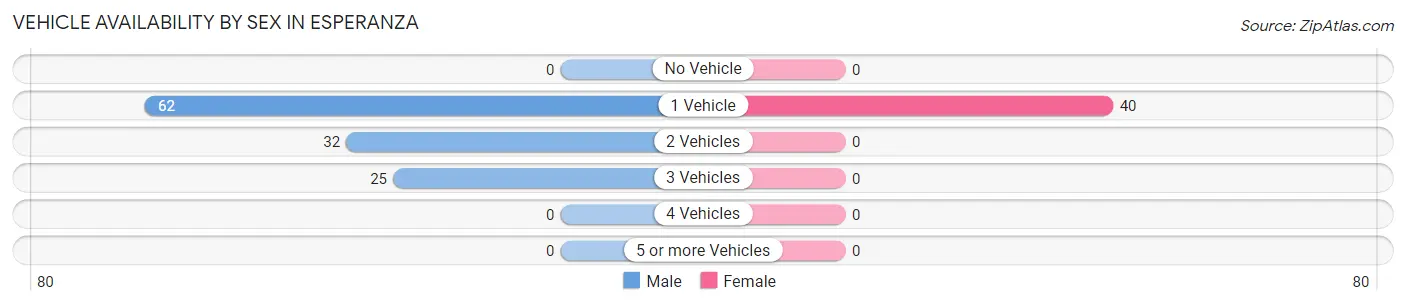
| Vehicles Available | Male | Female |
| No Vehicle | 0 (0.0%) | 0 (0.0%) |
| 1 Vehicle | 62 (52.1%) | 40 (100.0%) |
| 2 Vehicles | 32 (26.9%) | 0 (0.0%) |
| 3 Vehicles | 25 (21.0%) | 0 (0.0%) |
| 4 Vehicles | 0 (0.0%) | 0 (0.0%) |
| 5 or more Vehicles | 0 (0.0%) | 0 (0.0%) |
| Total | 119 (100.0%) | 40 (100.0%) |
Commute Time in Esperanza
The most frequently occuring commute durations in Esperanza are 15 to 19 minutes (50 commuters, 39.4%), 10 to 14 minutes (40 commuters, 31.5%), and 20 to 24 minutes (25 commuters, 19.7%).
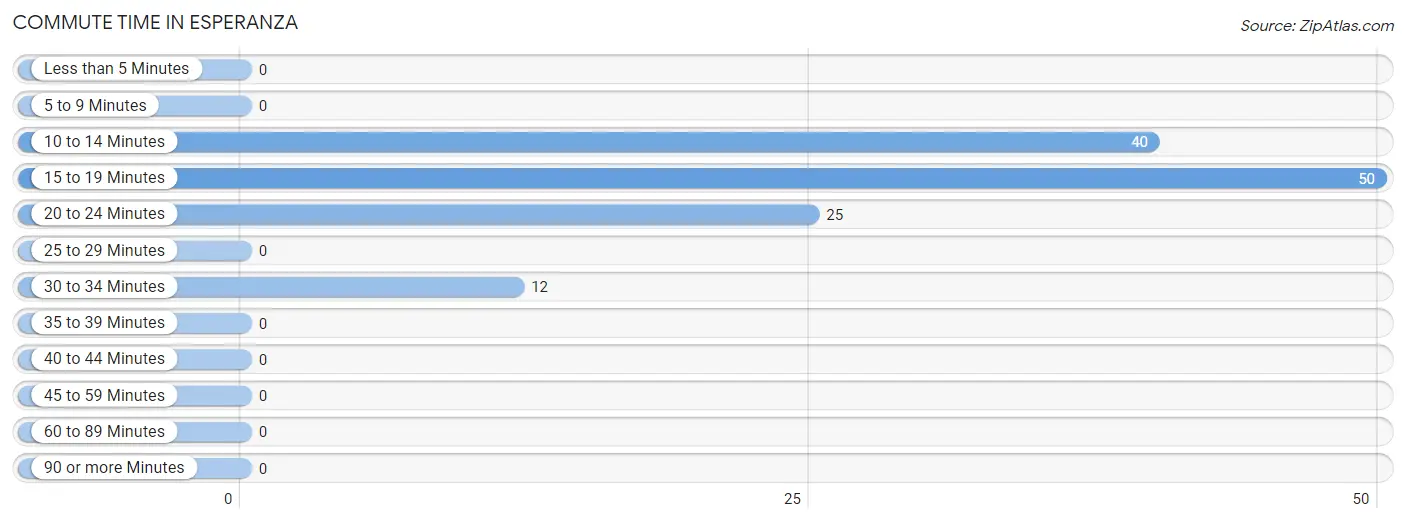
| Commute Time | # Commuters | % Commuters |
| Less than 5 Minutes | 0 | 0.0% |
| 5 to 9 Minutes | 0 | 0.0% |
| 10 to 14 Minutes | 40 | 31.5% |
| 15 to 19 Minutes | 50 | 39.4% |
| 20 to 24 Minutes | 25 | 19.7% |
| 25 to 29 Minutes | 0 | 0.0% |
| 30 to 34 Minutes | 12 | 9.5% |
| 35 to 39 Minutes | 0 | 0.0% |
| 40 to 44 Minutes | 0 | 0.0% |
| 45 to 59 Minutes | 0 | 0.0% |
| 60 to 89 Minutes | 0 | 0.0% |
| 90 or more Minutes | 0 | 0.0% |
Commute Time by Sex in Esperanza
The most common commute times in Esperanza are 15 to 19 minutes (50 commuters, 57.5%) for males and 10 to 14 minutes (40 commuters, 100.0%) for females.
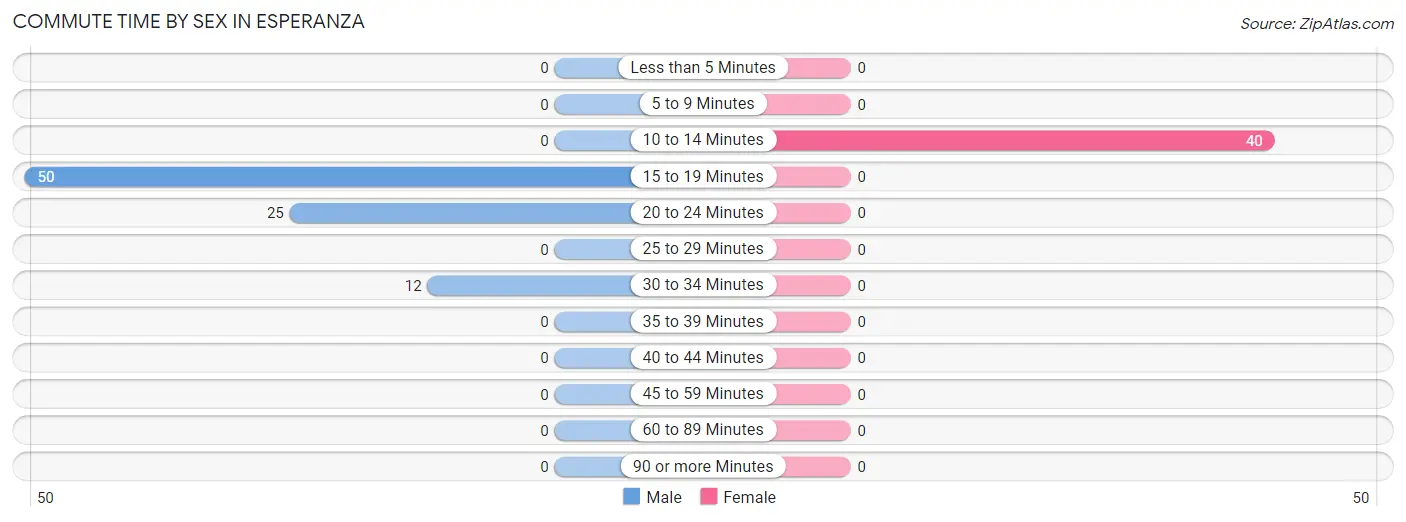
| Commute Time | Male | Female |
| Less than 5 Minutes | 0 (0.0%) | 0 (0.0%) |
| 5 to 9 Minutes | 0 (0.0%) | 0 (0.0%) |
| 10 to 14 Minutes | 0 (0.0%) | 40 (100.0%) |
| 15 to 19 Minutes | 50 (57.5%) | 0 (0.0%) |
| 20 to 24 Minutes | 25 (28.7%) | 0 (0.0%) |
| 25 to 29 Minutes | 0 (0.0%) | 0 (0.0%) |
| 30 to 34 Minutes | 12 (13.8%) | 0 (0.0%) |
| 35 to 39 Minutes | 0 (0.0%) | 0 (0.0%) |
| 40 to 44 Minutes | 0 (0.0%) | 0 (0.0%) |
| 45 to 59 Minutes | 0 (0.0%) | 0 (0.0%) |
| 60 to 89 Minutes | 0 (0.0%) | 0 (0.0%) |
| 90 or more Minutes | 0 (0.0%) | 0 (0.0%) |
Time of Departure to Work by Sex in Esperanza
The most frequent times of departure to work in Esperanza are 4:00 PM to 11:59 PM (50, 57.5%) for males and 4:00 PM to 11:59 PM (40, 100.0%) for females.
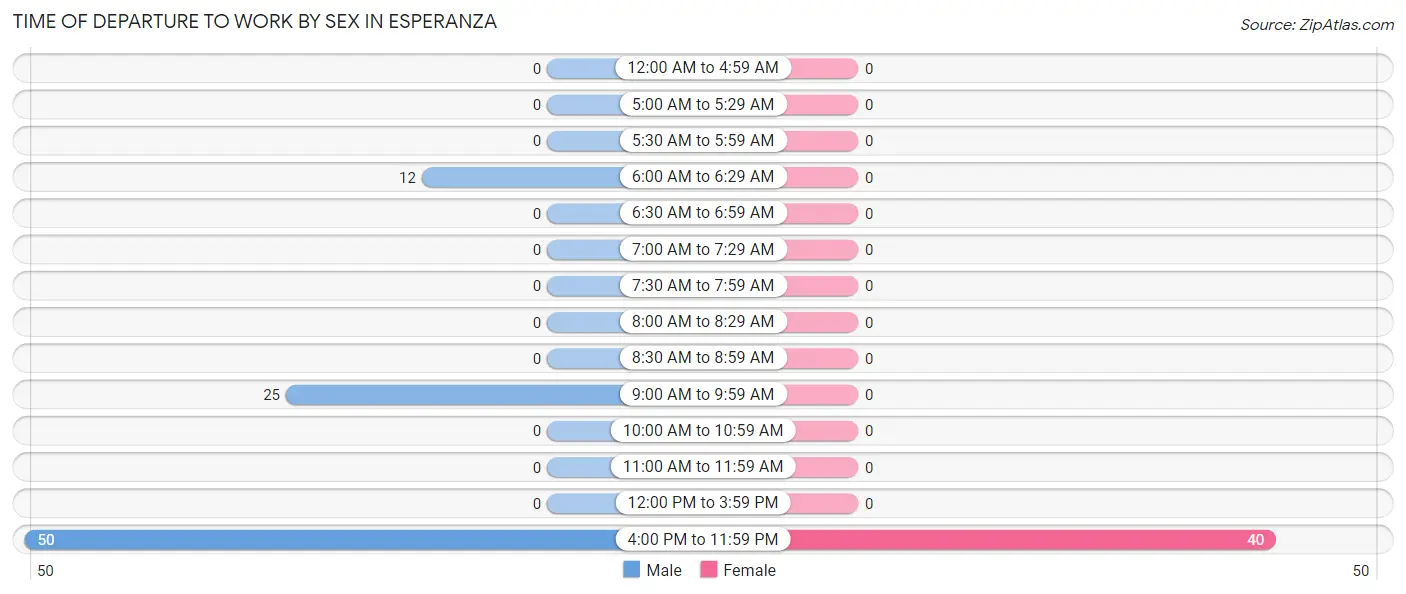
| Time of Departure | Male | Female |
| 12:00 AM to 4:59 AM | 0 (0.0%) | 0 (0.0%) |
| 5:00 AM to 5:29 AM | 0 (0.0%) | 0 (0.0%) |
| 5:30 AM to 5:59 AM | 0 (0.0%) | 0 (0.0%) |
| 6:00 AM to 6:29 AM | 12 (13.8%) | 0 (0.0%) |
| 6:30 AM to 6:59 AM | 0 (0.0%) | 0 (0.0%) |
| 7:00 AM to 7:29 AM | 0 (0.0%) | 0 (0.0%) |
| 7:30 AM to 7:59 AM | 0 (0.0%) | 0 (0.0%) |
| 8:00 AM to 8:29 AM | 0 (0.0%) | 0 (0.0%) |
| 8:30 AM to 8:59 AM | 0 (0.0%) | 0 (0.0%) |
| 9:00 AM to 9:59 AM | 25 (28.7%) | 0 (0.0%) |
| 10:00 AM to 10:59 AM | 0 (0.0%) | 0 (0.0%) |
| 11:00 AM to 11:59 AM | 0 (0.0%) | 0 (0.0%) |
| 12:00 PM to 3:59 PM | 0 (0.0%) | 0 (0.0%) |
| 4:00 PM to 11:59 PM | 50 (57.5%) | 40 (100.0%) |
| Total | 87 (100.0%) | 40 (100.0%) |
Housing Occupancy in Esperanza
Occupancy by Ownership in Esperanza
Of the total 250 dwellings in Esperanza, owner-occupied units account for 152 (60.8%), while renter-occupied units make up 98 (39.2%).
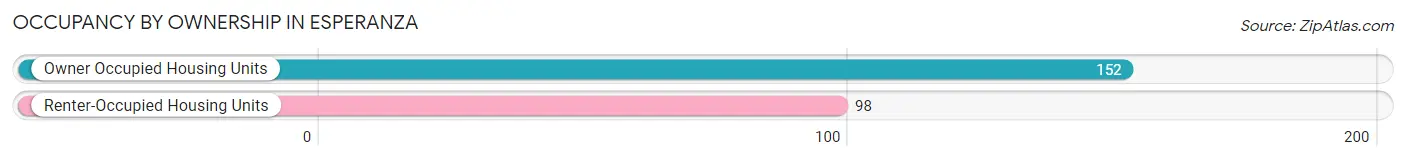
| Occupancy | # Housing Units | % Housing Units |
| Owner Occupied Housing Units | 152 | 60.8% |
| Renter-Occupied Housing Units | 98 | 39.2% |
| Total Occupied Housing Units | 250 | 100.0% |
Occupancy by Household Size in Esperanza
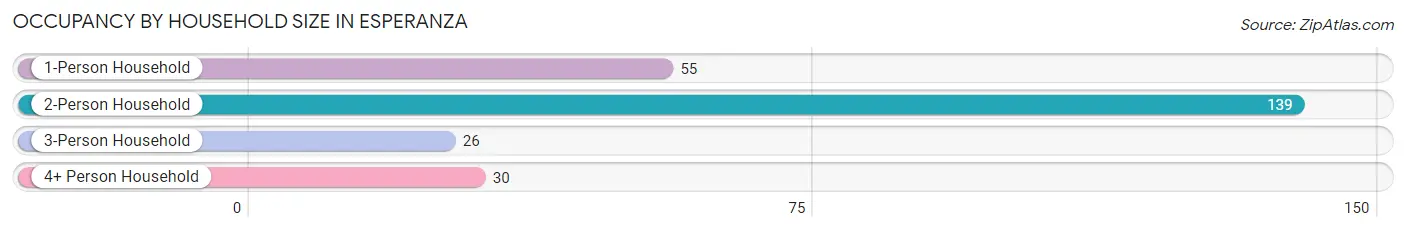
| Household Size | # Housing Units | % Housing Units |
| 1-Person Household | 55 | 22.0% |
| 2-Person Household | 139 | 55.6% |
| 3-Person Household | 26 | 10.4% |
| 4+ Person Household | 30 | 12.0% |
| Total Housing Units | 250 | 100.0% |
Occupancy by Ownership by Household Size in Esperanza
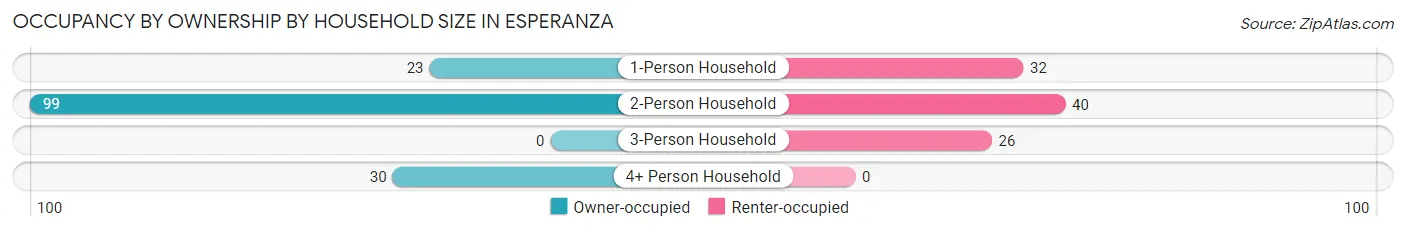
| Household Size | Owner-occupied | Renter-occupied |
| 1-Person Household | 23 (41.8%) | 32 (58.2%) |
| 2-Person Household | 99 (71.2%) | 40 (28.8%) |
| 3-Person Household | 0 (0.0%) | 26 (100.0%) |
| 4+ Person Household | 30 (100.0%) | 0 (0.0%) |
| Total Housing Units | 152 (60.8%) | 98 (39.2%) |
Occupancy by Educational Attainment in Esperanza
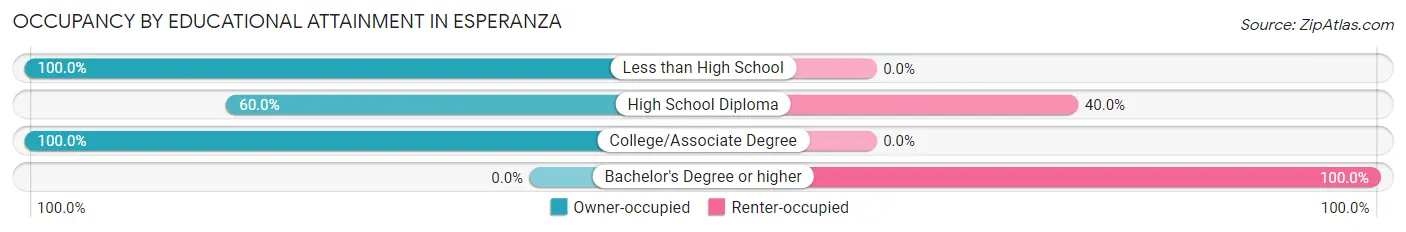
| Household Size | Owner-occupied | Renter-occupied |
| Less than High School | 42 (100.0%) | 0 (0.0%) |
| High School Diploma | 87 (60.0%) | 58 (40.0%) |
| College/Associate Degree | 23 (100.0%) | 0 (0.0%) |
| Bachelor's Degree or higher | 0 (0.0%) | 40 (100.0%) |
Occupancy by Age of Householder in Esperanza
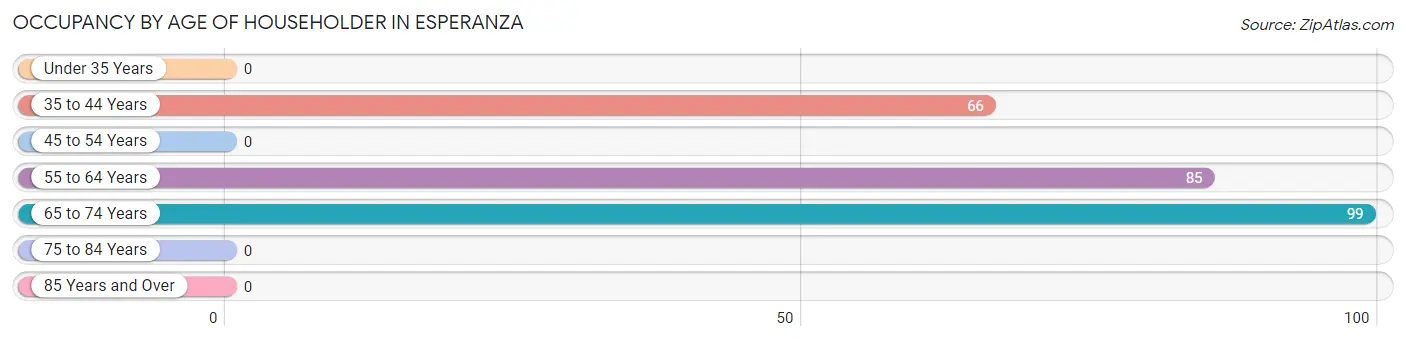
| Age Bracket | # Households | % Households |
| Under 35 Years | 0 | 0.0% |
| 35 to 44 Years | 66 | 26.4% |
| 45 to 54 Years | 0 | 0.0% |
| 55 to 64 Years | 85 | 34.0% |
| 65 to 74 Years | 99 | 39.6% |
| 75 to 84 Years | 0 | 0.0% |
| 85 Years and Over | 0 | 0.0% |
| Total | 250 | 100.0% |
Housing Finances in Esperanza
Median Income by Occupancy in Esperanza
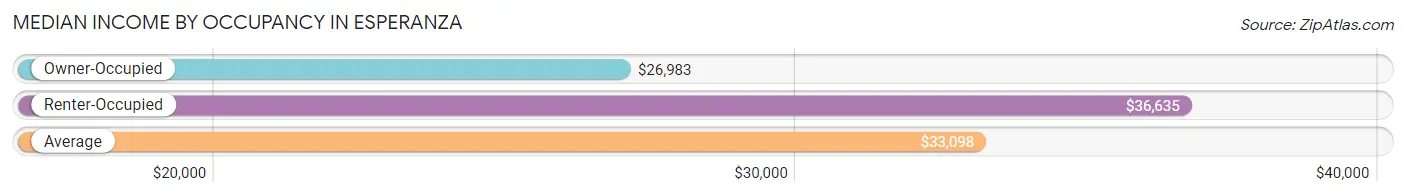
| Occupancy Type | # Households | Median Income |
| Owner-Occupied | 152 (60.8%) | $26,983 |
| Renter-Occupied | 98 (39.2%) | $36,635 |
| Average | 250 (100.0%) | $33,098 |
Occupancy by Householder Income Bracket in Esperanza
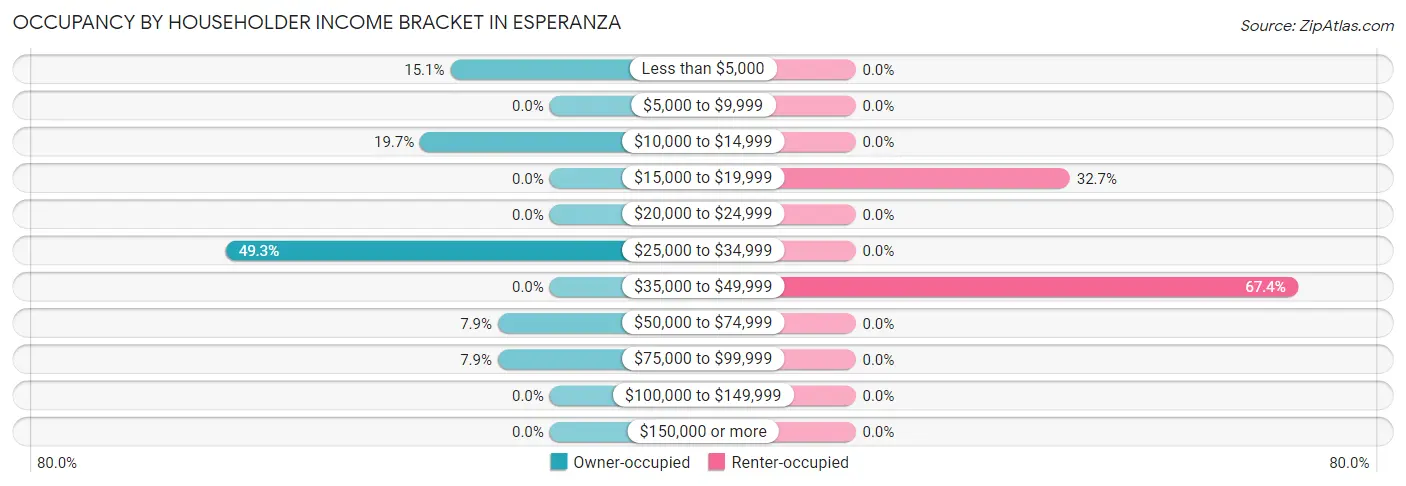
| Income Bracket | Owner-occupied | Renter-occupied |
| Less than $5,000 | 23 (15.1%) | 0 (0.0%) |
| $5,000 to $9,999 | 0 (0.0%) | 0 (0.0%) |
| $10,000 to $14,999 | 30 (19.7%) | 0 (0.0%) |
| $15,000 to $19,999 | 0 (0.0%) | 32 (32.7%) |
| $20,000 to $24,999 | 0 (0.0%) | 0 (0.0%) |
| $25,000 to $34,999 | 75 (49.3%) | 0 (0.0%) |
| $35,000 to $49,999 | 0 (0.0%) | 66 (67.3%) |
| $50,000 to $74,999 | 12 (7.9%) | 0 (0.0%) |
| $75,000 to $99,999 | 12 (7.9%) | 0 (0.0%) |
| $100,000 to $149,999 | 0 (0.0%) | 0 (0.0%) |
| $150,000 or more | 0 (0.0%) | 0 (0.0%) |
| Total | 152 (100.0%) | 98 (100.0%) |
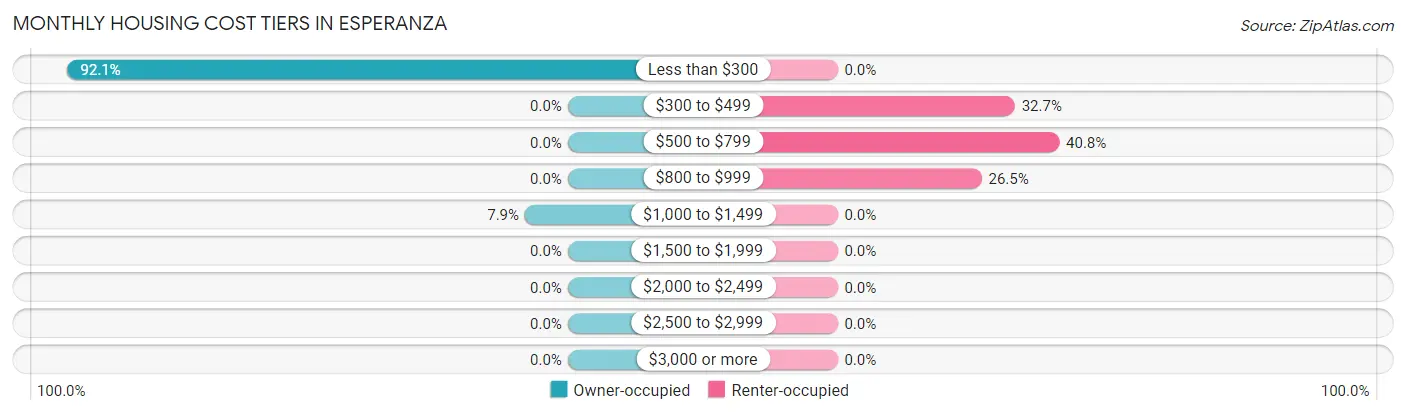
Monthly Housing Cost Tiers in Esperanza
| Monthly Cost | Owner-occupied | Renter-occupied |
| Less than $300 | 140 (92.1%) | 0 (0.0%) |
| $300 to $499 | 0 (0.0%) | 32 (32.7%) |
| $500 to $799 | 0 (0.0%) | 40 (40.8%) |
| $800 to $999 | 0 (0.0%) | 26 (26.5%) |
| $1,000 to $1,499 | 12 (7.9%) | 0 (0.0%) |
| $1,500 to $1,999 | 0 (0.0%) | 0 (0.0%) |
| $2,000 to $2,499 | 0 (0.0%) | 0 (0.0%) |
| $2,500 to $2,999 | 0 (0.0%) | 0 (0.0%) |
| $3,000 or more | 0 (0.0%) | 0 (0.0%) |
| Total | 152 (100.0%) | 98 (100.0%) |
Physical Housing Characteristics in Esperanza
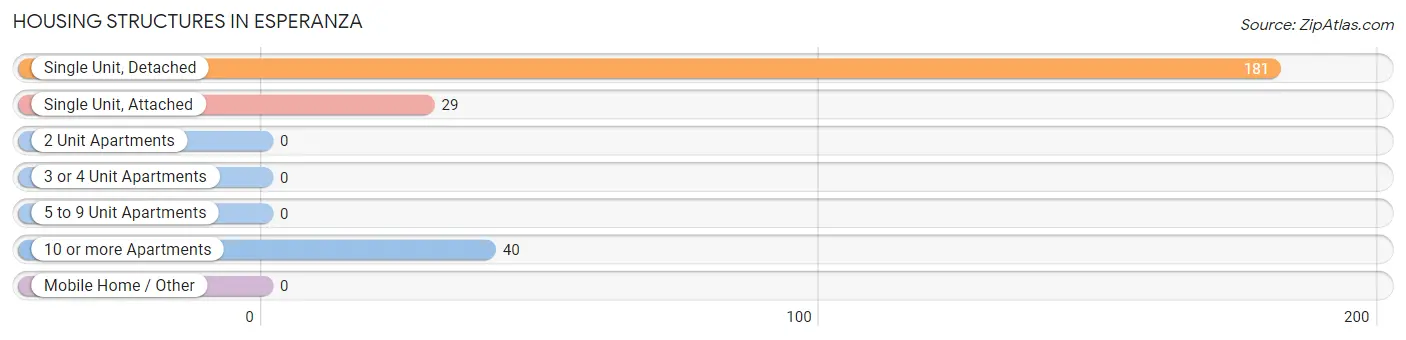
Housing Structures in Esperanza
| Structure Type | # Housing Units | % Housing Units |
| Single Unit, Detached | 181 | 72.4% |
| Single Unit, Attached | 29 | 11.6% |
| 2 Unit Apartments | 0 | 0.0% |
| 3 or 4 Unit Apartments | 0 | 0.0% |
| 5 to 9 Unit Apartments | 0 | 0.0% |
| 10 or more Apartments | 40 | 16.0% |
| Mobile Home / Other | 0 | 0.0% |
| Total | 250 | 100.0% |
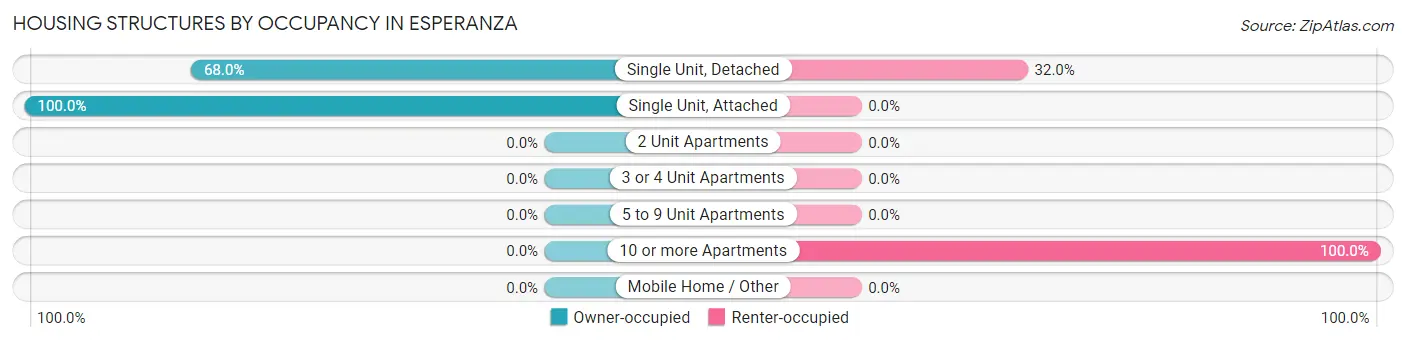
Housing Structures by Occupancy in Esperanza
| Structure Type | Owner-occupied | Renter-occupied |
| Single Unit, Detached | 123 (68.0%) | 58 (32.0%) |
| Single Unit, Attached | 29 (100.0%) | 0 (0.0%) |
| 2 Unit Apartments | 0 (0.0%) | 0 (0.0%) |
| 3 or 4 Unit Apartments | 0 (0.0%) | 0 (0.0%) |
| 5 to 9 Unit Apartments | 0 (0.0%) | 0 (0.0%) |
| 10 or more Apartments | 0 (0.0%) | 40 (100.0%) |
| Mobile Home / Other | 0 (0.0%) | 0 (0.0%) |
| Total | 152 (60.8%) | 98 (39.2%) |
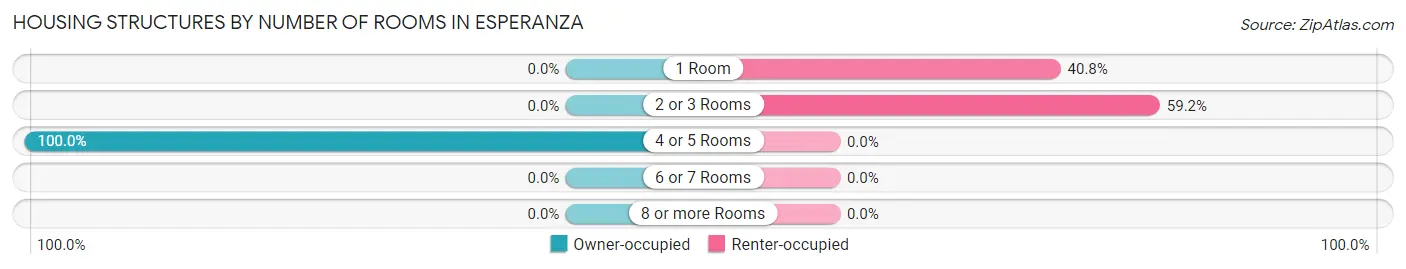
Housing Structures by Number of Rooms in Esperanza
| Number of Rooms | Owner-occupied | Renter-occupied |
| 1 Room | 0 (0.0%) | 40 (40.8%) |
| 2 or 3 Rooms | 0 (0.0%) | 58 (59.2%) |
| 4 or 5 Rooms | 152 (100.0%) | 0 (0.0%) |
| 6 or 7 Rooms | 0 (0.0%) | 0 (0.0%) |
| 8 or more Rooms | 0 (0.0%) | 0 (0.0%) |
| Total | 152 (100.0%) | 98 (100.0%) |
Housing Structure by Heating Type in Esperanza
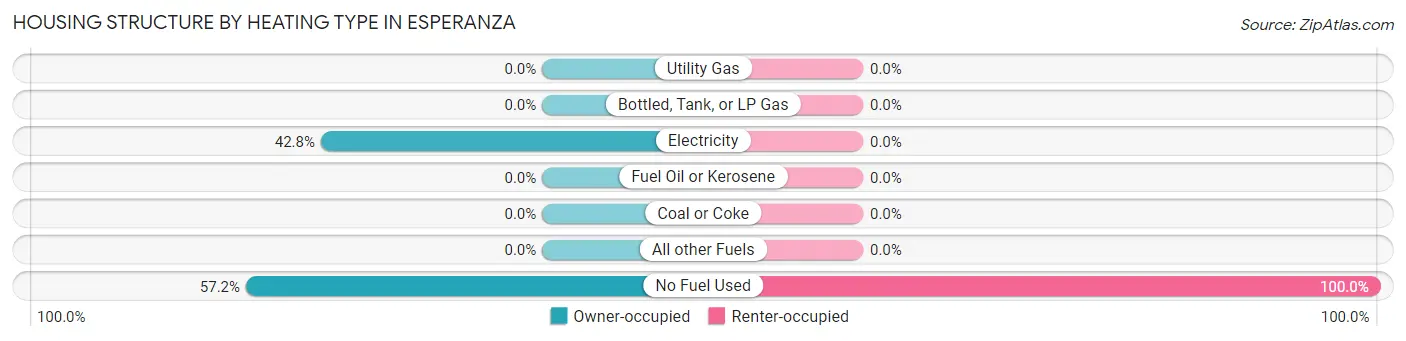
| Heating Type | Owner-occupied | Renter-occupied |
| Utility Gas | 0 (0.0%) | 0 (0.0%) |
| Bottled, Tank, or LP Gas | 0 (0.0%) | 0 (0.0%) |
| Electricity | 65 (42.8%) | 0 (0.0%) |
| Fuel Oil or Kerosene | 0 (0.0%) | 0 (0.0%) |
| Coal or Coke | 0 (0.0%) | 0 (0.0%) |
| All other Fuels | 0 (0.0%) | 0 (0.0%) |
| No Fuel Used | 87 (57.2%) | 98 (100.0%) |
| Total | 152 (100.0%) | 98 (100.0%) |
Household Vehicle Usage in Esperanza
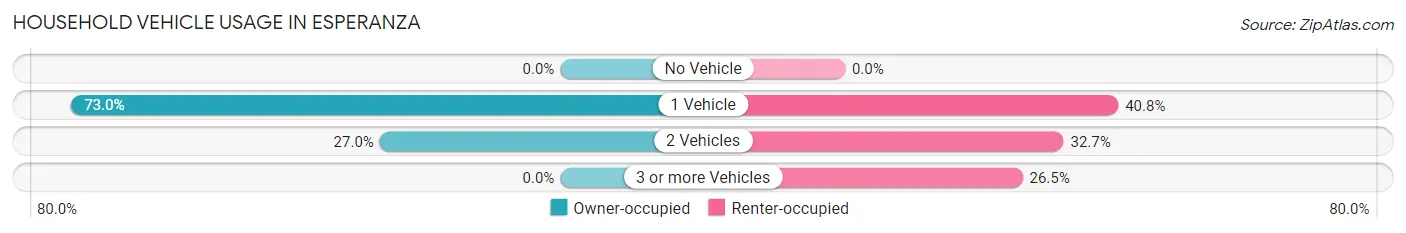
| Vehicles per Household | Owner-occupied | Renter-occupied |
| No Vehicle | 0 (0.0%) | 0 (0.0%) |
| 1 Vehicle | 111 (73.0%) | 40 (40.8%) |
| 2 Vehicles | 41 (27.0%) | 32 (32.7%) |
| 3 or more Vehicles | 0 (0.0%) | 26 (26.5%) |
| Total | 152 (100.0%) | 98 (100.0%) |
Real Estate & Mortgages in Esperanza
Real Estate and Mortgage Overview in Esperanza
| Characteristic | Without Mortgage | With Mortgage |
| Housing Units | 140 | 12 |
| Median Property Value | $127,100 | $0 |
| Median Household Income | $26,466 | $0 |
| Monthly Housing Costs | $192 | $0 |
| Real Estate Taxes | - | - |
Property Value by Mortgage Status in Esperanza
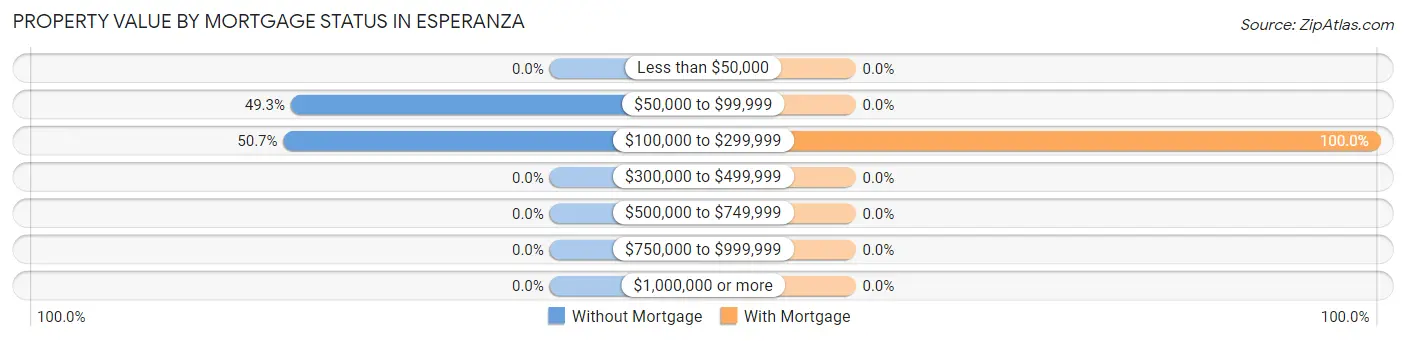
| Property Value | Without Mortgage | With Mortgage |
| Less than $50,000 | 0 (0.0%) | 0 (0.0%) |
| $50,000 to $99,999 | 69 (49.3%) | 0 (0.0%) |
| $100,000 to $299,999 | 71 (50.7%) | 12 (100.0%) |
| $300,000 to $499,999 | 0 (0.0%) | 0 (0.0%) |
| $500,000 to $749,999 | 0 (0.0%) | 0 (0.0%) |
| $750,000 to $999,999 | 0 (0.0%) | 0 (0.0%) |
| $1,000,000 or more | 0 (0.0%) | 0 (0.0%) |
| Total | 140 (100.0%) | 12 (100.0%) |
Household Income by Mortgage Status in Esperanza
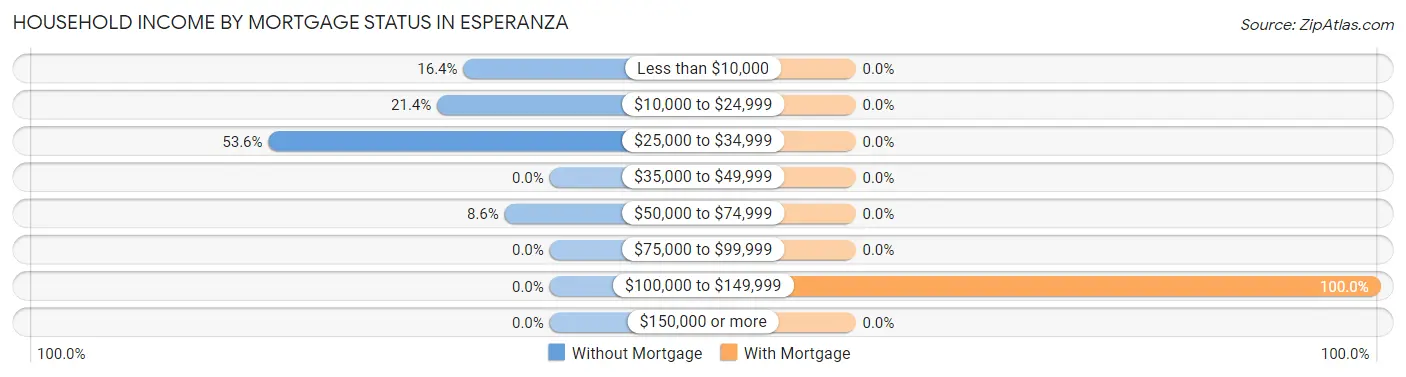
| Household Income | Without Mortgage | With Mortgage |
| Less than $10,000 | 23 (16.4%) | 0 (0.0%) |
| $10,000 to $24,999 | 30 (21.4%) | 0 (0.0%) |
| $25,000 to $34,999 | 75 (53.6%) | 0 (0.0%) |
| $35,000 to $49,999 | 0 (0.0%) | 0 (0.0%) |
| $50,000 to $74,999 | 12 (8.6%) | 0 (0.0%) |
| $75,000 to $99,999 | 0 (0.0%) | 0 (0.0%) |
| $100,000 to $149,999 | 0 (0.0%) | 12 (100.0%) |
| $150,000 or more | 0 (0.0%) | 0 (0.0%) |
| Total | 140 (100.0%) | 12 (100.0%) |
Property Value to Household Income Ratio in Esperanza
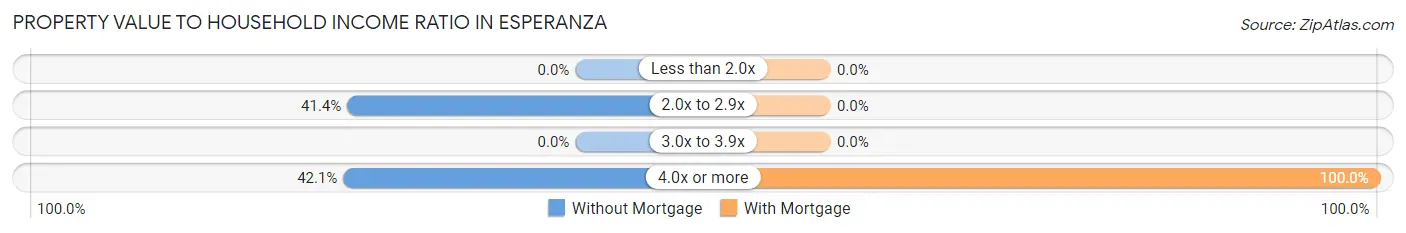
| Value-to-Income Ratio | Without Mortgage | With Mortgage |
| Less than 2.0x | 0 (0.0%) | 0 (0.0%) |
| 2.0x to 2.9x | 58 (41.4%) | 0 (0.0%) |
| 3.0x to 3.9x | 0 (0.0%) | 0 (0.0%) |
| 4.0x or more | 59 (42.1%) | 12 (100.0%) |
| Total | 140 (100.0%) | 12 (100.0%) |
Real Estate Taxes by Mortgage Status in Esperanza
| Property Taxes | Without Mortgage | With Mortgage |
| Less than $800 | 0 (0.0%) | 0 (0.0%) |
| $800 to $1,499 | 0 (0.0%) | 0 (0.0%) |
| $800 to $1,499 | 0 (0.0%) | 0 (0.0%) |
| Total | 140 (100.0%) | 12 (100.0%) |
Health & Disability in Esperanza
Health Insurance Coverage by Age in Esperanza
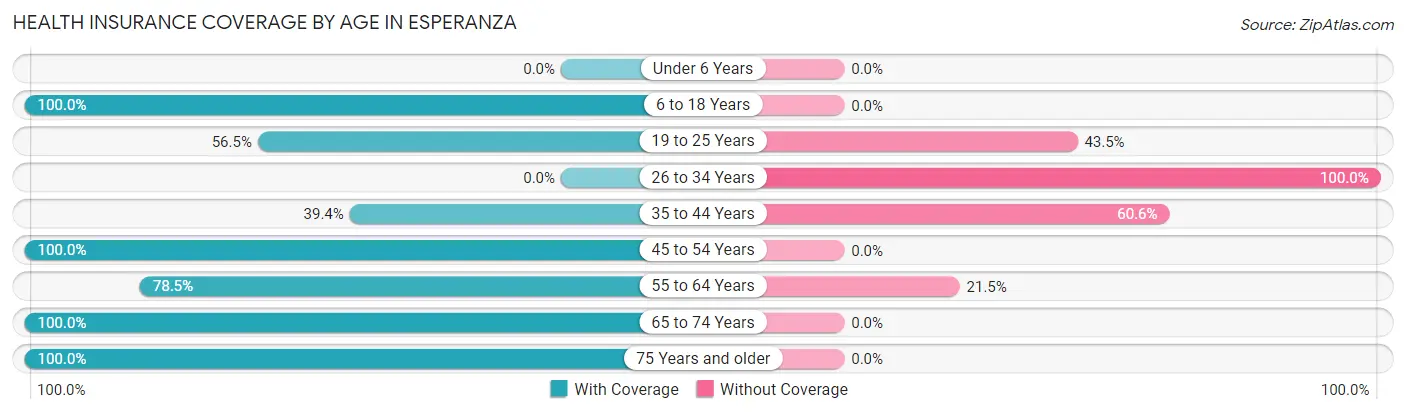
| Age Bracket | With Coverage | Without Coverage |
| Under 6 Years | 0 (0.0%) | 0 (0.0%) |
| 6 to 18 Years | 127 (100.0%) | 0 (0.0%) |
| 19 to 25 Years | 65 (56.5%) | 50 (43.5%) |
| 26 to 34 Years | 0 (0.0%) | 25 (100.0%) |
| 35 to 44 Years | 26 (39.4%) | 40 (60.6%) |
| 45 to 54 Years | 91 (100.0%) | 0 (0.0%) |
| 55 to 64 Years | 84 (78.5%) | 23 (21.5%) |
| 65 to 74 Years | 254 (100.0%) | 0 (0.0%) |
| 75 Years and older | 135 (100.0%) | 0 (0.0%) |
| Total | 782 (85.0%) | 138 (15.0%) |
Health Insurance Coverage by Citizenship Status in Esperanza
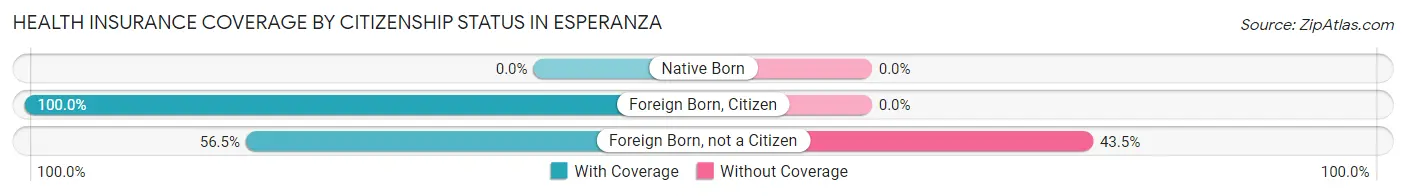
| Citizenship Status | With Coverage | Without Coverage |
| Native Born | 0 (0.0%) | 0 (0.0%) |
| Foreign Born, Citizen | 127 (100.0%) | 0 (0.0%) |
| Foreign Born, not a Citizen | 65 (56.5%) | 50 (43.5%) |
Health Insurance Coverage by Household Income in Esperanza
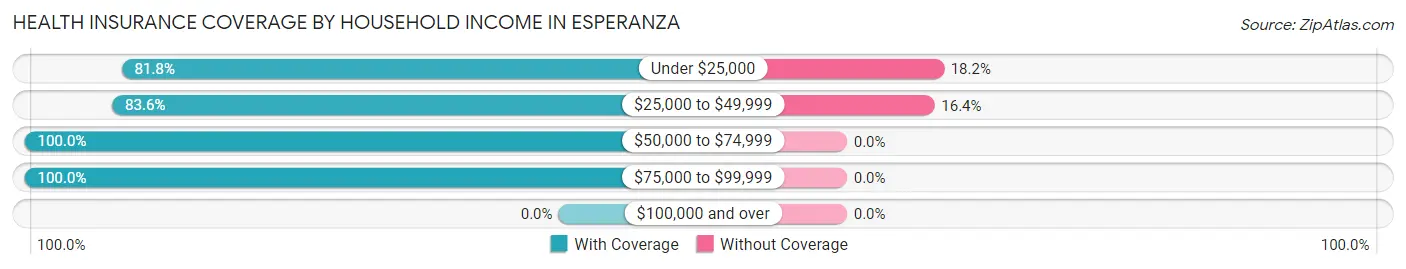
| Household Income | With Coverage | Without Coverage |
| Under $25,000 | 329 (81.8%) | 73 (18.2%) |
| $25,000 to $49,999 | 331 (83.6%) | 65 (16.4%) |
| $50,000 to $74,999 | 34 (100.0%) | 0 (0.0%) |
| $75,000 to $99,999 | 88 (100.0%) | 0 (0.0%) |
| $100,000 and over | 0 (0.0%) | 0 (0.0%) |
Public vs Private Health Insurance Coverage by Age in Esperanza
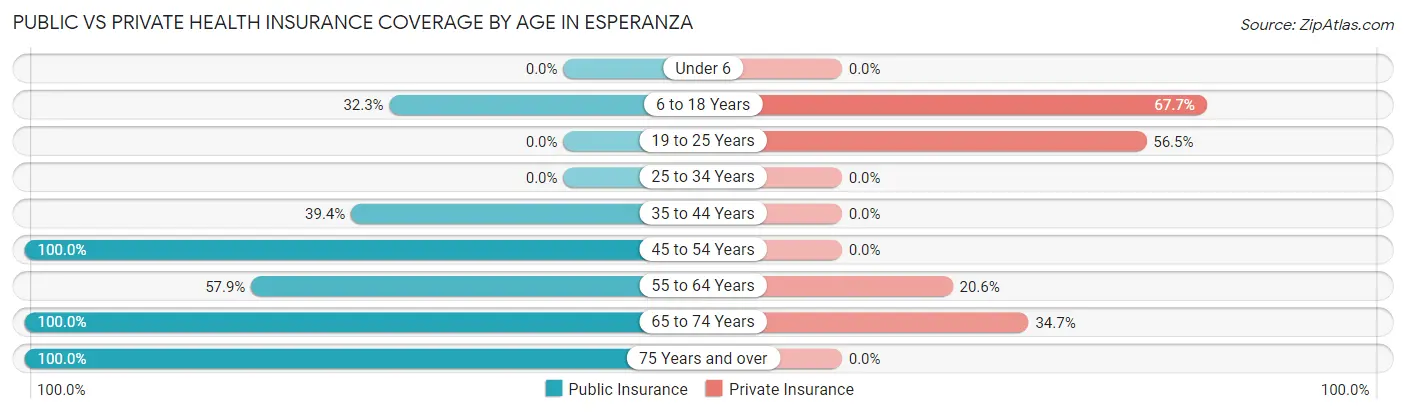
| Age Bracket | Public Insurance | Private Insurance |
| Under 6 | 0 (0.0%) | 0 (0.0%) |
| 6 to 18 Years | 41 (32.3%) | 86 (67.7%) |
| 19 to 25 Years | 0 (0.0%) | 65 (56.5%) |
| 25 to 34 Years | 0 (0.0%) | 0 (0.0%) |
| 35 to 44 Years | 26 (39.4%) | 0 (0.0%) |
| 45 to 54 Years | 91 (100.0%) | 0 (0.0%) |
| 55 to 64 Years | 62 (57.9%) | 22 (20.6%) |
| 65 to 74 Years | 254 (100.0%) | 88 (34.6%) |
| 75 Years and over | 135 (100.0%) | 0 (0.0%) |
| Total | 609 (66.2%) | 261 (28.4%) |
Disability Status by Sex by Age in Esperanza
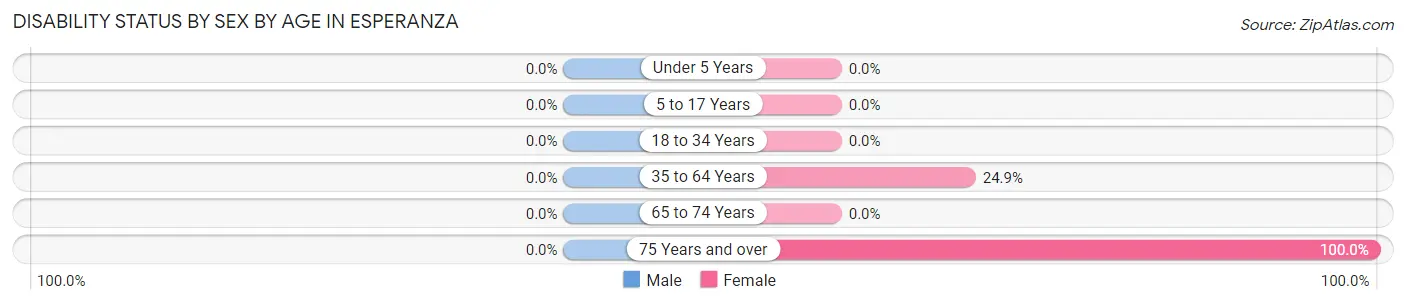
| Age Bracket | Male | Female |
| Under 5 Years | 0 (0.0%) | 0 (0.0%) |
| 5 to 17 Years | 0 (0.0%) | 0 (0.0%) |
| 18 to 34 Years | 0 (0.0%) | 0 (0.0%) |
| 35 to 64 Years | 0 (0.0%) | 52 (24.9%) |
| 65 to 74 Years | 0 (0.0%) | 0 (0.0%) |
| 75 Years and over | 0 (0.0%) | 135 (100.0%) |
Disability Class by Sex by Age in Esperanza
Disability Class: Hearing Difficulty
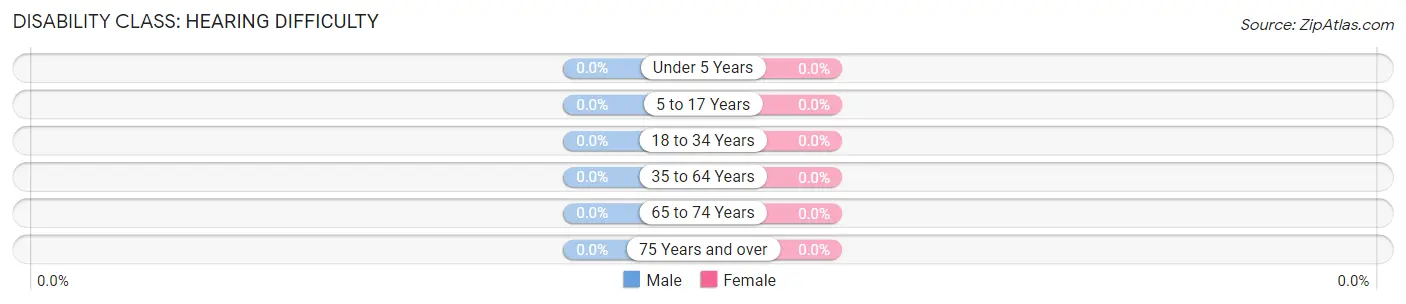
| Age Bracket | Male | Female |
| Under 5 Years | 0 (0.0%) | 0 (0.0%) |
| 5 to 17 Years | 0 (0.0%) | 0 (0.0%) |
| 18 to 34 Years | 0 (0.0%) | 0 (0.0%) |
| 35 to 64 Years | 0 (0.0%) | 0 (0.0%) |
| 65 to 74 Years | 0 (0.0%) | 0 (0.0%) |
| 75 Years and over | 0 (0.0%) | 0 (0.0%) |
Disability Class: Vision Difficulty
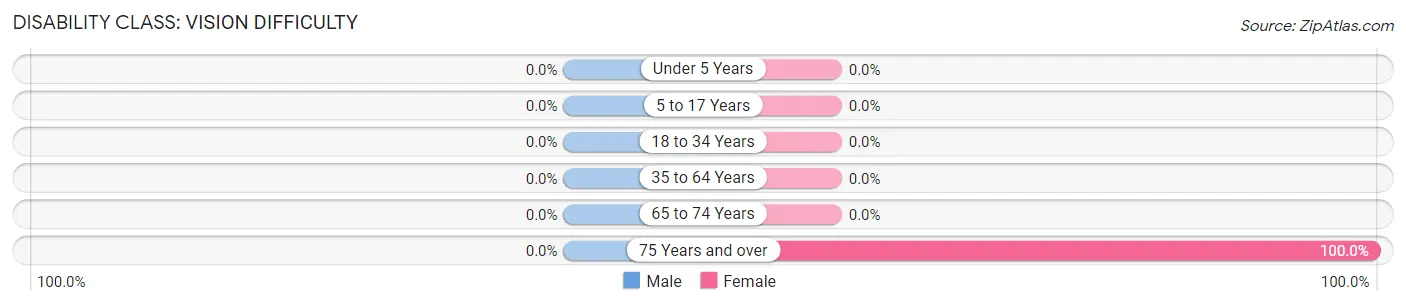
| Age Bracket | Male | Female |
| Under 5 Years | 0 (0.0%) | 0 (0.0%) |
| 5 to 17 Years | 0 (0.0%) | 0 (0.0%) |
| 18 to 34 Years | 0 (0.0%) | 0 (0.0%) |
| 35 to 64 Years | 0 (0.0%) | 0 (0.0%) |
| 65 to 74 Years | 0 (0.0%) | 0 (0.0%) |
| 75 Years and over | 0 (0.0%) | 135 (100.0%) |
Disability Class: Cognitive Difficulty
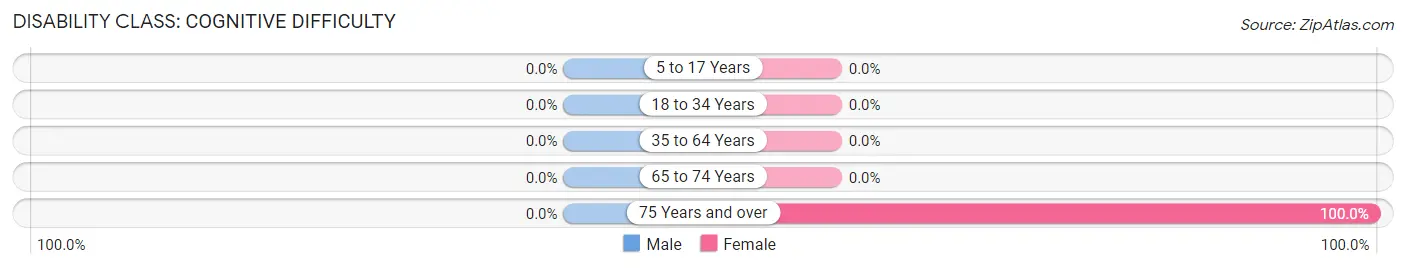
| Age Bracket | Male | Female |
| 5 to 17 Years | 0 (0.0%) | 0 (0.0%) |
| 18 to 34 Years | 0 (0.0%) | 0 (0.0%) |
| 35 to 64 Years | 0 (0.0%) | 0 (0.0%) |
| 65 to 74 Years | 0 (0.0%) | 0 (0.0%) |
| 75 Years and over | 0 (0.0%) | 135 (100.0%) |
Disability Class: Ambulatory Difficulty
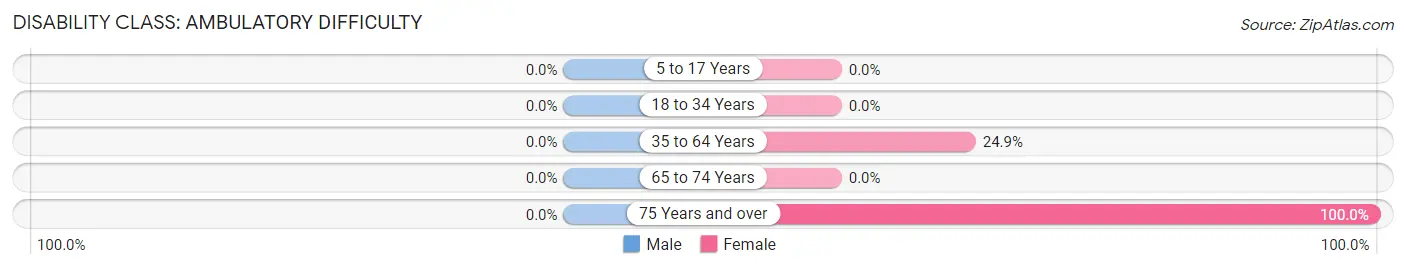
| Age Bracket | Male | Female |
| 5 to 17 Years | 0 (0.0%) | 0 (0.0%) |
| 18 to 34 Years | 0 (0.0%) | 0 (0.0%) |
| 35 to 64 Years | 0 (0.0%) | 52 (24.9%) |
| 65 to 74 Years | 0 (0.0%) | 0 (0.0%) |
| 75 Years and over | 0 (0.0%) | 135 (100.0%) |
Disability Class: Self-Care Difficulty
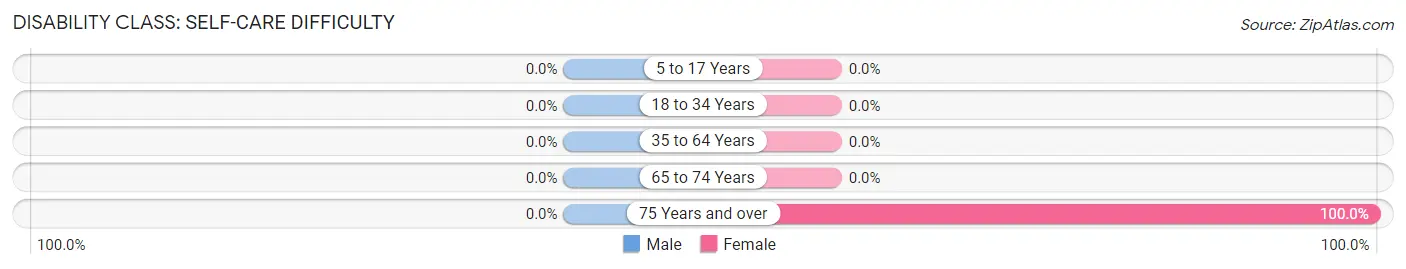
| Age Bracket | Male | Female |
| 5 to 17 Years | 0 (0.0%) | 0 (0.0%) |
| 18 to 34 Years | 0 (0.0%) | 0 (0.0%) |
| 35 to 64 Years | 0 (0.0%) | 0 (0.0%) |
| 65 to 74 Years | 0 (0.0%) | 0 (0.0%) |
| 75 Years and over | 0 (0.0%) | 135 (100.0%) |
Technology Access in Esperanza
Computing Device Access in Esperanza
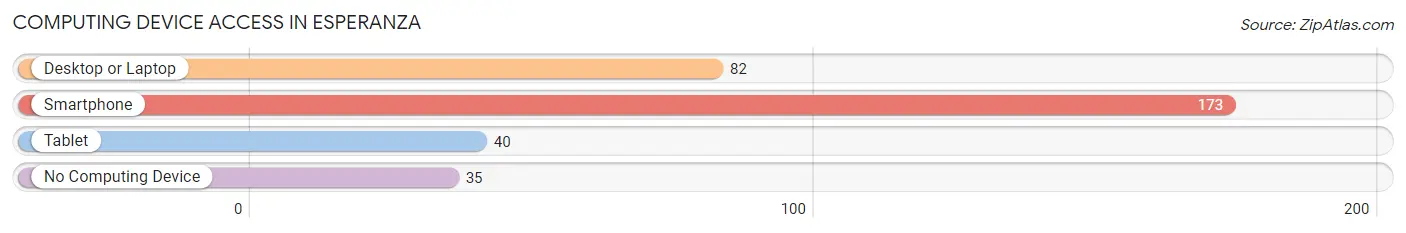
| Device Type | # Households | % Households |
| Desktop or Laptop | 82 | 32.8% |
| Smartphone | 173 | 69.2% |
| Tablet | 40 | 16.0% |
| No Computing Device | 35 | 14.0% |
| Total | 250 | 100.0% |
Internet Access in Esperanza
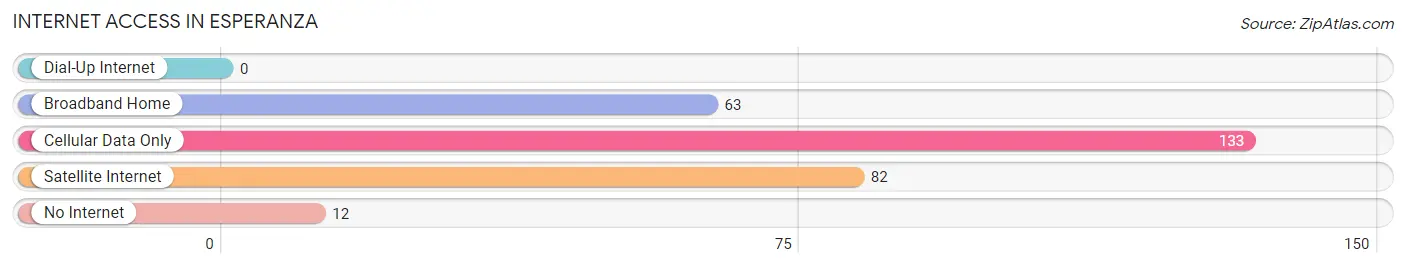
| Internet Type | # Households | % Households |
| Dial-Up Internet | 0 | 0.0% |
| Broadband Home | 63 | 25.2% |
| Cellular Data Only | 133 | 53.2% |
| Satellite Internet | 82 | 32.8% |
| No Internet | 12 | 4.8% |
| Total | 250 | 100.0% |
Esperanza Summary
Esperanza is a small municipality located in the central region of Puerto Rico. It is part of the Adjuntas municipality and is situated in the Cordillera Central mountain range. The town is known for its beautiful scenery and its rich history.
Geography
Esperanza is located in the central region of Puerto Rico, in the Cordillera Central mountain range. It is bordered by the municipalities of Adjuntas, Utuado, and Jayuya. The town is situated at an elevation of 1,000 feet above sea level and covers an area of 8.3 square miles. The terrain is mostly mountainous, with some flat areas in the lower elevations. The climate is tropical, with temperatures ranging from the mid-70s to the mid-80s.
History
Esperanza was founded in 1820 by a group of settlers from the nearby town of Adjuntas. The town was originally named San Antonio de la Esperanza, but the name was later shortened to Esperanza. The town was an important center of commerce and industry in the 19th century, and it was home to several sugar mills and coffee plantations.
Economy
Esperanza’s economy is largely based on agriculture and tourism. The town is known for its coffee plantations, which produce some of the finest coffee in Puerto Rico. Other crops grown in the area include bananas, plantains, and yams. The town is also home to several small businesses, including restaurants, shops, and hotels.
Demographics
As of the 2010 census, Esperanza had a population of 4,845. The population is mostly of Puerto Rican descent, with a small percentage of African and European ancestry. The median household income is $14,845, and the median age is 38. The town has a high rate of poverty, with nearly 40% of the population living below the poverty line.
Esperanza is a small but vibrant town with a rich history and culture. It is known for its beautiful scenery and its agricultural and tourism industries. The town is home to a diverse population and offers a unique experience for visitors.
Common Questions
What is Per Capita Income in Esperanza?
Per Capita income in Esperanza is $10,847.
What is the Median Family Income in Esperanza?
Median Family Income in Esperanza is $32,853.
What is the Median Household income in Esperanza?
Median Household Income in Esperanza is $33,098.
What is Inequality or Gini Index in Esperanza?
Inequality or Gini Index in Esperanza is 0.32.
What is the Total Population of Esperanza?
Total Population of Esperanza is 920.
What is the Total Male Population of Esperanza?
Total Male Population of Esperanza is 287.
What is the Total Female Population of Esperanza?
Total Female Population of Esperanza is 633.
What is the Ratio of Males per 100 Females in Esperanza?
There are 45.34 Males per 100 Females in Esperanza.
What is the Ratio of Females per 100 Males in Esperanza?
There are 220.56 Females per 100 Males in Esperanza.
What is the Median Population Age in Esperanza?
Median Population Age in Esperanza is 59.4 Years.
What is the Average Family Size in Esperanza
Average Family Size in Esperanza is 4.1 People.
What is the Average Household Size in Esperanza
Average Household Size in Esperanza is 3.7 People.
How Large is the Labor Force in Esperanza?
There are 159 People in the Labor Forcein in Esperanza.
What is the Percentage of People in the Labor Force in Esperanza?
20.1% of People are in the Labor Force in Esperanza.