Playita Cortada, PR Map & Demographics
Playita Cortada Map
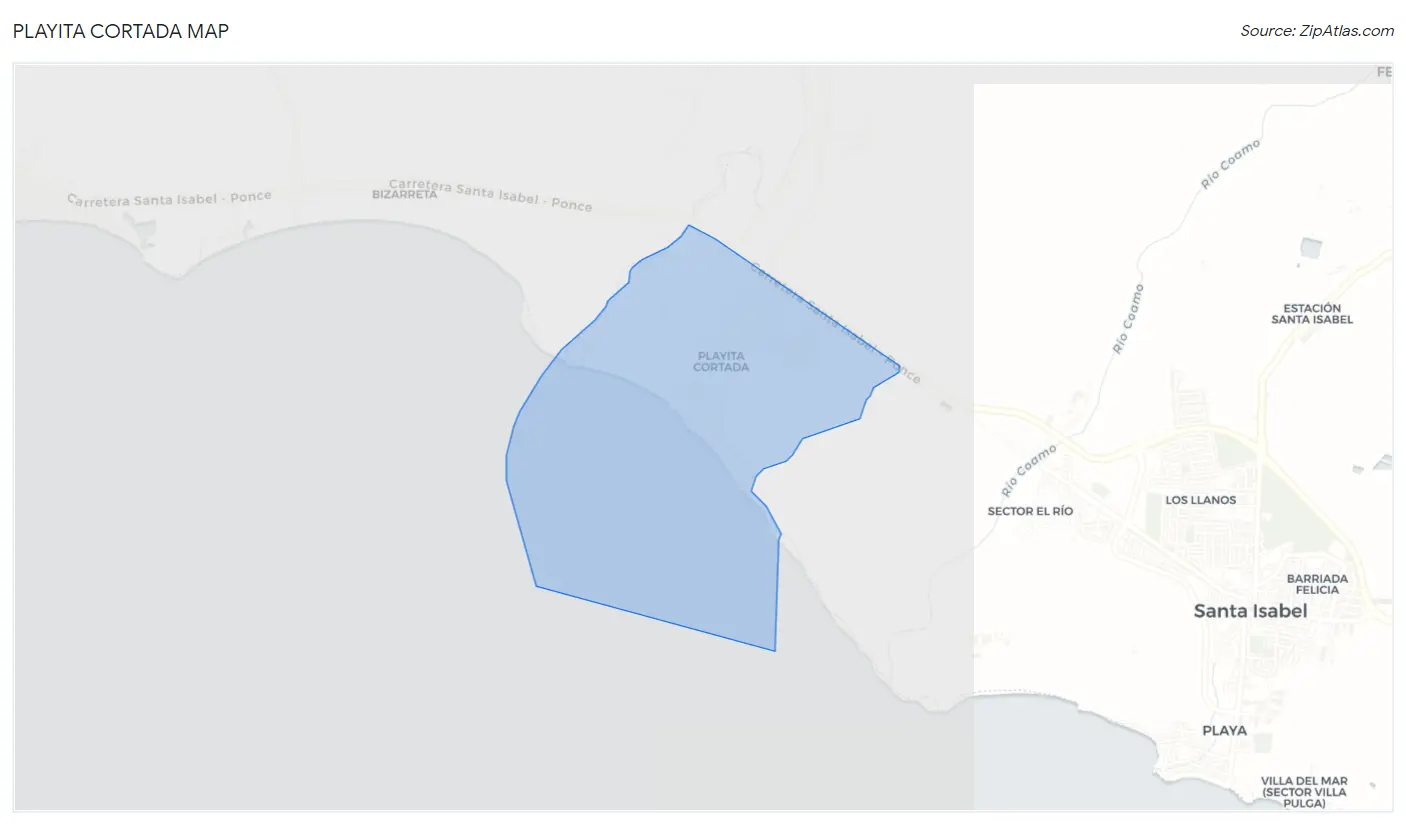
Playita Cortada Overview
$7,540
PER CAPITA INCOME
$13,986
AVG FAMILY INCOME
$15,768
AVG HOUSEHOLD INCOME
$15,598
FAMILY INCOME DEFICIT
0.49
INEQUALITY / GINI INDEX
1,395
TOTAL POPULATION
775
MALE POPULATION
620
FEMALE POPULATION
125.00
MALES / 100 FEMALES
80.00
FEMALES / 100 MALES
36.0
MEDIAN AGE
4.1
AVG FAMILY SIZE
2.8
AVG HOUSEHOLD SIZE
365
LABOR FORCE [ PEOPLE ]
32.1%
PERCENT IN LABOR FORCE
22.2%
UNEMPLOYMENT RATE
Income in Playita Cortada
Income Overview in Playita Cortada
Per Capita Income in Playita Cortada is $7,540, while median incomes of families and households are $13,986 and $15,768 respectively.
| Characteristic | Number | Measure |
| Per Capita Income | 1,395 | $7,540 |
| Median Family Income | 280 | $13,986 |
| Mean Family Income | 280 | $15,807 |
| Median Household Income | 497 | $15,768 |
| Mean Household Income | 497 | $19,051 |
| Income Deficit | 280 | $15,598 |
| Wage / Income Gap (%) | 1,395 | 0.00% |
| Wage / Income Gap ($) | 1,395 | 100.00¢ per $1 |
| Gini / Inequality Index | 1,395 | 0.49 |
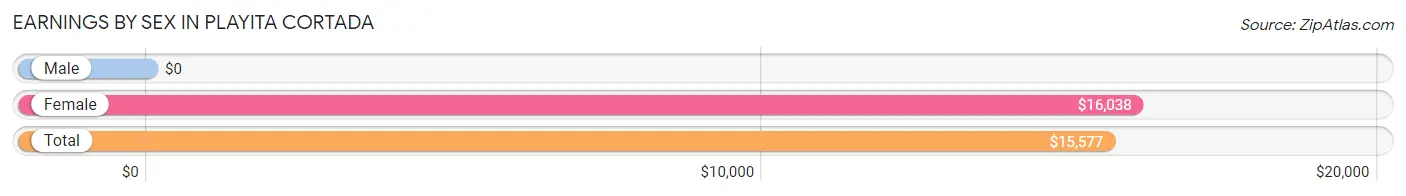
Earnings by Sex in Playita Cortada
| Sex | Number | Average Earnings |
| Male | 166 (52.2%) | $0 |
| Female | 152 (47.8%) | $16,038 |
| Total | 318 (100.0%) | $15,577 |
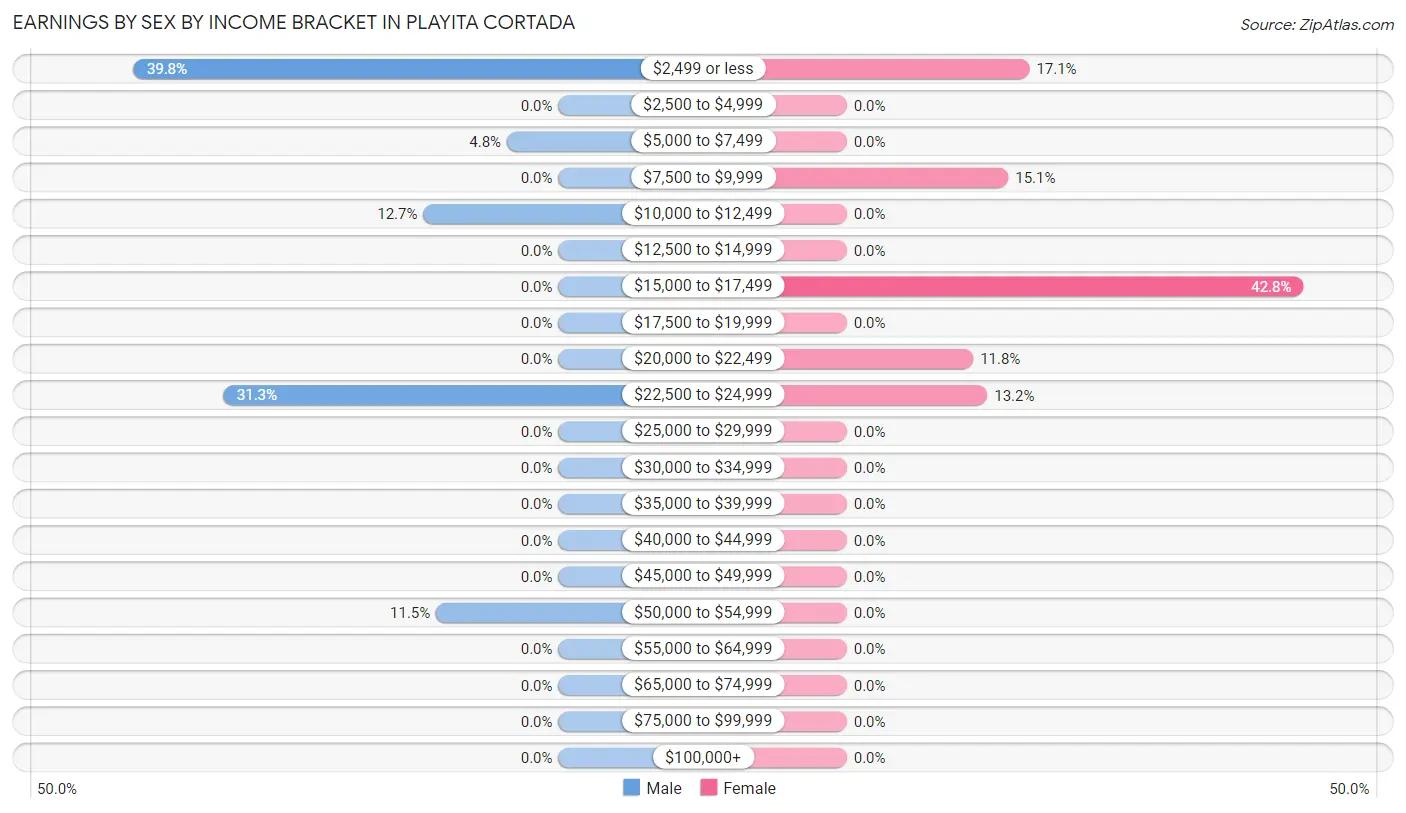
Earnings by Sex by Income Bracket in Playita Cortada
The most common earnings brackets in Playita Cortada are $2,499 or less for men (66 | 39.8%) and $15,000 to $17,499 for women (65 | 42.8%).
| Income | Male | Female |
| $2,499 or less | 66 (39.8%) | 26 (17.1%) |
| $2,500 to $4,999 | 0 (0.0%) | 0 (0.0%) |
| $5,000 to $7,499 | 8 (4.8%) | 0 (0.0%) |
| $7,500 to $9,999 | 0 (0.0%) | 23 (15.1%) |
| $10,000 to $12,499 | 21 (12.7%) | 0 (0.0%) |
| $12,500 to $14,999 | 0 (0.0%) | 0 (0.0%) |
| $15,000 to $17,499 | 0 (0.0%) | 65 (42.8%) |
| $17,500 to $19,999 | 0 (0.0%) | 0 (0.0%) |
| $20,000 to $22,499 | 0 (0.0%) | 18 (11.8%) |
| $22,500 to $24,999 | 52 (31.3%) | 20 (13.2%) |
| $25,000 to $29,999 | 0 (0.0%) | 0 (0.0%) |
| $30,000 to $34,999 | 0 (0.0%) | 0 (0.0%) |
| $35,000 to $39,999 | 0 (0.0%) | 0 (0.0%) |
| $40,000 to $44,999 | 0 (0.0%) | 0 (0.0%) |
| $45,000 to $49,999 | 0 (0.0%) | 0 (0.0%) |
| $50,000 to $54,999 | 19 (11.5%) | 0 (0.0%) |
| $55,000 to $64,999 | 0 (0.0%) | 0 (0.0%) |
| $65,000 to $74,999 | 0 (0.0%) | 0 (0.0%) |
| $75,000 to $99,999 | 0 (0.0%) | 0 (0.0%) |
| $100,000+ | 0 (0.0%) | 0 (0.0%) |
| Total | 166 (100.0%) | 152 (100.0%) |
Earnings by Sex by Educational Attainment in Playita Cortada
| Educational Attainment | Male Income | Female Income |
| Less than High School | - | - |
| High School Diploma | - | - |
| College or Associate's Degree | - | - |
| Bachelor's Degree | - | - |
| Graduate Degree | - | - |
| Total | - | - |
Family Income in Playita Cortada
Family Income Brackets in Playita Cortada
According to the Playita Cortada family income data, there are 118 families falling into the less than $10,000 income range, which is the most common income bracket and makes up 42.1% of all families.
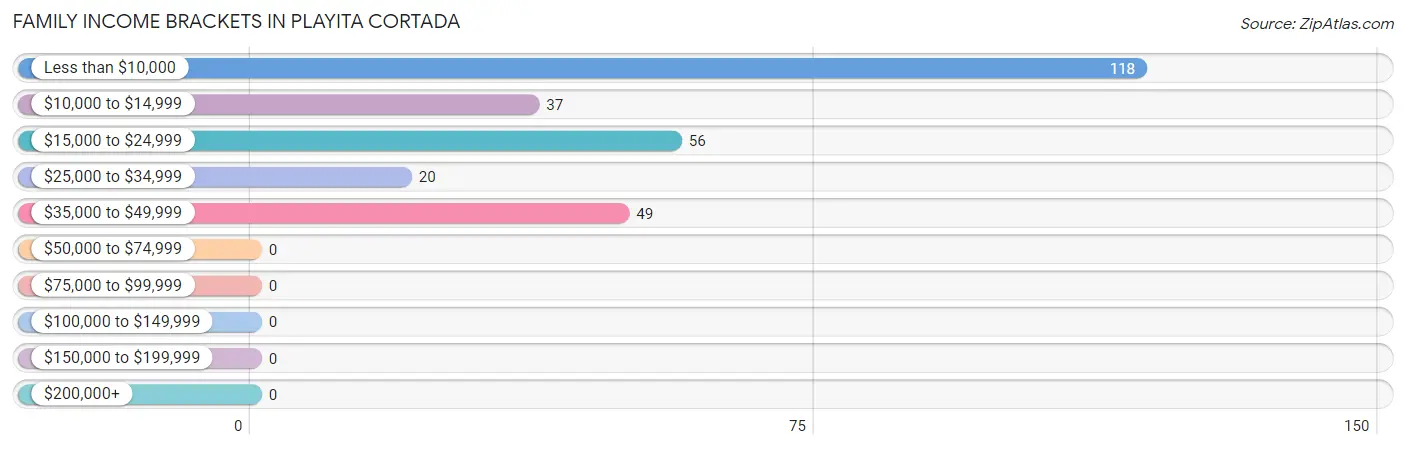
| Income Bracket | # Families | % Families |
| Less than $10,000 | 118 | 42.1% |
| $10,000 to $14,999 | 37 | 13.2% |
| $15,000 to $24,999 | 56 | 20.0% |
| $25,000 to $34,999 | 20 | 7.1% |
| $35,000 to $49,999 | 49 | 17.5% |
| $50,000 to $74,999 | 0 | 0.0% |
| $75,000 to $99,999 | 0 | 0.0% |
| $100,000 to $149,999 | 0 | 0.0% |
| $150,000 to $199,999 | 0 | 0.0% |
| $200,000+ | 0 | 0.0% |
Family Income by Famaliy Size in Playita Cortada
2-person families (80 | 28.6%) account for the highest median family income in Playita Cortada with $15,313 per family, while 2-person families (80 | 28.6%) have the highest median income of $7,656 per family member.
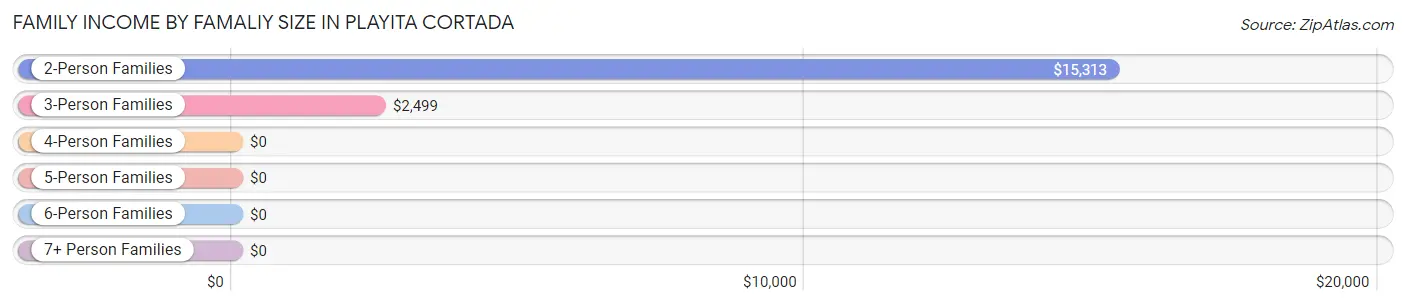
| Income Bracket | # Families | Median Income |
| 2-Person Families | 80 (28.6%) | $15,313 |
| 3-Person Families | 96 (34.3%) | $2,499 |
| 4-Person Families | 57 (20.4%) | $0 |
| 5-Person Families | 18 (6.4%) | $0 |
| 6-Person Families | 29 (10.4%) | $0 |
| 7+ Person Families | 0 (0.0%) | $0 |
| Total | 280 (100.0%) | $13,986 |
Family Income by Number of Earners in Playita Cortada
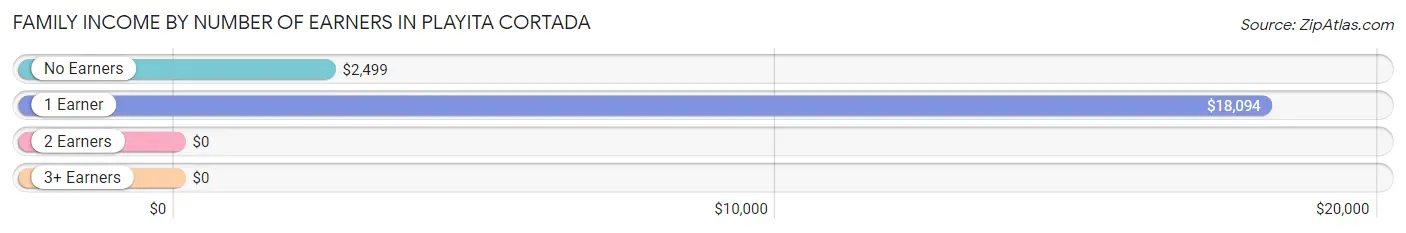
| Number of Earners | # Families | Median Income |
| No Earners | 120 (42.9%) | $2,499 |
| 1 Earner | 133 (47.5%) | $18,094 |
| 2 Earners | 27 (9.6%) | $0 |
| 3+ Earners | 0 (0.0%) | $0 |
| Total | 280 (100.0%) | $13,986 |
Household Income in Playita Cortada
Household Income Brackets in Playita Cortada
With 180 households falling in the category, the less than $10,000 income range is the most frequent in Playita Cortada, accounting for 36.2% of all households.
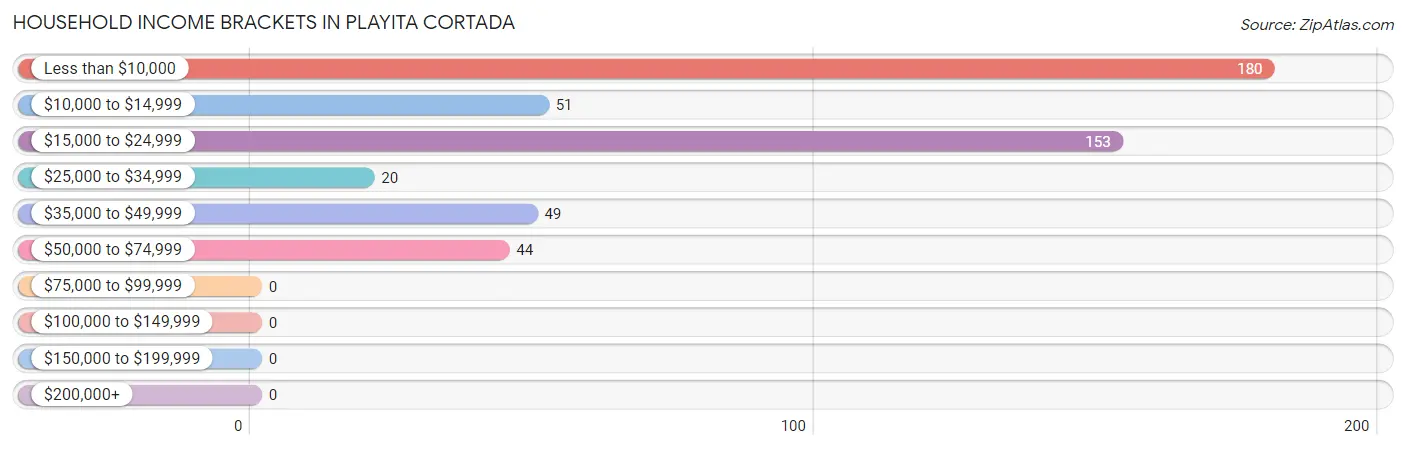
| Income Bracket | # Households | % Households |
| Less than $10,000 | 180 | 36.2% |
| $10,000 to $14,999 | 51 | 10.3% |
| $15,000 to $24,999 | 153 | 30.8% |
| $25,000 to $34,999 | 20 | 4.0% |
| $35,000 to $49,999 | 49 | 9.9% |
| $50,000 to $74,999 | 44 | 8.9% |
| $75,000 to $99,999 | 0 | 0.0% |
| $100,000 to $149,999 | 0 | 0.0% |
| $150,000 to $199,999 | 0 | 0.0% |
| $200,000+ | 0 | 0.0% |
Household Income by Householder Age in Playita Cortada
The median household income in Playita Cortada is $15,768, with the highest median household income of $17,386 found in the 45 to 64 years age bracket for the primary householder. A total of 170 households (34.2%) fall into this category. Meanwhile, the 15 to 24 years age bracket for the primary householder has the lowest median household income of $0, with 16 households (3.2%) in this group.
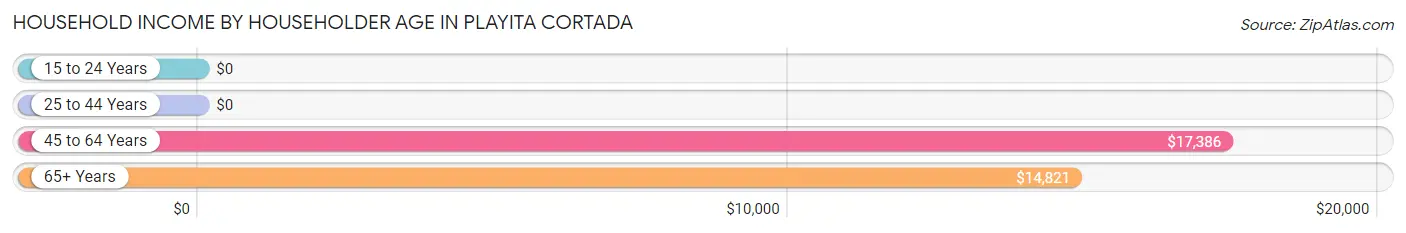
| Income Bracket | # Households | Median Income |
| 15 to 24 Years | 16 (3.2%) | $0 |
| 25 to 44 Years | 151 (30.4%) | $0 |
| 45 to 64 Years | 170 (34.2%) | $17,386 |
| 65+ Years | 160 (32.2%) | $14,821 |
| Total | 497 (100.0%) | $15,768 |
Poverty in Playita Cortada
Income Below Poverty by Sex and Age in Playita Cortada
With 60.4% poverty level for males and 74.5% for females among the residents of Playita Cortada, under 5 year old males and 6 to 11 year old females are the most vulnerable to poverty, with 63 males (100.0%) and 53 females (100.0%) in their respective age groups living below the poverty level.
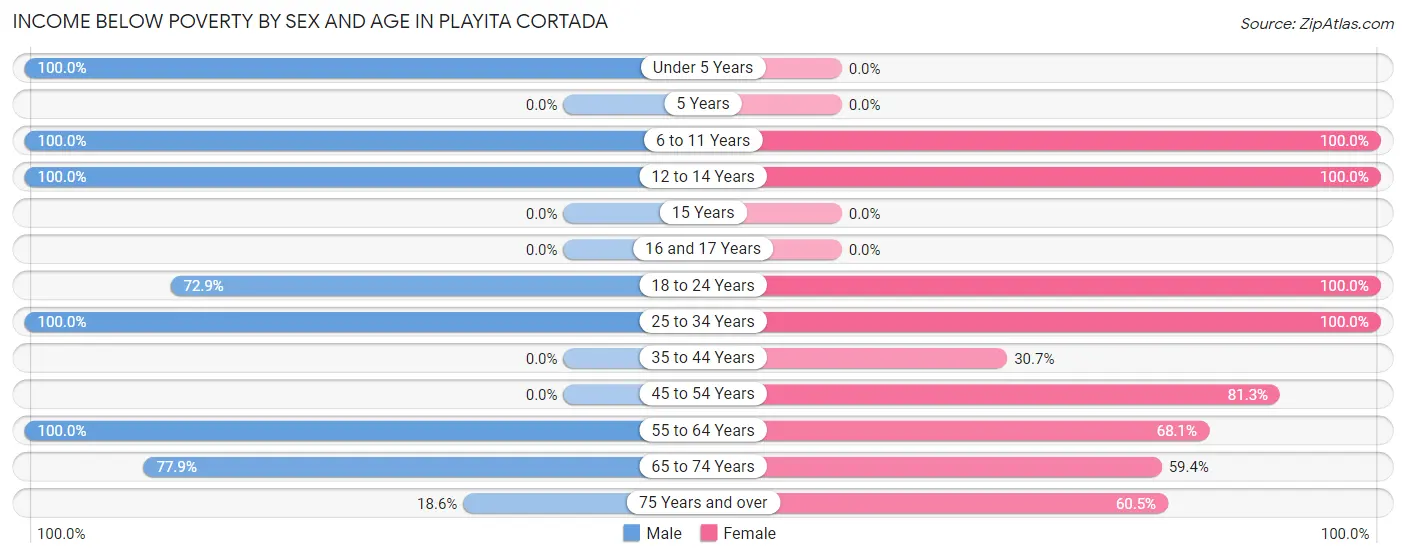
| Age Bracket | Male | Female |
| Under 5 Years | 63 (100.0%) | 0 (0.0%) |
| 5 Years | 0 (0.0%) | 0 (0.0%) |
| 6 to 11 Years | 70 (100.0%) | 53 (100.0%) |
| 12 to 14 Years | 45 (100.0%) | 27 (100.0%) |
| 15 Years | 0 (0.0%) | 0 (0.0%) |
| 16 and 17 Years | 0 (0.0%) | 0 (0.0%) |
| 18 to 24 Years | 105 (72.9%) | 62 (100.0%) |
| 25 to 34 Years | 71 (100.0%) | 105 (100.0%) |
| 35 to 44 Years | 0 (0.0%) | 39 (30.7%) |
| 45 to 54 Years | 0 (0.0%) | 87 (81.3%) |
| 55 to 64 Years | 46 (100.0%) | 47 (68.1%) |
| 65 to 74 Years | 60 (77.9%) | 19 (59.4%) |
| 75 Years and over | 8 (18.6%) | 23 (60.5%) |
| Total | 468 (60.4%) | 462 (74.5%) |
Income Above Poverty by Sex and Age in Playita Cortada
According to the poverty statistics in Playita Cortada, males aged 16 and 17 years and females aged 35 to 44 years are the age groups that are most secure financially, with 100.0% of males and 69.3% of females in these age groups living above the poverty line.
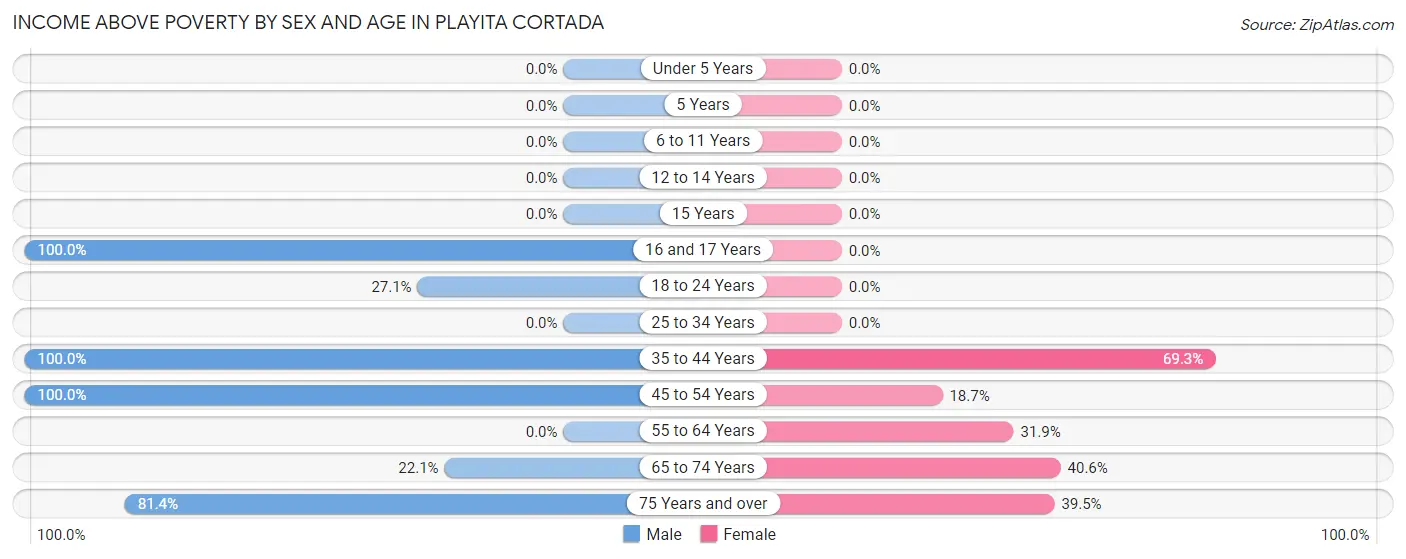
| Age Bracket | Male | Female |
| Under 5 Years | 0 (0.0%) | 0 (0.0%) |
| 5 Years | 0 (0.0%) | 0 (0.0%) |
| 6 to 11 Years | 0 (0.0%) | 0 (0.0%) |
| 12 to 14 Years | 0 (0.0%) | 0 (0.0%) |
| 15 Years | 0 (0.0%) | 0 (0.0%) |
| 16 and 17 Years | 35 (100.0%) | 0 (0.0%) |
| 18 to 24 Years | 39 (27.1%) | 0 (0.0%) |
| 25 to 34 Years | 0 (0.0%) | 0 (0.0%) |
| 35 to 44 Years | 21 (100.0%) | 88 (69.3%) |
| 45 to 54 Years | 160 (100.0%) | 20 (18.7%) |
| 55 to 64 Years | 0 (0.0%) | 22 (31.9%) |
| 65 to 74 Years | 17 (22.1%) | 13 (40.6%) |
| 75 Years and over | 35 (81.4%) | 15 (39.5%) |
| Total | 307 (39.6%) | 158 (25.5%) |
Income Below Poverty Among Married-Couple Families in Playita Cortada
The poverty statistics for married-couple families in Playita Cortada show that 47.3% or 62 of the total 131 families live below the poverty line. Families with 1 or 2 children have the highest poverty rate of 50.0%, comprising of 38 families. On the other hand, families with no children have the lowest poverty rate of 43.6%, which includes 24 families.
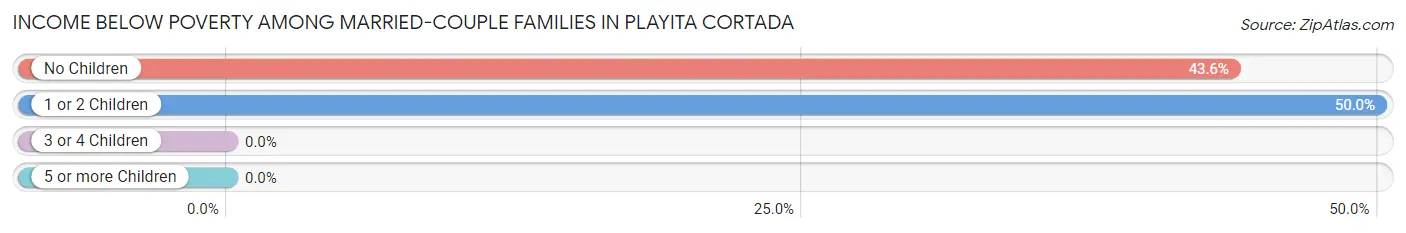
| Children | Above Poverty | Below Poverty |
| No Children | 31 (56.4%) | 24 (43.6%) |
| 1 or 2 Children | 38 (50.0%) | 38 (50.0%) |
| 3 or 4 Children | 0 (0.0%) | 0 (0.0%) |
| 5 or more Children | 0 (0.0%) | 0 (0.0%) |
| Total | 69 (52.7%) | 62 (47.3%) |
Income Below Poverty Among Single-Parent Households in Playita Cortada
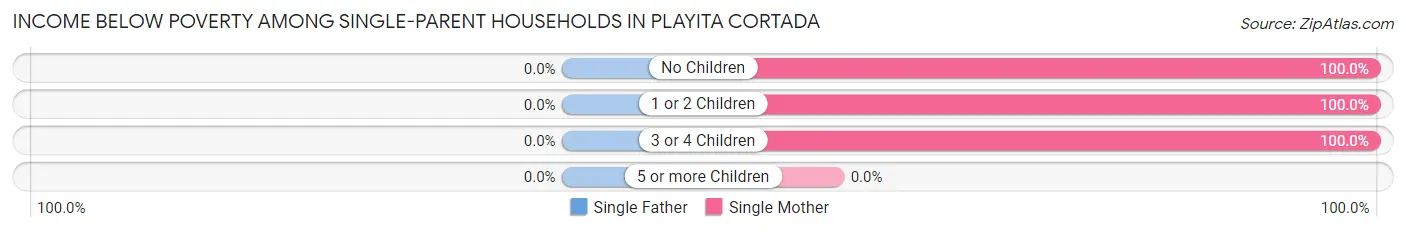
| Children | Single Father | Single Mother |
| No Children | 0 (0.0%) | 52 (100.0%) |
| 1 or 2 Children | 0 (0.0%) | 74 (100.0%) |
| 3 or 4 Children | 0 (0.0%) | 23 (100.0%) |
| 5 or more Children | 0 (0.0%) | 0 (0.0%) |
| Total | 0 (0.0%) | 149 (100.0%) |
Income Below Poverty Among Married-Couple vs Single-Parent Households in Playita Cortada
The poverty data for Playita Cortada shows that 62 of the married-couple family households (47.3%) and 149 of the single-parent households (100.0%) are living below the poverty level. Within the married-couple family households, those with 1 or 2 children have the highest poverty rate, with 38 households (50.0%) falling below the poverty line. Among the single-parent households, those with no children have the highest poverty rate, with 52 household (100.0%) living below poverty.
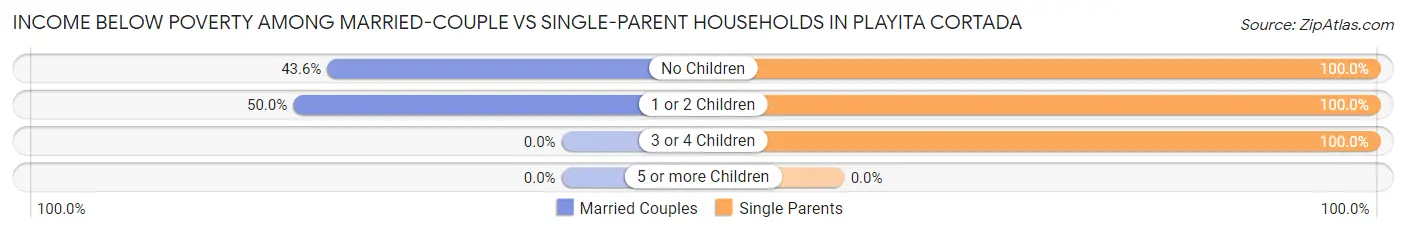
| Children | Married-Couple Families | Single-Parent Households |
| No Children | 24 (43.6%) | 52 (100.0%) |
| 1 or 2 Children | 38 (50.0%) | 74 (100.0%) |
| 3 or 4 Children | 0 (0.0%) | 23 (100.0%) |
| 5 or more Children | 0 (0.0%) | 0 (0.0%) |
| Total | 62 (47.3%) | 149 (100.0%) |
Race in Playita Cortada
The most populous races in Playita Cortada are Hispanic or Latino (1,370 | 98.2%), Two or more Races (632 | 45.3%), and Black / African American (428 | 30.7%).
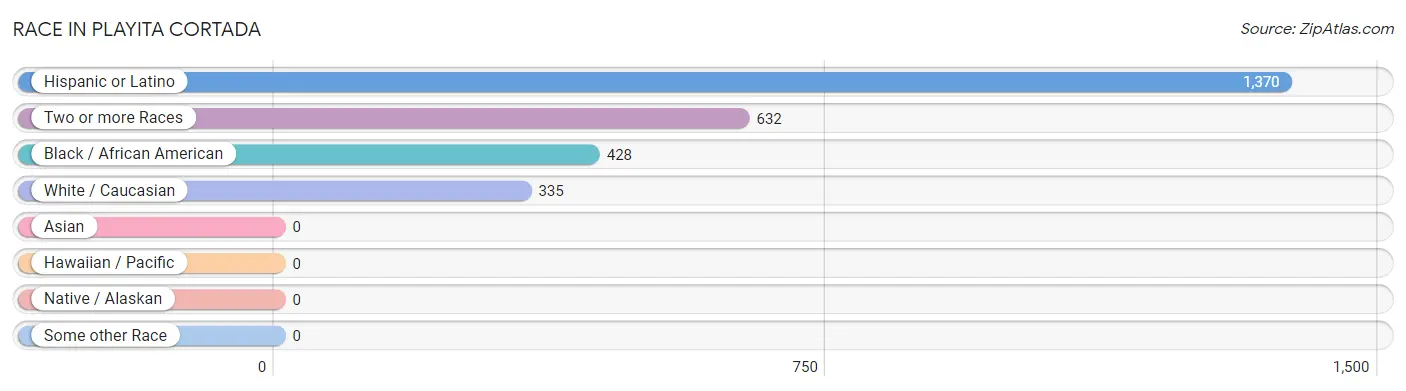
| Race | # Population | % Population |
| Asian | 0 | 0.0% |
| Black / African American | 428 | 30.7% |
| Hawaiian / Pacific | 0 | 0.0% |
| Hispanic or Latino | 1,370 | 98.2% |
| Native / Alaskan | 0 | 0.0% |
| White / Caucasian | 335 | 24.0% |
| Two or more Races | 632 | 45.3% |
| Some other Race | 0 | 0.0% |
| Total | 1,395 | 100.0% |
Ancestry in Playita Cortada
The most populous ancestries reported in Playita Cortada are Puerto Rican (1,370 | 98.2%), and American (9 | 0.6%), together accounting for 98.9% of all Playita Cortada residents.
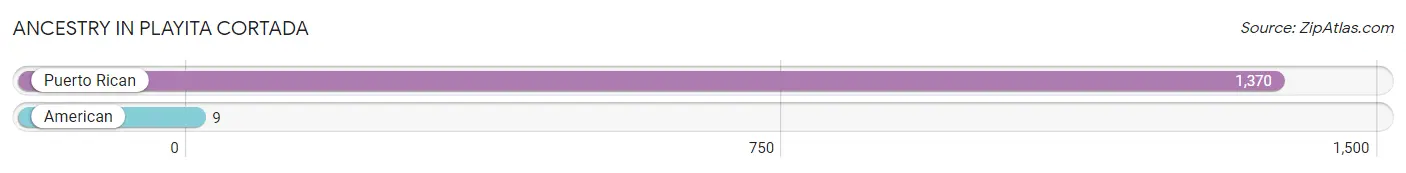
| Ancestry | # Population | % Population |
| American | 9 | 0.6% |
| Puerto Rican | 1,370 | 98.2% | View All 2 Rows |
Immigrants in Playita Cortada

| Immigration Origin | # Population | % Population | View All 0 Rows |
Sex and Age in Playita Cortada
Sex and Age in Playita Cortada
The most populous age groups in Playita Cortada are 15 to 19 Years (131 | 16.9%) for men and 40 to 44 Years (84 | 13.6%) for women.
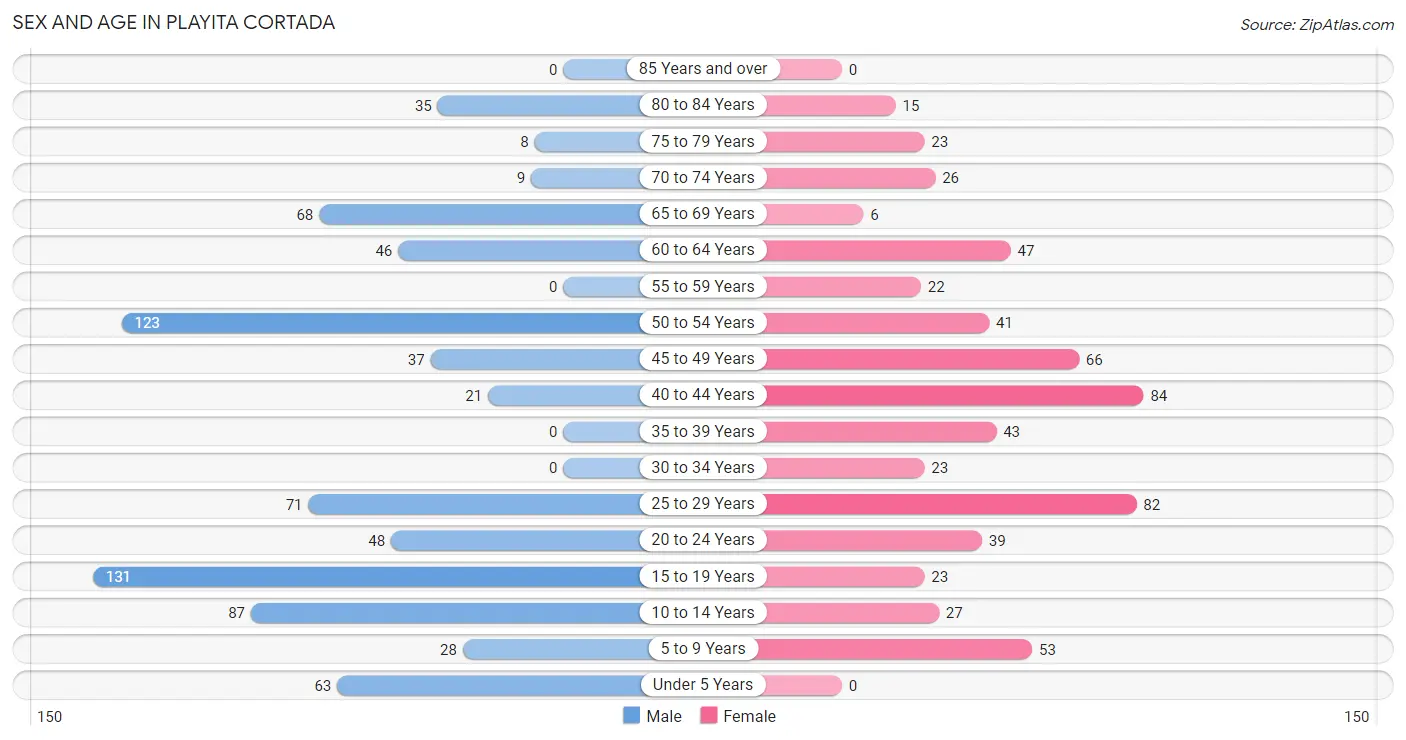
| Age Bracket | Male | Female |
| Under 5 Years | 63 (8.1%) | 0 (0.0%) |
| 5 to 9 Years | 28 (3.6%) | 53 (8.6%) |
| 10 to 14 Years | 87 (11.2%) | 27 (4.3%) |
| 15 to 19 Years | 131 (16.9%) | 23 (3.7%) |
| 20 to 24 Years | 48 (6.2%) | 39 (6.3%) |
| 25 to 29 Years | 71 (9.2%) | 82 (13.2%) |
| 30 to 34 Years | 0 (0.0%) | 23 (3.7%) |
| 35 to 39 Years | 0 (0.0%) | 43 (6.9%) |
| 40 to 44 Years | 21 (2.7%) | 84 (13.6%) |
| 45 to 49 Years | 37 (4.8%) | 66 (10.6%) |
| 50 to 54 Years | 123 (15.9%) | 41 (6.6%) |
| 55 to 59 Years | 0 (0.0%) | 22 (3.5%) |
| 60 to 64 Years | 46 (5.9%) | 47 (7.6%) |
| 65 to 69 Years | 68 (8.8%) | 6 (1.0%) |
| 70 to 74 Years | 9 (1.2%) | 26 (4.2%) |
| 75 to 79 Years | 8 (1.0%) | 23 (3.7%) |
| 80 to 84 Years | 35 (4.5%) | 15 (2.4%) |
| 85 Years and over | 0 (0.0%) | 0 (0.0%) |
| Total | 775 (100.0%) | 620 (100.0%) |
Families and Households in Playita Cortada
Median Family Size in Playita Cortada
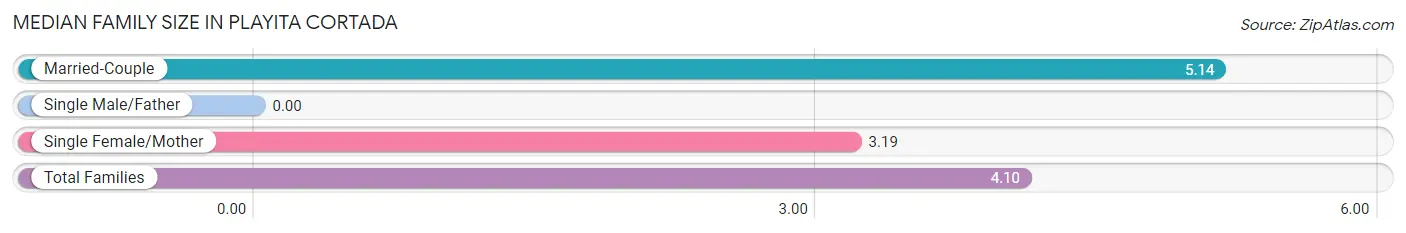
| Family Type | # Families | Family Size |
| Married-Couple | 131 (46.8%) | 5.14 |
| Single Male/Father | 0 (0.0%) | - |
| Single Female/Mother | 149 (53.2%) | 3.19 |
| Total Families | 280 (100.0%) | 4.10 |
Median Household Size in Playita Cortada
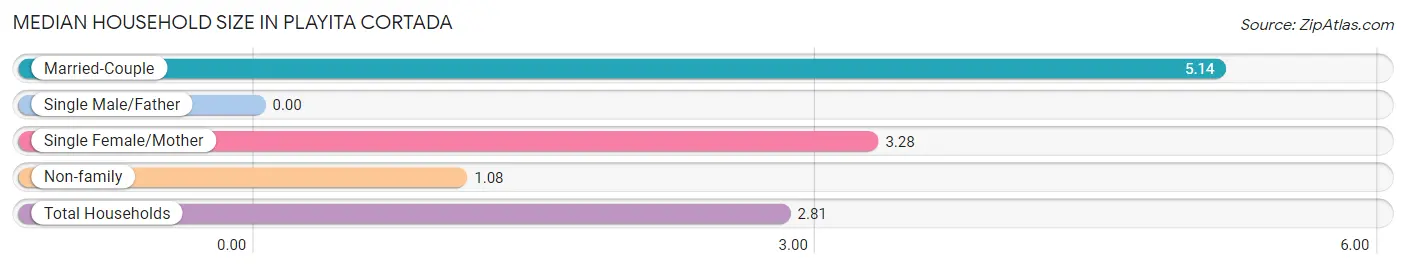
| Household Type | # Households | Household Size |
| Married-Couple | 131 (26.4%) | 5.14 |
| Single Male/Father | 0 (0.0%) | - |
| Single Female/Mother | 149 (30.0%) | 3.28 |
| Non-family | 217 (43.7%) | 1.08 |
| Total Households | 497 (100.0%) | 2.81 |
Household Size by Marriage Status in Playita Cortada
Out of a total of 497 households in Playita Cortada, 280 (56.3%) are family households, while 217 (43.7%) are nonfamily households. The most numerous type of family households are 3-person households, comprising 112, and the most common type of nonfamily households are 1-person households, comprising 204.
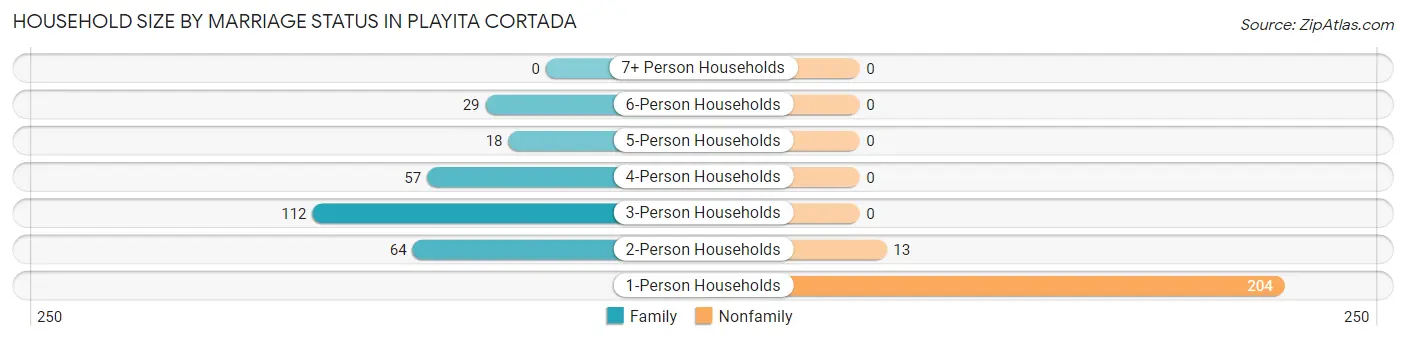
| Household Size | Family Households | Nonfamily Households |
| 1-Person Households | - | 204 (41.0%) |
| 2-Person Households | 64 (12.9%) | 13 (2.6%) |
| 3-Person Households | 112 (22.5%) | 0 (0.0%) |
| 4-Person Households | 57 (11.5%) | 0 (0.0%) |
| 5-Person Households | 18 (3.6%) | 0 (0.0%) |
| 6-Person Households | 29 (5.8%) | 0 (0.0%) |
| 7+ Person Households | 0 (0.0%) | 0 (0.0%) |
| Total | 280 (56.3%) | 217 (43.7%) |
Female Fertility in Playita Cortada
Fertility by Age in Playita Cortada
| Age Bracket | Women with Births | Births / 1,000 Women |
| 15 to 19 years | 0 (0.0%) | 0.0 |
| 20 to 34 years | 0 (0.0%) | 0.0 |
| 35 to 50 years | 0 (0.0%) | 0.0 |
| Total | 0 (0.0%) | 0.0 |
Fertility by Age by Marriage Status in Playita Cortada
| Age Bracket | Married | Unmarried |
| 15 to 19 years | 0 (0.0%) | 0 (0.0%) |
| 20 to 34 years | 0 (0.0%) | 0 (0.0%) |
| 35 to 50 years | 0 (0.0%) | 0 (0.0%) |
| Total | 0 (0.0%) | 0 (0.0%) |
Fertility by Education in Playita Cortada
| Educational Attainment | Women with Births | Births / 1,000 Women |
| Less than High School | 0 (0.0%) | 0.0 |
| High School Diploma | 0 (0.0%) | 0.0 |
| College or Associate's Degree | 0 (0.0%) | 0.0 |
| Bachelor's Degree | 0 (0.0%) | 0.0 |
| Graduate Degree | 0 (0.0%) | 0.0 |
| Total | 0 (0.0%) | 0.0 |
Fertility by Education by Marriage Status in Playita Cortada
| Educational Attainment | Married | Unmarried |
| Less than High School | 0 (0.0%) | 0 (0.0%) |
| High School Diploma | 0 (0.0%) | 0 (0.0%) |
| College or Associate's Degree | 0 (0.0%) | 0 (0.0%) |
| Bachelor's Degree | 0 (0.0%) | 0 (0.0%) |
| Graduate Degree | 0 (0.0%) | 0 (0.0%) |
| Total | 0 (0.0%) | 0 (0.0%) |
Employment Characteristics in Playita Cortada
Employment by Class of Employer in Playita Cortada
Among the 263 employed individuals in Playita Cortada, private company employees (181 | 68.8%), state government employees (39 | 14.8%), and local government employees (23 | 8.7%) make up the most common classes of employment.
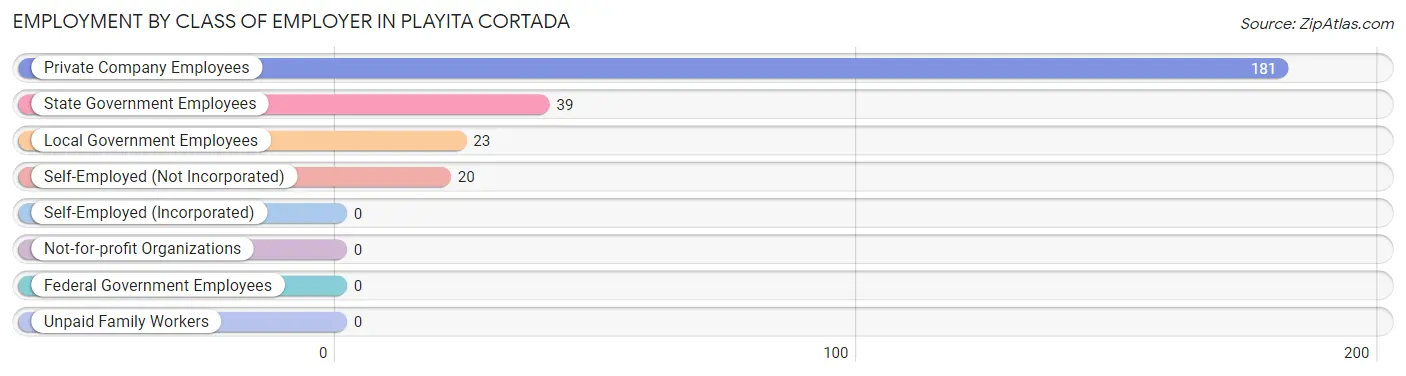
| Employer Class | # Employees | % Employees |
| Private Company Employees | 181 | 68.8% |
| Self-Employed (Incorporated) | 0 | 0.0% |
| Self-Employed (Not Incorporated) | 20 | 7.6% |
| Not-for-profit Organizations | 0 | 0.0% |
| Local Government Employees | 23 | 8.7% |
| State Government Employees | 39 | 14.8% |
| Federal Government Employees | 0 | 0.0% |
| Unpaid Family Workers | 0 | 0.0% |
| Total | 263 | 100.0% |
Employment Status by Age in Playita Cortada
According to the labor force statistics for Playita Cortada, out of the total population over 16 years of age (1,137), 32.1% or 365 individuals are in the labor force, with 22.2% or 81 of them unemployed. The age group with the highest labor force participation rate is 30 to 34 years, with 100.0% or 23 individuals in the labor force. Within the labor force, the 60 to 64 years age range has the highest percentage of unemployed individuals, with 100.0% or 18 of them being unemployed.
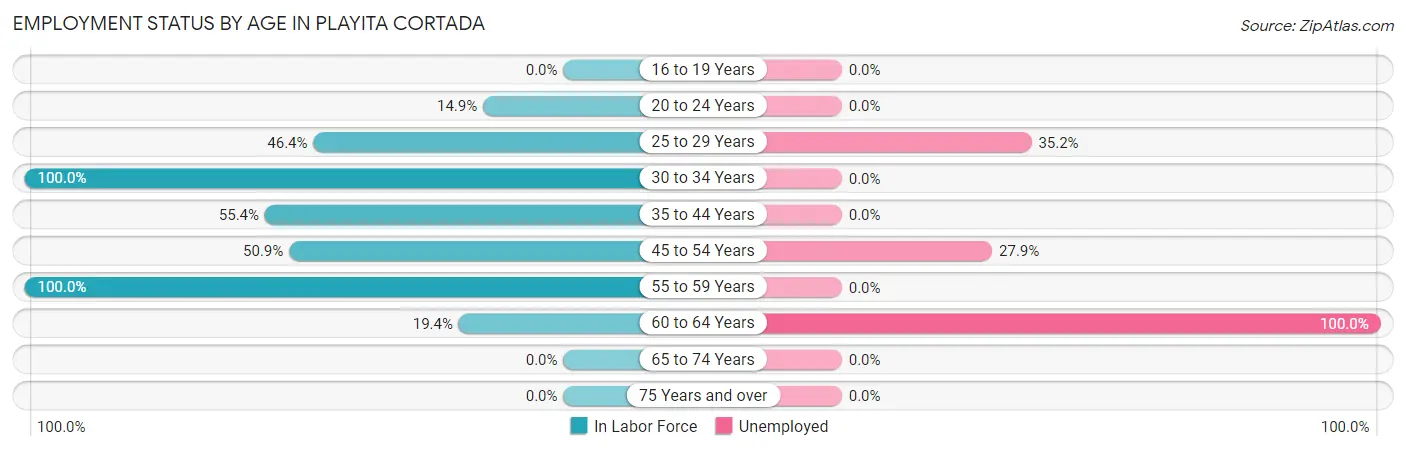
| Age Bracket | In Labor Force | Unemployed |
| 16 to 19 Years | 0 (0.0%) | 0 (0.0%) |
| 20 to 24 Years | 13 (14.9%) | 0 (0.0%) |
| 25 to 29 Years | 71 (46.4%) | 25 (35.2%) |
| 30 to 34 Years | 23 (100.0%) | 0 (0.0%) |
| 35 to 44 Years | 82 (55.4%) | 0 (0.0%) |
| 45 to 54 Years | 136 (50.9%) | 38 (27.9%) |
| 55 to 59 Years | 22 (100.0%) | 0 (0.0%) |
| 60 to 64 Years | 18 (19.4%) | 18 (100.0%) |
| 65 to 74 Years | 0 (0.0%) | 0 (0.0%) |
| 75 Years and over | 0 (0.0%) | 0 (0.0%) |
| Total | 365 (32.1%) | 81 (22.2%) |
Employment Status by Educational Attainment in Playita Cortada
According to labor force statistics for Playita Cortada, 49.9% of individuals (352) out of the total population between 25 and 64 years of age (706) are in the labor force, with 23.0% or 81 of them being unemployed. The group with the highest labor force participation rate are those with the educational attainment of bachelor's degree or higher, with 74.7% or 74 individuals in the labor force. Within the labor force, individuals with college / associate degree education have the highest percentage of unemployment, with 36.8% or 25 of them being unemployed.
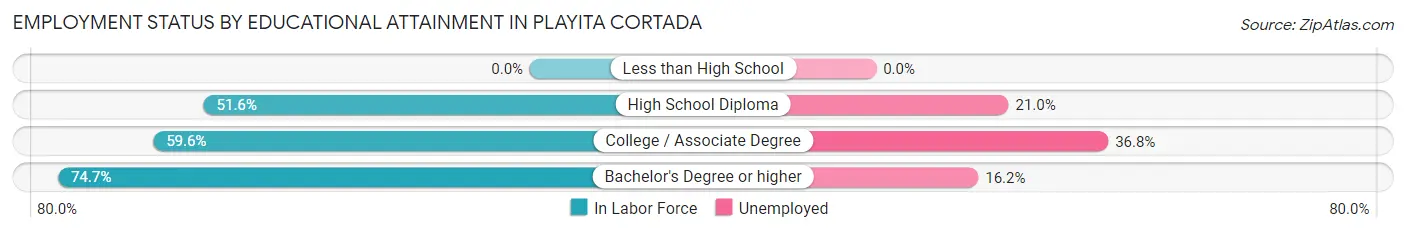
| Educational Attainment | In Labor Force | Unemployed |
| Less than High School | 0 (0.0%) | 0 (0.0%) |
| High School Diploma | 210 (51.6%) | 85 (21.0%) |
| College / Associate Degree | 68 (59.6%) | 42 (36.8%) |
| Bachelor's Degree or higher | 74 (74.7%) | 16 (16.2%) |
| Total | 352 (49.9%) | 162 (23.0%) |
Employment Occupations by Sex in Playita Cortada
Management, Business, Science and Arts Occupations
Management, Business, Science and Arts Occupations by Sex
| Occupation | Male | Female |
| Management | 0 (0.0%) | 0 (0.0%) |
| Business & Financial | 0 (0.0%) | 0 (0.0%) |
| Computers, Engineering & Science | 0 (0.0%) | 0 (0.0%) |
| Computers & Mathematics | 0 (0.0%) | 0 (0.0%) |
| Architecture & Engineering | 0 (0.0%) | 0 (0.0%) |
| Life, Physical & Social Science | 0 (0.0%) | 0 (0.0%) |
| Community & Social Service | 0 (0.0%) | 0 (0.0%) |
| Education, Arts & Media | 0 (0.0%) | 0 (0.0%) |
| Legal Services & Support | 0 (0.0%) | 0 (0.0%) |
| Education Instruction & Library | 0 (0.0%) | 0 (0.0%) |
| Arts, Media & Entertainment | 0 (0.0%) | 0 (0.0%) |
| Health Diagnosing & Treating | 0 (0.0%) | 0 (0.0%) |
| Health Technologists | 0 (0.0%) | 0 (0.0%) |
| Total (Category) | 0 (0.0%) | 0 (0.0%) |
| Total (Overall) | 158 (55.6%) | 126 (44.4%) |
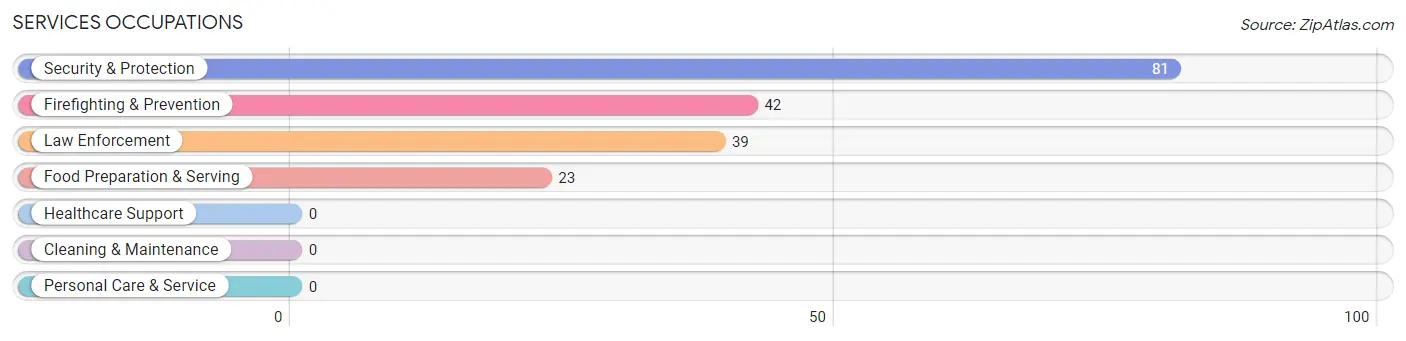
Services Occupations
The most common Services occupations in Playita Cortada are Security & Protection (81 | 28.5%), Firefighting & Prevention (42 | 14.8%), Law Enforcement (39 | 13.7%), and Food Preparation & Serving (23 | 8.1%).
Services Occupations by Sex
Within the Services occupations in Playita Cortada, the most male-oriented occupations are Law Enforcement (100.0%), and Security & Protection (48.1%), while the most female-oriented occupations are Firefighting & Prevention (100.0%), Food Preparation & Serving (100.0%), and Security & Protection (51.8%).
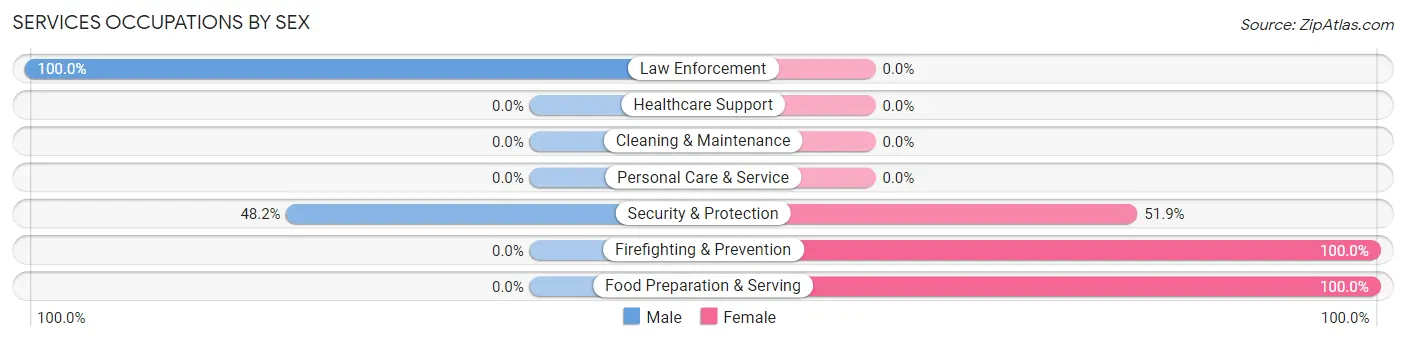
| Occupation | Male | Female |
| Healthcare Support | 0 (0.0%) | 0 (0.0%) |
| Security & Protection | 39 (48.1%) | 42 (51.8%) |
| Firefighting & Prevention | 0 (0.0%) | 42 (100.0%) |
| Law Enforcement | 39 (100.0%) | 0 (0.0%) |
| Food Preparation & Serving | 0 (0.0%) | 23 (100.0%) |
| Cleaning & Maintenance | 0 (0.0%) | 0 (0.0%) |
| Personal Care & Service | 0 (0.0%) | 0 (0.0%) |
| Total (Category) | 39 (37.5%) | 65 (62.5%) |
| Total (Overall) | 158 (55.6%) | 126 (44.4%) |
Sales and Office Occupations
The most common Sales and Office occupations in Playita Cortada are , and Office & Administration (41 | 14.4%).
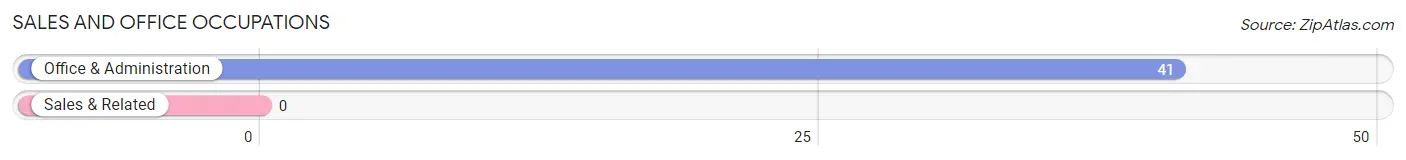
Sales and Office Occupations by Sex
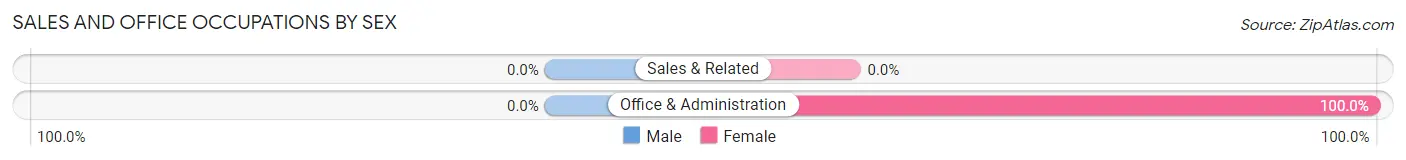
| Occupation | Male | Female |
| Sales & Related | 0 (0.0%) | 0 (0.0%) |
| Office & Administration | 0 (0.0%) | 41 (100.0%) |
| Total (Category) | 0 (0.0%) | 41 (100.0%) |
| Total (Overall) | 158 (55.6%) | 126 (44.4%) |
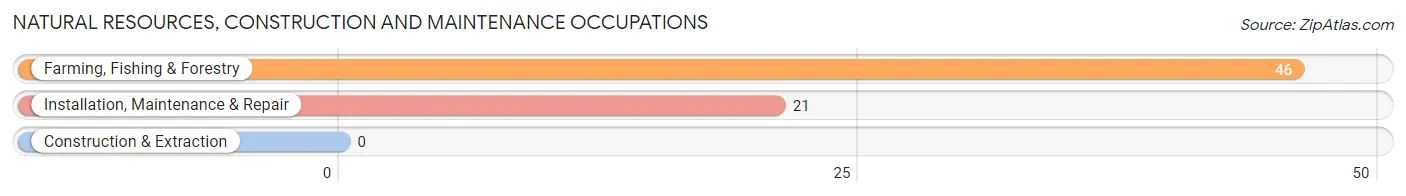
Natural Resources, Construction and Maintenance Occupations
The most common Natural Resources, Construction and Maintenance occupations in Playita Cortada are Farming, Fishing & Forestry (46 | 16.2%), and Installation, Maintenance & Repair (21 | 7.4%).
Natural Resources, Construction and Maintenance Occupations by Sex
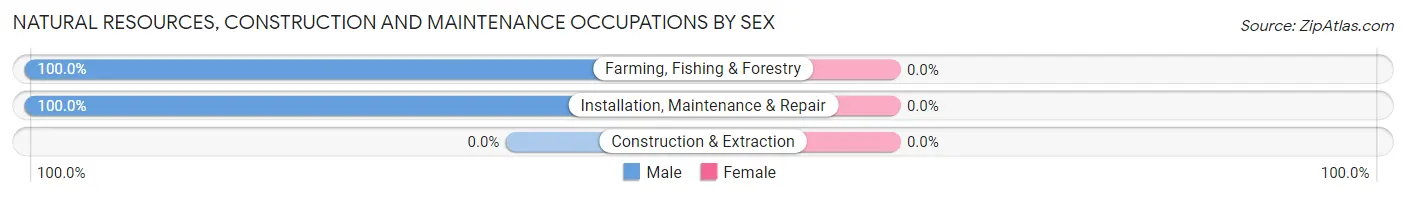
| Occupation | Male | Female |
| Farming, Fishing & Forestry | 46 (100.0%) | 0 (0.0%) |
| Construction & Extraction | 0 (0.0%) | 0 (0.0%) |
| Installation, Maintenance & Repair | 21 (100.0%) | 0 (0.0%) |
| Total (Category) | 67 (100.0%) | 0 (0.0%) |
| Total (Overall) | 158 (55.6%) | 126 (44.4%) |
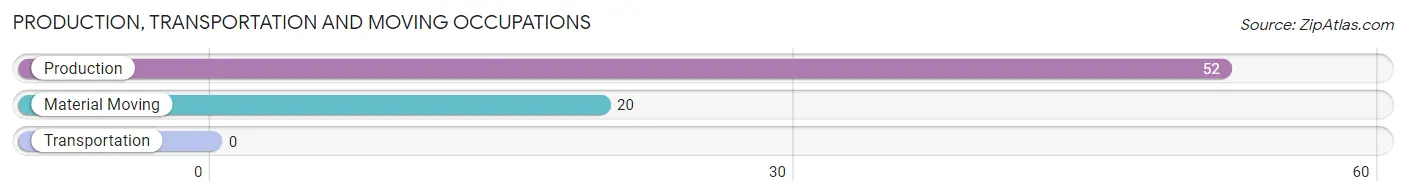
Production, Transportation and Moving Occupations
The most common Production, Transportation and Moving occupations in Playita Cortada are Production (52 | 18.3%), and Material Moving (20 | 7.0%).
Production, Transportation and Moving Occupations by Sex
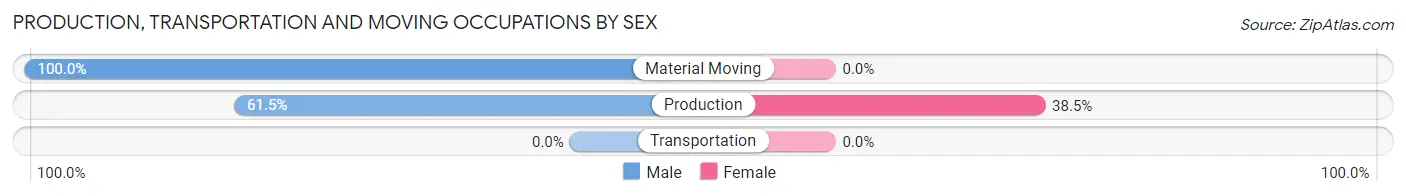
| Occupation | Male | Female |
| Production | 32 (61.5%) | 20 (38.5%) |
| Transportation | 0 (0.0%) | 0 (0.0%) |
| Material Moving | 20 (100.0%) | 0 (0.0%) |
| Total (Category) | 52 (72.2%) | 20 (27.8%) |
| Total (Overall) | 158 (55.6%) | 126 (44.4%) |
Employment Industries by Sex in Playita Cortada
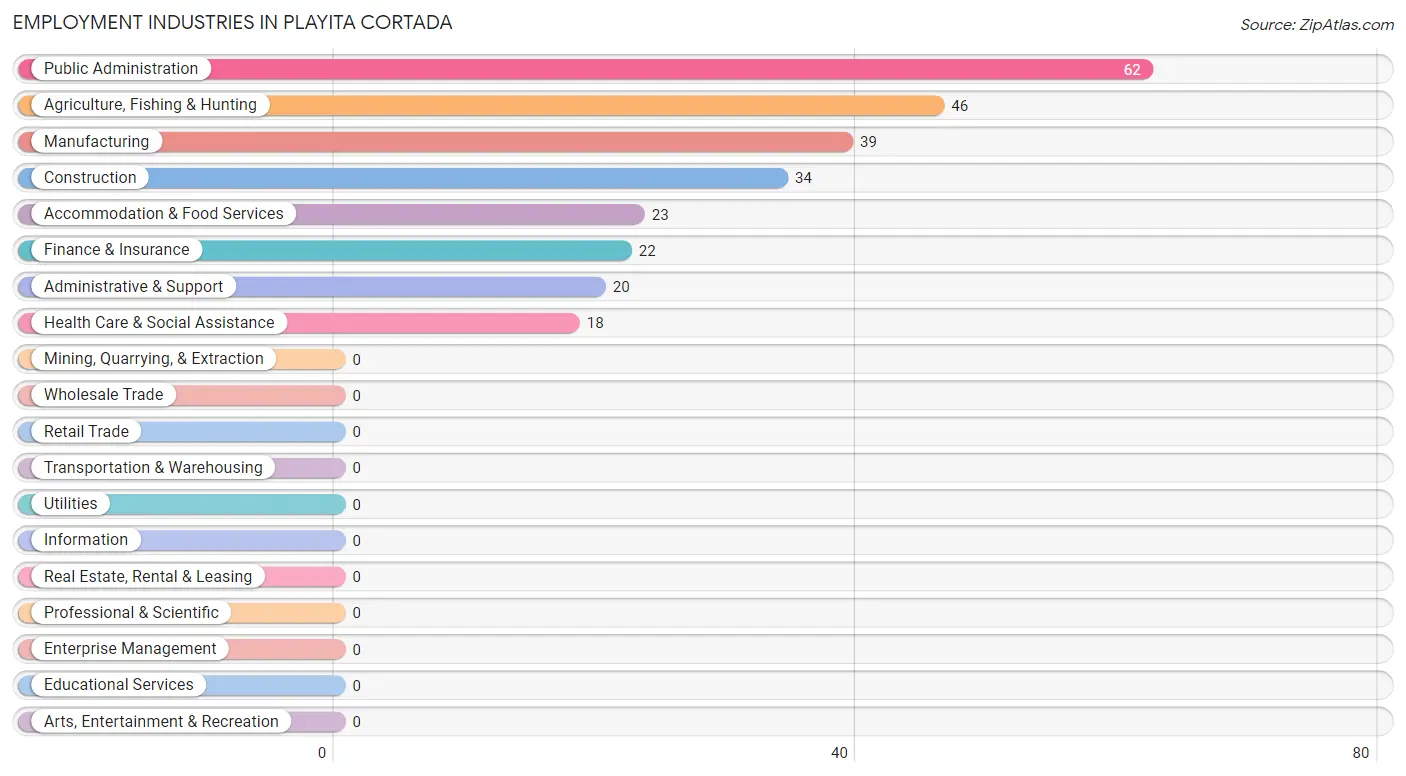
Employment Industries in Playita Cortada
The major employment industries in Playita Cortada include Public Administration (62 | 21.8%), Agriculture, Fishing & Hunting (46 | 16.2%), Manufacturing (39 | 13.7%), Construction (34 | 12.0%), and Accommodation & Food Services (23 | 8.1%).
Employment Industries by Sex in Playita Cortada
The Playita Cortada industries that see more men than women are Agriculture, Fishing & Hunting (100.0%), Construction (100.0%), and Public Administration (62.9%), whereas the industries that tend to have a higher number of women are Finance & Insurance (100.0%), Administrative & Support (100.0%), and Health Care & Social Assistance (100.0%).
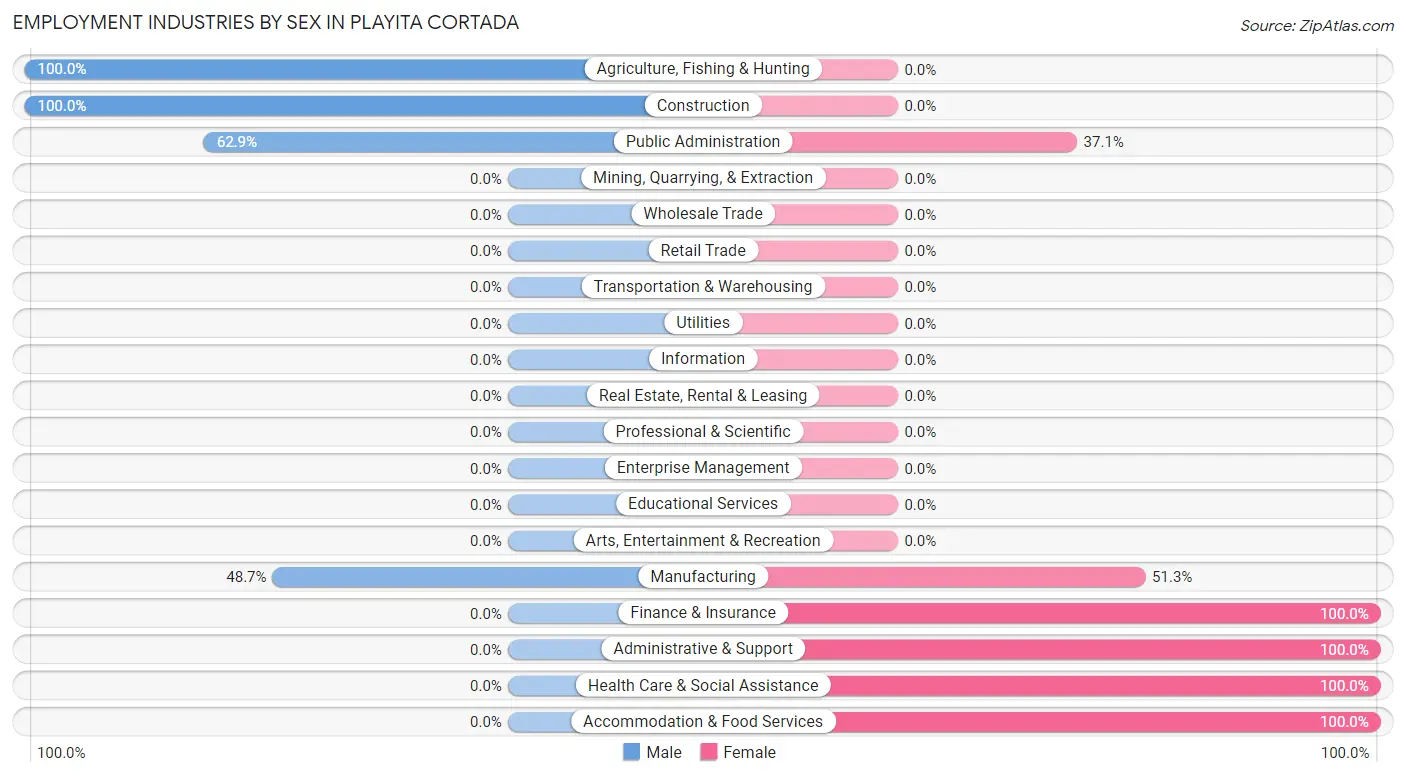
| Industry | Male | Female |
| Agriculture, Fishing & Hunting | 46 (100.0%) | 0 (0.0%) |
| Mining, Quarrying, & Extraction | 0 (0.0%) | 0 (0.0%) |
| Construction | 34 (100.0%) | 0 (0.0%) |
| Manufacturing | 19 (48.7%) | 20 (51.3%) |
| Wholesale Trade | 0 (0.0%) | 0 (0.0%) |
| Retail Trade | 0 (0.0%) | 0 (0.0%) |
| Transportation & Warehousing | 0 (0.0%) | 0 (0.0%) |
| Utilities | 0 (0.0%) | 0 (0.0%) |
| Information | 0 (0.0%) | 0 (0.0%) |
| Finance & Insurance | 0 (0.0%) | 22 (100.0%) |
| Real Estate, Rental & Leasing | 0 (0.0%) | 0 (0.0%) |
| Professional & Scientific | 0 (0.0%) | 0 (0.0%) |
| Enterprise Management | 0 (0.0%) | 0 (0.0%) |
| Administrative & Support | 0 (0.0%) | 20 (100.0%) |
| Educational Services | 0 (0.0%) | 0 (0.0%) |
| Health Care & Social Assistance | 0 (0.0%) | 18 (100.0%) |
| Arts, Entertainment & Recreation | 0 (0.0%) | 0 (0.0%) |
| Accommodation & Food Services | 0 (0.0%) | 23 (100.0%) |
| Public Administration | 39 (62.9%) | 23 (37.1%) |
| Total | 158 (55.6%) | 126 (44.4%) |
Education in Playita Cortada
School Enrollment in Playita Cortada
The most common levels of schooling among the 322 students in Playita Cortada are high school (105 | 32.6%), middle school (88 | 27.3%), and elementary school (81 | 25.2%).
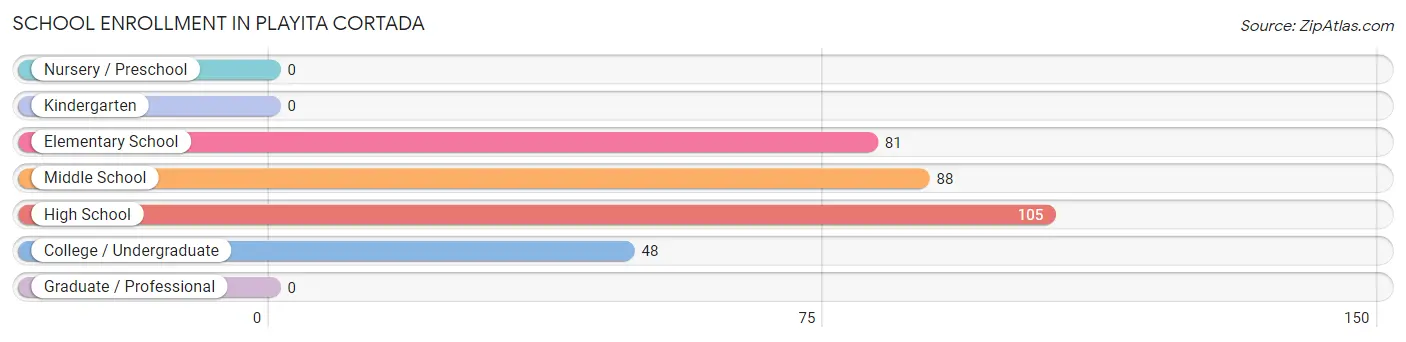
| School Level | # Students | % Students |
| Nursery / Preschool | 0 | 0.0% |
| Kindergarten | 0 | 0.0% |
| Elementary School | 81 | 25.2% |
| Middle School | 88 | 27.3% |
| High School | 105 | 32.6% |
| College / Undergraduate | 48 | 14.9% |
| Graduate / Professional | 0 | 0.0% |
| Total | 322 | 100.0% |
School Enrollment by Age by Funding Source in Playita Cortada
Out of a total of 322 students who are enrolled in schools in Playita Cortada, 36 (11.2%) attend a private institution, while the remaining 286 (88.8%) are enrolled in public schools. The age group of 18 to 19 year olds has the highest likelihood of being enrolled in private schools, with 36 (44.4% in the age bracket) enrolled. Conversely, the age group of 5 to 9 year old has the lowest likelihood of being enrolled in a private school, with 81 (100.0% in the age bracket) attending a public institution.
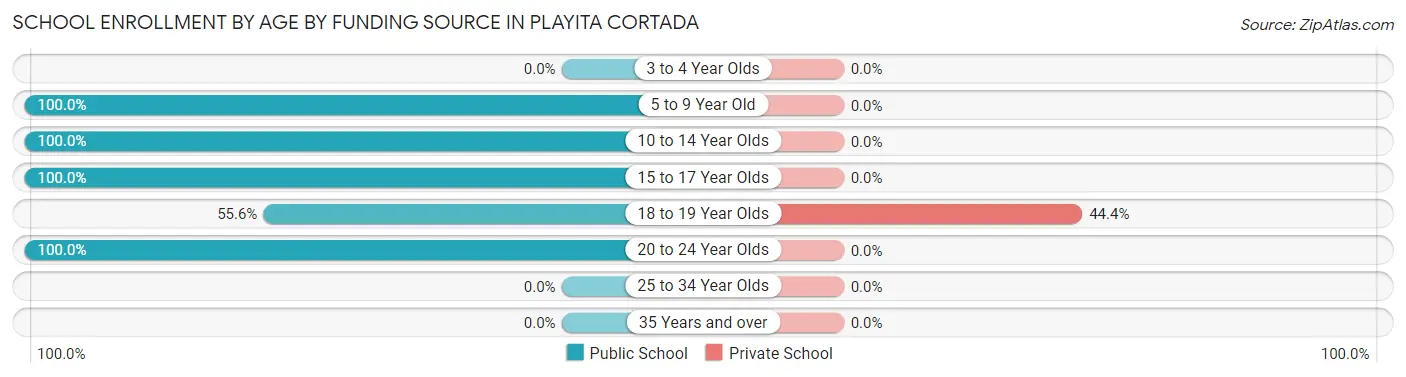
| Age Bracket | Public School | Private School |
| 3 to 4 Year Olds | 0 (0.0%) | 0 (0.0%) |
| 5 to 9 Year Old | 81 (100.0%) | 0 (0.0%) |
| 10 to 14 Year Olds | 114 (100.0%) | 0 (0.0%) |
| 15 to 17 Year Olds | 35 (100.0%) | 0 (0.0%) |
| 18 to 19 Year Olds | 45 (55.6%) | 36 (44.4%) |
| 20 to 24 Year Olds | 11 (100.0%) | 0 (0.0%) |
| 25 to 34 Year Olds | 0 (0.0%) | 0 (0.0%) |
| 35 Years and over | 0 (0.0%) | 0 (0.0%) |
| Total | 286 (88.8%) | 36 (11.2%) |
Educational Attainment by Field of Study in Playita Cortada
Computers & mathematics (25 | 23.8%), business (25 | 23.8%), science & technology (23 | 21.9%), psychology (20 | 19.1%), and education (12 | 11.4%) are the most common fields of study among 105 individuals in Playita Cortada who have obtained a bachelor's degree or higher.
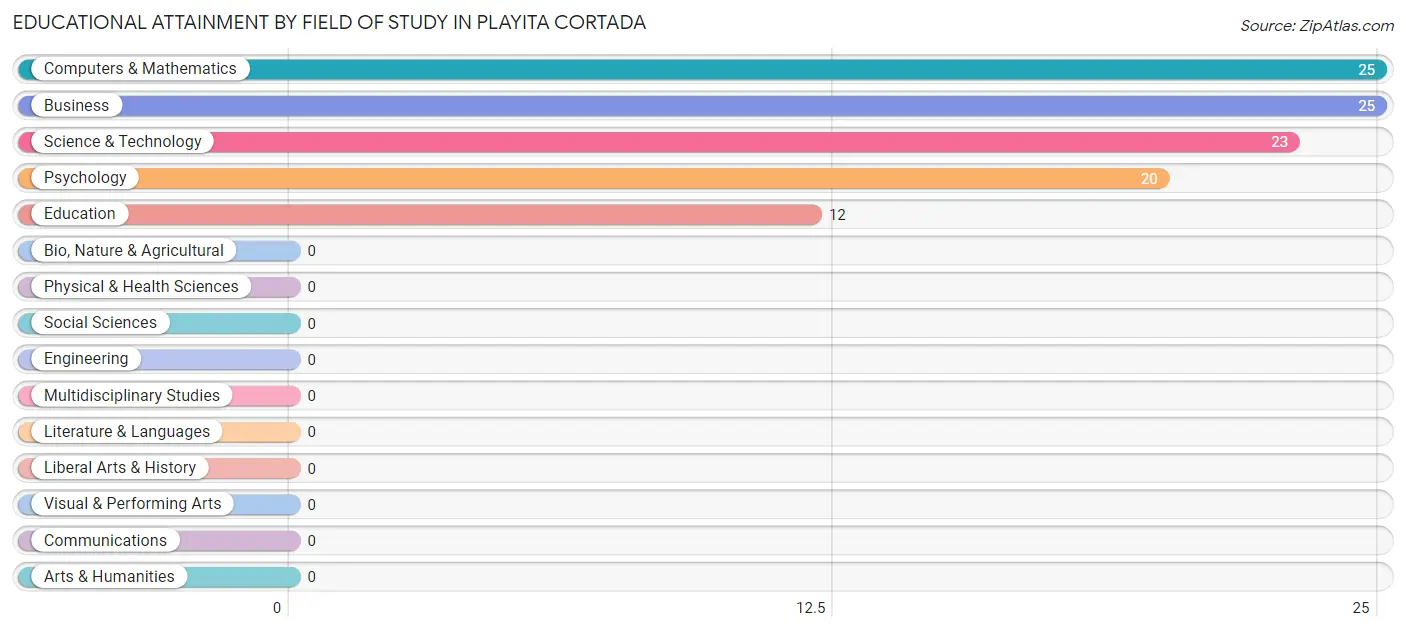
| Field of Study | # Graduates | % Graduates |
| Computers & Mathematics | 25 | 23.8% |
| Bio, Nature & Agricultural | 0 | 0.0% |
| Physical & Health Sciences | 0 | 0.0% |
| Psychology | 20 | 19.1% |
| Social Sciences | 0 | 0.0% |
| Engineering | 0 | 0.0% |
| Multidisciplinary Studies | 0 | 0.0% |
| Science & Technology | 23 | 21.9% |
| Business | 25 | 23.8% |
| Education | 12 | 11.4% |
| Literature & Languages | 0 | 0.0% |
| Liberal Arts & History | 0 | 0.0% |
| Visual & Performing Arts | 0 | 0.0% |
| Communications | 0 | 0.0% |
| Arts & Humanities | 0 | 0.0% |
| Total | 105 | 100.0% |
Transportation & Commute in Playita Cortada
Vehicle Availability by Sex in Playita Cortada
The most prevalent vehicle ownership categories in Playita Cortada are males with 2 vehicles (59, accounting for 43.1%) and females with 2 vehicles (0, making up 46.8%).
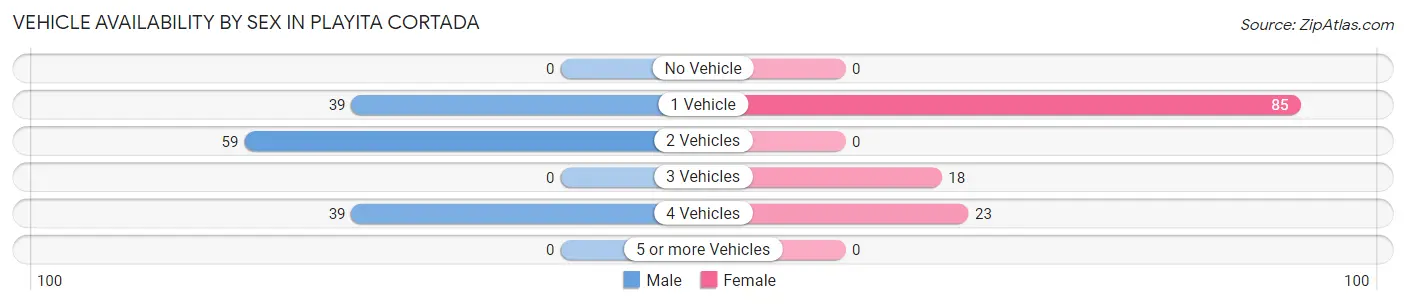
| Vehicles Available | Male | Female |
| No Vehicle | 0 (0.0%) | 0 (0.0%) |
| 1 Vehicle | 39 (28.5%) | 85 (67.5%) |
| 2 Vehicles | 59 (43.1%) | 0 (0.0%) |
| 3 Vehicles | 0 (0.0%) | 18 (14.3%) |
| 4 Vehicles | 39 (28.5%) | 23 (18.2%) |
| 5 or more Vehicles | 0 (0.0%) | 0 (0.0%) |
| Total | 137 (100.0%) | 126 (100.0%) |
Commute Time in Playita Cortada
The most frequently occuring commute durations in Playita Cortada are 30 to 34 minutes (115 commuters, 43.7%), 15 to 19 minutes (69 commuters, 26.2%), and 40 to 44 minutes (39 commuters, 14.8%).
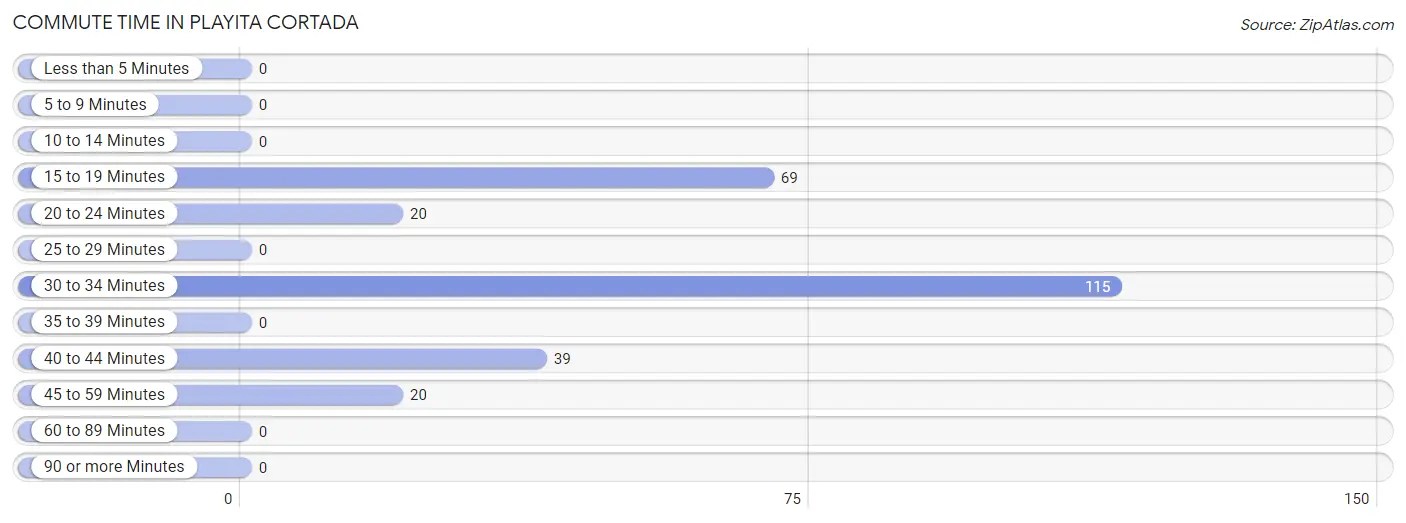
| Commute Time | # Commuters | % Commuters |
| Less than 5 Minutes | 0 | 0.0% |
| 5 to 9 Minutes | 0 | 0.0% |
| 10 to 14 Minutes | 0 | 0.0% |
| 15 to 19 Minutes | 69 | 26.2% |
| 20 to 24 Minutes | 20 | 7.6% |
| 25 to 29 Minutes | 0 | 0.0% |
| 30 to 34 Minutes | 115 | 43.7% |
| 35 to 39 Minutes | 0 | 0.0% |
| 40 to 44 Minutes | 39 | 14.8% |
| 45 to 59 Minutes | 20 | 7.6% |
| 60 to 89 Minutes | 0 | 0.0% |
| 90 or more Minutes | 0 | 0.0% |
Commute Time by Sex in Playita Cortada
The most common commute times in Playita Cortada are 15 to 19 minutes (46 commuters, 33.6%) for males and 30 to 34 minutes (83 commuters, 65.9%) for females.
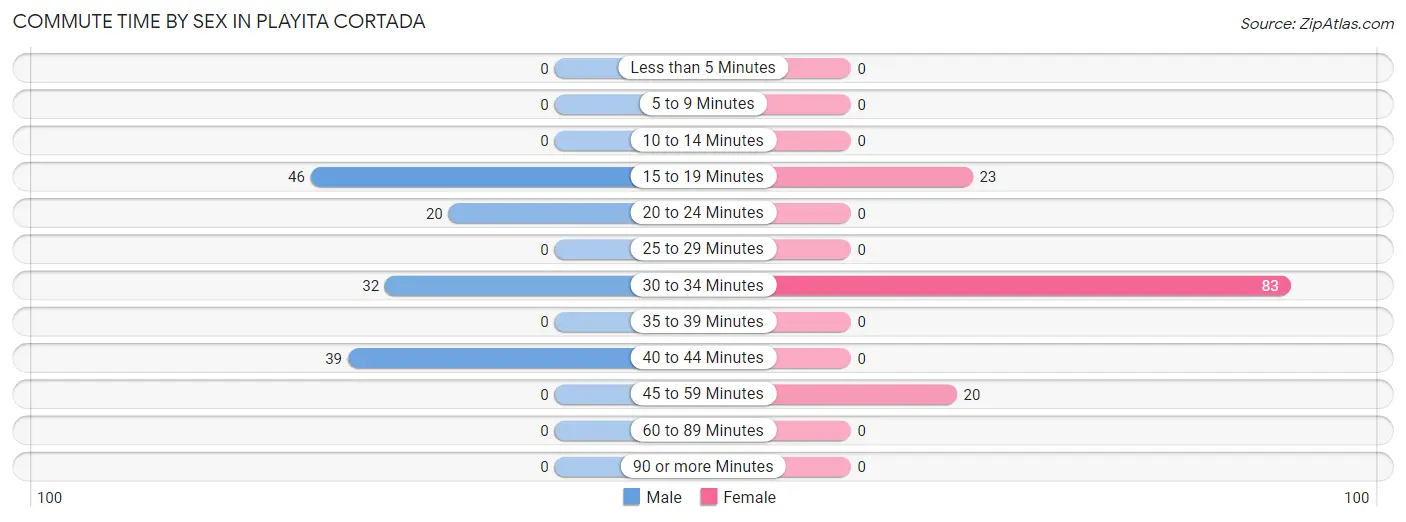
| Commute Time | Male | Female |
| Less than 5 Minutes | 0 (0.0%) | 0 (0.0%) |
| 5 to 9 Minutes | 0 (0.0%) | 0 (0.0%) |
| 10 to 14 Minutes | 0 (0.0%) | 0 (0.0%) |
| 15 to 19 Minutes | 46 (33.6%) | 23 (18.2%) |
| 20 to 24 Minutes | 20 (14.6%) | 0 (0.0%) |
| 25 to 29 Minutes | 0 (0.0%) | 0 (0.0%) |
| 30 to 34 Minutes | 32 (23.4%) | 83 (65.9%) |
| 35 to 39 Minutes | 0 (0.0%) | 0 (0.0%) |
| 40 to 44 Minutes | 39 (28.5%) | 0 (0.0%) |
| 45 to 59 Minutes | 0 (0.0%) | 20 (15.9%) |
| 60 to 89 Minutes | 0 (0.0%) | 0 (0.0%) |
| 90 or more Minutes | 0 (0.0%) | 0 (0.0%) |
Time of Departure to Work by Sex in Playita Cortada
The most frequent times of departure to work in Playita Cortada are 6:00 AM to 6:29 AM (59, 43.1%) for males and 7:30 AM to 7:59 AM (41, 32.5%) for females.
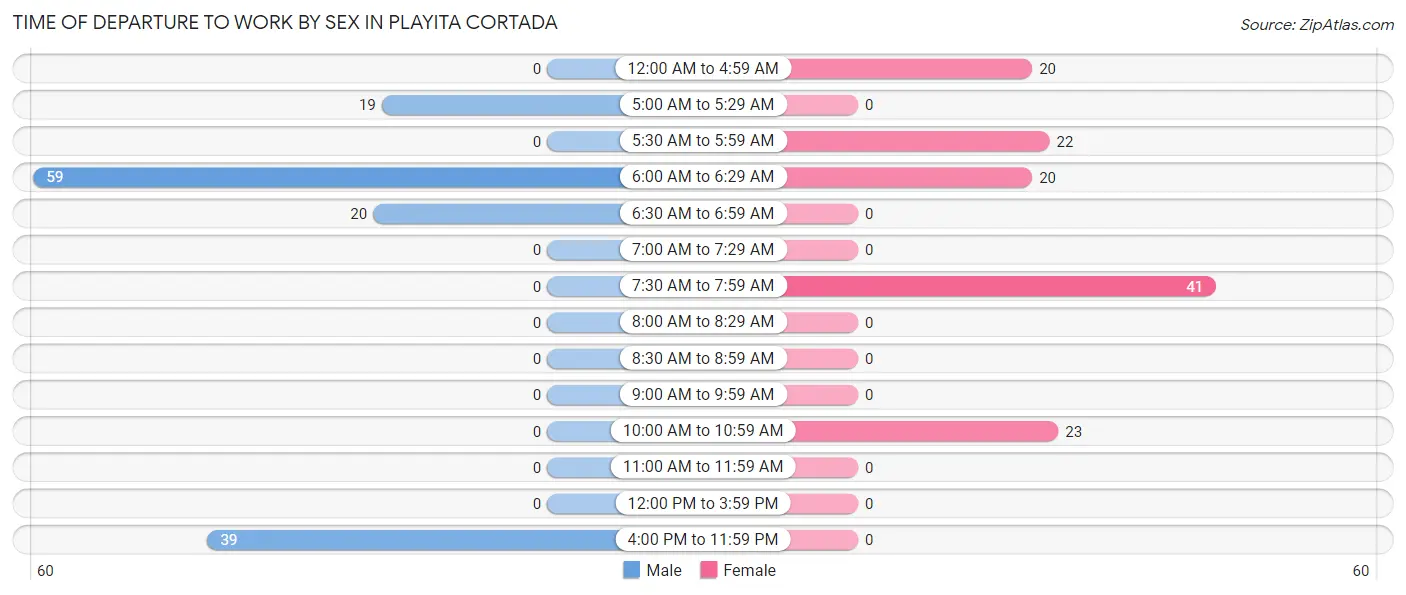
| Time of Departure | Male | Female |
| 12:00 AM to 4:59 AM | 0 (0.0%) | 20 (15.9%) |
| 5:00 AM to 5:29 AM | 19 (13.9%) | 0 (0.0%) |
| 5:30 AM to 5:59 AM | 0 (0.0%) | 22 (17.5%) |
| 6:00 AM to 6:29 AM | 59 (43.1%) | 20 (15.9%) |
| 6:30 AM to 6:59 AM | 20 (14.6%) | 0 (0.0%) |
| 7:00 AM to 7:29 AM | 0 (0.0%) | 0 (0.0%) |
| 7:30 AM to 7:59 AM | 0 (0.0%) | 41 (32.5%) |
| 8:00 AM to 8:29 AM | 0 (0.0%) | 0 (0.0%) |
| 8:30 AM to 8:59 AM | 0 (0.0%) | 0 (0.0%) |
| 9:00 AM to 9:59 AM | 0 (0.0%) | 0 (0.0%) |
| 10:00 AM to 10:59 AM | 0 (0.0%) | 23 (18.2%) |
| 11:00 AM to 11:59 AM | 0 (0.0%) | 0 (0.0%) |
| 12:00 PM to 3:59 PM | 0 (0.0%) | 0 (0.0%) |
| 4:00 PM to 11:59 PM | 39 (28.5%) | 0 (0.0%) |
| Total | 137 (100.0%) | 126 (100.0%) |
Housing Occupancy in Playita Cortada
Occupancy by Ownership in Playita Cortada
Of the total 497 dwellings in Playita Cortada, owner-occupied units account for 377 (75.9%), while renter-occupied units make up 120 (24.1%).
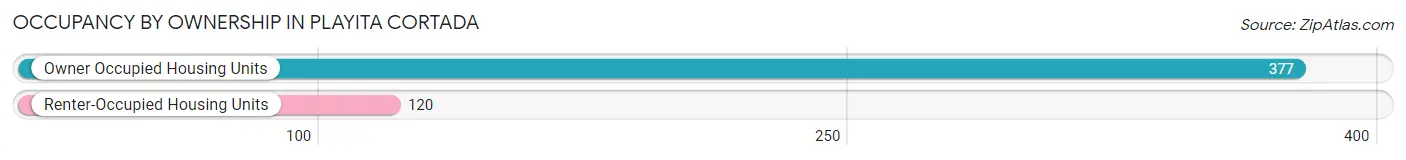
| Occupancy | # Housing Units | % Housing Units |
| Owner Occupied Housing Units | 377 | 75.9% |
| Renter-Occupied Housing Units | 120 | 24.1% |
| Total Occupied Housing Units | 497 | 100.0% |
Occupancy by Household Size in Playita Cortada
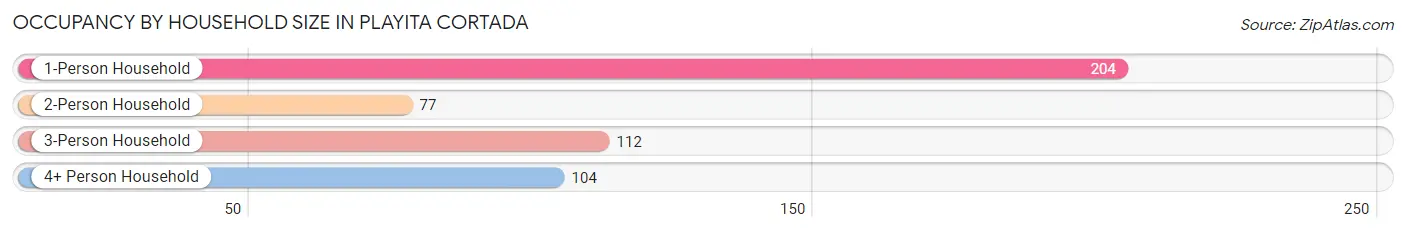
| Household Size | # Housing Units | % Housing Units |
| 1-Person Household | 204 | 41.0% |
| 2-Person Household | 77 | 15.5% |
| 3-Person Household | 112 | 22.5% |
| 4+ Person Household | 104 | 20.9% |
| Total Housing Units | 497 | 100.0% |
Occupancy by Ownership by Household Size in Playita Cortada
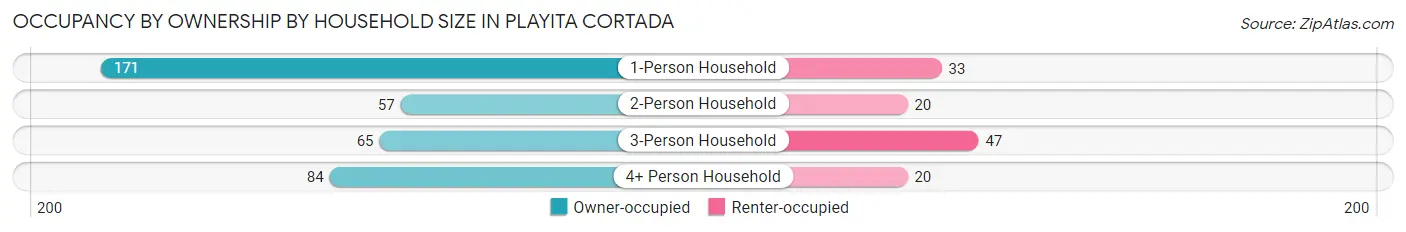
| Household Size | Owner-occupied | Renter-occupied |
| 1-Person Household | 171 (83.8%) | 33 (16.2%) |
| 2-Person Household | 57 (74.0%) | 20 (26.0%) |
| 3-Person Household | 65 (58.0%) | 47 (42.0%) |
| 4+ Person Household | 84 (80.8%) | 20 (19.2%) |
| Total Housing Units | 377 (75.9%) | 120 (24.1%) |
Occupancy by Educational Attainment in Playita Cortada
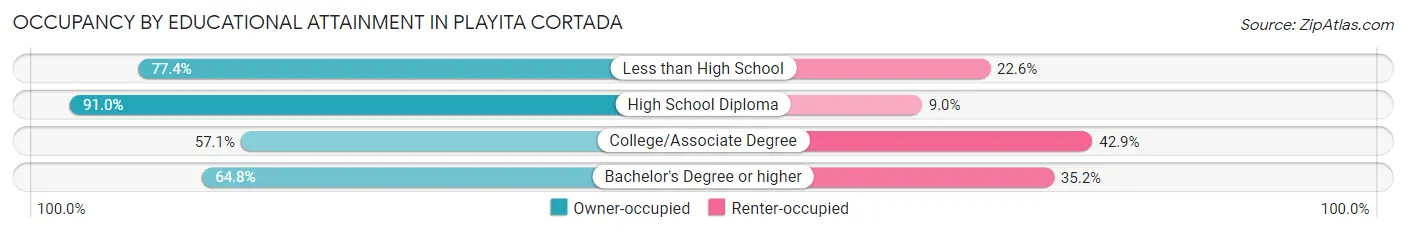
| Household Size | Owner-occupied | Renter-occupied |
| Less than High School | 96 (77.4%) | 28 (22.6%) |
| High School Diploma | 161 (91.0%) | 16 (9.0%) |
| College/Associate Degree | 52 (57.1%) | 39 (42.9%) |
| Bachelor's Degree or higher | 68 (64.8%) | 37 (35.2%) |
Occupancy by Age of Householder in Playita Cortada
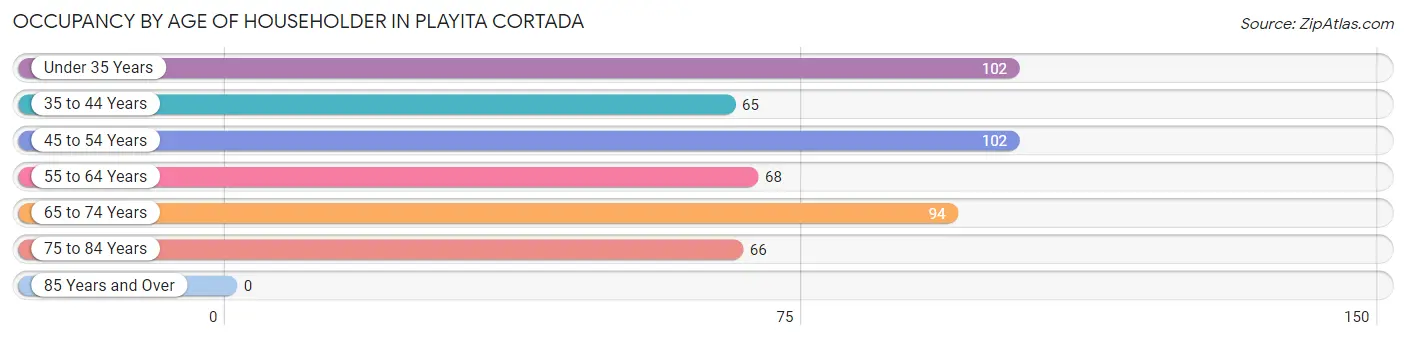
| Age Bracket | # Households | % Households |
| Under 35 Years | 102 | 20.5% |
| 35 to 44 Years | 65 | 13.1% |
| 45 to 54 Years | 102 | 20.5% |
| 55 to 64 Years | 68 | 13.7% |
| 65 to 74 Years | 94 | 18.9% |
| 75 to 84 Years | 66 | 13.3% |
| 85 Years and Over | 0 | 0.0% |
| Total | 497 | 100.0% |
Housing Finances in Playita Cortada
Median Income by Occupancy in Playita Cortada
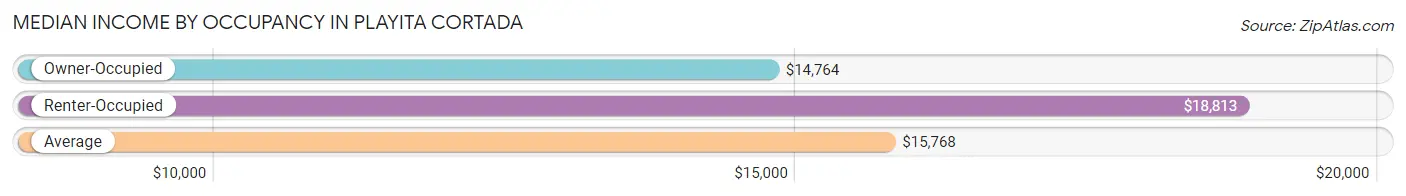
| Occupancy Type | # Households | Median Income |
| Owner-Occupied | 377 (75.9%) | $14,764 |
| Renter-Occupied | 120 (24.1%) | $18,813 |
| Average | 497 (100.0%) | $15,768 |
Occupancy by Householder Income Bracket in Playita Cortada
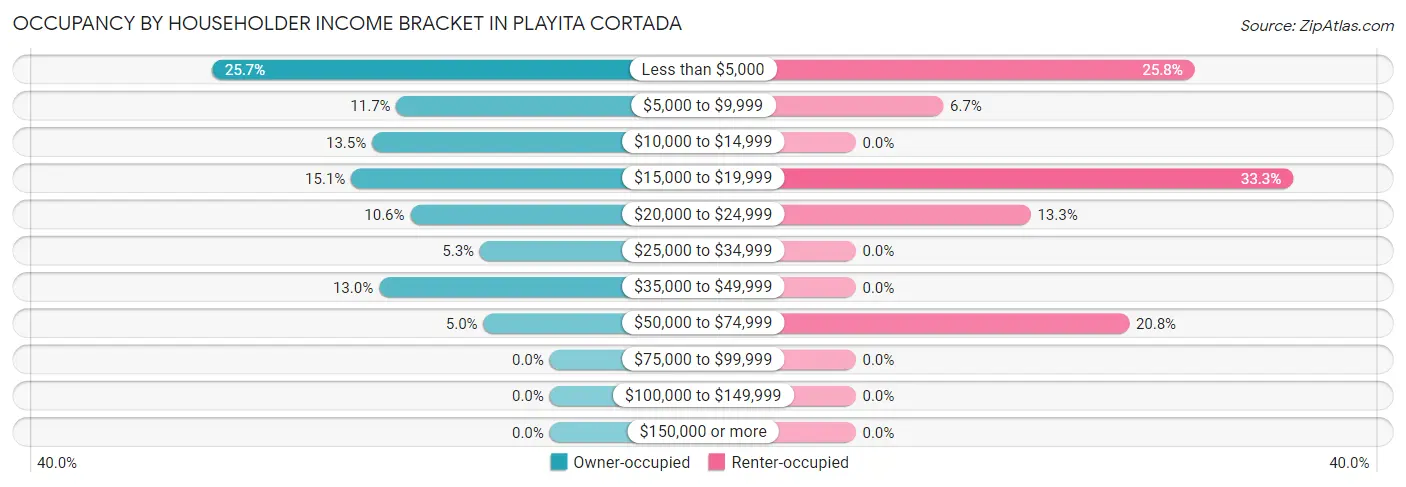
| Income Bracket | Owner-occupied | Renter-occupied |
| Less than $5,000 | 97 (25.7%) | 31 (25.8%) |
| $5,000 to $9,999 | 44 (11.7%) | 8 (6.7%) |
| $10,000 to $14,999 | 51 (13.5%) | 0 (0.0%) |
| $15,000 to $19,999 | 57 (15.1%) | 40 (33.3%) |
| $20,000 to $24,999 | 40 (10.6%) | 16 (13.3%) |
| $25,000 to $34,999 | 20 (5.3%) | 0 (0.0%) |
| $35,000 to $49,999 | 49 (13.0%) | 0 (0.0%) |
| $50,000 to $74,999 | 19 (5.0%) | 25 (20.8%) |
| $75,000 to $99,999 | 0 (0.0%) | 0 (0.0%) |
| $100,000 to $149,999 | 0 (0.0%) | 0 (0.0%) |
| $150,000 or more | 0 (0.0%) | 0 (0.0%) |
| Total | 377 (100.0%) | 120 (100.0%) |
Monthly Housing Cost Tiers in Playita Cortada
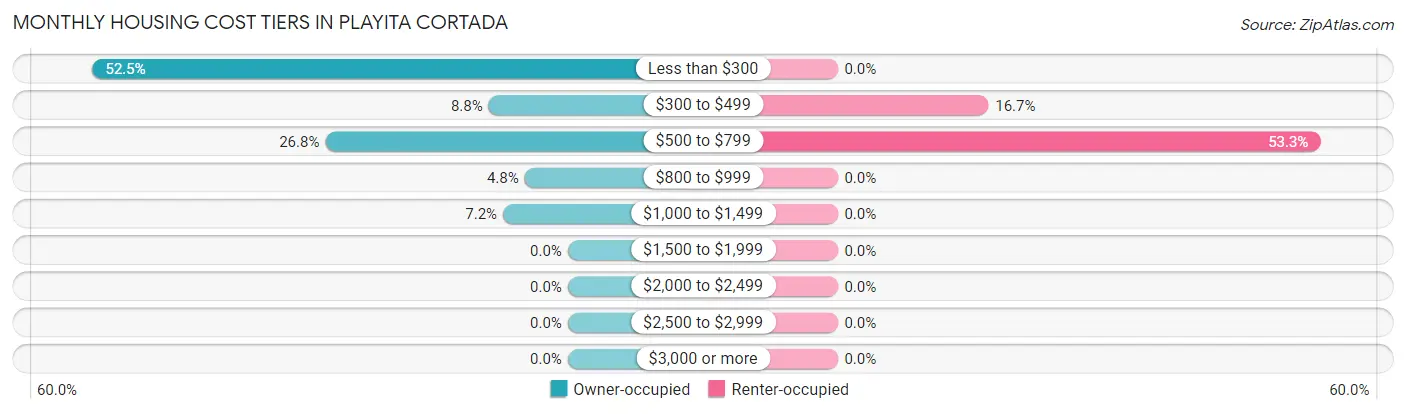
| Monthly Cost | Owner-occupied | Renter-occupied |
| Less than $300 | 198 (52.5%) | 0 (0.0%) |
| $300 to $499 | 33 (8.7%) | 20 (16.7%) |
| $500 to $799 | 101 (26.8%) | 64 (53.3%) |
| $800 to $999 | 18 (4.8%) | 0 (0.0%) |
| $1,000 to $1,499 | 27 (7.2%) | 0 (0.0%) |
| $1,500 to $1,999 | 0 (0.0%) | 0 (0.0%) |
| $2,000 to $2,499 | 0 (0.0%) | 0 (0.0%) |
| $2,500 to $2,999 | 0 (0.0%) | 0 (0.0%) |
| $3,000 or more | 0 (0.0%) | 0 (0.0%) |
| Total | 377 (100.0%) | 120 (100.0%) |
Physical Housing Characteristics in Playita Cortada
Housing Structures in Playita Cortada
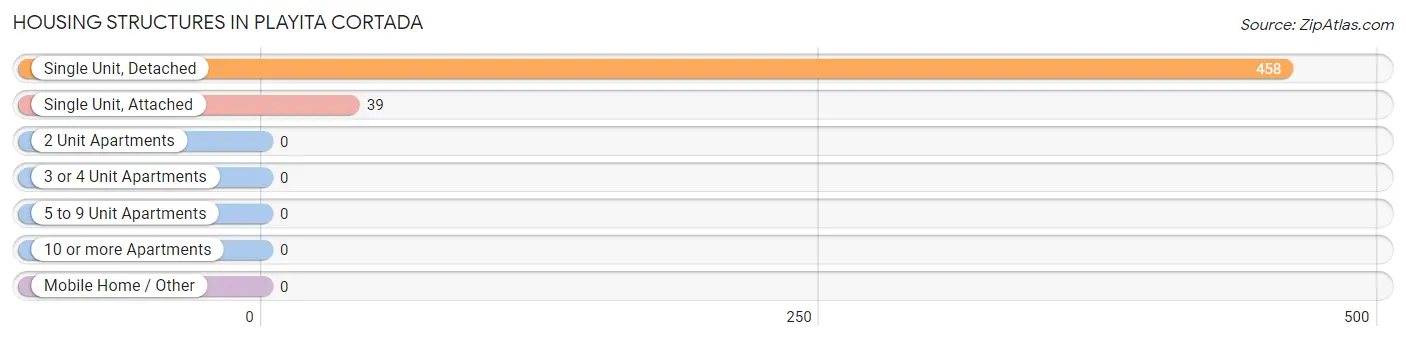
| Structure Type | # Housing Units | % Housing Units |
| Single Unit, Detached | 458 | 92.1% |
| Single Unit, Attached | 39 | 7.9% |
| 2 Unit Apartments | 0 | 0.0% |
| 3 or 4 Unit Apartments | 0 | 0.0% |
| 5 to 9 Unit Apartments | 0 | 0.0% |
| 10 or more Apartments | 0 | 0.0% |
| Mobile Home / Other | 0 | 0.0% |
| Total | 497 | 100.0% |
Housing Structures by Occupancy in Playita Cortada
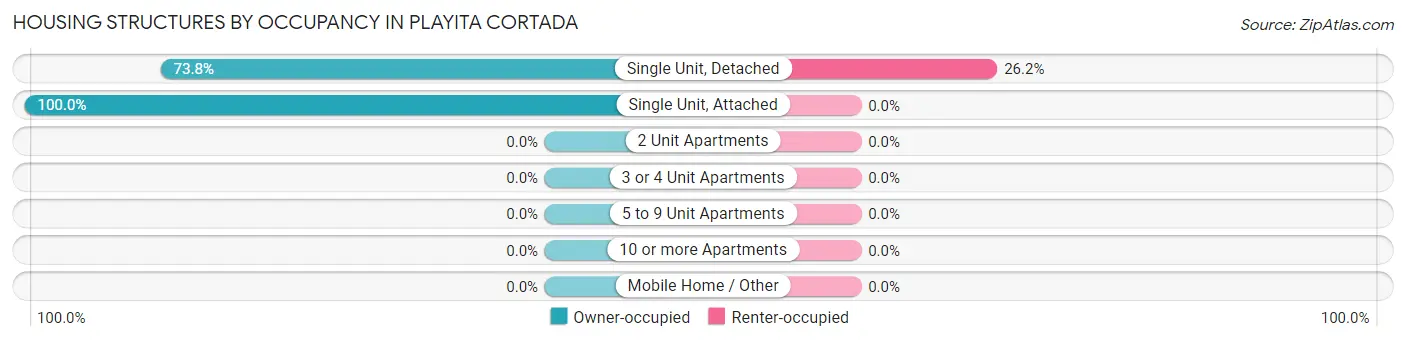
| Structure Type | Owner-occupied | Renter-occupied |
| Single Unit, Detached | 338 (73.8%) | 120 (26.2%) |
| Single Unit, Attached | 39 (100.0%) | 0 (0.0%) |
| 2 Unit Apartments | 0 (0.0%) | 0 (0.0%) |
| 3 or 4 Unit Apartments | 0 (0.0%) | 0 (0.0%) |
| 5 to 9 Unit Apartments | 0 (0.0%) | 0 (0.0%) |
| 10 or more Apartments | 0 (0.0%) | 0 (0.0%) |
| Mobile Home / Other | 0 (0.0%) | 0 (0.0%) |
| Total | 377 (75.9%) | 120 (24.1%) |
Housing Structures by Number of Rooms in Playita Cortada
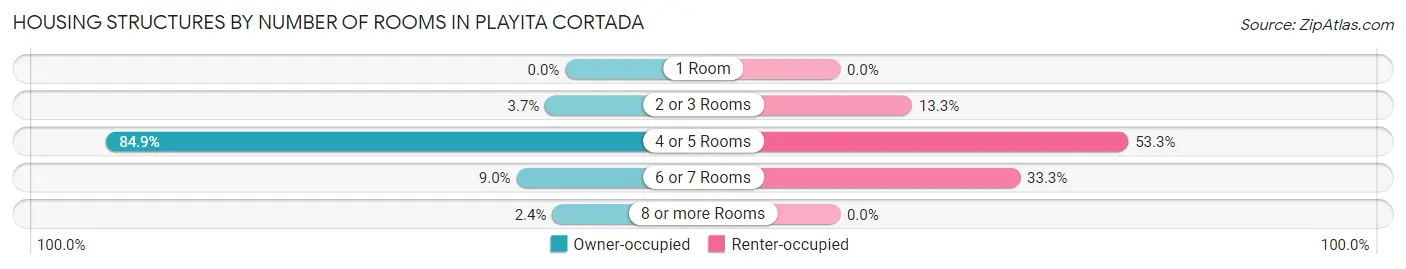
| Number of Rooms | Owner-occupied | Renter-occupied |
| 1 Room | 0 (0.0%) | 0 (0.0%) |
| 2 or 3 Rooms | 14 (3.7%) | 16 (13.3%) |
| 4 or 5 Rooms | 320 (84.9%) | 64 (53.3%) |
| 6 or 7 Rooms | 34 (9.0%) | 40 (33.3%) |
| 8 or more Rooms | 9 (2.4%) | 0 (0.0%) |
| Total | 377 (100.0%) | 120 (100.0%) |
Housing Structure by Heating Type in Playita Cortada
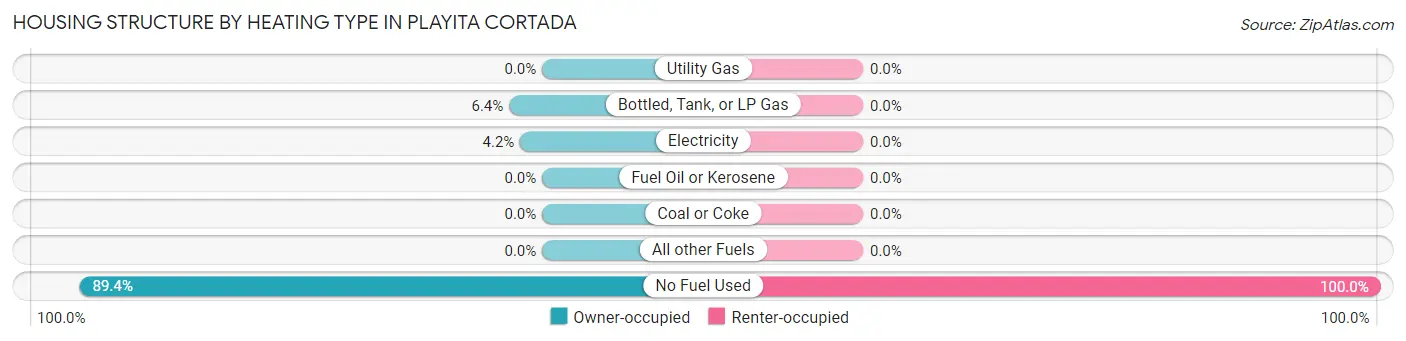
| Heating Type | Owner-occupied | Renter-occupied |
| Utility Gas | 0 (0.0%) | 0 (0.0%) |
| Bottled, Tank, or LP Gas | 24 (6.4%) | 0 (0.0%) |
| Electricity | 16 (4.2%) | 0 (0.0%) |
| Fuel Oil or Kerosene | 0 (0.0%) | 0 (0.0%) |
| Coal or Coke | 0 (0.0%) | 0 (0.0%) |
| All other Fuels | 0 (0.0%) | 0 (0.0%) |
| No Fuel Used | 337 (89.4%) | 120 (100.0%) |
| Total | 377 (100.0%) | 120 (100.0%) |
Household Vehicle Usage in Playita Cortada
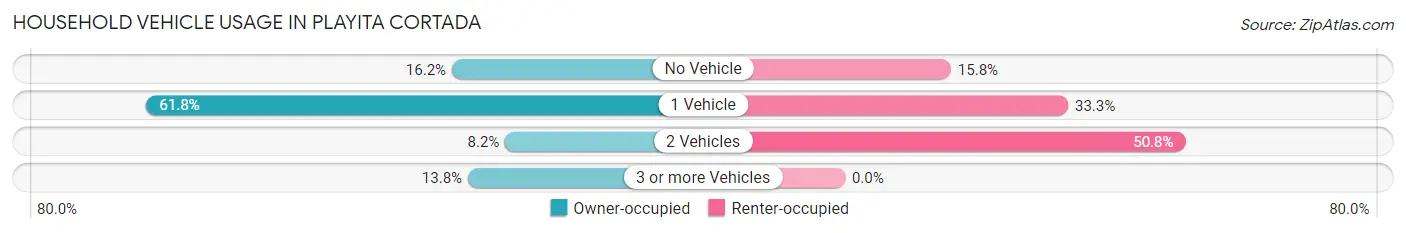
| Vehicles per Household | Owner-occupied | Renter-occupied |
| No Vehicle | 61 (16.2%) | 19 (15.8%) |
| 1 Vehicle | 233 (61.8%) | 40 (33.3%) |
| 2 Vehicles | 31 (8.2%) | 61 (50.8%) |
| 3 or more Vehicles | 52 (13.8%) | 0 (0.0%) |
| Total | 377 (100.0%) | 120 (100.0%) |
Real Estate & Mortgages in Playita Cortada
Real Estate and Mortgage Overview in Playita Cortada
| Characteristic | Without Mortgage | With Mortgage |
| Housing Units | 231 | 146 |
| Median Property Value | $72,800 | $118,400 |
| Median Household Income | $10,089 | $0 |
| Monthly Housing Costs | $165 | $0 |
| Real Estate Taxes | - | - |
Property Value by Mortgage Status in Playita Cortada
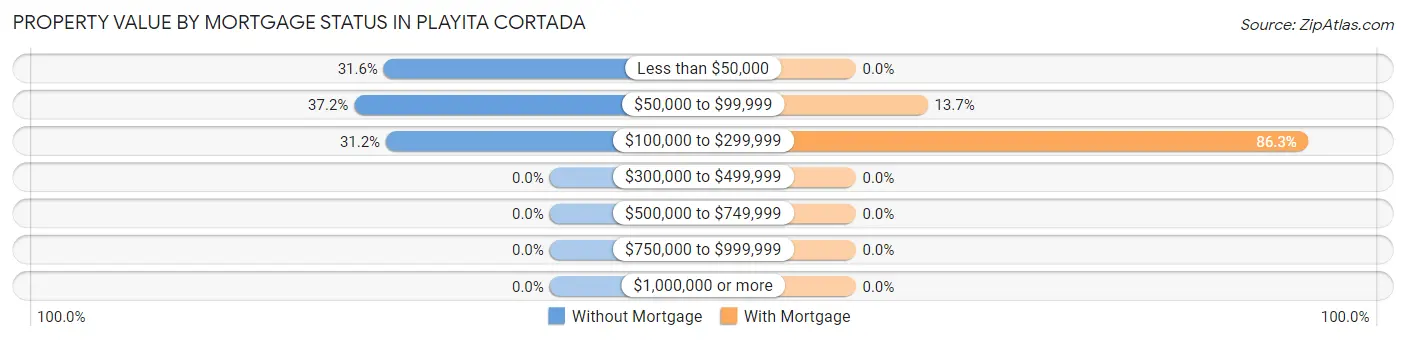
| Property Value | Without Mortgage | With Mortgage |
| Less than $50,000 | 73 (31.6%) | 0 (0.0%) |
| $50,000 to $99,999 | 86 (37.2%) | 20 (13.7%) |
| $100,000 to $299,999 | 72 (31.2%) | 126 (86.3%) |
| $300,000 to $499,999 | 0 (0.0%) | 0 (0.0%) |
| $500,000 to $749,999 | 0 (0.0%) | 0 (0.0%) |
| $750,000 to $999,999 | 0 (0.0%) | 0 (0.0%) |
| $1,000,000 or more | 0 (0.0%) | 0 (0.0%) |
| Total | 231 (100.0%) | 146 (100.0%) |
Household Income by Mortgage Status in Playita Cortada
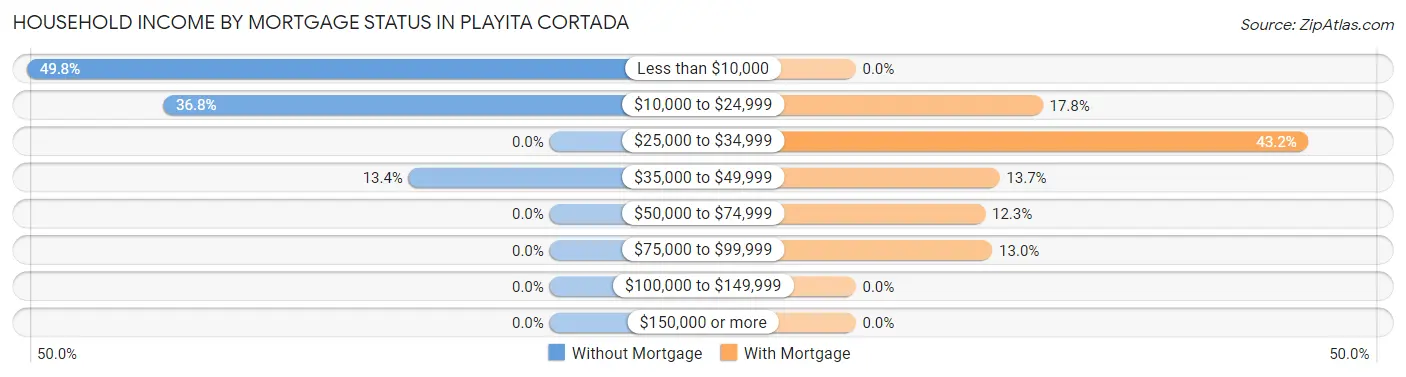
| Household Income | Without Mortgage | With Mortgage |
| Less than $10,000 | 115 (49.8%) | 0 (0.0%) |
| $10,000 to $24,999 | 85 (36.8%) | 26 (17.8%) |
| $25,000 to $34,999 | 0 (0.0%) | 63 (43.1%) |
| $35,000 to $49,999 | 31 (13.4%) | 20 (13.7%) |
| $50,000 to $74,999 | 0 (0.0%) | 18 (12.3%) |
| $75,000 to $99,999 | 0 (0.0%) | 19 (13.0%) |
| $100,000 to $149,999 | 0 (0.0%) | 0 (0.0%) |
| $150,000 or more | 0 (0.0%) | 0 (0.0%) |
| Total | 231 (100.0%) | 146 (100.0%) |
Property Value to Household Income Ratio in Playita Cortada
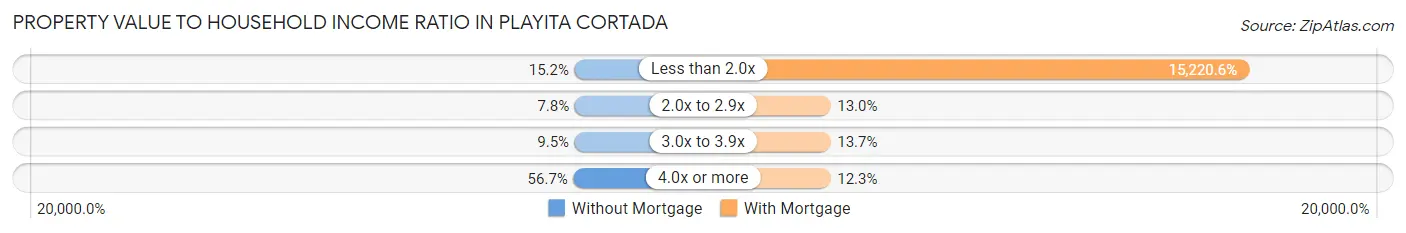
| Value-to-Income Ratio | Without Mortgage | With Mortgage |
| Less than 2.0x | 35 (15.1%) | 22,222 (15,220.6%) |
| 2.0x to 2.9x | 18 (7.8%) | 19 (13.0%) |
| 3.0x to 3.9x | 22 (9.5%) | 20 (13.7%) |
| 4.0x or more | 131 (56.7%) | 18 (12.3%) |
| Total | 231 (100.0%) | 146 (100.0%) |
Real Estate Taxes by Mortgage Status in Playita Cortada
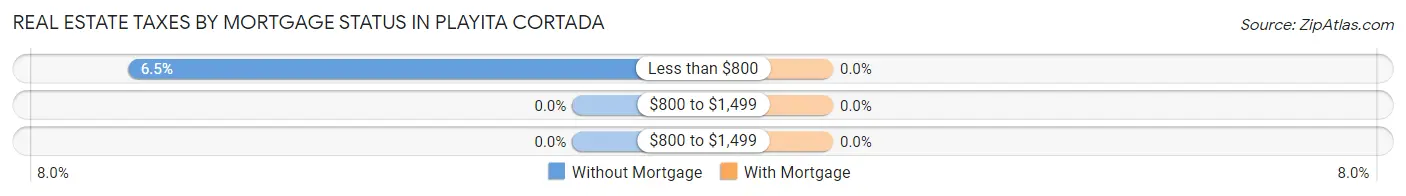
| Property Taxes | Without Mortgage | With Mortgage |
| Less than $800 | 15 (6.5%) | 0 (0.0%) |
| $800 to $1,499 | 0 (0.0%) | 0 (0.0%) |
| $800 to $1,499 | 0 (0.0%) | 0 (0.0%) |
| Total | 231 (100.0%) | 146 (100.0%) |
Health & Disability in Playita Cortada
Health Insurance Coverage by Age in Playita Cortada
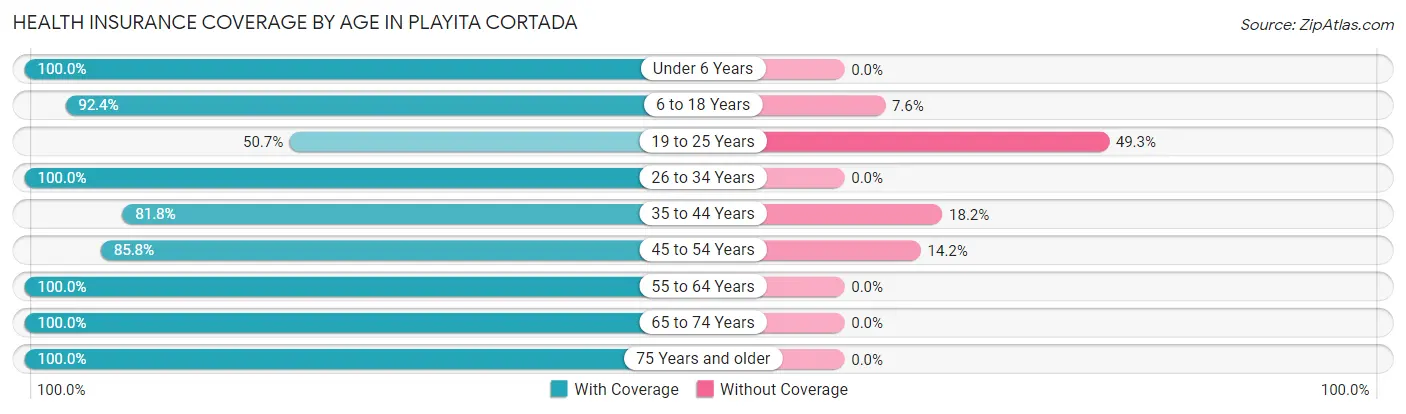
| Age Bracket | With Coverage | Without Coverage |
| Under 6 Years | 63 (100.0%) | 0 (0.0%) |
| 6 to 18 Years | 268 (92.4%) | 22 (7.6%) |
| 19 to 25 Years | 74 (50.7%) | 72 (49.3%) |
| 26 to 34 Years | 176 (100.0%) | 0 (0.0%) |
| 35 to 44 Years | 121 (81.8%) | 27 (18.2%) |
| 45 to 54 Years | 229 (85.8%) | 38 (14.2%) |
| 55 to 64 Years | 115 (100.0%) | 0 (0.0%) |
| 65 to 74 Years | 109 (100.0%) | 0 (0.0%) |
| 75 Years and older | 81 (100.0%) | 0 (0.0%) |
| Total | 1,236 (88.6%) | 159 (11.4%) |
Health Insurance Coverage by Citizenship Status in Playita Cortada
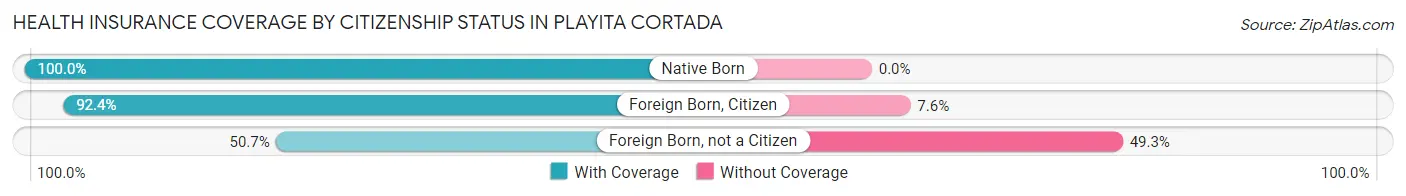
| Citizenship Status | With Coverage | Without Coverage |
| Native Born | 63 (100.0%) | 0 (0.0%) |
| Foreign Born, Citizen | 268 (92.4%) | 22 (7.6%) |
| Foreign Born, not a Citizen | 74 (50.7%) | 72 (49.3%) |
Health Insurance Coverage by Household Income in Playita Cortada
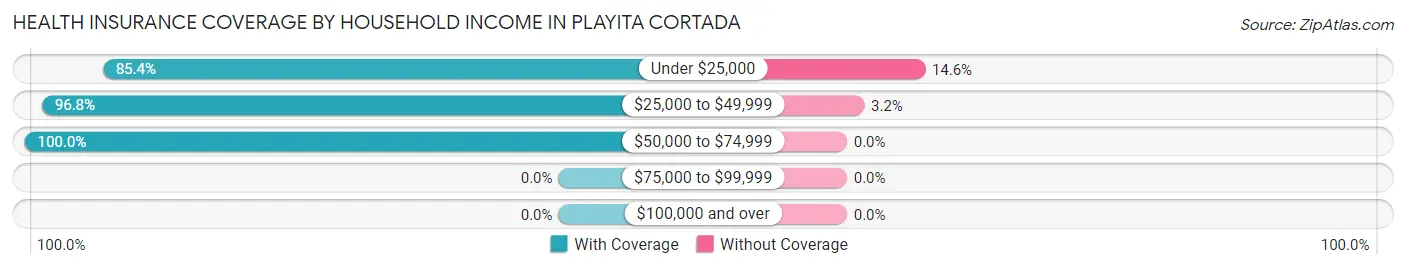
| Household Income | With Coverage | Without Coverage |
| Under $25,000 | 863 (85.4%) | 148 (14.6%) |
| $25,000 to $49,999 | 329 (96.8%) | 11 (3.2%) |
| $50,000 to $74,999 | 44 (100.0%) | 0 (0.0%) |
| $75,000 to $99,999 | 0 (0.0%) | 0 (0.0%) |
| $100,000 and over | 0 (0.0%) | 0 (0.0%) |
Public vs Private Health Insurance Coverage by Age in Playita Cortada
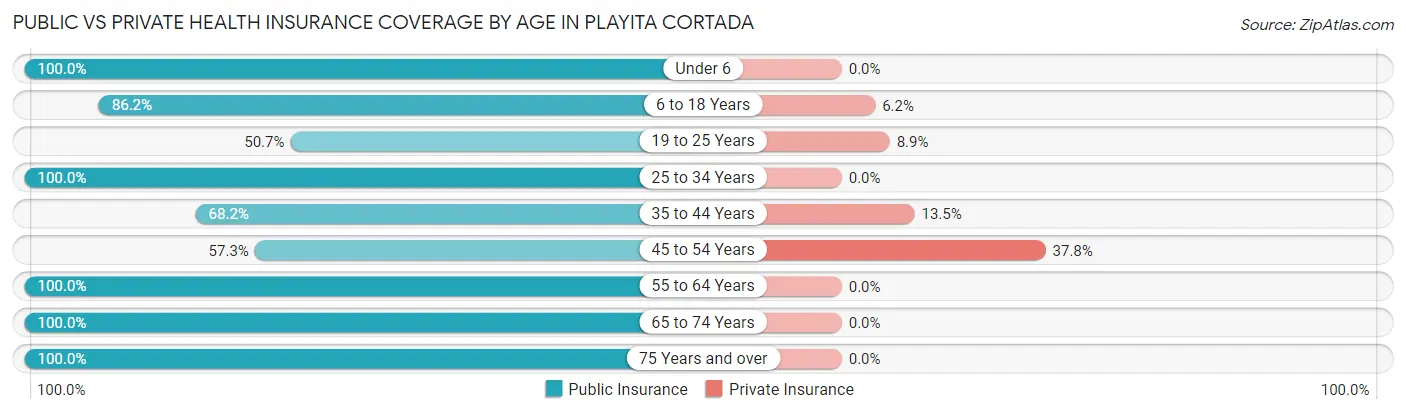
| Age Bracket | Public Insurance | Private Insurance |
| Under 6 | 63 (100.0%) | 0 (0.0%) |
| 6 to 18 Years | 250 (86.2%) | 18 (6.2%) |
| 19 to 25 Years | 74 (50.7%) | 13 (8.9%) |
| 25 to 34 Years | 176 (100.0%) | 0 (0.0%) |
| 35 to 44 Years | 101 (68.2%) | 20 (13.5%) |
| 45 to 54 Years | 153 (57.3%) | 101 (37.8%) |
| 55 to 64 Years | 115 (100.0%) | 0 (0.0%) |
| 65 to 74 Years | 109 (100.0%) | 0 (0.0%) |
| 75 Years and over | 81 (100.0%) | 0 (0.0%) |
| Total | 1,122 (80.4%) | 152 (10.9%) |
Disability Status by Sex by Age in Playita Cortada
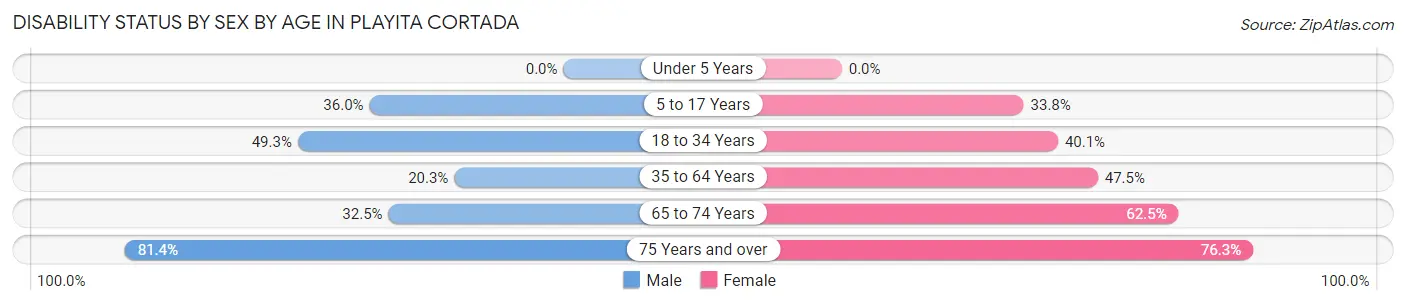
| Age Bracket | Male | Female |
| Under 5 Years | 0 (0.0%) | 0 (0.0%) |
| 5 to 17 Years | 54 (36.0%) | 27 (33.8%) |
| 18 to 34 Years | 106 (49.3%) | 67 (40.1%) |
| 35 to 64 Years | 46 (20.3%) | 144 (47.5%) |
| 65 to 74 Years | 25 (32.5%) | 20 (62.5%) |
| 75 Years and over | 35 (81.4%) | 29 (76.3%) |
Disability Class by Sex by Age in Playita Cortada
Disability Class: Hearing Difficulty
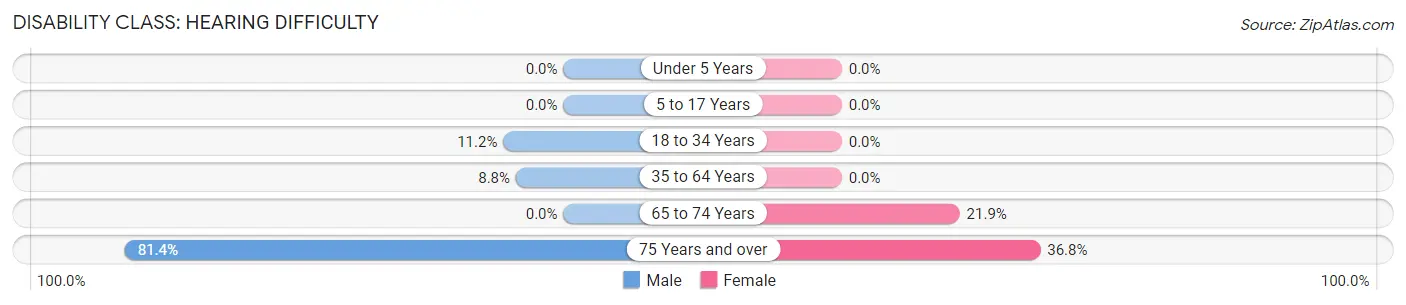
| Age Bracket | Male | Female |
| Under 5 Years | 0 (0.0%) | 0 (0.0%) |
| 5 to 17 Years | 0 (0.0%) | 0 (0.0%) |
| 18 to 34 Years | 24 (11.2%) | 0 (0.0%) |
| 35 to 64 Years | 20 (8.8%) | 0 (0.0%) |
| 65 to 74 Years | 0 (0.0%) | 7 (21.9%) |
| 75 Years and over | 35 (81.4%) | 14 (36.8%) |
Disability Class: Vision Difficulty
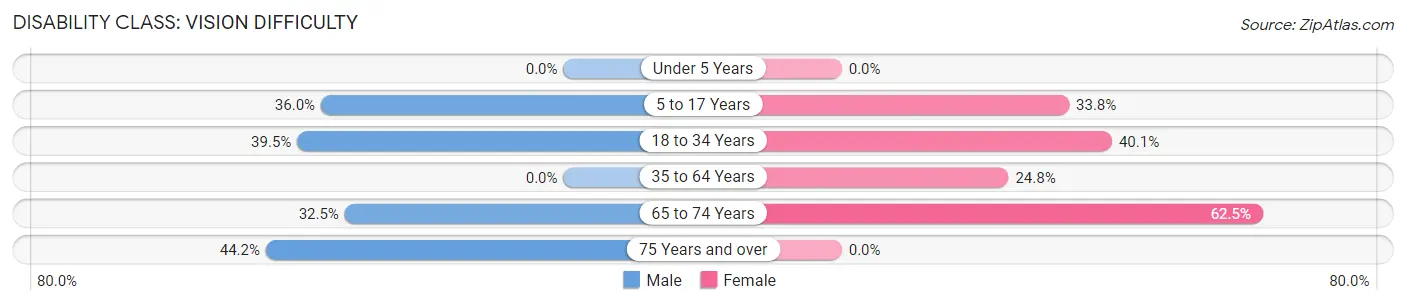
| Age Bracket | Male | Female |
| Under 5 Years | 0 (0.0%) | 0 (0.0%) |
| 5 to 17 Years | 54 (36.0%) | 27 (33.8%) |
| 18 to 34 Years | 85 (39.5%) | 67 (40.1%) |
| 35 to 64 Years | 0 (0.0%) | 75 (24.7%) |
| 65 to 74 Years | 25 (32.5%) | 20 (62.5%) |
| 75 Years and over | 19 (44.2%) | 0 (0.0%) |
Disability Class: Cognitive Difficulty
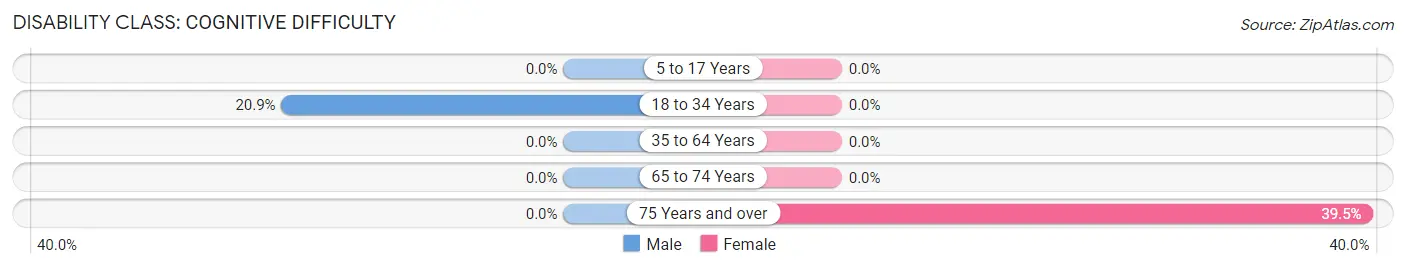
| Age Bracket | Male | Female |
| 5 to 17 Years | 0 (0.0%) | 0 (0.0%) |
| 18 to 34 Years | 45 (20.9%) | 0 (0.0%) |
| 35 to 64 Years | 0 (0.0%) | 0 (0.0%) |
| 65 to 74 Years | 0 (0.0%) | 0 (0.0%) |
| 75 Years and over | 0 (0.0%) | 15 (39.5%) |
Disability Class: Ambulatory Difficulty
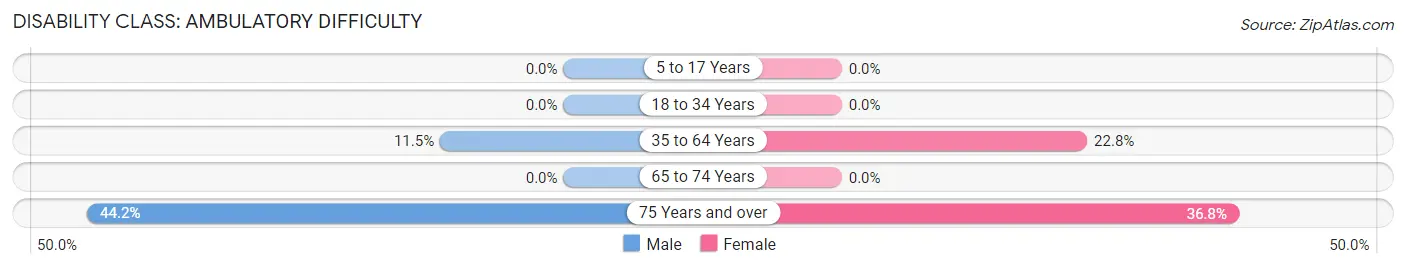
| Age Bracket | Male | Female |
| 5 to 17 Years | 0 (0.0%) | 0 (0.0%) |
| 18 to 34 Years | 0 (0.0%) | 0 (0.0%) |
| 35 to 64 Years | 26 (11.5%) | 69 (22.8%) |
| 65 to 74 Years | 0 (0.0%) | 0 (0.0%) |
| 75 Years and over | 19 (44.2%) | 14 (36.8%) |
Disability Class: Self-Care Difficulty
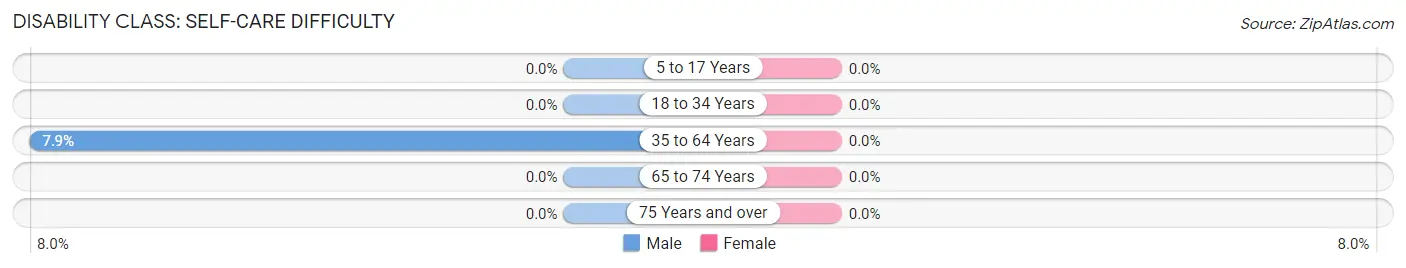
| Age Bracket | Male | Female |
| 5 to 17 Years | 0 (0.0%) | 0 (0.0%) |
| 18 to 34 Years | 0 (0.0%) | 0 (0.0%) |
| 35 to 64 Years | 18 (7.9%) | 0 (0.0%) |
| 65 to 74 Years | 0 (0.0%) | 0 (0.0%) |
| 75 Years and over | 0 (0.0%) | 0 (0.0%) |
Technology Access in Playita Cortada
Computing Device Access in Playita Cortada
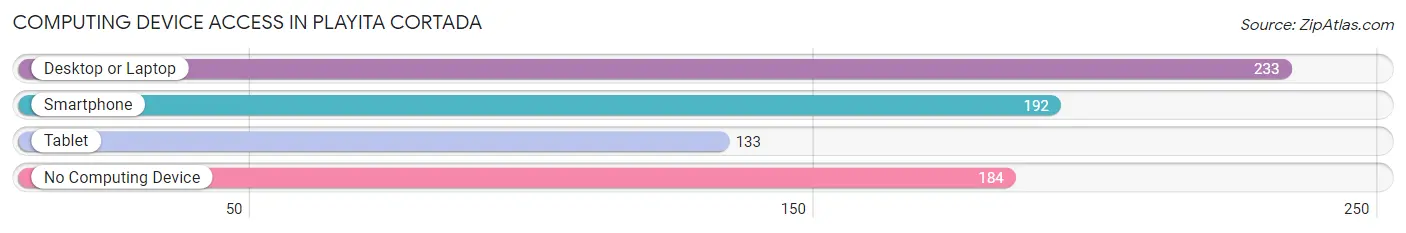
| Device Type | # Households | % Households |
| Desktop or Laptop | 233 | 46.9% |
| Smartphone | 192 | 38.6% |
| Tablet | 133 | 26.8% |
| No Computing Device | 184 | 37.0% |
| Total | 497 | 100.0% |
Internet Access in Playita Cortada
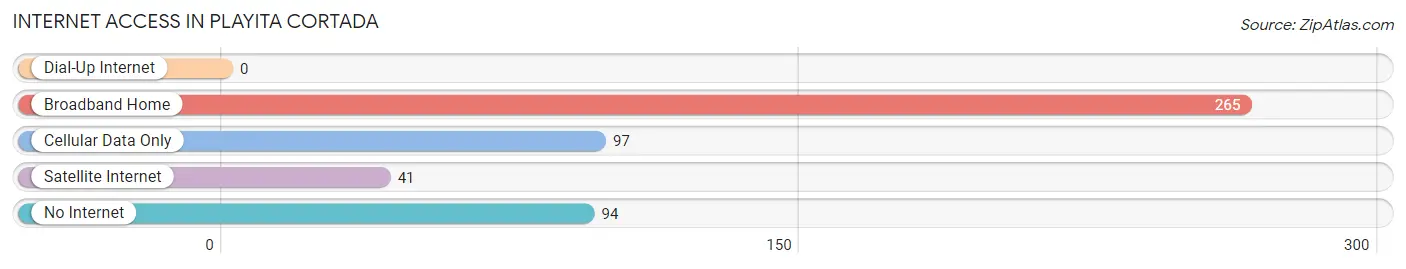
| Internet Type | # Households | % Households |
| Dial-Up Internet | 0 | 0.0% |
| Broadband Home | 265 | 53.3% |
| Cellular Data Only | 97 | 19.5% |
| Satellite Internet | 41 | 8.3% |
| No Internet | 94 | 18.9% |
| Total | 497 | 100.0% |
Playita Cortada Summary
Playita Cortada is a small town located in the municipality of San Germán, Puerto Rico. It is situated in the southwestern part of the island, about 20 miles from the city of Mayagüez. The town is known for its beautiful beaches, lush vegetation, and friendly people.
History
Playita Cortada was founded in the late 19th century by a group of settlers from the nearby town of San Germán. The town was originally called “Playita de San Germán”, but the name was changed to “Playita Cortada” in the early 20th century. The name “Cortada” is derived from the Spanish word for “cut”, referring to the fact that the town was cut off from the rest of San Germán by a small river.
The town was originally a small fishing village, but it has since grown into a popular tourist destination. The town is known for its beautiful beaches, lush vegetation, and friendly people. It is also home to a number of historical sites, including the ruins of a Spanish fort and a 19th century lighthouse.
Geography
Playita Cortada is located in the southwestern part of Puerto Rico, about 20 miles from the city of Mayagüez. The town is situated on the coast of the Caribbean Sea, and is surrounded by lush vegetation and beautiful beaches. The town is also home to a number of small rivers and streams, which provide a source of fresh water for the town’s inhabitants.
The town is located in a tropical climate, with temperatures ranging from the mid-70s to the mid-90s throughout the year. The town receives an average of about 60 inches of rain per year, most of which falls during the summer months.
Economy
The economy of Playita Cortada is largely based on tourism. The town is home to a number of hotels, restaurants, and other tourist attractions. The town is also home to a number of small businesses, including a grocery store, a hardware store, and a few small shops.
The town is also home to a number of fishing boats, which provide a source of income for many of the town’s inhabitants. The town is also home to a number of small farms, which produce a variety of fruits and vegetables.
Demographics
As of the 2010 census, the population of Playita Cortada was 1,845. The town is predominantly Hispanic, with about 95% of the population identifying as such. The town is also home to a small number of African-Americans, Asians, and other ethnicities.
The town is home to a number of churches, including the Iglesia de San Germán, which was founded in the late 19th century. The town is also home to a number of schools, including the Escuela Primaria de Playita Cortada, which was founded in the early 20th century.
Conclusion
Playita Cortada is a small town located in the municipality of San Germán, Puerto Rico. It is known for its beautiful beaches, lush vegetation, and friendly people. The town’s economy is largely based on tourism, and it is home to a number of small businesses, fishing boats, and farms. The town is predominantly Hispanic, with about 95% of the population identifying as such. The town is also home to a number of churches and schools.
Common Questions
What is Per Capita Income in Playita Cortada?
Per Capita income in Playita Cortada is $7,540.
What is the Median Family Income in Playita Cortada?
Median Family Income in Playita Cortada is $13,986.
What is the Median Household income in Playita Cortada?
Median Household Income in Playita Cortada is $15,768.
What is Family Income Deficit in Playita Cortada?
Family Income Deficit in Playita Cortada is $15,598.
Families that are below poverty line in Playita Cortada earn $15,598 less on average than the poverty threshold level.
What is Inequality or Gini Index in Playita Cortada?
Inequality or Gini Index in Playita Cortada is 0.49.
What is the Total Population of Playita Cortada?
Total Population of Playita Cortada is 1,395.
What is the Total Male Population of Playita Cortada?
Total Male Population of Playita Cortada is 775.
What is the Total Female Population of Playita Cortada?
Total Female Population of Playita Cortada is 620.
What is the Ratio of Males per 100 Females in Playita Cortada?
There are 125.00 Males per 100 Females in Playita Cortada.
What is the Ratio of Females per 100 Males in Playita Cortada?
There are 80.00 Females per 100 Males in Playita Cortada.
What is the Median Population Age in Playita Cortada?
Median Population Age in Playita Cortada is 36.0 Years.
What is the Average Family Size in Playita Cortada
Average Family Size in Playita Cortada is 4.1 People.
What is the Average Household Size in Playita Cortada
Average Household Size in Playita Cortada is 2.8 People.
How Large is the Labor Force in Playita Cortada?
There are 365 People in the Labor Forcein in Playita Cortada.
What is the Percentage of People in the Labor Force in Playita Cortada?
32.1% of People are in the Labor Force in Playita Cortada.
What is the Unemployment Rate in Playita Cortada?
Unemployment Rate in Playita Cortada is 22.2%.