Coqui, PR Map & Demographics
Coqui Overview
$9,088
PER CAPITA INCOME
$24,559
AVG FAMILY INCOME
$21,538
AVG HOUSEHOLD INCOME
2.6%
WAGE / INCOME GAP [ % ]
97.4¢/ $1
WAGE / INCOME GAP [ $ ]
0.41
INEQUALITY / GINI INDEX
2,968
TOTAL POPULATION
1,297
MALE POPULATION
1,671
FEMALE POPULATION
77.62
MALES / 100 FEMALES
128.84
FEMALES / 100 MALES
29.9
MEDIAN AGE
3.5
AVG FAMILY SIZE
2.9
AVG HOUSEHOLD SIZE
749
LABOR FORCE [ PEOPLE ]
30.6%
PERCENT IN LABOR FORCE
5.2%
UNEMPLOYMENT RATE
Income in Coqui
Income Overview in Coqui
Per Capita Income in Coqui is $9,088, while median incomes of families and households are $24,559 and $21,538 respectively.
| Characteristic | Number | Measure |
| Per Capita Income | 2,968 | $9,088 |
| Median Family Income | 734 | $24,559 |
| Mean Family Income | 734 | $29,242 |
| Median Household Income | 1,018 | $21,538 |
| Mean Household Income | 1,018 | $25,849 |
| Income Deficit | 734 | $0 |
| Wage / Income Gap (%) | 2,968 | 2.59% |
| Wage / Income Gap ($) | 2,968 | 97.41¢ per $1 |
| Gini / Inequality Index | 2,968 | 0.41 |
Earnings by Sex in Coqui
Average Earnings in Coqui are $16,408, $16,543 for men and $16,115 for women, a difference of 2.6%.
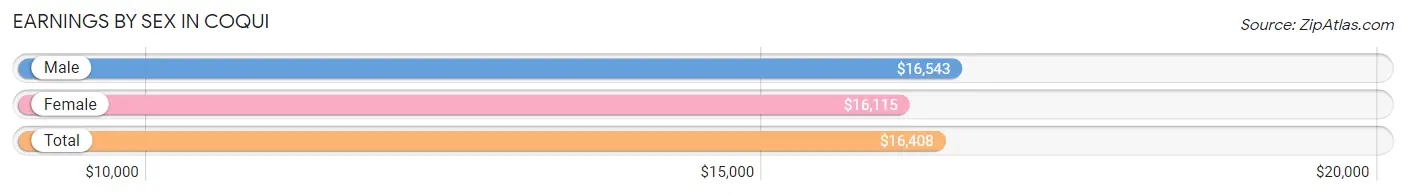
| Sex | Number | Average Earnings |
| Male | 398 (53.1%) | $16,543 |
| Female | 352 (46.9%) | $16,115 |
| Total | 750 (100.0%) | $16,408 |
Earnings by Sex by Income Bracket in Coqui
The most common earnings brackets in Coqui are $15,000 to $17,499 for men (141 | 35.4%) and $15,000 to $17,499 for women (65 | 18.5%).
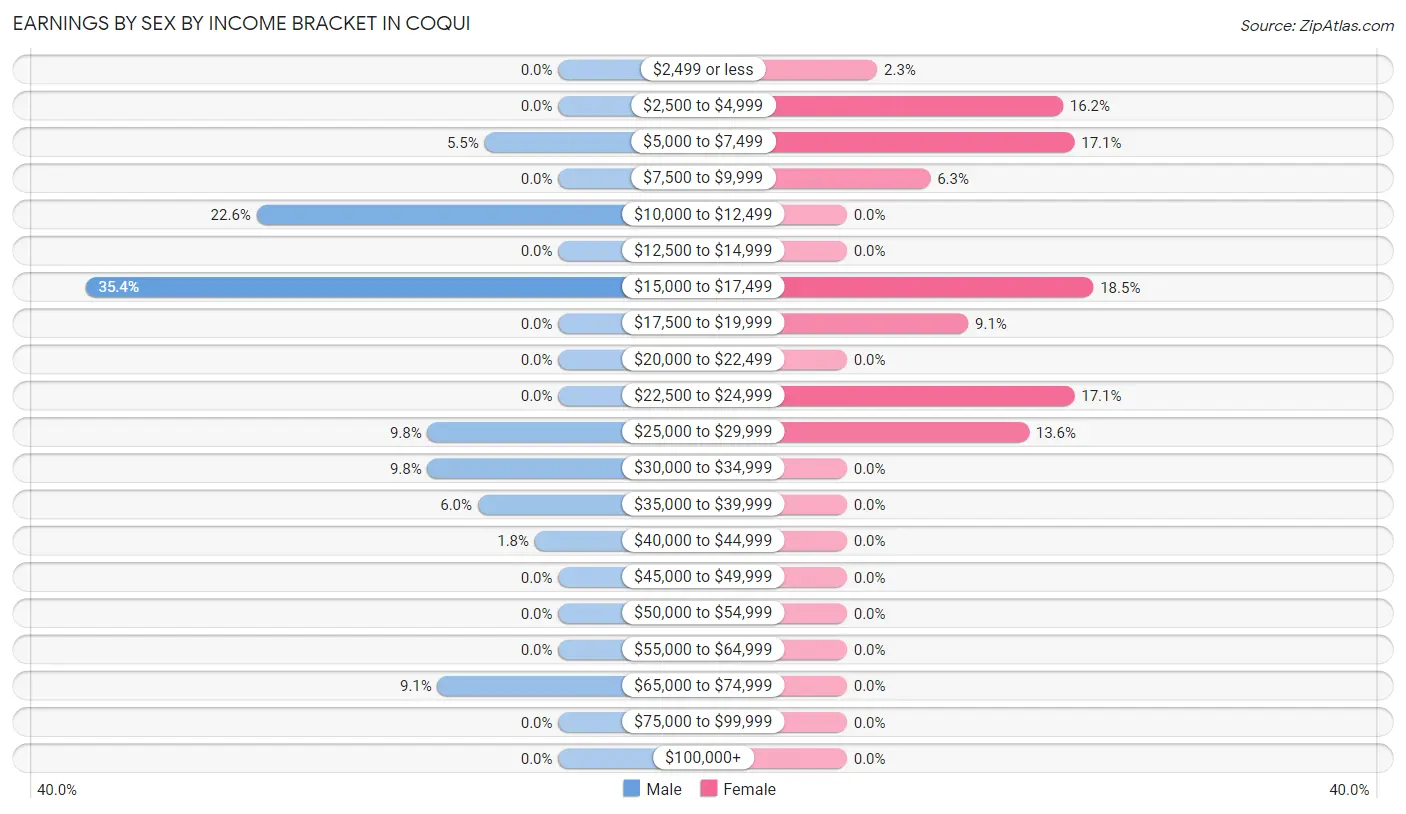
| Income | Male | Female |
| $2,499 or less | 0 (0.0%) | 8 (2.3%) |
| $2,500 to $4,999 | 0 (0.0%) | 57 (16.2%) |
| $5,000 to $7,499 | 22 (5.5%) | 60 (17.1%) |
| $7,500 to $9,999 | 0 (0.0%) | 22 (6.2%) |
| $10,000 to $12,499 | 90 (22.6%) | 0 (0.0%) |
| $12,500 to $14,999 | 0 (0.0%) | 0 (0.0%) |
| $15,000 to $17,499 | 141 (35.4%) | 65 (18.5%) |
| $17,500 to $19,999 | 0 (0.0%) | 32 (9.1%) |
| $20,000 to $22,499 | 0 (0.0%) | 0 (0.0%) |
| $22,500 to $24,999 | 0 (0.0%) | 60 (17.1%) |
| $25,000 to $29,999 | 39 (9.8%) | 48 (13.6%) |
| $30,000 to $34,999 | 39 (9.8%) | 0 (0.0%) |
| $35,000 to $39,999 | 24 (6.0%) | 0 (0.0%) |
| $40,000 to $44,999 | 7 (1.8%) | 0 (0.0%) |
| $45,000 to $49,999 | 0 (0.0%) | 0 (0.0%) |
| $50,000 to $54,999 | 0 (0.0%) | 0 (0.0%) |
| $55,000 to $64,999 | 0 (0.0%) | 0 (0.0%) |
| $65,000 to $74,999 | 36 (9.0%) | 0 (0.0%) |
| $75,000 to $99,999 | 0 (0.0%) | 0 (0.0%) |
| $100,000+ | 0 (0.0%) | 0 (0.0%) |
| Total | 398 (100.0%) | 352 (100.0%) |
Earnings by Sex by Educational Attainment in Coqui
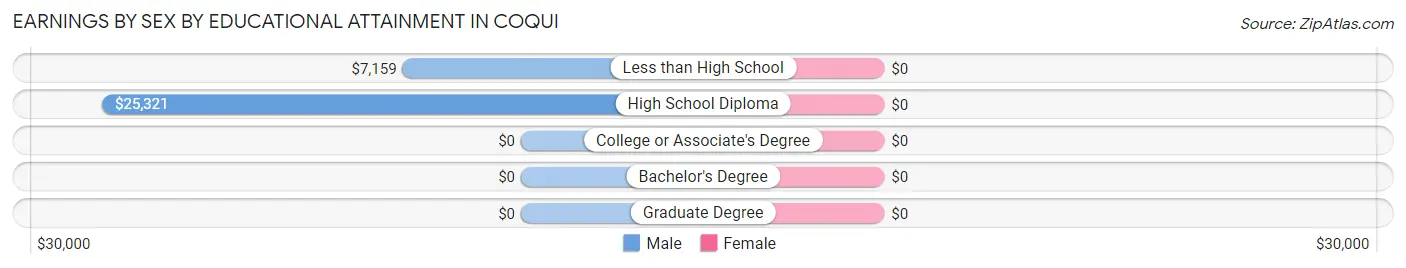
| Educational Attainment | Male Income | Female Income |
| Less than High School | $7,159 | $0 |
| High School Diploma | $25,321 | $0 |
| College or Associate's Degree | - | - |
| Bachelor's Degree | - | - |
| Graduate Degree | - | - |
| Total | $25,128 | $19,531 |
Family Income in Coqui
Family Income Brackets in Coqui
According to the Coqui family income data, there are 220 families falling into the $15,000 to $24,999 income range, which is the most common income bracket and makes up 30.0% of all families.
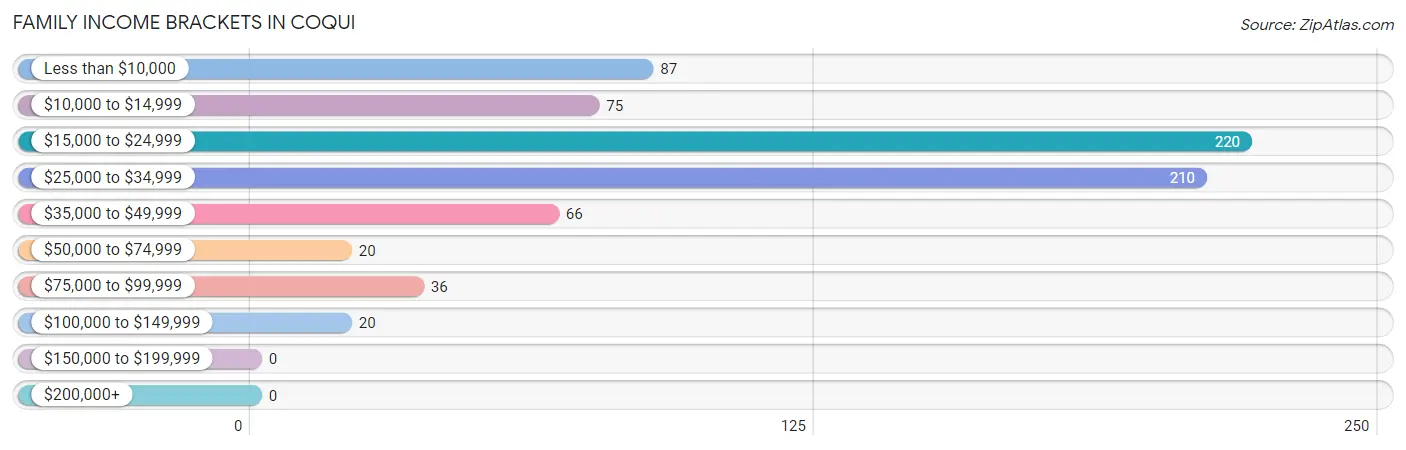
| Income Bracket | # Families | % Families |
| Less than $10,000 | 87 | 11.9% |
| $10,000 to $14,999 | 75 | 10.2% |
| $15,000 to $24,999 | 220 | 30.0% |
| $25,000 to $34,999 | 210 | 28.6% |
| $35,000 to $49,999 | 66 | 9.0% |
| $50,000 to $74,999 | 20 | 2.7% |
| $75,000 to $99,999 | 36 | 4.9% |
| $100,000 to $149,999 | 20 | 2.7% |
| $150,000 to $199,999 | 0 | 0.0% |
| $200,000+ | 0 | 0.0% |
Family Income by Famaliy Size in Coqui
5-person families (94 | 12.8%) account for the highest median family income in Coqui with $24,891 per family, while 2-person families (386 | 52.6%) have the highest median income of $11,330 per family member.
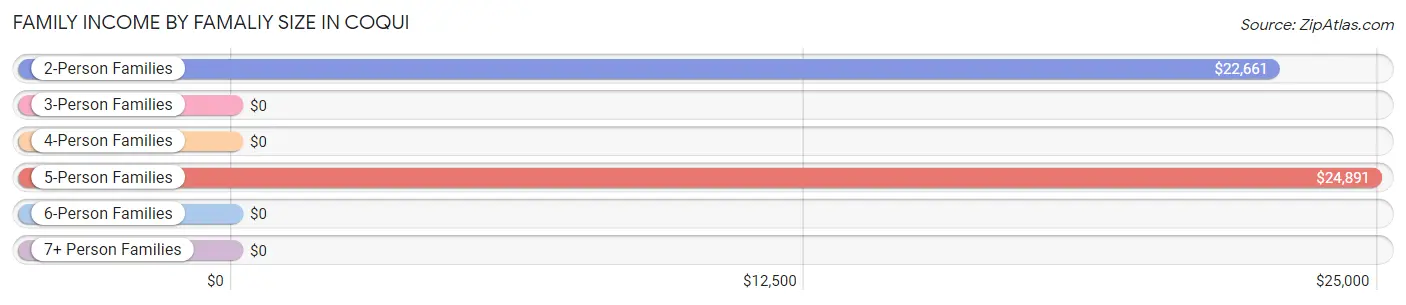
| Income Bracket | # Families | Median Income |
| 2-Person Families | 386 (52.6%) | $22,661 |
| 3-Person Families | 143 (19.5%) | $0 |
| 4-Person Families | 74 (10.1%) | $0 |
| 5-Person Families | 94 (12.8%) | $24,891 |
| 6-Person Families | 12 (1.6%) | $0 |
| 7+ Person Families | 25 (3.4%) | $0 |
| Total | 734 (100.0%) | $24,559 |
Family Income by Number of Earners in Coqui
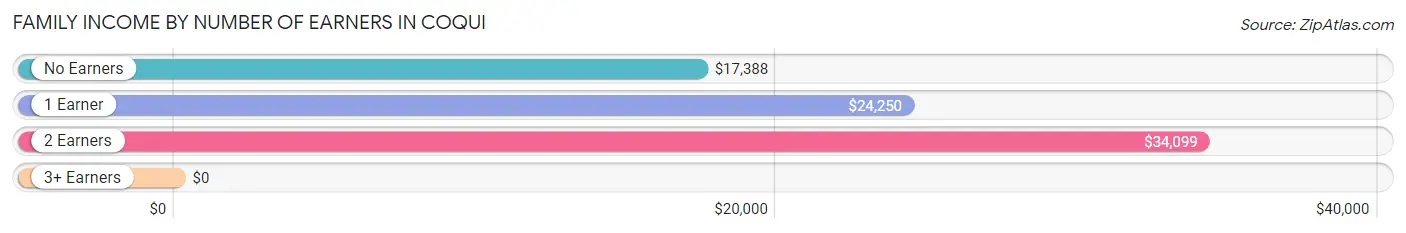
| Number of Earners | # Families | Median Income |
| No Earners | 271 (36.9%) | $17,388 |
| 1 Earner | 329 (44.8%) | $24,250 |
| 2 Earners | 134 (18.3%) | $34,099 |
| 3+ Earners | 0 (0.0%) | $0 |
| Total | 734 (100.0%) | $24,559 |
Household Income in Coqui
Household Income Brackets in Coqui
With 292 households falling in the category, the $15,000 to $24,999 income range is the most frequent in Coqui, accounting for 28.7% of all households.
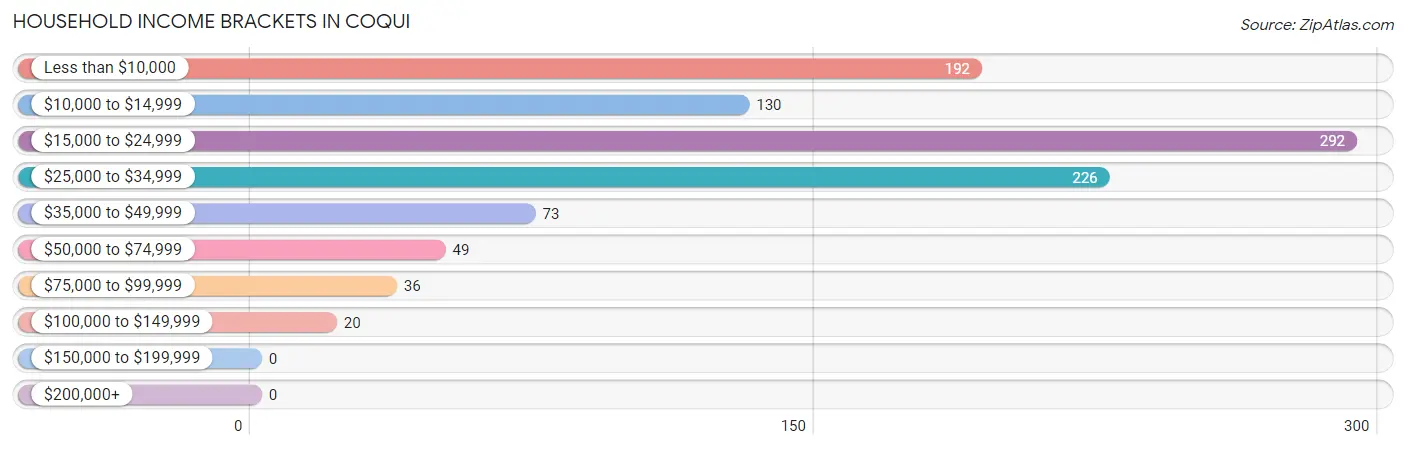
| Income Bracket | # Households | % Households |
| Less than $10,000 | 192 | 18.9% |
| $10,000 to $14,999 | 130 | 12.8% |
| $15,000 to $24,999 | 292 | 28.7% |
| $25,000 to $34,999 | 226 | 22.2% |
| $35,000 to $49,999 | 73 | 7.2% |
| $50,000 to $74,999 | 49 | 4.8% |
| $75,000 to $99,999 | 36 | 3.5% |
| $100,000 to $149,999 | 20 | 2.0% |
| $150,000 to $199,999 | 0 | 0.0% |
| $200,000+ | 0 | 0.0% |
Household Income by Householder Age in Coqui
The median household income in Coqui is $21,538, with the highest median household income of $32,936 found in the 25 to 44 years age bracket for the primary householder. A total of 276 households (27.1%) fall into this category. Meanwhile, the 15 to 24 years age bracket for the primary householder has the lowest median household income of $0, with 37 households (3.6%) in this group.
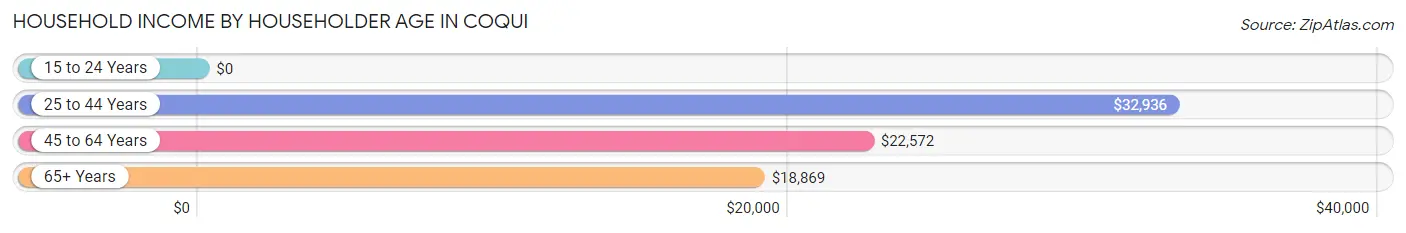
| Income Bracket | # Households | Median Income |
| 15 to 24 Years | 37 (3.6%) | $0 |
| 25 to 44 Years | 276 (27.1%) | $32,936 |
| 45 to 64 Years | 275 (27.0%) | $22,572 |
| 65+ Years | 430 (42.2%) | $18,869 |
| Total | 1,018 (100.0%) | $21,538 |
Poverty in Coqui
Income Below Poverty by Sex and Age in Coqui
With 58.2% poverty level for males and 57.8% for females among the residents of Coqui, 6 to 11 year old males and 25 to 34 year old females are the most vulnerable to poverty, with 77 males (100.0%) and 211 females (100.0%) in their respective age groups living below the poverty level.
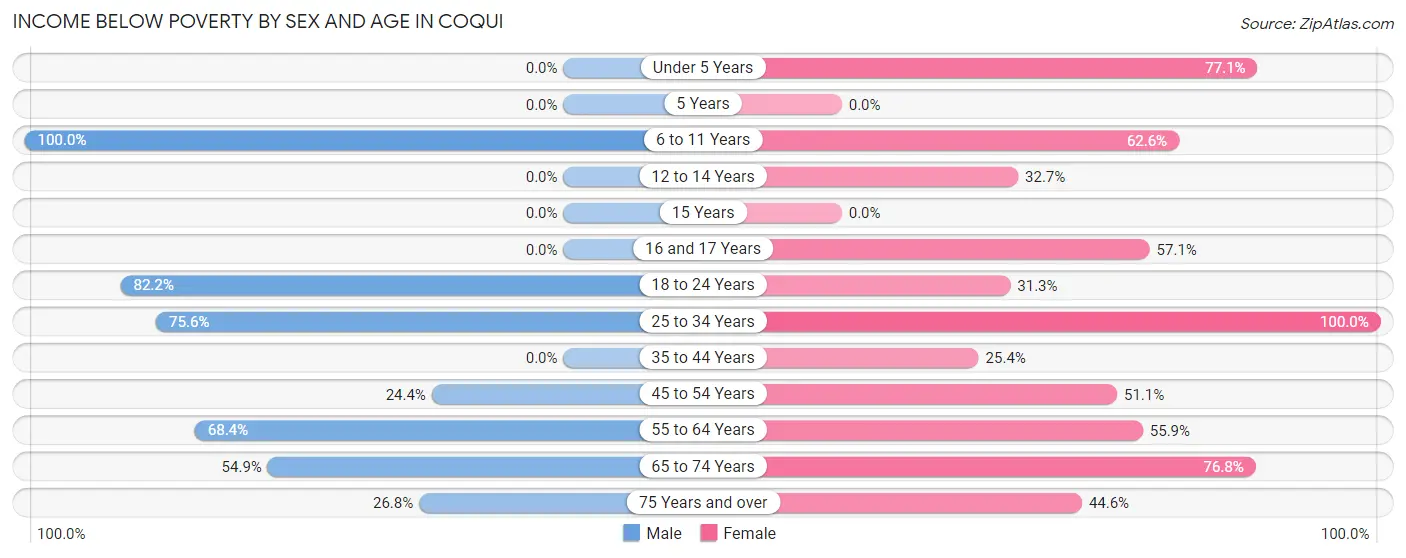
| Age Bracket | Male | Female |
| Under 5 Years | 0 (0.0%) | 162 (77.1%) |
| 5 Years | 0 (0.0%) | 0 (0.0%) |
| 6 to 11 Years | 77 (100.0%) | 112 (62.6%) |
| 12 to 14 Years | 0 (0.0%) | 18 (32.7%) |
| 15 Years | 0 (0.0%) | 0 (0.0%) |
| 16 and 17 Years | 0 (0.0%) | 32 (57.1%) |
| 18 to 24 Years | 226 (82.2%) | 87 (31.3%) |
| 25 to 34 Years | 167 (75.6%) | 211 (100.0%) |
| 35 to 44 Years | 0 (0.0%) | 32 (25.4%) |
| 45 to 54 Years | 33 (24.4%) | 94 (51.1%) |
| 55 to 64 Years | 106 (68.4%) | 38 (55.9%) |
| 65 to 74 Years | 101 (54.9%) | 106 (76.8%) |
| 75 Years and over | 45 (26.8%) | 74 (44.6%) |
| Total | 755 (58.2%) | 966 (57.8%) |
Income Above Poverty by Sex and Age in Coqui
According to the poverty statistics in Coqui, males aged 16 and 17 years and females aged 35 to 44 years are the age groups that are most secure financially, with 100.0% of males and 74.6% of females in these age groups living above the poverty line.
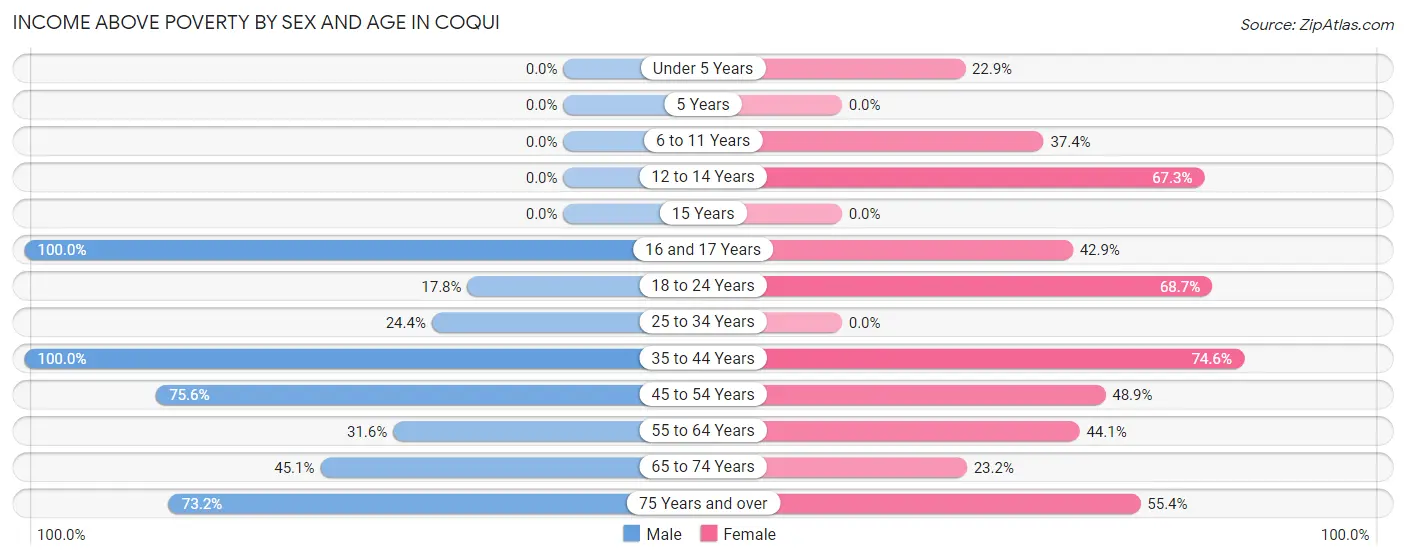
| Age Bracket | Male | Female |
| Under 5 Years | 0 (0.0%) | 48 (22.9%) |
| 5 Years | 0 (0.0%) | 0 (0.0%) |
| 6 to 11 Years | 0 (0.0%) | 67 (37.4%) |
| 12 to 14 Years | 0 (0.0%) | 37 (67.3%) |
| 15 Years | 0 (0.0%) | 0 (0.0%) |
| 16 and 17 Years | 43 (100.0%) | 24 (42.9%) |
| 18 to 24 Years | 49 (17.8%) | 191 (68.7%) |
| 25 to 34 Years | 54 (24.4%) | 0 (0.0%) |
| 35 to 44 Years | 39 (100.0%) | 94 (74.6%) |
| 45 to 54 Years | 102 (75.6%) | 90 (48.9%) |
| 55 to 64 Years | 49 (31.6%) | 30 (44.1%) |
| 65 to 74 Years | 83 (45.1%) | 32 (23.2%) |
| 75 Years and over | 123 (73.2%) | 92 (55.4%) |
| Total | 542 (41.8%) | 705 (42.2%) |
Income Below Poverty Among Married-Couple Families in Coqui
The poverty statistics for married-couple families in Coqui show that 45.9% or 230 of the total 501 families live below the poverty line. Families with 3 or 4 children have the highest poverty rate of 100.0%, comprising of 46 families. On the other hand, families with no children have the lowest poverty rate of 33.5%, which includes 99 families.
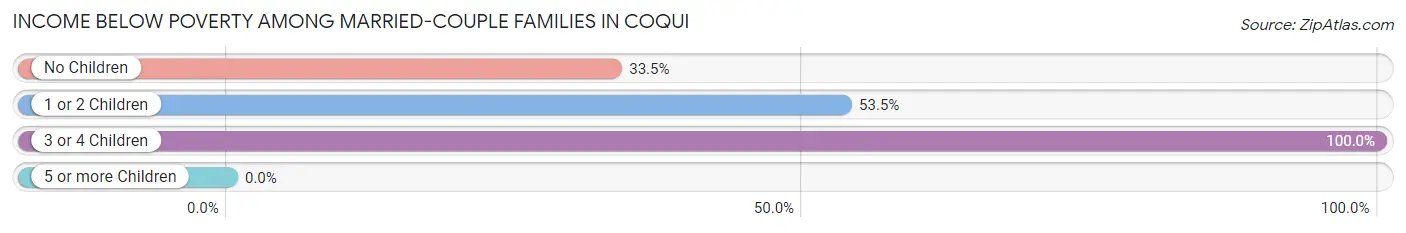
| Children | Above Poverty | Below Poverty |
| No Children | 197 (66.5%) | 99 (33.5%) |
| 1 or 2 Children | 74 (46.5%) | 85 (53.5%) |
| 3 or 4 Children | 0 (0.0%) | 46 (100.0%) |
| 5 or more Children | 0 (0.0%) | 0 (0.0%) |
| Total | 271 (54.1%) | 230 (45.9%) |
Income Below Poverty Among Single-Parent Households in Coqui
According to the poverty data in Coqui, 100.0% or 18 single-father households and 47.0% or 101 single-mother households are living below the poverty line. Among single-father households, those with 1 or 2 children have the highest poverty rate, with 18 households (100.0%) experiencing poverty. Likewise, among single-mother households, those with no children have the highest poverty rate, with 79 households (60.3%) falling below the poverty line.
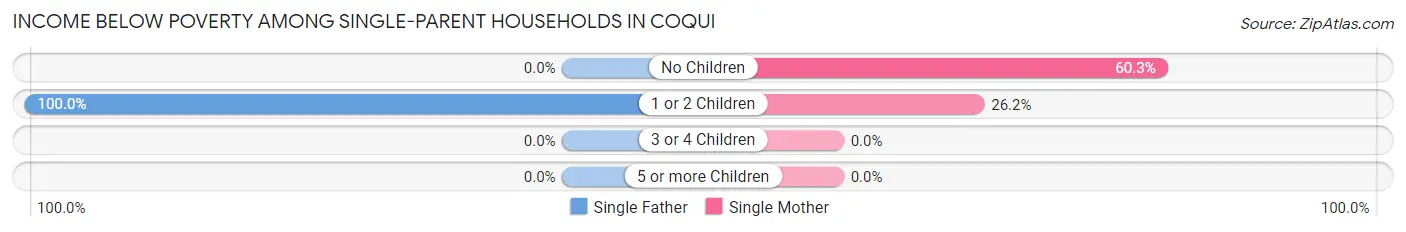
| Children | Single Father | Single Mother |
| No Children | 0 (0.0%) | 79 (60.3%) |
| 1 or 2 Children | 18 (100.0%) | 22 (26.2%) |
| 3 or 4 Children | 0 (0.0%) | 0 (0.0%) |
| 5 or more Children | 0 (0.0%) | 0 (0.0%) |
| Total | 18 (100.0%) | 101 (47.0%) |
Income Below Poverty Among Married-Couple vs Single-Parent Households in Coqui
The poverty data for Coqui shows that 230 of the married-couple family households (45.9%) and 119 of the single-parent households (51.1%) are living below the poverty level. Within the married-couple family households, those with 3 or 4 children have the highest poverty rate, with 46 households (100.0%) falling below the poverty line. Among the single-parent households, those with no children have the highest poverty rate, with 79 household (60.3%) living below poverty.

| Children | Married-Couple Families | Single-Parent Households |
| No Children | 99 (33.5%) | 79 (60.3%) |
| 1 or 2 Children | 85 (53.5%) | 40 (39.2%) |
| 3 or 4 Children | 46 (100.0%) | 0 (0.0%) |
| 5 or more Children | 0 (0.0%) | 0 (0.0%) |
| Total | 230 (45.9%) | 119 (51.1%) |
Race in Coqui
The most populous races in Coqui are Hispanic or Latino (2,914 | 98.2%), Two or more Races (1,151 | 38.8%), and White / Caucasian (798 | 26.9%).
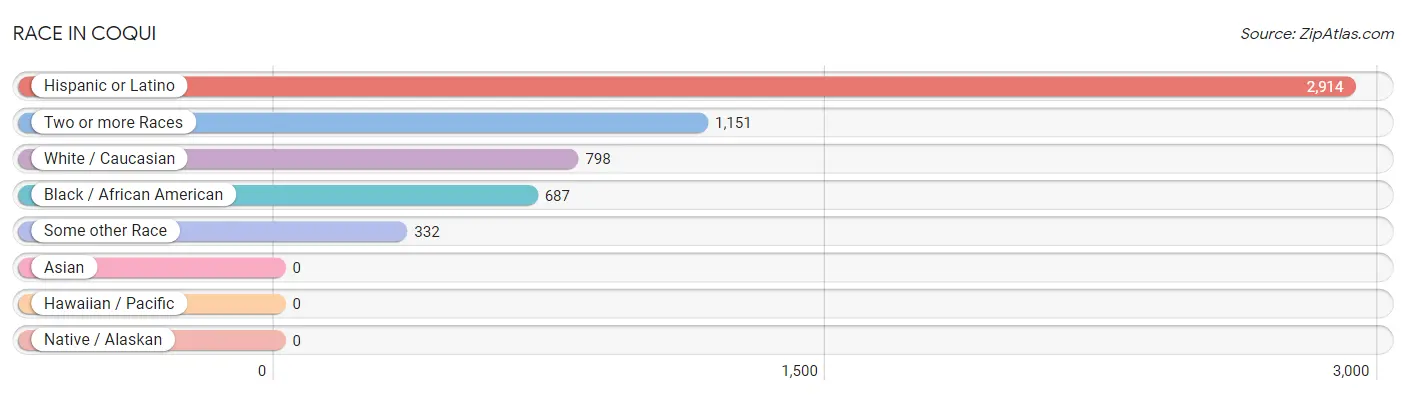
| Race | # Population | % Population |
| Asian | 0 | 0.0% |
| Black / African American | 687 | 23.2% |
| Hawaiian / Pacific | 0 | 0.0% |
| Hispanic or Latino | 2,914 | 98.2% |
| Native / Alaskan | 0 | 0.0% |
| White / Caucasian | 798 | 26.9% |
| Two or more Races | 1,151 | 38.8% |
| Some other Race | 332 | 11.2% |
| Total | 2,968 | 100.0% |
Ancestry in Coqui
The most populous ancestries reported in Coqui are Puerto Rican (2,886 | 97.2%), Dominican (28 | 0.9%), and American (13 | 0.4%), together accounting for 98.6% of all Coqui residents.
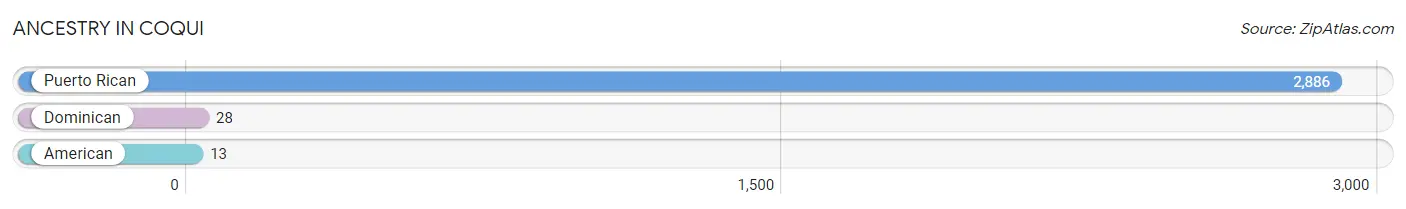
| Ancestry | # Population | % Population |
| American | 13 | 0.4% |
| Dominican | 28 | 0.9% |
| Puerto Rican | 2,886 | 97.2% | View All 3 Rows |
Immigrants in Coqui

| Immigration Origin | # Population | % Population | View All 0 Rows |
Sex and Age in Coqui
Sex and Age in Coqui
The most populous age groups in Coqui are 25 to 29 Years (171 | 13.2%) for men and Under 5 Years (210 | 12.6%) for women.
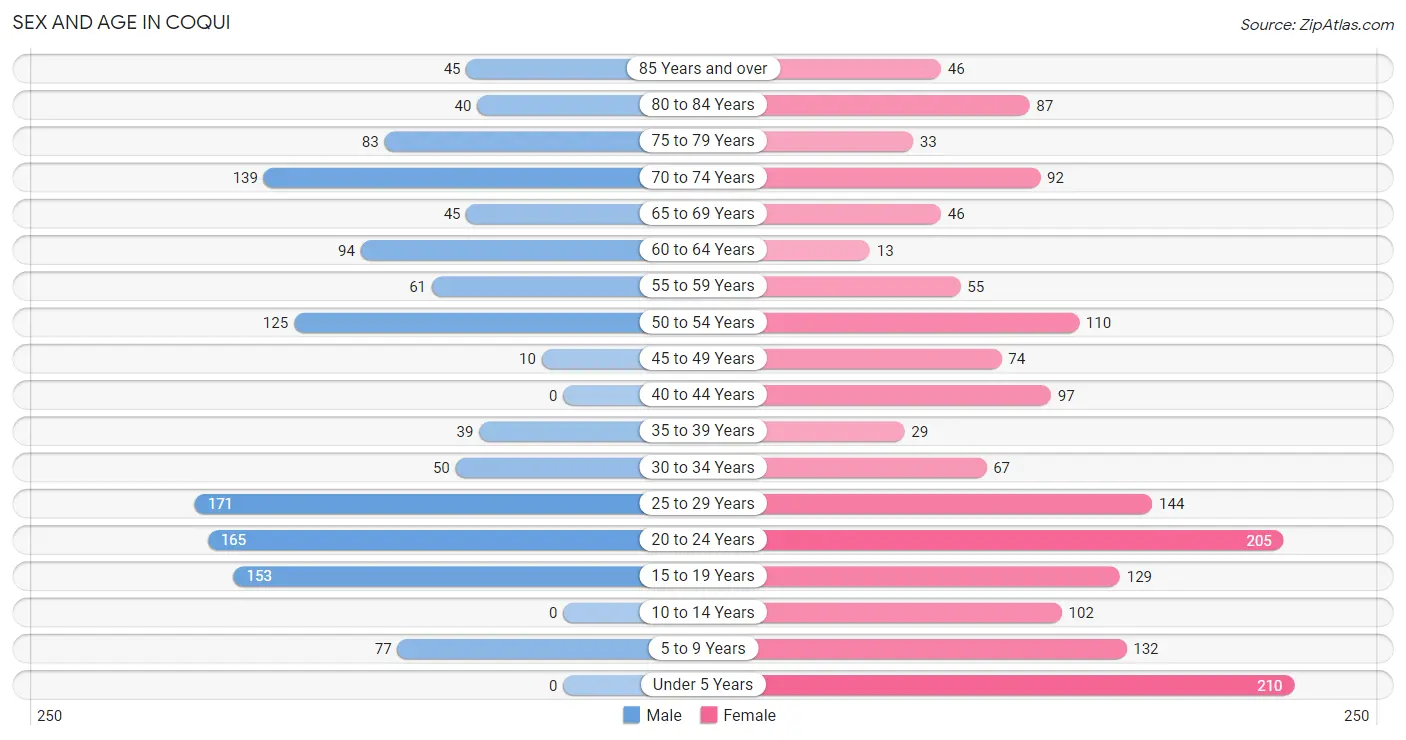
| Age Bracket | Male | Female |
| Under 5 Years | 0 (0.0%) | 210 (12.6%) |
| 5 to 9 Years | 77 (5.9%) | 132 (7.9%) |
| 10 to 14 Years | 0 (0.0%) | 102 (6.1%) |
| 15 to 19 Years | 153 (11.8%) | 129 (7.7%) |
| 20 to 24 Years | 165 (12.7%) | 205 (12.3%) |
| 25 to 29 Years | 171 (13.2%) | 144 (8.6%) |
| 30 to 34 Years | 50 (3.9%) | 67 (4.0%) |
| 35 to 39 Years | 39 (3.0%) | 29 (1.7%) |
| 40 to 44 Years | 0 (0.0%) | 97 (5.8%) |
| 45 to 49 Years | 10 (0.8%) | 74 (4.4%) |
| 50 to 54 Years | 125 (9.6%) | 110 (6.6%) |
| 55 to 59 Years | 61 (4.7%) | 55 (3.3%) |
| 60 to 64 Years | 94 (7.2%) | 13 (0.8%) |
| 65 to 69 Years | 45 (3.5%) | 46 (2.8%) |
| 70 to 74 Years | 139 (10.7%) | 92 (5.5%) |
| 75 to 79 Years | 83 (6.4%) | 33 (2.0%) |
| 80 to 84 Years | 40 (3.1%) | 87 (5.2%) |
| 85 Years and over | 45 (3.5%) | 46 (2.8%) |
| Total | 1,297 (100.0%) | 1,671 (100.0%) |
Families and Households in Coqui
Median Family Size in Coqui
The median family size in Coqui is 3.49 persons per family, with married-couple families (501 | 68.3%) accounting for the largest median family size of 3.71 persons per family. On the other hand, single male/father families (18 | 2.5%) represent the smallest median family size with 1.78 persons per family.
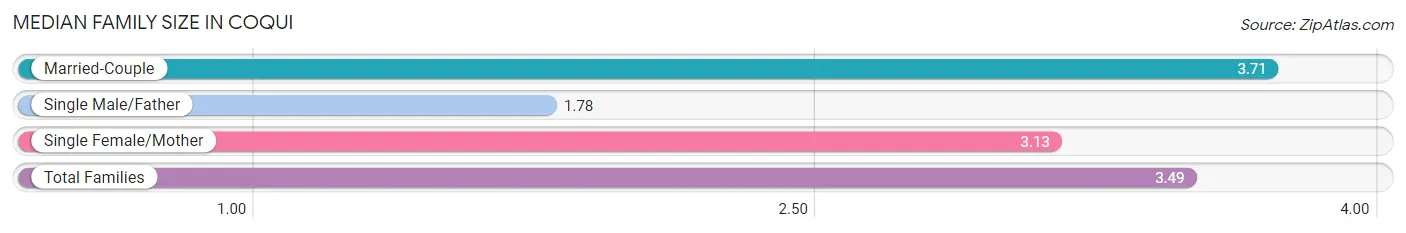
| Family Type | # Families | Family Size |
| Married-Couple | 501 (68.3%) | 3.71 |
| Single Male/Father | 18 (2.5%) | 1.78 |
| Single Female/Mother | 215 (29.3%) | 3.13 |
| Total Families | 734 (100.0%) | 3.49 |
Median Household Size in Coqui
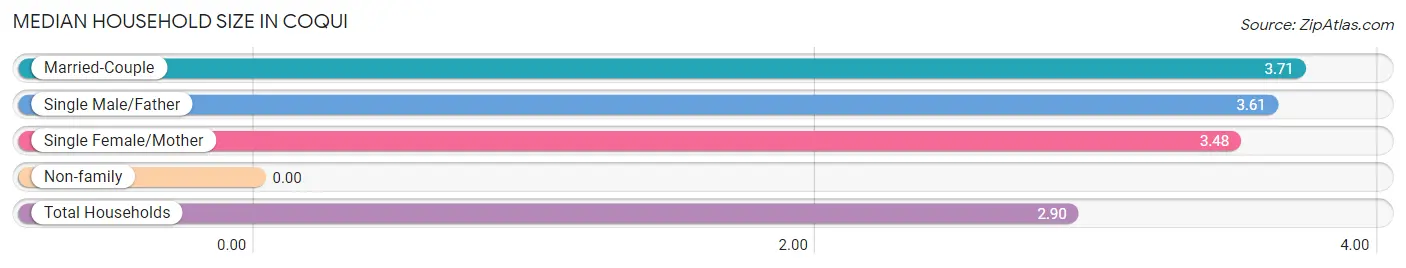
| Household Type | # Households | Household Size |
| Married-Couple | 501 (49.2%) | 3.71 |
| Single Male/Father | 18 (1.8%) | 3.61 |
| Single Female/Mother | 215 (21.1%) | 3.48 |
| Non-family | 284 (27.9%) | - |
| Total Households | 1,018 (100.0%) | 2.90 |
Household Size by Marriage Status in Coqui
Out of a total of 1,018 households in Coqui, 734 (72.1%) are family households, while 284 (27.9%) are nonfamily households. The most numerous type of family households are 2-person households, comprising 360, and the most common type of nonfamily households are 1-person households, comprising 284.
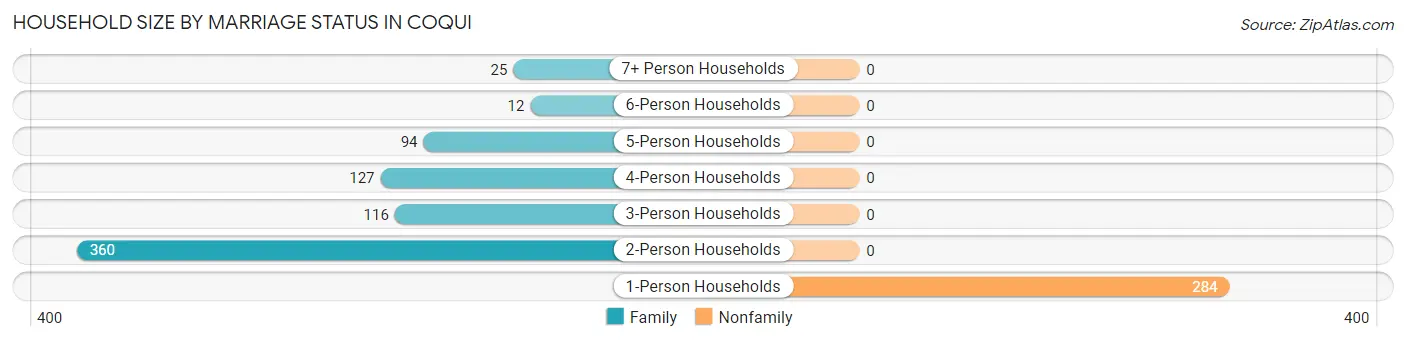
| Household Size | Family Households | Nonfamily Households |
| 1-Person Households | - | 284 (27.9%) |
| 2-Person Households | 360 (35.4%) | 0 (0.0%) |
| 3-Person Households | 116 (11.4%) | 0 (0.0%) |
| 4-Person Households | 127 (12.5%) | 0 (0.0%) |
| 5-Person Households | 94 (9.2%) | 0 (0.0%) |
| 6-Person Households | 12 (1.2%) | 0 (0.0%) |
| 7+ Person Households | 25 (2.5%) | 0 (0.0%) |
| Total | 734 (72.1%) | 284 (27.9%) |
Female Fertility in Coqui
Fertility by Age in Coqui
Average fertility rate in Coqui is 74.0 births per 1,000 women. Women in the age bracket of 20 to 34 years have the highest fertility rate with 132.0 births per 1,000 women. Women in the age bracket of 20 to 34 years acount for 100.0% of all women with births.
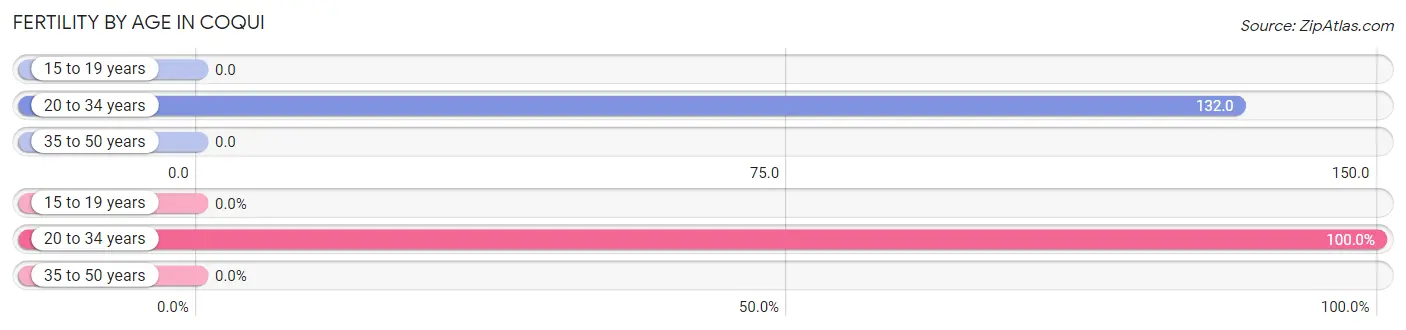
| Age Bracket | Women with Births | Births / 1,000 Women |
| 15 to 19 years | 0 (0.0%) | 0.0 |
| 20 to 34 years | 55 (100.0%) | 132.0 |
| 35 to 50 years | 0 (0.0%) | 0.0 |
| Total | 55 (100.0%) | 74.0 |
Fertility by Age by Marriage Status in Coqui
60.0% of women with births (55) in Coqui are married. The highest percentage of unmarried women with births falls into 20 to 34 years age bracket with 40.0% of them unmarried at the time of birth, while the lowest percentage of unmarried women with births belong to 20 to 34 years age bracket with 40.0% of them unmarried.
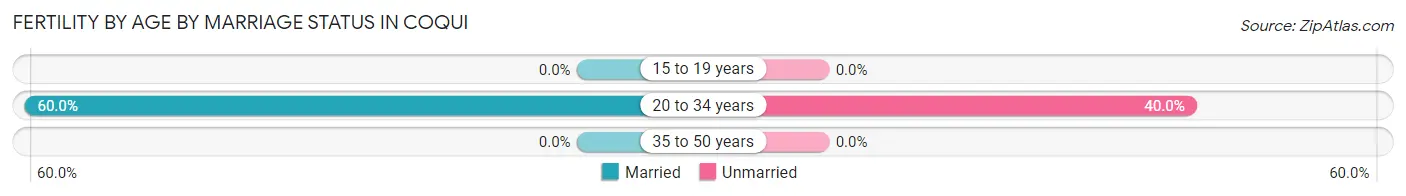
| Age Bracket | Married | Unmarried |
| 15 to 19 years | 0 (0.0%) | 0 (0.0%) |
| 20 to 34 years | 33 (60.0%) | 22 (40.0%) |
| 35 to 50 years | 0 (0.0%) | 0 (0.0%) |
| Total | 33 (60.0%) | 22 (40.0%) |
Fertility by Education in Coqui
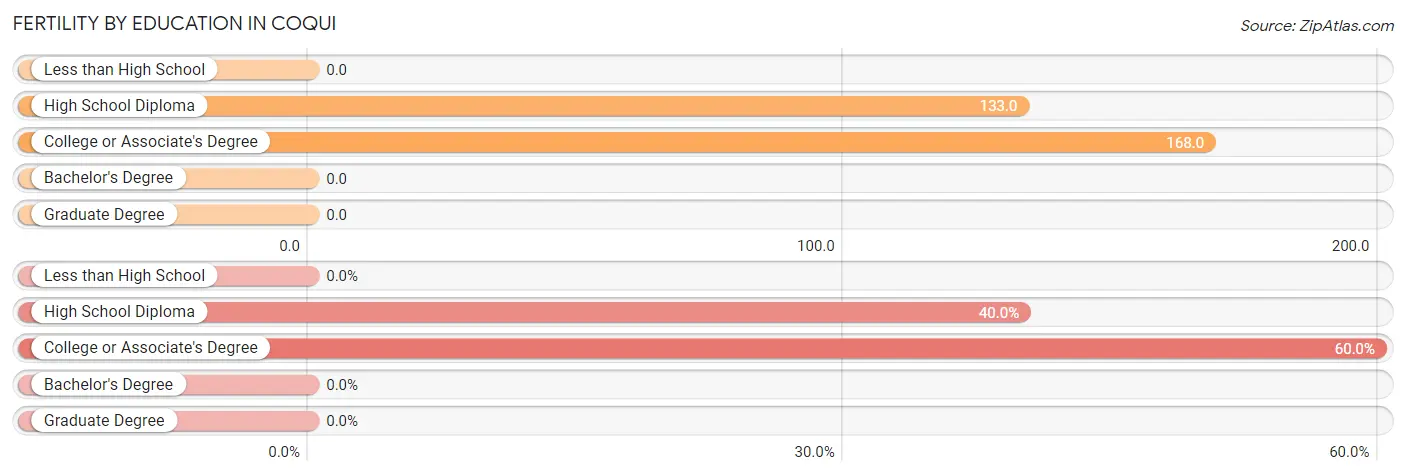
| Educational Attainment | Women with Births | Births / 1,000 Women |
| Less than High School | 0 (0.0%) | 0.0 |
| High School Diploma | 22 (40.0%) | 133.0 |
| College or Associate's Degree | 33 (60.0%) | 168.0 |
| Bachelor's Degree | 0 (0.0%) | 0.0 |
| Graduate Degree | 0 (0.0%) | 0.0 |
| Total | 55 (100.0%) | 74.0 |
Fertility by Education by Marriage Status in Coqui
40.0% of women with births in Coqui are unmarried. Women with the educational attainment of college or associate's degree are most likely to be married with 100.0% of them married at childbirth, while women with the educational attainment of high school diploma are least likely to be married with 100.0% of them unmarried at childbirth.
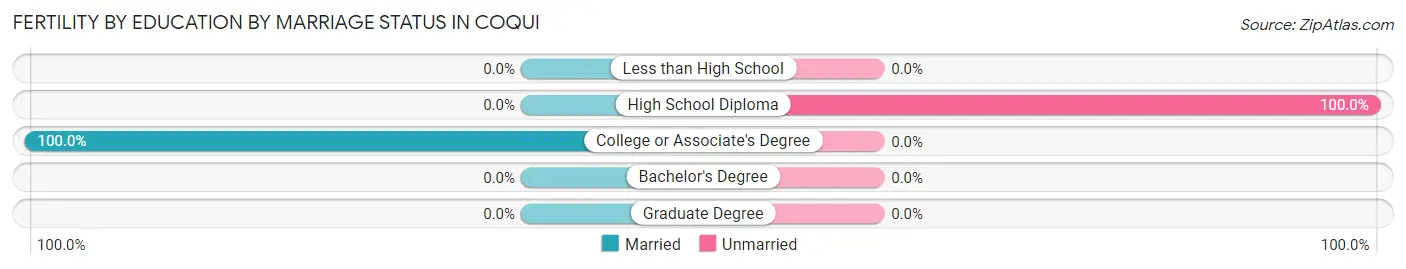
| Educational Attainment | Married | Unmarried |
| Less than High School | 0 (0.0%) | 0 (0.0%) |
| High School Diploma | 0 (0.0%) | 22 (100.0%) |
| College or Associate's Degree | 33 (100.0%) | 0 (0.0%) |
| Bachelor's Degree | 0 (0.0%) | 0 (0.0%) |
| Graduate Degree | 0 (0.0%) | 0 (0.0%) |
| Total | 33 (60.0%) | 22 (40.0%) |
Employment Characteristics in Coqui
Employment by Class of Employer in Coqui
Among the 711 employed individuals in Coqui, private company employees (591 | 83.1%), state government employees (85 | 11.9%), and local government employees (19 | 2.7%) make up the most common classes of employment.
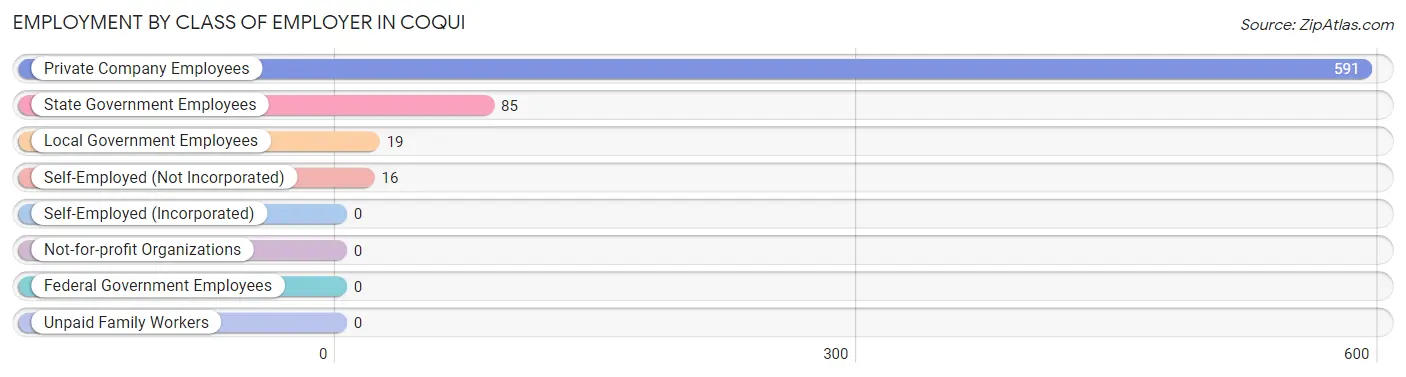
| Employer Class | # Employees | % Employees |
| Private Company Employees | 591 | 83.1% |
| Self-Employed (Incorporated) | 0 | 0.0% |
| Self-Employed (Not Incorporated) | 16 | 2.2% |
| Not-for-profit Organizations | 0 | 0.0% |
| Local Government Employees | 19 | 2.7% |
| State Government Employees | 85 | 11.9% |
| Federal Government Employees | 0 | 0.0% |
| Unpaid Family Workers | 0 | 0.0% |
| Total | 711 | 100.0% |
Employment Status by Age in Coqui
According to the labor force statistics for Coqui, out of the total population over 16 years of age (2,447), 30.6% or 749 individuals are in the labor force, with 5.2% or 39 of them unemployed. The age group with the highest labor force participation rate is 35 to 44 years, with 80.6% or 133 individuals in the labor force. Within the labor force, the 16 to 19 years age range has the highest percentage of unemployed individuals, with 100.0% or 15 of them being unemployed.
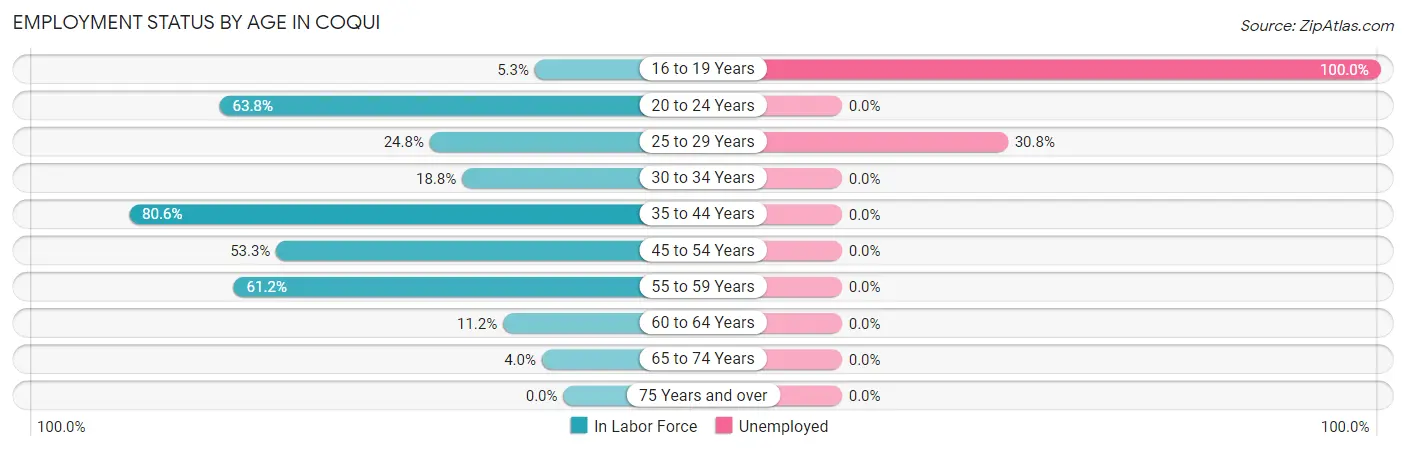
| Age Bracket | In Labor Force | Unemployed |
| 16 to 19 Years | 15 (5.3%) | 15 (100.0%) |
| 20 to 24 Years | 236 (63.8%) | 0 (0.0%) |
| 25 to 29 Years | 78 (24.8%) | 24 (30.8%) |
| 30 to 34 Years | 22 (18.8%) | 0 (0.0%) |
| 35 to 44 Years | 133 (80.6%) | 0 (0.0%) |
| 45 to 54 Years | 170 (53.3%) | 0 (0.0%) |
| 55 to 59 Years | 71 (61.2%) | 0 (0.0%) |
| 60 to 64 Years | 12 (11.2%) | 0 (0.0%) |
| 65 to 74 Years | 13 (4.0%) | 0 (0.0%) |
| 75 Years and over | 0 (0.0%) | 0 (0.0%) |
| Total | 749 (30.6%) | 39 (5.2%) |
Employment Status by Educational Attainment in Coqui
According to labor force statistics for Coqui, 42.7% of individuals (486) out of the total population between 25 and 64 years of age (1,139) are in the labor force, with 4.9% or 24 of them being unemployed. The group with the highest labor force participation rate are those with the educational attainment of college / associate degree, with 65.9% or 149 individuals in the labor force. Within the labor force, individuals with high school diploma education have the highest percentage of unemployment, with 11.8% or 24 of them being unemployed.
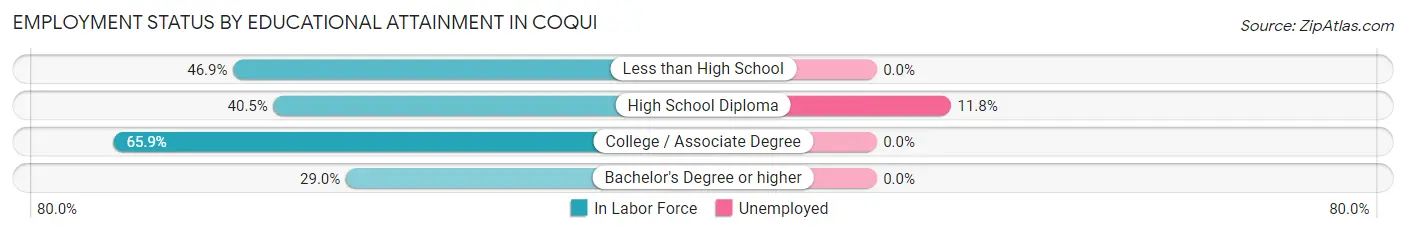
| Educational Attainment | In Labor Force | Unemployed |
| Less than High School | 38 (46.9%) | 0 (0.0%) |
| High School Diploma | 203 (40.5%) | 59 (11.8%) |
| College / Associate Degree | 149 (65.9%) | 0 (0.0%) |
| Bachelor's Degree or higher | 96 (29.0%) | 0 (0.0%) |
| Total | 486 (42.7%) | 56 (4.9%) |
Employment Occupations by Sex in Coqui
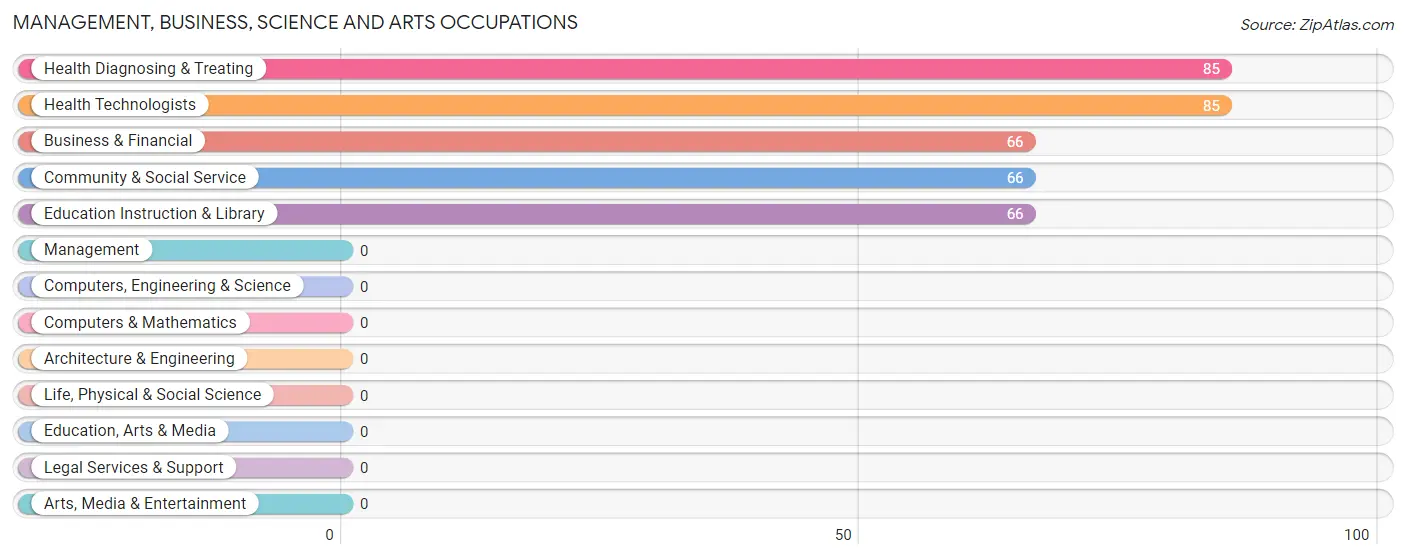
Management, Business, Science and Arts Occupations
The most common Management, Business, Science and Arts occupations in Coqui are Health Diagnosing & Treating (85 | 11.9%), Health Technologists (85 | 11.9%), Business & Financial (66 | 9.3%), Community & Social Service (66 | 9.3%), and Education Instruction & Library (66 | 9.3%).
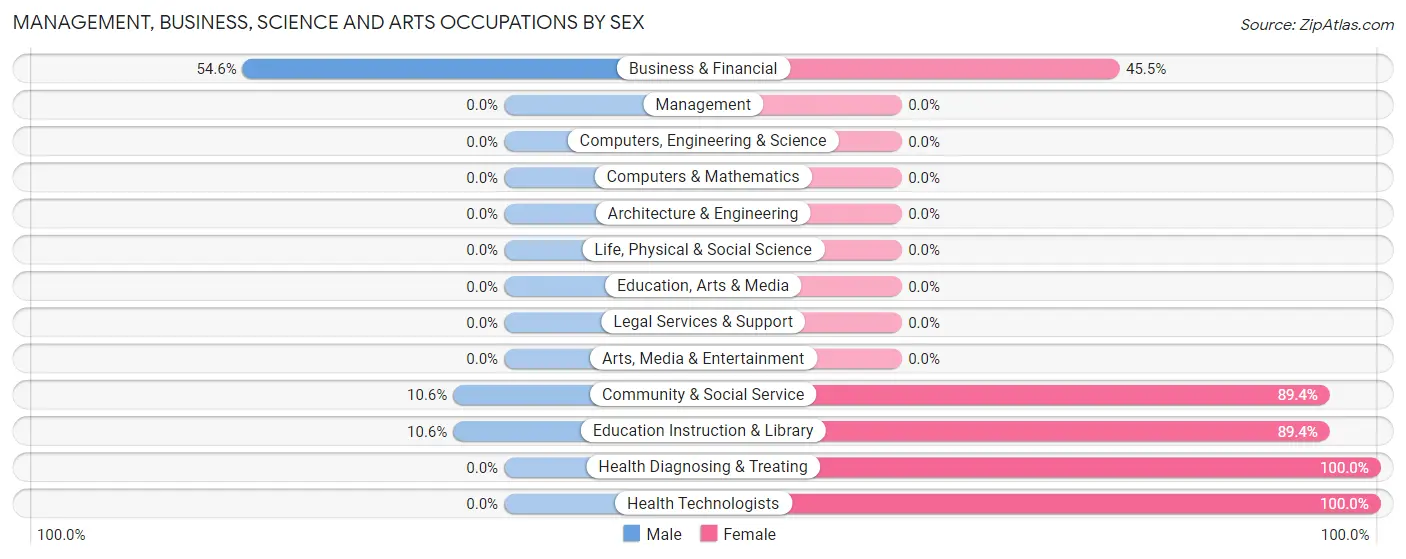
Management, Business, Science and Arts Occupations by Sex
Within the Management, Business, Science and Arts occupations in Coqui, the most male-oriented occupations are Business & Financial (54.5%), Community & Social Service (10.6%), and Education Instruction & Library (10.6%), while the most female-oriented occupations are Health Diagnosing & Treating (100.0%), Health Technologists (100.0%), and Community & Social Service (89.4%).
| Occupation | Male | Female |
| Management | 0 (0.0%) | 0 (0.0%) |
| Business & Financial | 36 (54.5%) | 30 (45.5%) |
| Computers, Engineering & Science | 0 (0.0%) | 0 (0.0%) |
| Computers & Mathematics | 0 (0.0%) | 0 (0.0%) |
| Architecture & Engineering | 0 (0.0%) | 0 (0.0%) |
| Life, Physical & Social Science | 0 (0.0%) | 0 (0.0%) |
| Community & Social Service | 7 (10.6%) | 59 (89.4%) |
| Education, Arts & Media | 0 (0.0%) | 0 (0.0%) |
| Legal Services & Support | 0 (0.0%) | 0 (0.0%) |
| Education Instruction & Library | 7 (10.6%) | 59 (89.4%) |
| Arts, Media & Entertainment | 0 (0.0%) | 0 (0.0%) |
| Health Diagnosing & Treating | 0 (0.0%) | 85 (100.0%) |
| Health Technologists | 0 (0.0%) | 85 (100.0%) |
| Total (Category) | 43 (19.8%) | 174 (80.2%) |
| Total (Overall) | 359 (50.5%) | 352 (49.5%) |
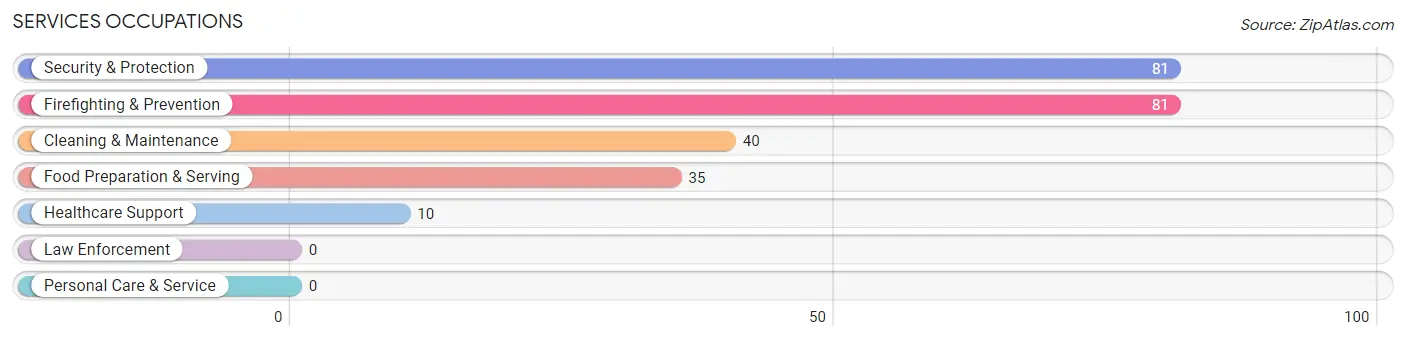
Services Occupations
The most common Services occupations in Coqui are Security & Protection (81 | 11.4%), Firefighting & Prevention (81 | 11.4%), Cleaning & Maintenance (40 | 5.6%), Food Preparation & Serving (35 | 4.9%), and Healthcare Support (10 | 1.4%).
Services Occupations by Sex
Within the Services occupations in Coqui, the most male-oriented occupations are Healthcare Support (100.0%), Cleaning & Maintenance (100.0%), and Security & Protection (60.5%), while the most female-oriented occupations are Food Preparation & Serving (100.0%), Security & Protection (39.5%), and Firefighting & Prevention (39.5%).
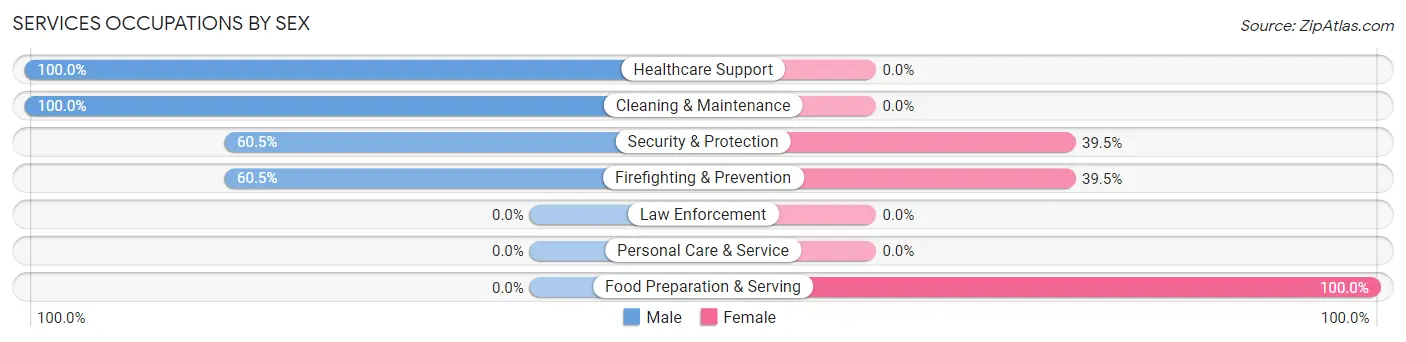
| Occupation | Male | Female |
| Healthcare Support | 10 (100.0%) | 0 (0.0%) |
| Security & Protection | 49 (60.5%) | 32 (39.5%) |
| Firefighting & Prevention | 49 (60.5%) | 32 (39.5%) |
| Law Enforcement | 0 (0.0%) | 0 (0.0%) |
| Food Preparation & Serving | 0 (0.0%) | 35 (100.0%) |
| Cleaning & Maintenance | 40 (100.0%) | 0 (0.0%) |
| Personal Care & Service | 0 (0.0%) | 0 (0.0%) |
| Total (Category) | 99 (59.6%) | 67 (40.4%) |
| Total (Overall) | 359 (50.5%) | 352 (49.5%) |
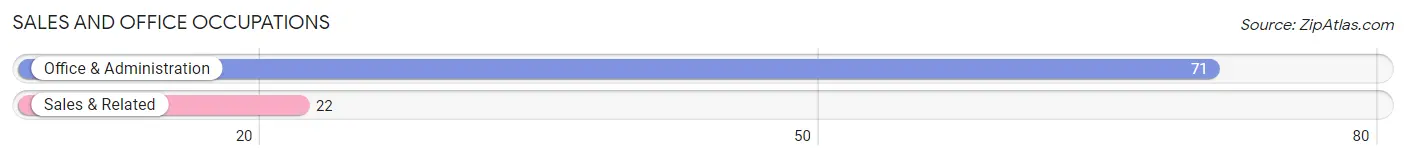
Sales and Office Occupations
The most common Sales and Office occupations in Coqui are Office & Administration (71 | 10.0%), and Sales & Related (22 | 3.1%).
Sales and Office Occupations by Sex
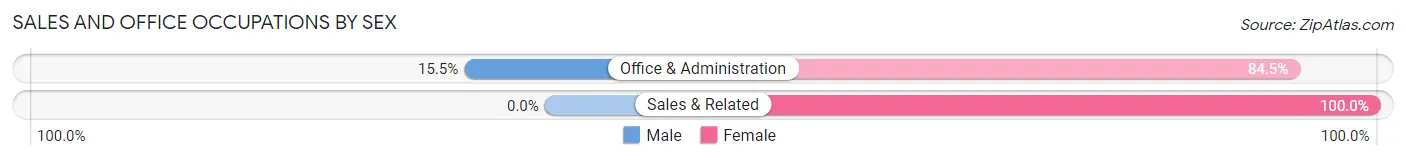
| Occupation | Male | Female |
| Sales & Related | 0 (0.0%) | 22 (100.0%) |
| Office & Administration | 11 (15.5%) | 60 (84.5%) |
| Total (Category) | 11 (11.8%) | 82 (88.2%) |
| Total (Overall) | 359 (50.5%) | 352 (49.5%) |
Natural Resources, Construction and Maintenance Occupations
The most common Natural Resources, Construction and Maintenance occupations in Coqui are Farming, Fishing & Forestry (61 | 8.6%), and Installation, Maintenance & Repair (40 | 5.6%).
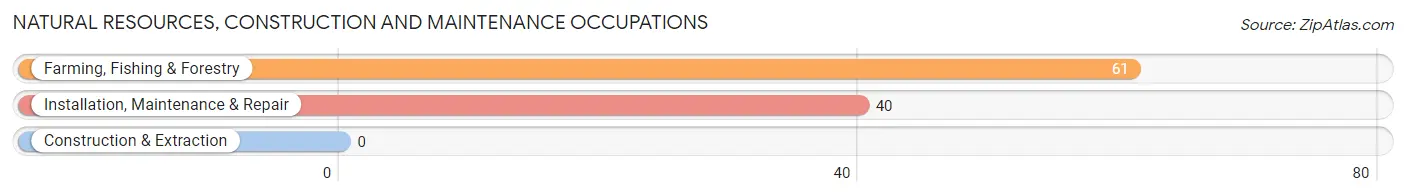
Natural Resources, Construction and Maintenance Occupations by Sex
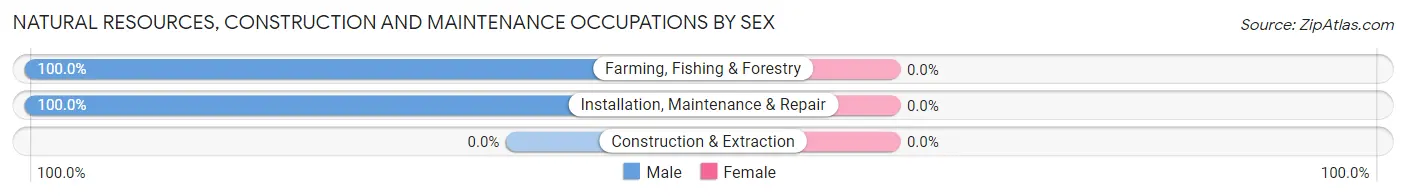
| Occupation | Male | Female |
| Farming, Fishing & Forestry | 61 (100.0%) | 0 (0.0%) |
| Construction & Extraction | 0 (0.0%) | 0 (0.0%) |
| Installation, Maintenance & Repair | 40 (100.0%) | 0 (0.0%) |
| Total (Category) | 101 (100.0%) | 0 (0.0%) |
| Total (Overall) | 359 (50.5%) | 352 (49.5%) |
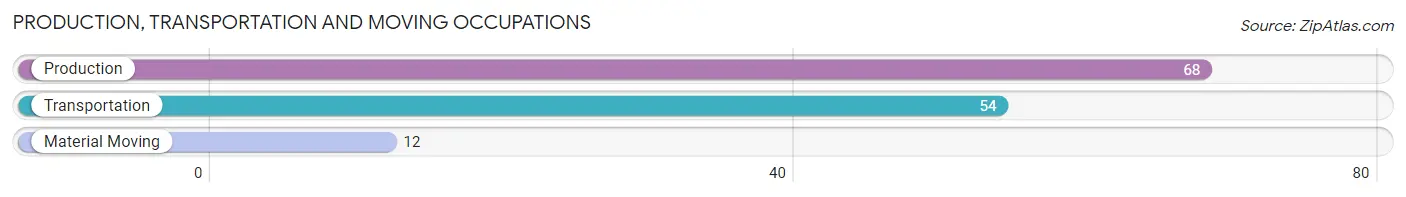
Production, Transportation and Moving Occupations
The most common Production, Transportation and Moving occupations in Coqui are Production (68 | 9.6%), Transportation (54 | 7.6%), and Material Moving (12 | 1.7%).
Production, Transportation and Moving Occupations by Sex
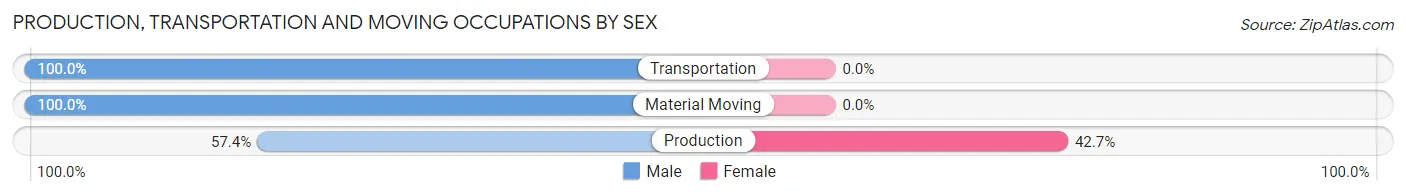
| Occupation | Male | Female |
| Production | 39 (57.4%) | 29 (42.6%) |
| Transportation | 54 (100.0%) | 0 (0.0%) |
| Material Moving | 12 (100.0%) | 0 (0.0%) |
| Total (Category) | 105 (78.4%) | 29 (21.6%) |
| Total (Overall) | 359 (50.5%) | 352 (49.5%) |
Employment Industries by Sex in Coqui
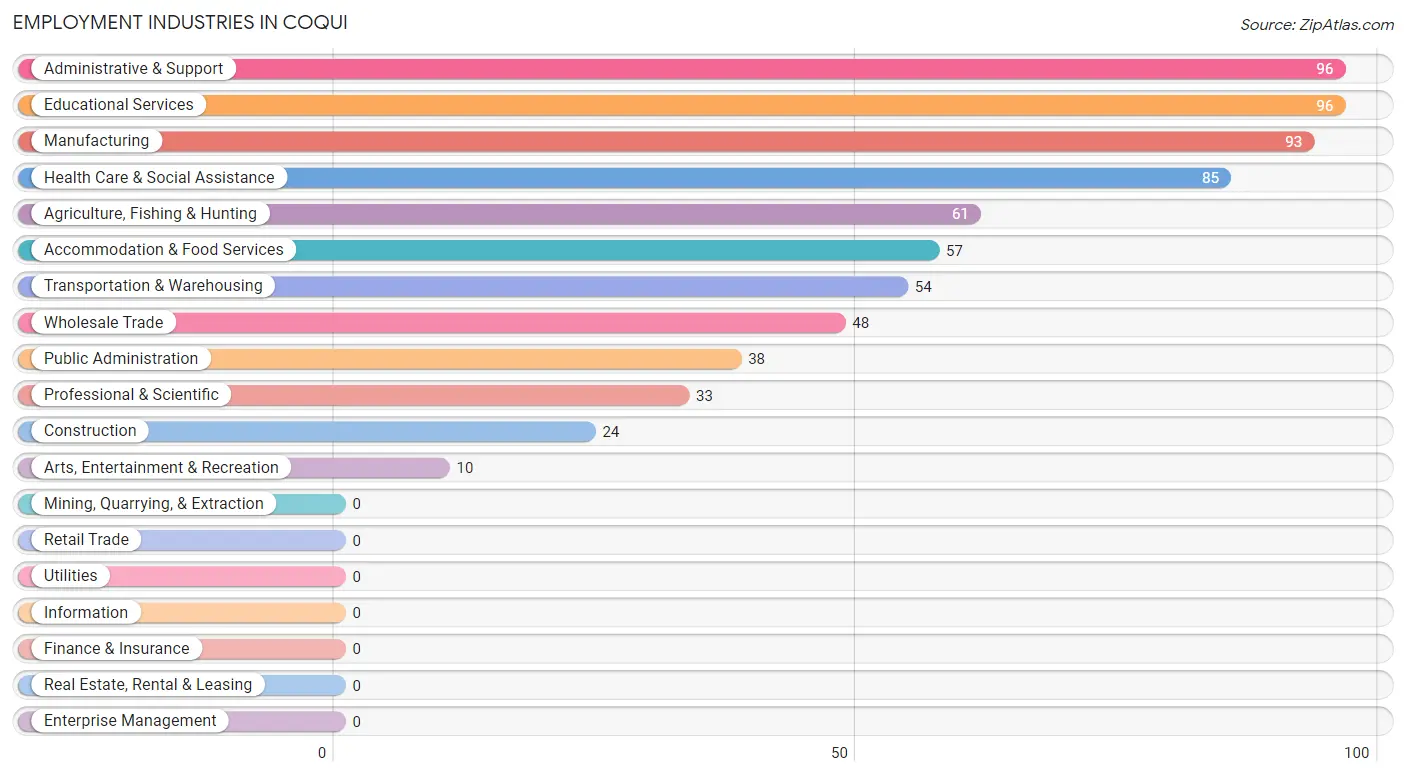
Employment Industries in Coqui
The major employment industries in Coqui include Administrative & Support (96 | 13.5%), Educational Services (96 | 13.5%), Manufacturing (93 | 13.1%), Health Care & Social Assistance (85 | 11.9%), and Agriculture, Fishing & Hunting (61 | 8.6%).
Employment Industries by Sex in Coqui
The Coqui industries that see more men than women are Agriculture, Fishing & Hunting (100.0%), Construction (100.0%), and Wholesale Trade (100.0%), whereas the industries that tend to have a higher number of women are Professional & Scientific (100.0%), Health Care & Social Assistance (100.0%), and Accommodation & Food Services (100.0%).
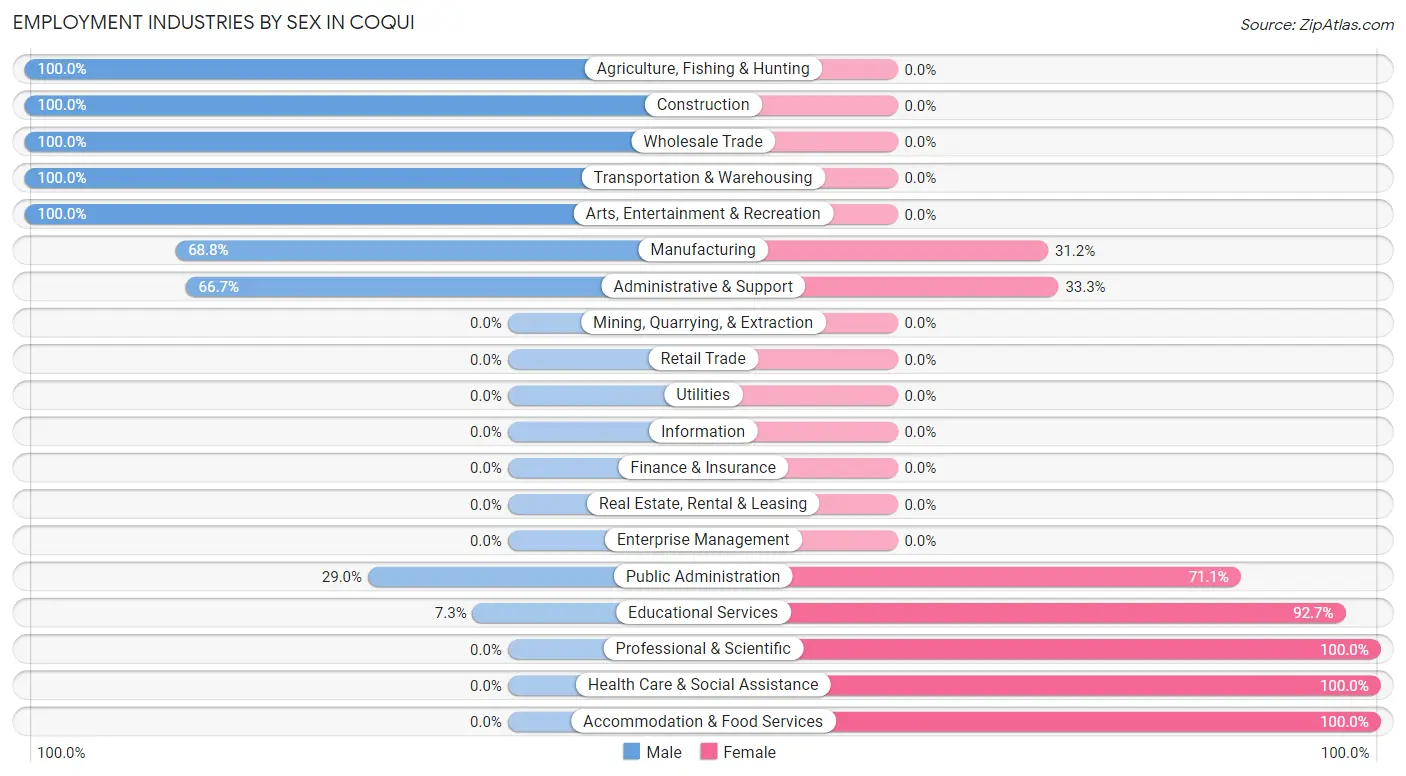
| Industry | Male | Female |
| Agriculture, Fishing & Hunting | 61 (100.0%) | 0 (0.0%) |
| Mining, Quarrying, & Extraction | 0 (0.0%) | 0 (0.0%) |
| Construction | 24 (100.0%) | 0 (0.0%) |
| Manufacturing | 64 (68.8%) | 29 (31.2%) |
| Wholesale Trade | 48 (100.0%) | 0 (0.0%) |
| Retail Trade | 0 (0.0%) | 0 (0.0%) |
| Transportation & Warehousing | 54 (100.0%) | 0 (0.0%) |
| Utilities | 0 (0.0%) | 0 (0.0%) |
| Information | 0 (0.0%) | 0 (0.0%) |
| Finance & Insurance | 0 (0.0%) | 0 (0.0%) |
| Real Estate, Rental & Leasing | 0 (0.0%) | 0 (0.0%) |
| Professional & Scientific | 0 (0.0%) | 33 (100.0%) |
| Enterprise Management | 0 (0.0%) | 0 (0.0%) |
| Administrative & Support | 64 (66.7%) | 32 (33.3%) |
| Educational Services | 7 (7.3%) | 89 (92.7%) |
| Health Care & Social Assistance | 0 (0.0%) | 85 (100.0%) |
| Arts, Entertainment & Recreation | 10 (100.0%) | 0 (0.0%) |
| Accommodation & Food Services | 0 (0.0%) | 57 (100.0%) |
| Public Administration | 11 (28.9%) | 27 (71.1%) |
| Total | 359 (50.5%) | 352 (49.5%) |
Education in Coqui
School Enrollment in Coqui
The most common levels of schooling among the 802 students in Coqui are college / undergraduate (256 | 31.9%), elementary school (209 | 26.1%), and high school (187 | 23.3%).
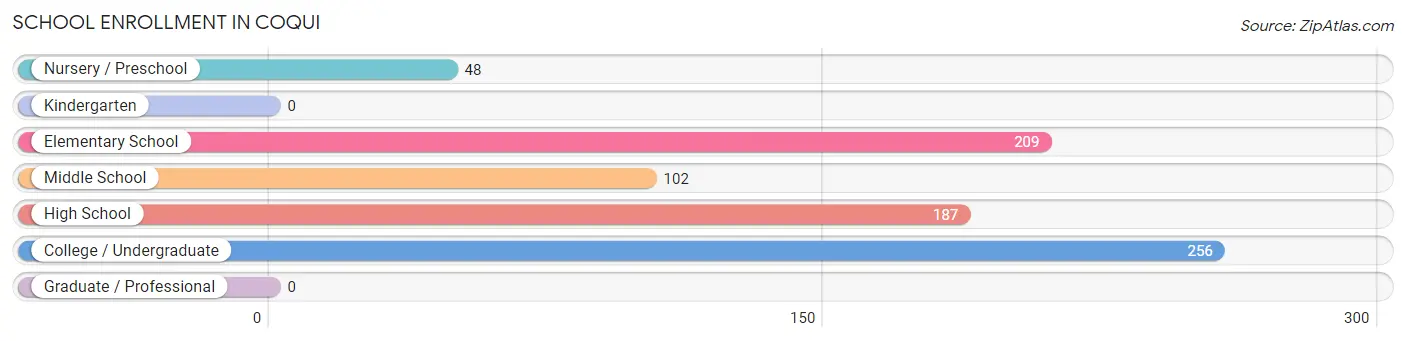
| School Level | # Students | % Students |
| Nursery / Preschool | 48 | 6.0% |
| Kindergarten | 0 | 0.0% |
| Elementary School | 209 | 26.1% |
| Middle School | 102 | 12.7% |
| High School | 187 | 23.3% |
| College / Undergraduate | 256 | 31.9% |
| Graduate / Professional | 0 | 0.0% |
| Total | 802 | 100.0% |
School Enrollment by Age by Funding Source in Coqui
Out of a total of 802 students who are enrolled in schools in Coqui, 227 (28.3%) attend a private institution, while the remaining 575 (71.7%) are enrolled in public schools. The age group of 18 to 19 year olds has the highest likelihood of being enrolled in private schools, with 130 (77.4% in the age bracket) enrolled. Conversely, the age group of 3 to 4 year olds has the lowest likelihood of being enrolled in a private school, with 48 (100.0% in the age bracket) attending a public institution.
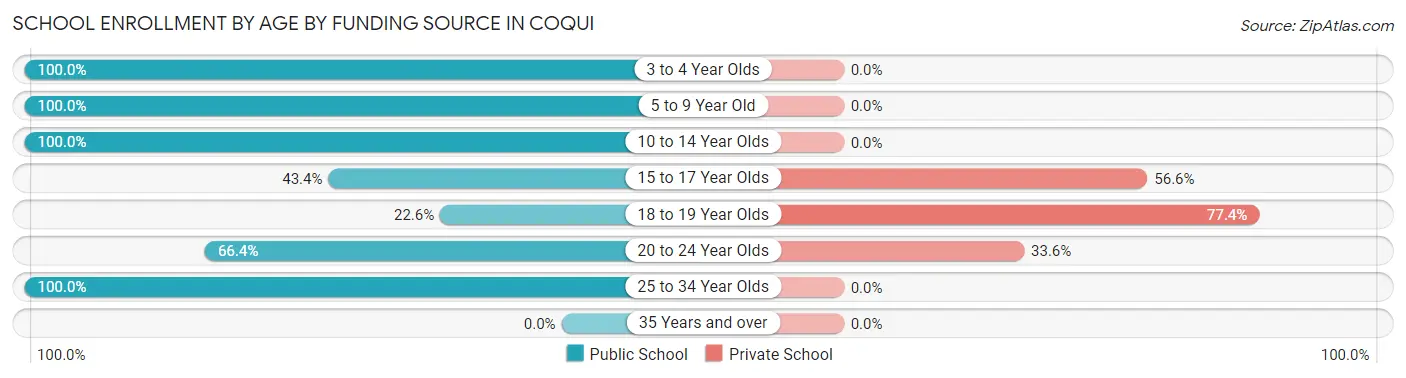
| Age Bracket | Public School | Private School |
| 3 to 4 Year Olds | 48 (100.0%) | 0 (0.0%) |
| 5 to 9 Year Old | 209 (100.0%) | 0 (0.0%) |
| 10 to 14 Year Olds | 102 (100.0%) | 0 (0.0%) |
| 15 to 17 Year Olds | 43 (43.4%) | 56 (56.6%) |
| 18 to 19 Year Olds | 38 (22.6%) | 130 (77.4%) |
| 20 to 24 Year Olds | 81 (66.4%) | 41 (33.6%) |
| 25 to 34 Year Olds | 54 (100.0%) | 0 (0.0%) |
| 35 Years and over | 0 (0.0%) | 0 (0.0%) |
| Total | 575 (71.7%) | 227 (28.3%) |
Educational Attainment by Field of Study in Coqui
Business (153 | 34.7%), education (151 | 34.2%), science & technology (67 | 15.2%), communications (30 | 6.8%), and liberal arts & history (27 | 6.1%) are the most common fields of study among 441 individuals in Coqui who have obtained a bachelor's degree or higher.
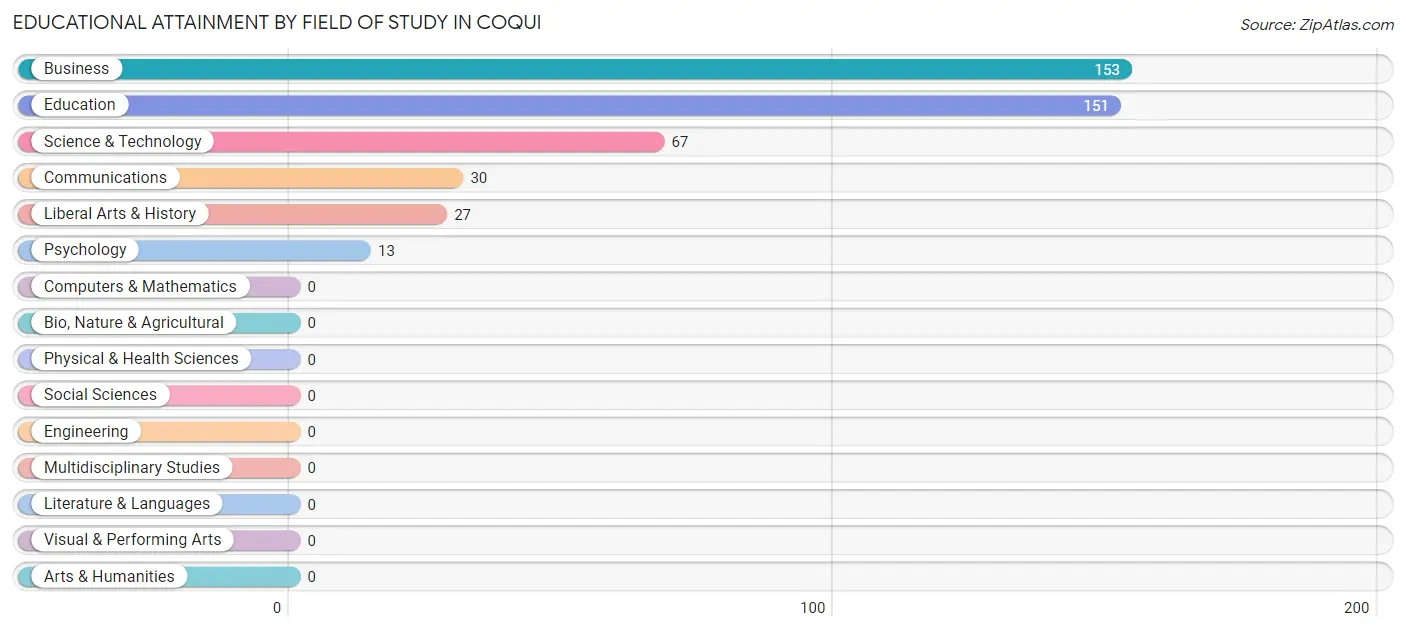
| Field of Study | # Graduates | % Graduates |
| Computers & Mathematics | 0 | 0.0% |
| Bio, Nature & Agricultural | 0 | 0.0% |
| Physical & Health Sciences | 0 | 0.0% |
| Psychology | 13 | 2.9% |
| Social Sciences | 0 | 0.0% |
| Engineering | 0 | 0.0% |
| Multidisciplinary Studies | 0 | 0.0% |
| Science & Technology | 67 | 15.2% |
| Business | 153 | 34.7% |
| Education | 151 | 34.2% |
| Literature & Languages | 0 | 0.0% |
| Liberal Arts & History | 27 | 6.1% |
| Visual & Performing Arts | 0 | 0.0% |
| Communications | 30 | 6.8% |
| Arts & Humanities | 0 | 0.0% |
| Total | 441 | 100.0% |
Transportation & Commute in Coqui
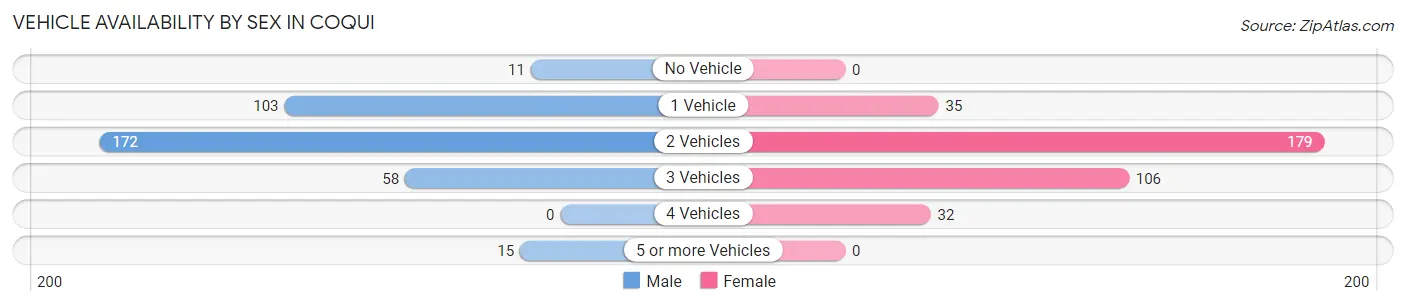
Vehicle Availability by Sex in Coqui
The most prevalent vehicle ownership categories in Coqui are males with 2 vehicles (172, accounting for 47.9%) and females with 2 vehicles (179, making up 48.9%).
| Vehicles Available | Male | Female |
| No Vehicle | 11 (3.1%) | 0 (0.0%) |
| 1 Vehicle | 103 (28.7%) | 35 (9.9%) |
| 2 Vehicles | 172 (47.9%) | 179 (50.8%) |
| 3 Vehicles | 58 (16.2%) | 106 (30.1%) |
| 4 Vehicles | 0 (0.0%) | 32 (9.1%) |
| 5 or more Vehicles | 15 (4.2%) | 0 (0.0%) |
| Total | 359 (100.0%) | 352 (100.0%) |
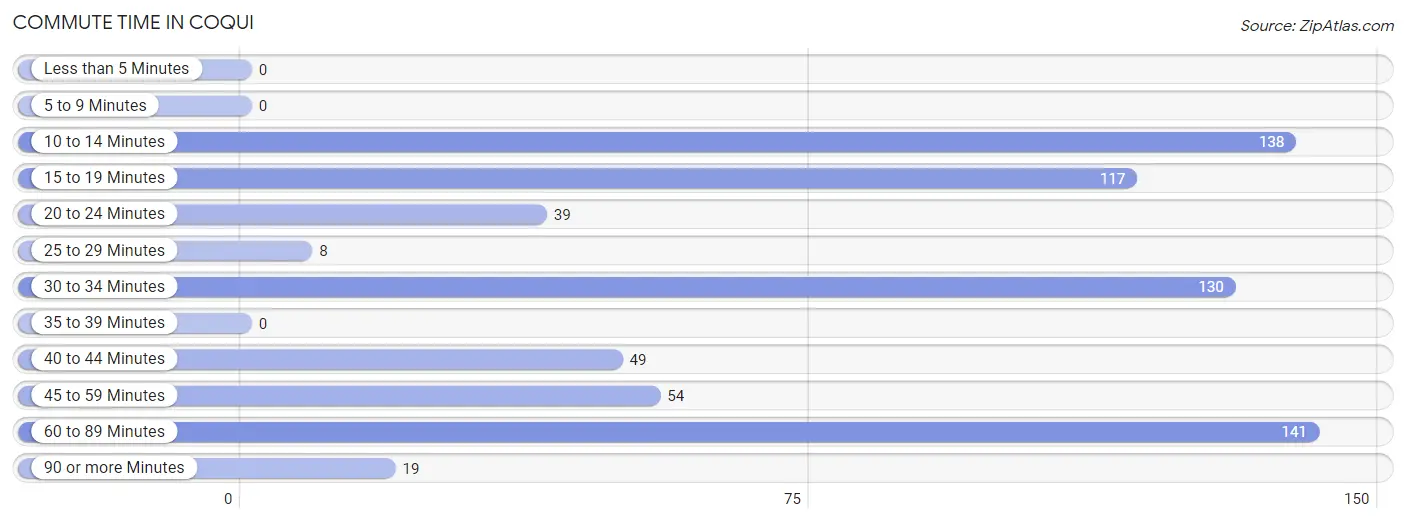
Commute Time in Coqui
The most frequently occuring commute durations in Coqui are 60 to 89 minutes (141 commuters, 20.3%), 10 to 14 minutes (138 commuters, 19.9%), and 30 to 34 minutes (130 commuters, 18.7%).
| Commute Time | # Commuters | % Commuters |
| Less than 5 Minutes | 0 | 0.0% |
| 5 to 9 Minutes | 0 | 0.0% |
| 10 to 14 Minutes | 138 | 19.9% |
| 15 to 19 Minutes | 117 | 16.8% |
| 20 to 24 Minutes | 39 | 5.6% |
| 25 to 29 Minutes | 8 | 1.1% |
| 30 to 34 Minutes | 130 | 18.7% |
| 35 to 39 Minutes | 0 | 0.0% |
| 40 to 44 Minutes | 49 | 7.0% |
| 45 to 59 Minutes | 54 | 7.8% |
| 60 to 89 Minutes | 141 | 20.3% |
| 90 or more Minutes | 19 | 2.7% |
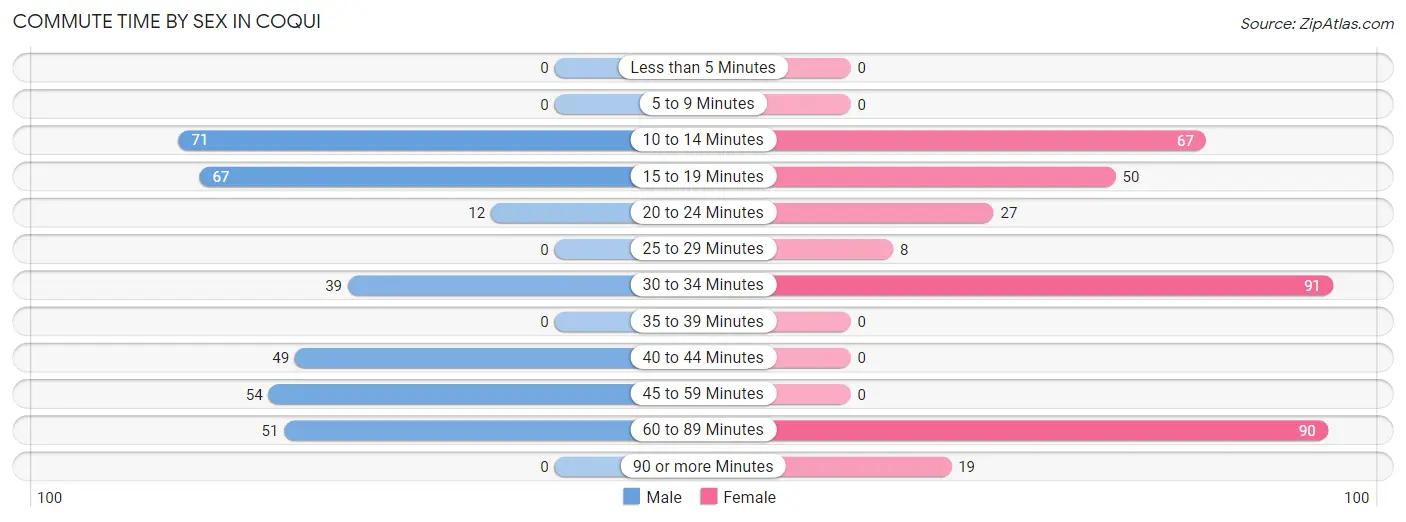
Commute Time by Sex in Coqui
The most common commute times in Coqui are 10 to 14 minutes (71 commuters, 20.7%) for males and 30 to 34 minutes (91 commuters, 25.9%) for females.
| Commute Time | Male | Female |
| Less than 5 Minutes | 0 (0.0%) | 0 (0.0%) |
| 5 to 9 Minutes | 0 (0.0%) | 0 (0.0%) |
| 10 to 14 Minutes | 71 (20.7%) | 67 (19.0%) |
| 15 to 19 Minutes | 67 (19.5%) | 50 (14.2%) |
| 20 to 24 Minutes | 12 (3.5%) | 27 (7.7%) |
| 25 to 29 Minutes | 0 (0.0%) | 8 (2.3%) |
| 30 to 34 Minutes | 39 (11.4%) | 91 (25.9%) |
| 35 to 39 Minutes | 0 (0.0%) | 0 (0.0%) |
| 40 to 44 Minutes | 49 (14.3%) | 0 (0.0%) |
| 45 to 59 Minutes | 54 (15.7%) | 0 (0.0%) |
| 60 to 89 Minutes | 51 (14.9%) | 90 (25.6%) |
| 90 or more Minutes | 0 (0.0%) | 19 (5.4%) |
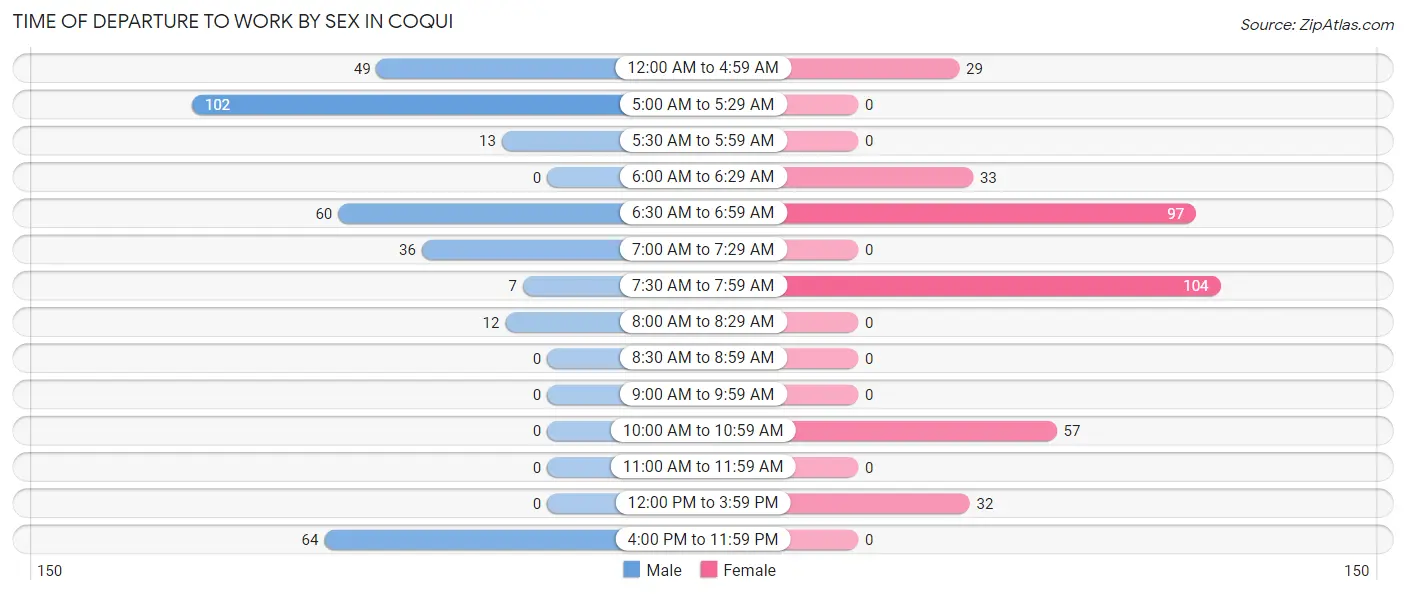
Time of Departure to Work by Sex in Coqui
The most frequent times of departure to work in Coqui are 5:00 AM to 5:29 AM (102, 29.7%) for males and 7:30 AM to 7:59 AM (104, 29.5%) for females.
| Time of Departure | Male | Female |
| 12:00 AM to 4:59 AM | 49 (14.3%) | 29 (8.2%) |
| 5:00 AM to 5:29 AM | 102 (29.7%) | 0 (0.0%) |
| 5:30 AM to 5:59 AM | 13 (3.8%) | 0 (0.0%) |
| 6:00 AM to 6:29 AM | 0 (0.0%) | 33 (9.4%) |
| 6:30 AM to 6:59 AM | 60 (17.5%) | 97 (27.6%) |
| 7:00 AM to 7:29 AM | 36 (10.5%) | 0 (0.0%) |
| 7:30 AM to 7:59 AM | 7 (2.0%) | 104 (29.5%) |
| 8:00 AM to 8:29 AM | 12 (3.5%) | 0 (0.0%) |
| 8:30 AM to 8:59 AM | 0 (0.0%) | 0 (0.0%) |
| 9:00 AM to 9:59 AM | 0 (0.0%) | 0 (0.0%) |
| 10:00 AM to 10:59 AM | 0 (0.0%) | 57 (16.2%) |
| 11:00 AM to 11:59 AM | 0 (0.0%) | 0 (0.0%) |
| 12:00 PM to 3:59 PM | 0 (0.0%) | 32 (9.1%) |
| 4:00 PM to 11:59 PM | 64 (18.7%) | 0 (0.0%) |
| Total | 343 (100.0%) | 352 (100.0%) |
Housing Occupancy in Coqui
Occupancy by Ownership in Coqui
Of the total 1,018 dwellings in Coqui, owner-occupied units account for 771 (75.7%), while renter-occupied units make up 247 (24.3%).
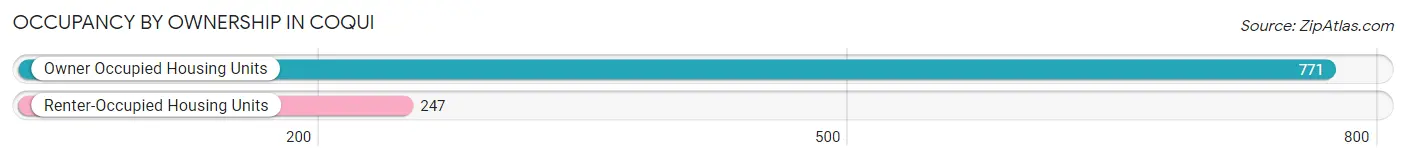
| Occupancy | # Housing Units | % Housing Units |
| Owner Occupied Housing Units | 771 | 75.7% |
| Renter-Occupied Housing Units | 247 | 24.3% |
| Total Occupied Housing Units | 1,018 | 100.0% |
Occupancy by Household Size in Coqui
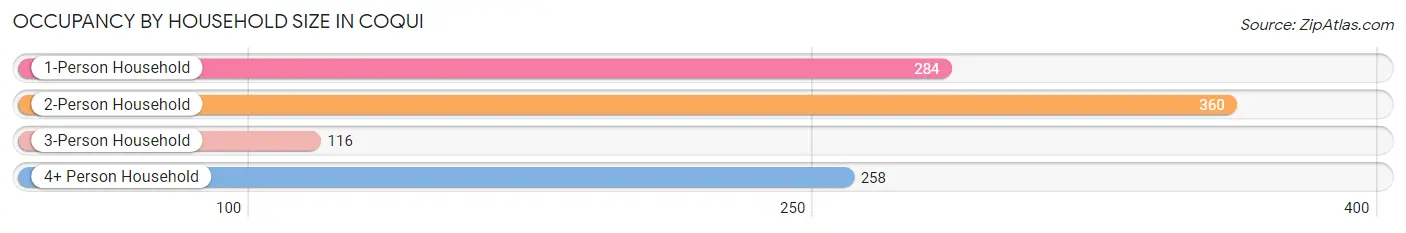
| Household Size | # Housing Units | % Housing Units |
| 1-Person Household | 284 | 27.9% |
| 2-Person Household | 360 | 35.4% |
| 3-Person Household | 116 | 11.4% |
| 4+ Person Household | 258 | 25.3% |
| Total Housing Units | 1,018 | 100.0% |
Occupancy by Ownership by Household Size in Coqui
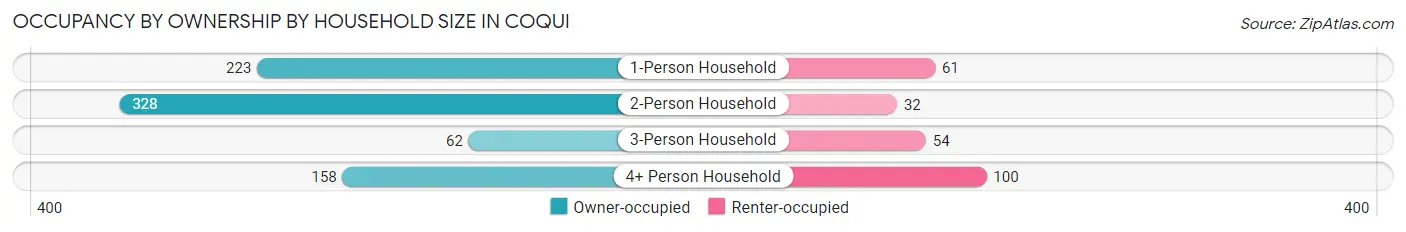
| Household Size | Owner-occupied | Renter-occupied |
| 1-Person Household | 223 (78.5%) | 61 (21.5%) |
| 2-Person Household | 328 (91.1%) | 32 (8.9%) |
| 3-Person Household | 62 (53.4%) | 54 (46.6%) |
| 4+ Person Household | 158 (61.2%) | 100 (38.8%) |
| Total Housing Units | 771 (75.7%) | 247 (24.3%) |
Occupancy by Educational Attainment in Coqui
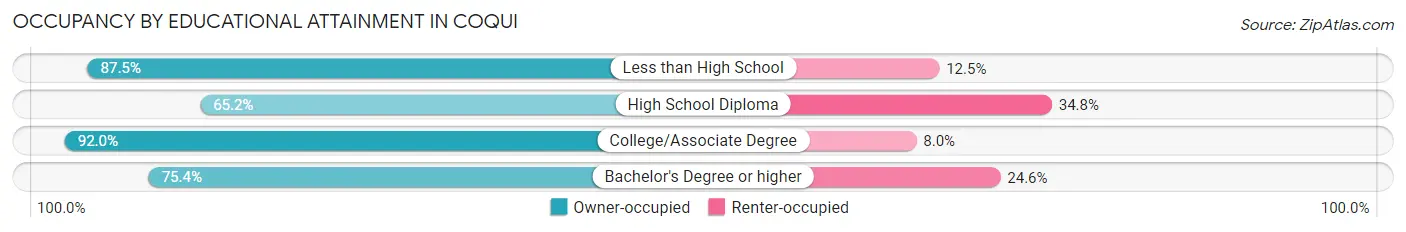
| Household Size | Owner-occupied | Renter-occupied |
| Less than High School | 224 (87.5%) | 32 (12.5%) |
| High School Diploma | 322 (65.2%) | 172 (34.8%) |
| College/Associate Degree | 127 (92.0%) | 11 (8.0%) |
| Bachelor's Degree or higher | 98 (75.4%) | 32 (24.6%) |
Occupancy by Age of Householder in Coqui
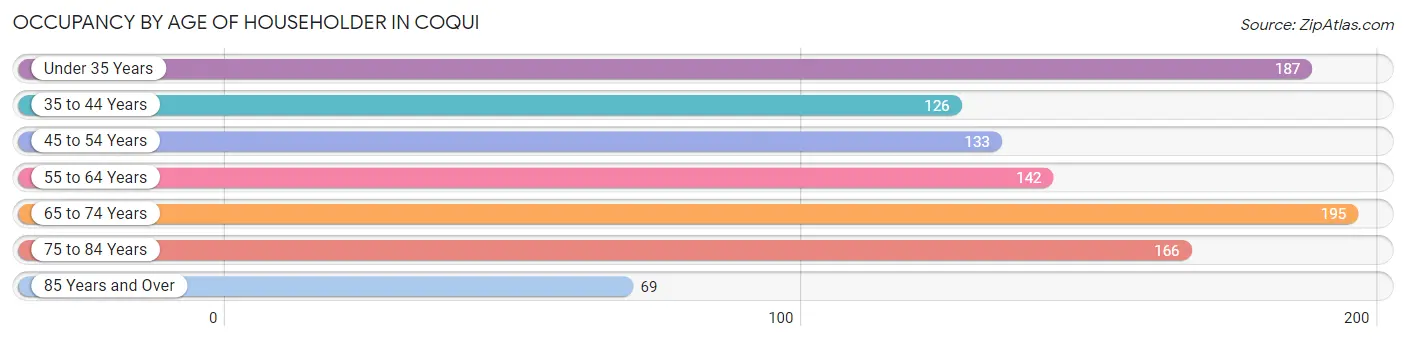
| Age Bracket | # Households | % Households |
| Under 35 Years | 187 | 18.4% |
| 35 to 44 Years | 126 | 12.4% |
| 45 to 54 Years | 133 | 13.1% |
| 55 to 64 Years | 142 | 14.0% |
| 65 to 74 Years | 195 | 19.2% |
| 75 to 84 Years | 166 | 16.3% |
| 85 Years and Over | 69 | 6.8% |
| Total | 1,018 | 100.0% |
Housing Finances in Coqui
Median Income by Occupancy in Coqui
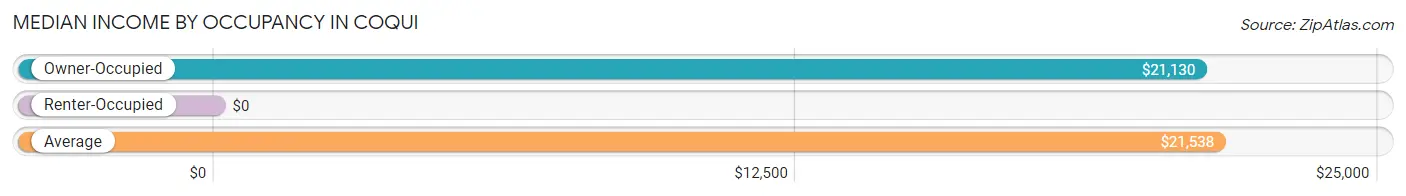
| Occupancy Type | # Households | Median Income |
| Owner-Occupied | 771 (75.7%) | $21,130 |
| Renter-Occupied | 247 (24.3%) | $0 |
| Average | 1,018 (100.0%) | $21,538 |
Occupancy by Householder Income Bracket in Coqui
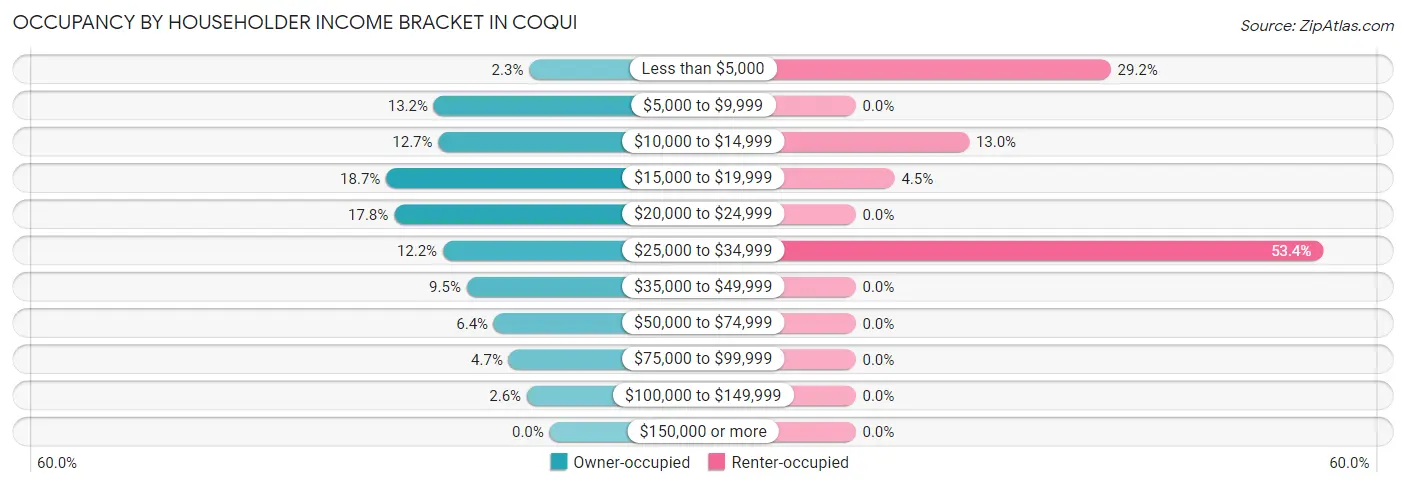
| Income Bracket | Owner-occupied | Renter-occupied |
| Less than $5,000 | 18 (2.3%) | 72 (29.1%) |
| $5,000 to $9,999 | 102 (13.2%) | 0 (0.0%) |
| $10,000 to $14,999 | 98 (12.7%) | 32 (13.0%) |
| $15,000 to $19,999 | 144 (18.7%) | 11 (4.4%) |
| $20,000 to $24,999 | 137 (17.8%) | 0 (0.0%) |
| $25,000 to $34,999 | 94 (12.2%) | 132 (53.4%) |
| $35,000 to $49,999 | 73 (9.5%) | 0 (0.0%) |
| $50,000 to $74,999 | 49 (6.4%) | 0 (0.0%) |
| $75,000 to $99,999 | 36 (4.7%) | 0 (0.0%) |
| $100,000 to $149,999 | 20 (2.6%) | 0 (0.0%) |
| $150,000 or more | 0 (0.0%) | 0 (0.0%) |
| Total | 771 (100.0%) | 247 (100.0%) |
Monthly Housing Cost Tiers in Coqui
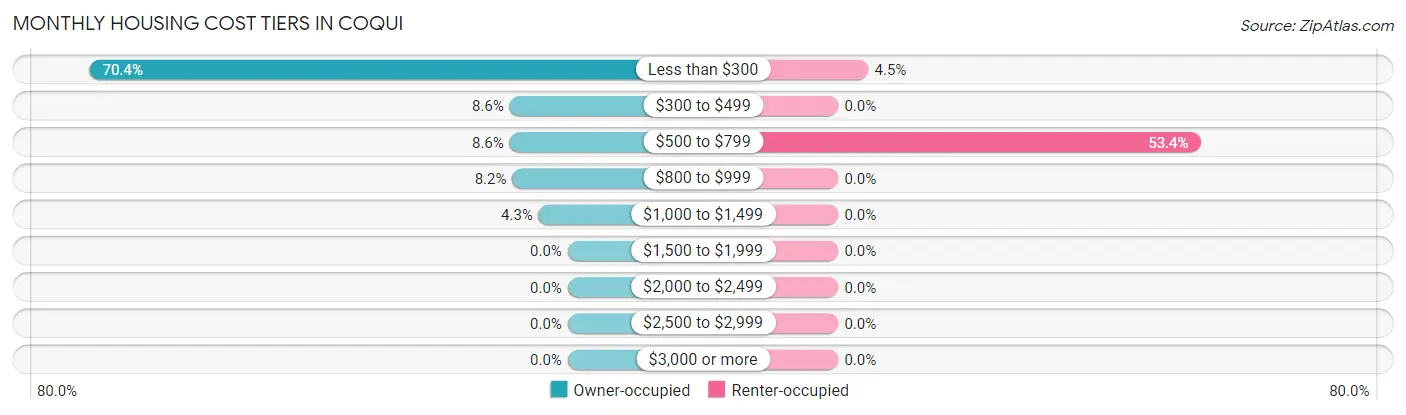
| Monthly Cost | Owner-occupied | Renter-occupied |
| Less than $300 | 543 (70.4%) | 11 (4.4%) |
| $300 to $499 | 66 (8.6%) | 0 (0.0%) |
| $500 to $799 | 66 (8.6%) | 132 (53.4%) |
| $800 to $999 | 63 (8.2%) | 0 (0.0%) |
| $1,000 to $1,499 | 33 (4.3%) | 0 (0.0%) |
| $1,500 to $1,999 | 0 (0.0%) | 0 (0.0%) |
| $2,000 to $2,499 | 0 (0.0%) | 0 (0.0%) |
| $2,500 to $2,999 | 0 (0.0%) | 0 (0.0%) |
| $3,000 or more | 0 (0.0%) | 0 (0.0%) |
| Total | 771 (100.0%) | 247 (100.0%) |
Physical Housing Characteristics in Coqui
Housing Structures in Coqui
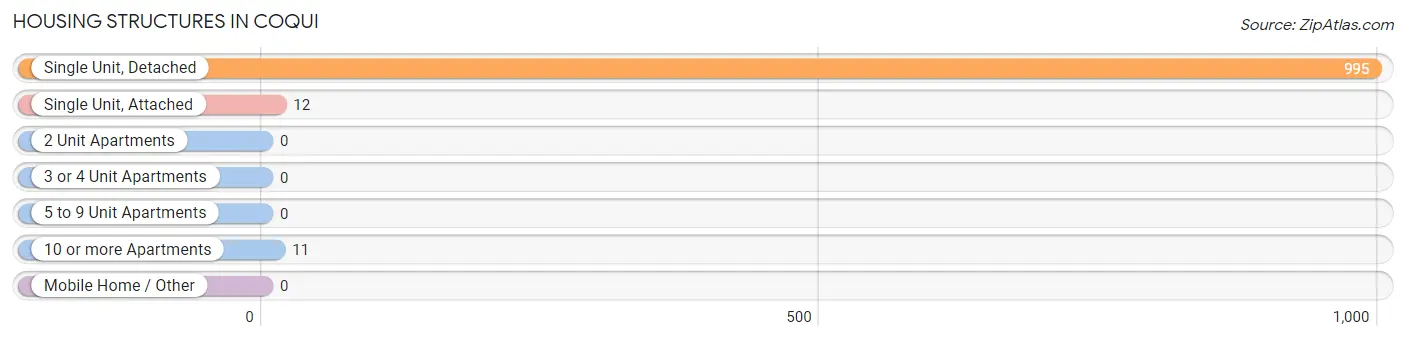
| Structure Type | # Housing Units | % Housing Units |
| Single Unit, Detached | 995 | 97.7% |
| Single Unit, Attached | 12 | 1.2% |
| 2 Unit Apartments | 0 | 0.0% |
| 3 or 4 Unit Apartments | 0 | 0.0% |
| 5 to 9 Unit Apartments | 0 | 0.0% |
| 10 or more Apartments | 11 | 1.1% |
| Mobile Home / Other | 0 | 0.0% |
| Total | 1,018 | 100.0% |
Housing Structures by Occupancy in Coqui
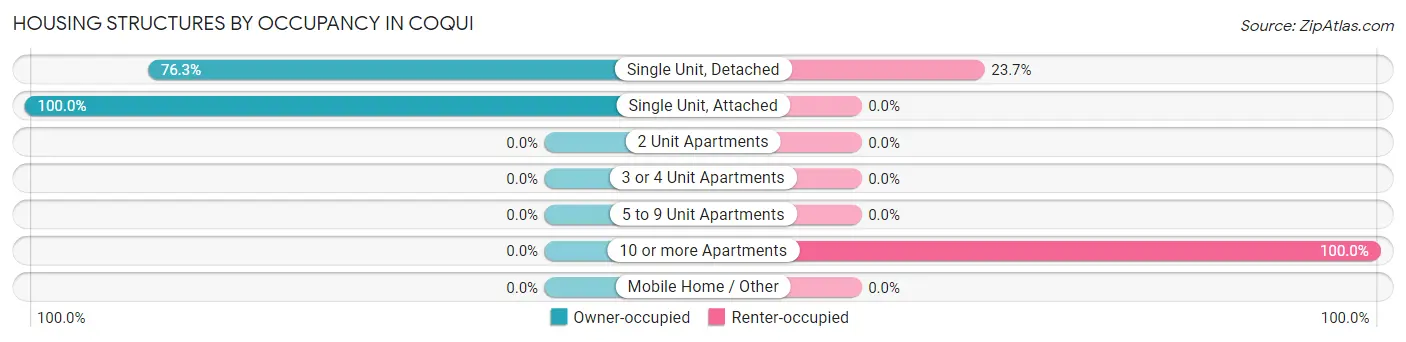
| Structure Type | Owner-occupied | Renter-occupied |
| Single Unit, Detached | 759 (76.3%) | 236 (23.7%) |
| Single Unit, Attached | 12 (100.0%) | 0 (0.0%) |
| 2 Unit Apartments | 0 (0.0%) | 0 (0.0%) |
| 3 or 4 Unit Apartments | 0 (0.0%) | 0 (0.0%) |
| 5 to 9 Unit Apartments | 0 (0.0%) | 0 (0.0%) |
| 10 or more Apartments | 0 (0.0%) | 11 (100.0%) |
| Mobile Home / Other | 0 (0.0%) | 0 (0.0%) |
| Total | 771 (75.7%) | 247 (24.3%) |
Housing Structures by Number of Rooms in Coqui
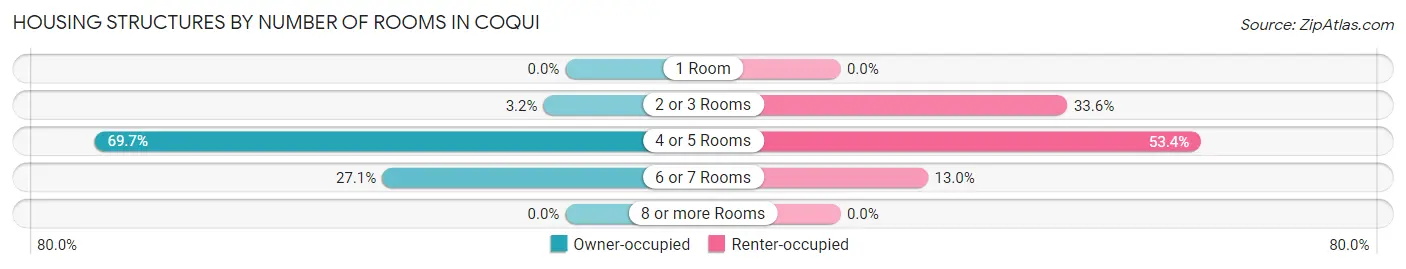
| Number of Rooms | Owner-occupied | Renter-occupied |
| 1 Room | 0 (0.0%) | 0 (0.0%) |
| 2 or 3 Rooms | 25 (3.2%) | 83 (33.6%) |
| 4 or 5 Rooms | 537 (69.7%) | 132 (53.4%) |
| 6 or 7 Rooms | 209 (27.1%) | 32 (13.0%) |
| 8 or more Rooms | 0 (0.0%) | 0 (0.0%) |
| Total | 771 (100.0%) | 247 (100.0%) |
Housing Structure by Heating Type in Coqui
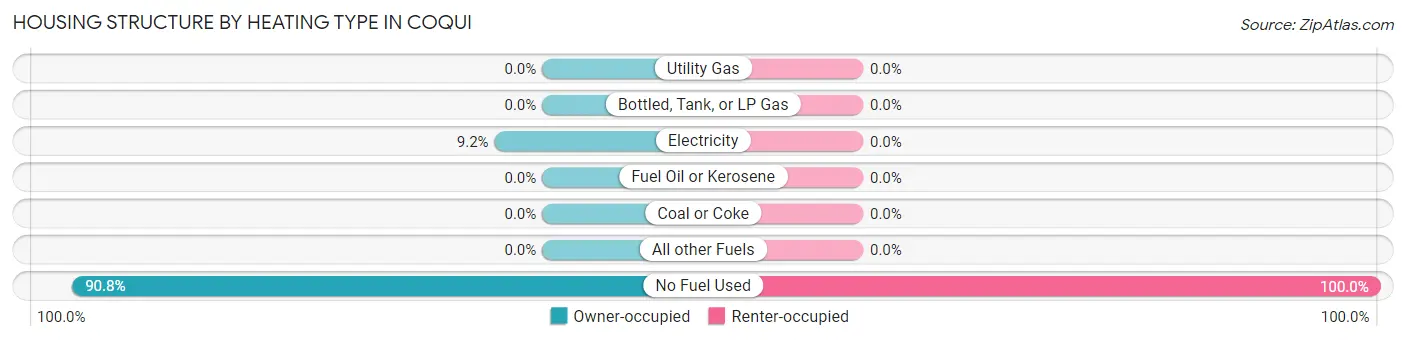
| Heating Type | Owner-occupied | Renter-occupied |
| Utility Gas | 0 (0.0%) | 0 (0.0%) |
| Bottled, Tank, or LP Gas | 0 (0.0%) | 0 (0.0%) |
| Electricity | 71 (9.2%) | 0 (0.0%) |
| Fuel Oil or Kerosene | 0 (0.0%) | 0 (0.0%) |
| Coal or Coke | 0 (0.0%) | 0 (0.0%) |
| All other Fuels | 0 (0.0%) | 0 (0.0%) |
| No Fuel Used | 700 (90.8%) | 247 (100.0%) |
| Total | 771 (100.0%) | 247 (100.0%) |
Household Vehicle Usage in Coqui
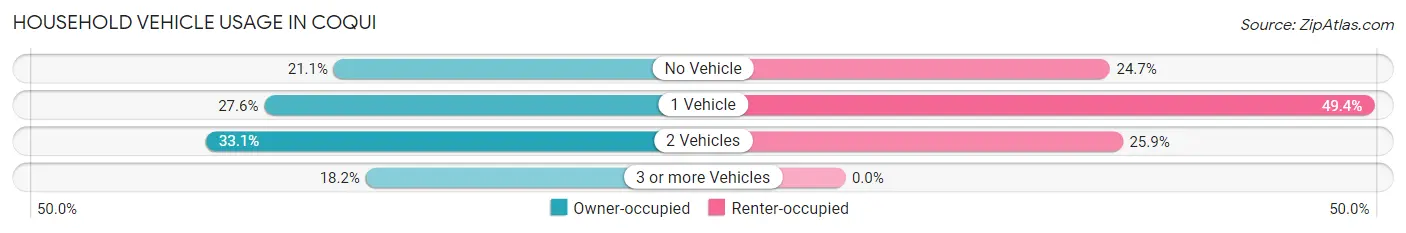
| Vehicles per Household | Owner-occupied | Renter-occupied |
| No Vehicle | 163 (21.1%) | 61 (24.7%) |
| 1 Vehicle | 213 (27.6%) | 122 (49.4%) |
| 2 Vehicles | 255 (33.1%) | 64 (25.9%) |
| 3 or more Vehicles | 140 (18.2%) | 0 (0.0%) |
| Total | 771 (100.0%) | 247 (100.0%) |
Real Estate & Mortgages in Coqui
Real Estate and Mortgage Overview in Coqui
| Characteristic | Without Mortgage | With Mortgage |
| Housing Units | 582 | 189 |
| Median Property Value | $65,200 | $108,300 |
| Median Household Income | $20,096 | $0 |
| Monthly Housing Costs | $161 | $0 |
| Real Estate Taxes | - | - |
Property Value by Mortgage Status in Coqui
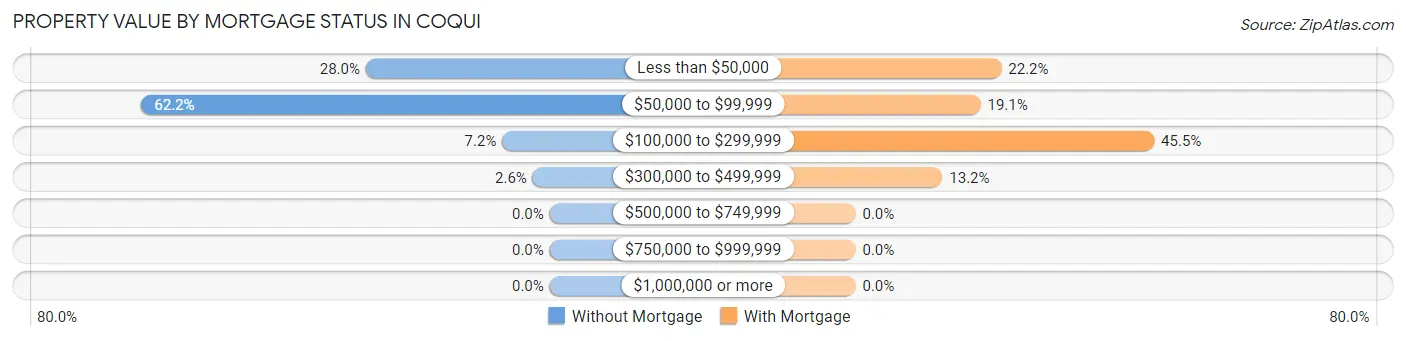
| Property Value | Without Mortgage | With Mortgage |
| Less than $50,000 | 163 (28.0%) | 42 (22.2%) |
| $50,000 to $99,999 | 362 (62.2%) | 36 (19.1%) |
| $100,000 to $299,999 | 42 (7.2%) | 86 (45.5%) |
| $300,000 to $499,999 | 15 (2.6%) | 25 (13.2%) |
| $500,000 to $749,999 | 0 (0.0%) | 0 (0.0%) |
| $750,000 to $999,999 | 0 (0.0%) | 0 (0.0%) |
| $1,000,000 or more | 0 (0.0%) | 0 (0.0%) |
| Total | 582 (100.0%) | 189 (100.0%) |
Household Income by Mortgage Status in Coqui
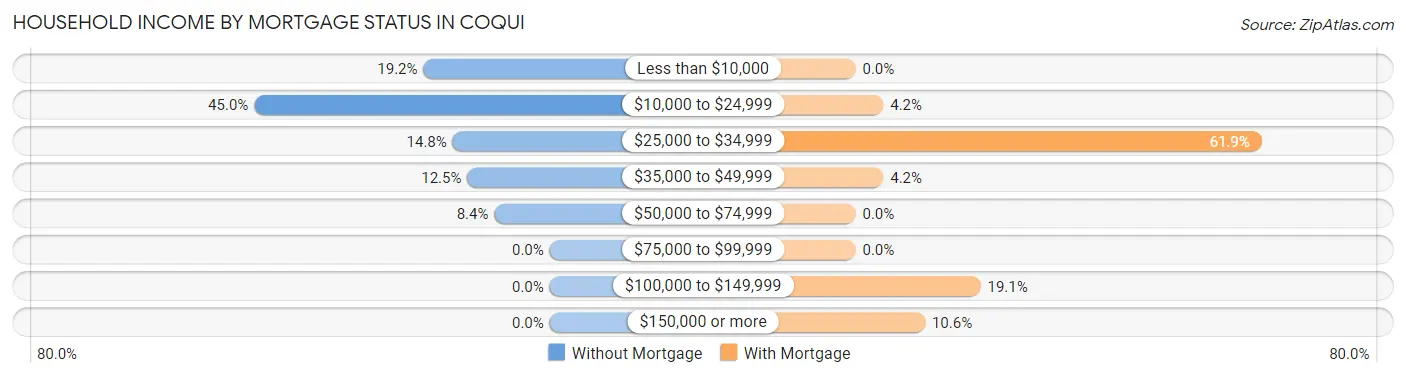
| Household Income | Without Mortgage | With Mortgage |
| Less than $10,000 | 112 (19.2%) | 0 (0.0%) |
| $10,000 to $24,999 | 262 (45.0%) | 8 (4.2%) |
| $25,000 to $34,999 | 86 (14.8%) | 117 (61.9%) |
| $35,000 to $49,999 | 73 (12.5%) | 8 (4.2%) |
| $50,000 to $74,999 | 49 (8.4%) | 0 (0.0%) |
| $75,000 to $99,999 | 0 (0.0%) | 0 (0.0%) |
| $100,000 to $149,999 | 0 (0.0%) | 36 (19.1%) |
| $150,000 or more | 0 (0.0%) | 20 (10.6%) |
| Total | 582 (100.0%) | 189 (100.0%) |
Property Value to Household Income Ratio in Coqui
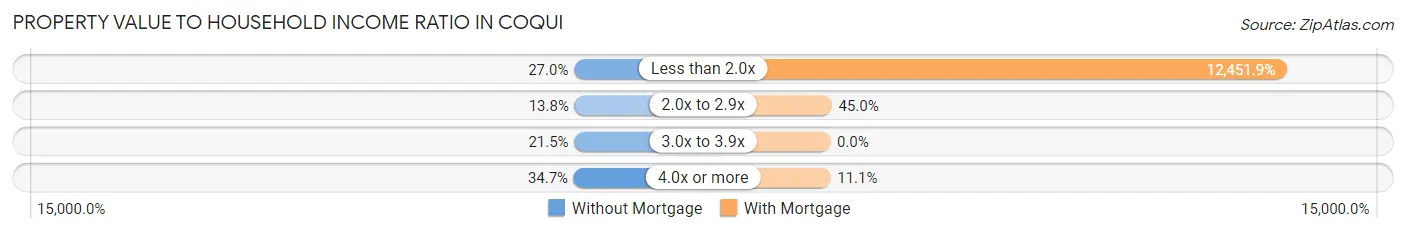
| Value-to-Income Ratio | Without Mortgage | With Mortgage |
| Less than 2.0x | 157 (27.0%) | 23,534 (12,451.9%) |
| 2.0x to 2.9x | 80 (13.8%) | 85 (45.0%) |
| 3.0x to 3.9x | 125 (21.5%) | 0 (0.0%) |
| 4.0x or more | 202 (34.7%) | 21 (11.1%) |
| Total | 582 (100.0%) | 189 (100.0%) |
Real Estate Taxes by Mortgage Status in Coqui
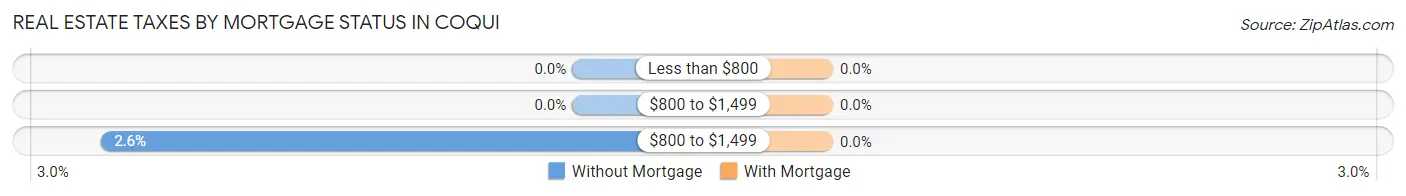
| Property Taxes | Without Mortgage | With Mortgage |
| Less than $800 | 0 (0.0%) | 0 (0.0%) |
| $800 to $1,499 | 0 (0.0%) | 0 (0.0%) |
| $800 to $1,499 | 15 (2.6%) | 0 (0.0%) |
| Total | 582 (100.0%) | 189 (100.0%) |
Health & Disability in Coqui
Health Insurance Coverage by Age in Coqui
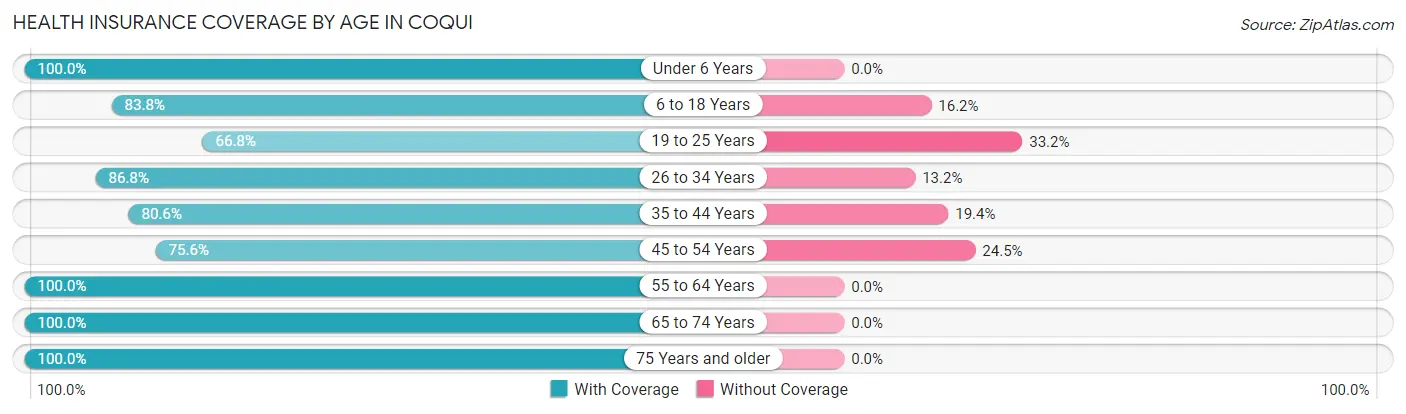
| Age Bracket | With Coverage | Without Coverage |
| Under 6 Years | 210 (100.0%) | 0 (0.0%) |
| 6 to 18 Years | 423 (83.8%) | 82 (16.2%) |
| 19 to 25 Years | 342 (66.8%) | 170 (33.2%) |
| 26 to 34 Years | 328 (86.8%) | 50 (13.2%) |
| 35 to 44 Years | 133 (80.6%) | 32 (19.4%) |
| 45 to 54 Years | 241 (75.5%) | 78 (24.4%) |
| 55 to 64 Years | 223 (100.0%) | 0 (0.0%) |
| 65 to 74 Years | 322 (100.0%) | 0 (0.0%) |
| 75 Years and older | 334 (100.0%) | 0 (0.0%) |
| Total | 2,556 (86.1%) | 412 (13.9%) |
Health Insurance Coverage by Citizenship Status in Coqui
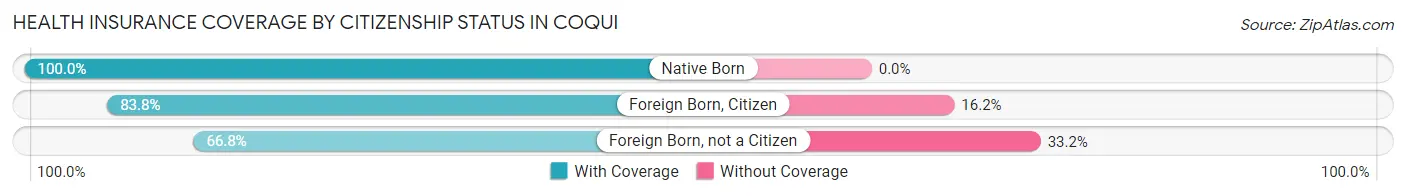
| Citizenship Status | With Coverage | Without Coverage |
| Native Born | 210 (100.0%) | 0 (0.0%) |
| Foreign Born, Citizen | 423 (83.8%) | 82 (16.2%) |
| Foreign Born, not a Citizen | 342 (66.8%) | 170 (33.2%) |
Health Insurance Coverage by Household Income in Coqui
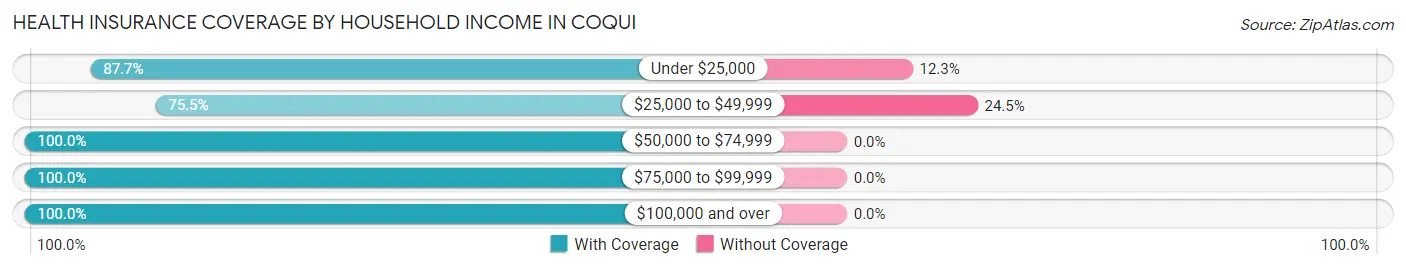
| Household Income | With Coverage | Without Coverage |
| Under $25,000 | 1,524 (87.7%) | 214 (12.3%) |
| $25,000 to $49,999 | 610 (75.5%) | 198 (24.5%) |
| $50,000 to $74,999 | 184 (100.0%) | 0 (0.0%) |
| $75,000 to $99,999 | 136 (100.0%) | 0 (0.0%) |
| $100,000 and over | 89 (100.0%) | 0 (0.0%) |
Public vs Private Health Insurance Coverage by Age in Coqui
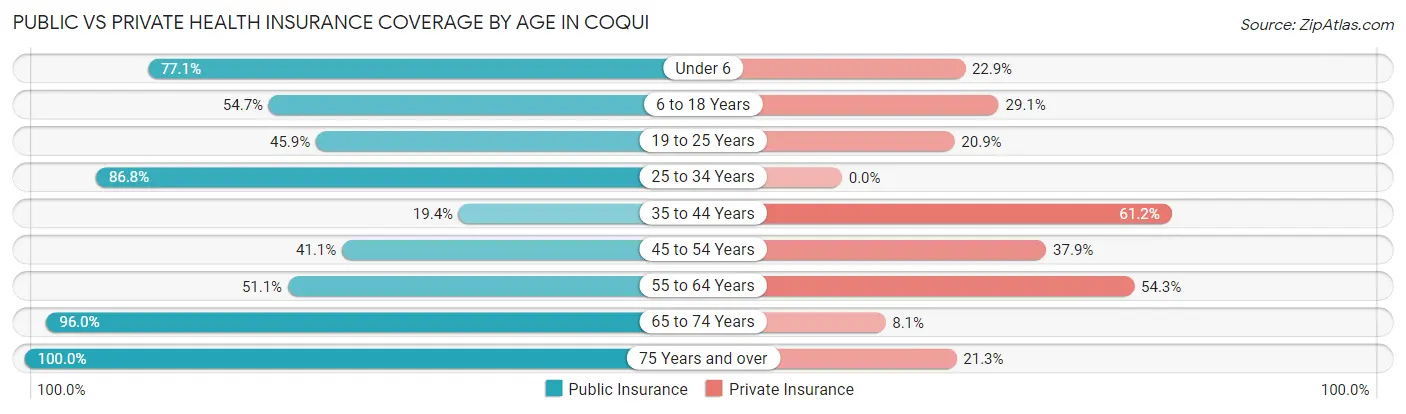
| Age Bracket | Public Insurance | Private Insurance |
| Under 6 | 162 (77.1%) | 48 (22.9%) |
| 6 to 18 Years | 276 (54.6%) | 147 (29.1%) |
| 19 to 25 Years | 235 (45.9%) | 107 (20.9%) |
| 25 to 34 Years | 328 (86.8%) | 0 (0.0%) |
| 35 to 44 Years | 32 (19.4%) | 101 (61.2%) |
| 45 to 54 Years | 131 (41.1%) | 121 (37.9%) |
| 55 to 64 Years | 114 (51.1%) | 121 (54.3%) |
| 65 to 74 Years | 309 (96.0%) | 26 (8.1%) |
| 75 Years and over | 334 (100.0%) | 71 (21.3%) |
| Total | 1,921 (64.7%) | 742 (25.0%) |
Disability Status by Sex by Age in Coqui
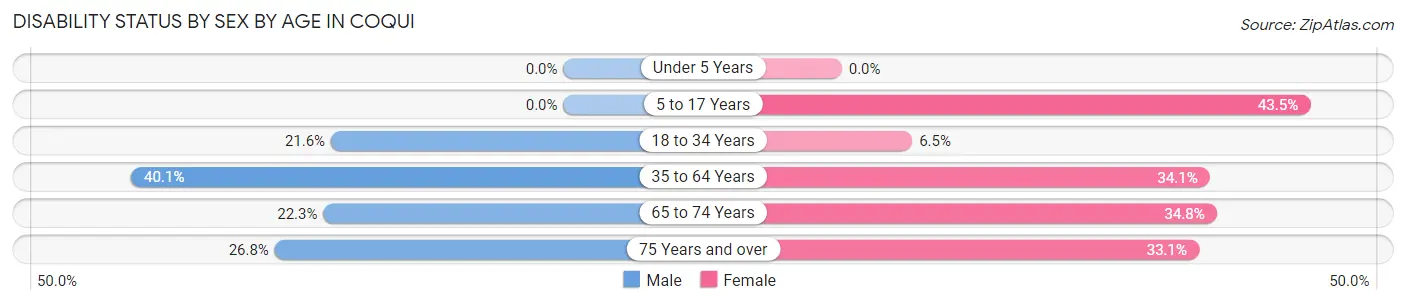
| Age Bracket | Male | Female |
| Under 5 Years | 0 (0.0%) | 0 (0.0%) |
| 5 to 17 Years | 0 (0.0%) | 126 (43.4%) |
| 18 to 34 Years | 107 (21.6%) | 32 (6.5%) |
| 35 to 64 Years | 132 (40.1%) | 129 (34.1%) |
| 65 to 74 Years | 41 (22.3%) | 48 (34.8%) |
| 75 Years and over | 45 (26.8%) | 55 (33.1%) |
Disability Class by Sex by Age in Coqui
Disability Class: Hearing Difficulty
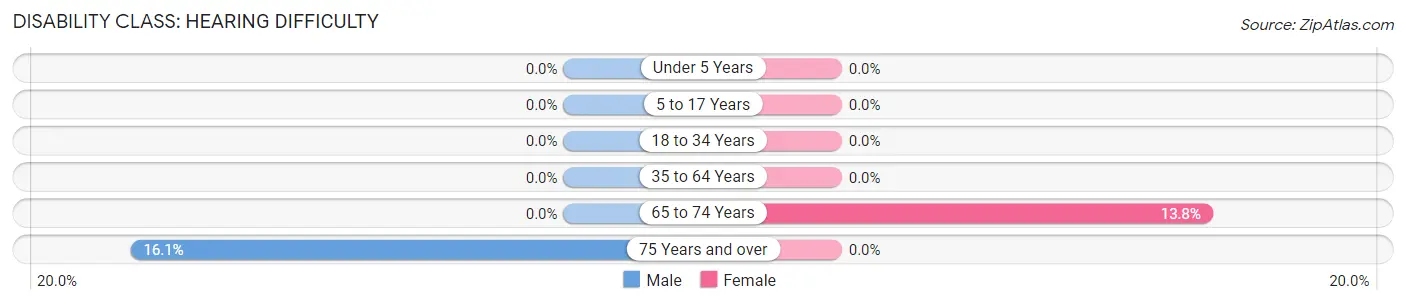
| Age Bracket | Male | Female |
| Under 5 Years | 0 (0.0%) | 0 (0.0%) |
| 5 to 17 Years | 0 (0.0%) | 0 (0.0%) |
| 18 to 34 Years | 0 (0.0%) | 0 (0.0%) |
| 35 to 64 Years | 0 (0.0%) | 0 (0.0%) |
| 65 to 74 Years | 0 (0.0%) | 19 (13.8%) |
| 75 Years and over | 27 (16.1%) | 0 (0.0%) |
Disability Class: Vision Difficulty
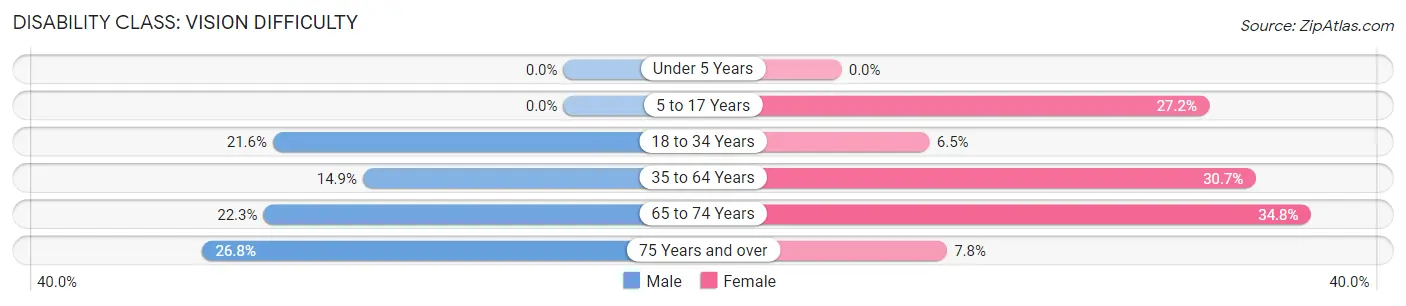
| Age Bracket | Male | Female |
| Under 5 Years | 0 (0.0%) | 0 (0.0%) |
| 5 to 17 Years | 0 (0.0%) | 79 (27.2%) |
| 18 to 34 Years | 107 (21.6%) | 32 (6.5%) |
| 35 to 64 Years | 49 (14.9%) | 116 (30.7%) |
| 65 to 74 Years | 41 (22.3%) | 48 (34.8%) |
| 75 Years and over | 45 (26.8%) | 13 (7.8%) |
Disability Class: Cognitive Difficulty
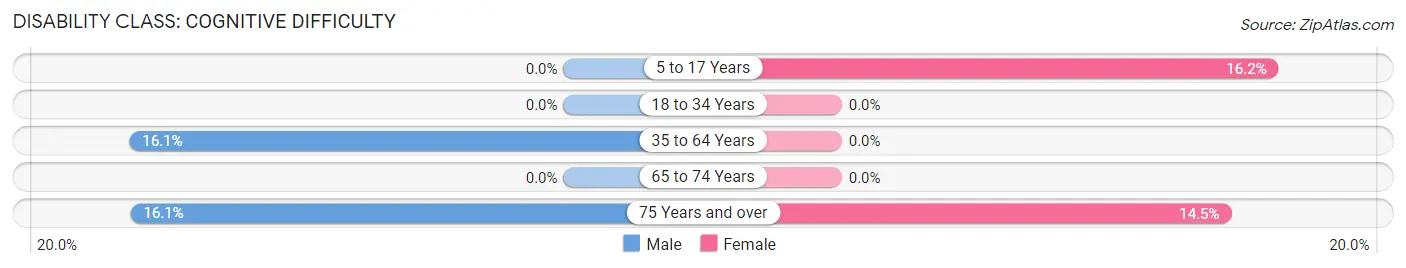
| Age Bracket | Male | Female |
| 5 to 17 Years | 0 (0.0%) | 47 (16.2%) |
| 18 to 34 Years | 0 (0.0%) | 0 (0.0%) |
| 35 to 64 Years | 53 (16.1%) | 0 (0.0%) |
| 65 to 74 Years | 0 (0.0%) | 0 (0.0%) |
| 75 Years and over | 27 (16.1%) | 24 (14.5%) |
Disability Class: Ambulatory Difficulty
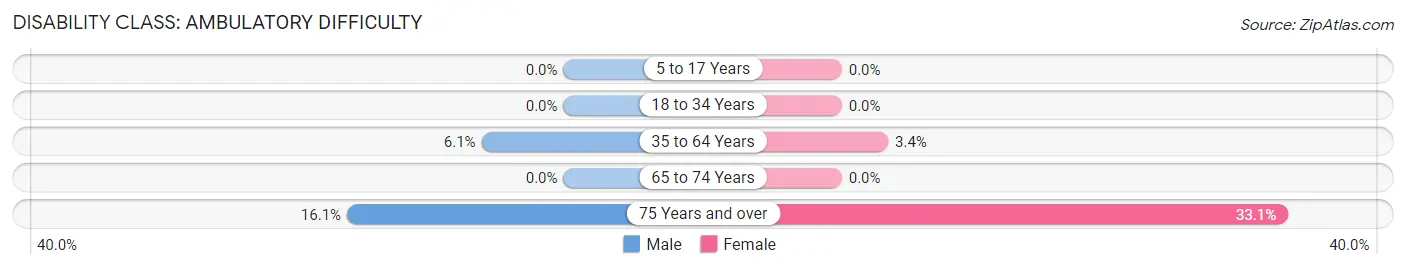
| Age Bracket | Male | Female |
| 5 to 17 Years | 0 (0.0%) | 0 (0.0%) |
| 18 to 34 Years | 0 (0.0%) | 0 (0.0%) |
| 35 to 64 Years | 20 (6.1%) | 13 (3.4%) |
| 65 to 74 Years | 0 (0.0%) | 0 (0.0%) |
| 75 Years and over | 27 (16.1%) | 55 (33.1%) |
Disability Class: Self-Care Difficulty
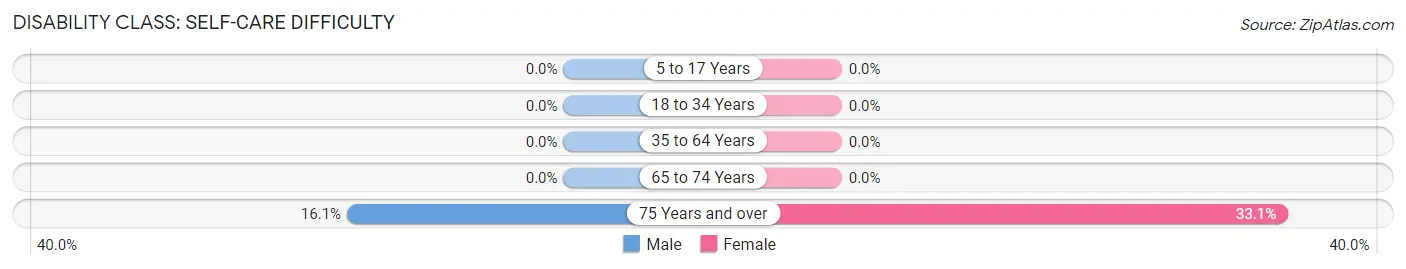
| Age Bracket | Male | Female |
| 5 to 17 Years | 0 (0.0%) | 0 (0.0%) |
| 18 to 34 Years | 0 (0.0%) | 0 (0.0%) |
| 35 to 64 Years | 0 (0.0%) | 0 (0.0%) |
| 65 to 74 Years | 0 (0.0%) | 0 (0.0%) |
| 75 Years and over | 27 (16.1%) | 55 (33.1%) |
Technology Access in Coqui
Computing Device Access in Coqui
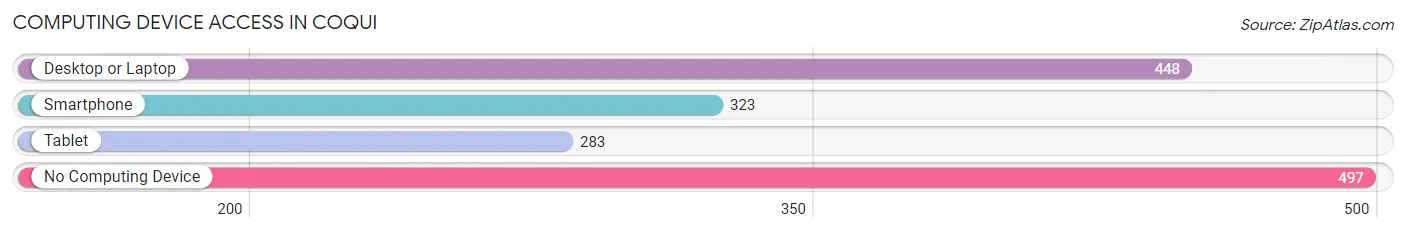
| Device Type | # Households | % Households |
| Desktop or Laptop | 448 | 44.0% |
| Smartphone | 323 | 31.7% |
| Tablet | 283 | 27.8% |
| No Computing Device | 497 | 48.8% |
| Total | 1,018 | 100.0% |
Internet Access in Coqui
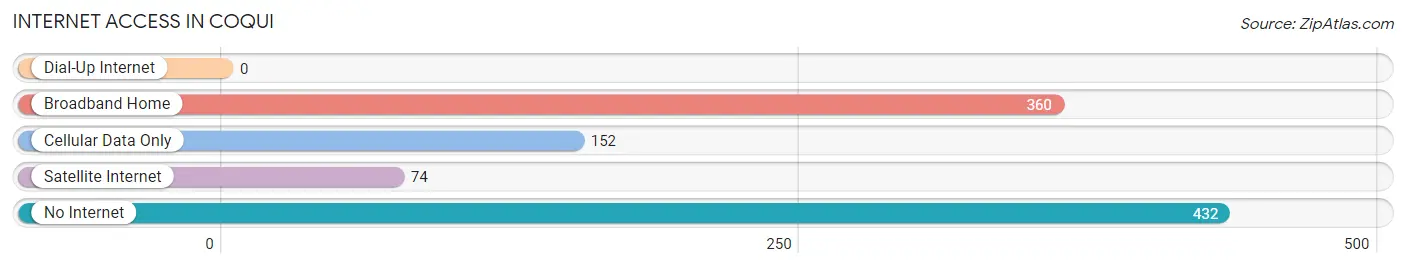
| Internet Type | # Households | % Households |
| Dial-Up Internet | 0 | 0.0% |
| Broadband Home | 360 | 35.4% |
| Cellular Data Only | 152 | 14.9% |
| Satellite Internet | 74 | 7.3% |
| No Internet | 432 | 42.4% |
| Total | 1,018 | 100.0% |
Coqui Summary
History
The history of Coqui, Puerto Rico is a long and varied one. The island was first inhabited by the Taíno people, who were the indigenous people of the Caribbean. The Taíno people were a peaceful and spiritual people who lived in small villages and relied on fishing and farming for sustenance. The Taíno people were eventually conquered by the Spanish in the late 15th century, and the island was colonized by the Spanish.
The Spanish brought with them a new religion, language, and culture, which the Taíno people adopted. The Spanish also brought with them African slaves, who were used to work the plantations and mines. The Spanish also introduced new crops, such as sugar cane, which became an important part of the economy.
In the 19th century, the island was ceded to the United States as part of the Treaty of Paris. The island was then divided into two parts, with the eastern part becoming the Commonwealth of Puerto Rico and the western part becoming the US Virgin Islands.
In the 20th century, the island experienced a period of economic growth and development. The economy was largely based on agriculture and tourism, and the island became a popular destination for tourists from the United States and Europe.
In the late 20th century, the island experienced a period of political unrest and economic decline. In the late 1990s, the island was hit by a series of hurricanes, which caused significant damage to the infrastructure and economy.
Geography
Coqui, Puerto Rico is located in the Caribbean Sea, just off the coast of the Dominican Republic. The island is approximately 100 miles long and 35 miles wide, and is divided into two parts, the eastern part being the Commonwealth of Puerto Rico and the western part being the US Virgin Islands.
The island is mostly mountainous, with the highest peak being Cerro de Punta, which is 3,087 feet above sea level. The island is also home to several rivers, including the Rio Grande de Loíza, which is the longest river in Puerto Rico.
The climate of the island is tropical, with temperatures ranging from the mid-70s to the mid-80s. The island experiences a wet season from May to November, and a dry season from December to April.
Economy
The economy of Coqui, Puerto Rico is largely based on agriculture and tourism. The island is home to several large agricultural companies, such as Del Monte and Dole, which produce a variety of fruits and vegetables. The island is also home to several large tourism companies, such as Carnival Cruise Lines and Royal Caribbean, which bring in millions of tourists each year.
The island also has a large manufacturing sector, which produces a variety of products, such as electronics, pharmaceuticals, and textiles. The island also has a large financial sector, which includes several banks and insurance companies.
Demographics
As of the 2010 census, the population of Coqui, Puerto Rico was 3,711,945. The population is largely of Hispanic or Latino descent, with the majority of the population being of Puerto Rican descent. The island also has a large African American population, as well as a small population of Native Americans.
The island is also home to a large number of immigrants, with the majority of the immigrants coming from the Dominican Republic, Cuba, and other Caribbean countries. The island also has a large number of expatriates, with the majority of the expatriates coming from the United States and Europe.
The official language of the island is Spanish, although English is also widely spoken. The majority of the population is Roman Catholic, although there are also a number of other religious denominations present on the island.
Common Questions
What is Per Capita Income in Coqui?
Per Capita income in Coqui is $9,088.
What is the Median Family Income in Coqui?
Median Family Income in Coqui is $24,559.
What is the Median Household income in Coqui?
Median Household Income in Coqui is $21,538.
What is Income or Wage Gap in Coqui?
Income or Wage Gap in Coqui is 2.6%.
Women in Coqui earn 97.4 cents for every dollar earned by a man.
What is Inequality or Gini Index in Coqui?
Inequality or Gini Index in Coqui is 0.41.
What is the Total Population of Coqui?
Total Population of Coqui is 2,968.
What is the Total Male Population of Coqui?
Total Male Population of Coqui is 1,297.
What is the Total Female Population of Coqui?
Total Female Population of Coqui is 1,671.
What is the Ratio of Males per 100 Females in Coqui?
There are 77.62 Males per 100 Females in Coqui.
What is the Ratio of Females per 100 Males in Coqui?
There are 128.84 Females per 100 Males in Coqui.
What is the Median Population Age in Coqui?
Median Population Age in Coqui is 29.9 Years.
What is the Average Family Size in Coqui
Average Family Size in Coqui is 3.5 People.
What is the Average Household Size in Coqui
Average Household Size in Coqui is 2.9 People.
How Large is the Labor Force in Coqui?
There are 749 People in the Labor Forcein in Coqui.
What is the Percentage of People in the Labor Force in Coqui?
30.6% of People are in the Labor Force in Coqui.
What is the Unemployment Rate in Coqui?
Unemployment Rate in Coqui is 5.2%.