Suarez, PR Map & Demographics
Suarez Overview
$10,060
PER CAPITA INCOME
$28,378
AVG FAMILY INCOME
$19,625
AVG HOUSEHOLD INCOME
29.0%
WAGE / INCOME GAP [ % ]
71.0¢/ $1
WAGE / INCOME GAP [ $ ]
0.47
INEQUALITY / GINI INDEX
1,544
TOTAL POPULATION
693
MALE POPULATION
851
FEMALE POPULATION
81.43
MALES / 100 FEMALES
122.80
FEMALES / 100 MALES
56.3
MEDIAN AGE
3.5
AVG FAMILY SIZE
2.6
AVG HOUSEHOLD SIZE
514
LABOR FORCE [ PEOPLE ]
35.7%
PERCENT IN LABOR FORCE
40.5%
UNEMPLOYMENT RATE
Income in Suarez
Income Overview in Suarez
Per Capita Income in Suarez is $10,060, while median incomes of families and households are $28,378 and $19,625 respectively.
| Characteristic | Number | Measure |
| Per Capita Income | 1,544 | $10,060 |
| Median Family Income | 375 | $28,378 |
| Mean Family Income | 375 | $30,078 |
| Median Household Income | 588 | $19,625 |
| Mean Household Income | 588 | $23,664 |
| Income Deficit | 375 | $0 |
| Wage / Income Gap (%) | 1,544 | 29.00% |
| Wage / Income Gap ($) | 1,544 | 71.00¢ per $1 |
| Gini / Inequality Index | 1,544 | 0.47 |
Earnings by Sex in Suarez
Average Earnings in Suarez are $19,909, $27,639 for men and $19,625 for women, a difference of 29.0%.
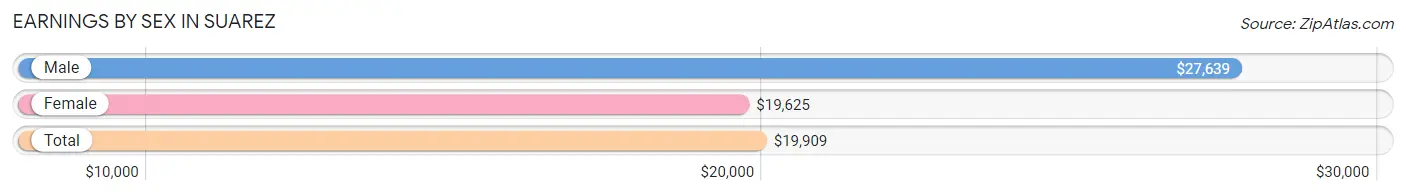
| Sex | Number | Average Earnings |
| Male | 176 (51.0%) | $27,639 |
| Female | 169 (49.0%) | $19,625 |
| Total | 345 (100.0%) | $19,909 |
Earnings by Sex by Income Bracket in Suarez
The most common earnings brackets in Suarez are $15,000 to $17,499 for men (47 | 26.7%) and $7,500 to $9,999 for women (45 | 26.6%).
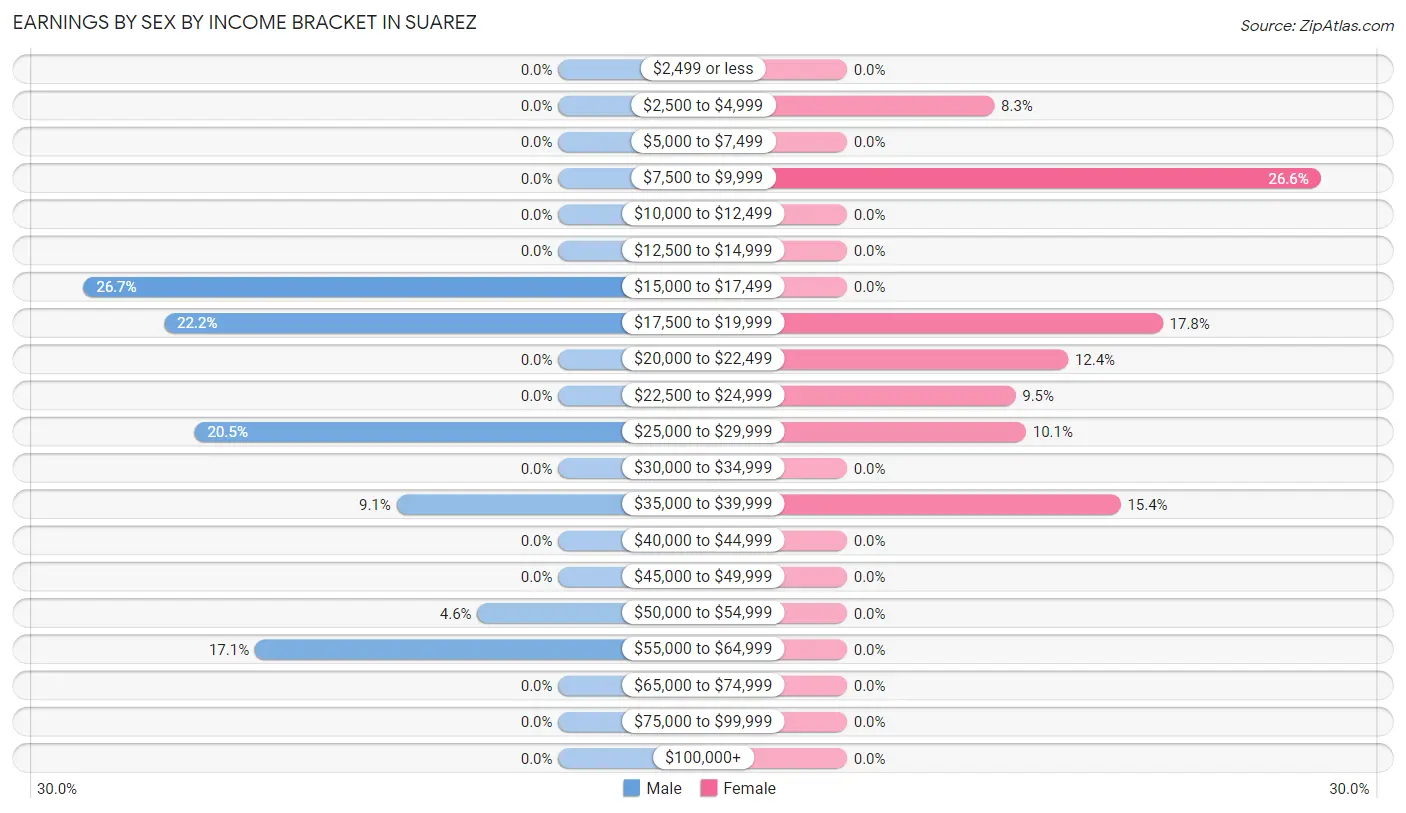
| Income | Male | Female |
| $2,499 or less | 0 (0.0%) | 0 (0.0%) |
| $2,500 to $4,999 | 0 (0.0%) | 14 (8.3%) |
| $5,000 to $7,499 | 0 (0.0%) | 0 (0.0%) |
| $7,500 to $9,999 | 0 (0.0%) | 45 (26.6%) |
| $10,000 to $12,499 | 0 (0.0%) | 0 (0.0%) |
| $12,500 to $14,999 | 0 (0.0%) | 0 (0.0%) |
| $15,000 to $17,499 | 47 (26.7%) | 0 (0.0%) |
| $17,500 to $19,999 | 39 (22.2%) | 30 (17.7%) |
| $20,000 to $22,499 | 0 (0.0%) | 21 (12.4%) |
| $22,500 to $24,999 | 0 (0.0%) | 16 (9.5%) |
| $25,000 to $29,999 | 36 (20.4%) | 17 (10.1%) |
| $30,000 to $34,999 | 0 (0.0%) | 0 (0.0%) |
| $35,000 to $39,999 | 16 (9.1%) | 26 (15.4%) |
| $40,000 to $44,999 | 0 (0.0%) | 0 (0.0%) |
| $45,000 to $49,999 | 0 (0.0%) | 0 (0.0%) |
| $50,000 to $54,999 | 8 (4.5%) | 0 (0.0%) |
| $55,000 to $64,999 | 30 (17.1%) | 0 (0.0%) |
| $65,000 to $74,999 | 0 (0.0%) | 0 (0.0%) |
| $75,000 to $99,999 | 0 (0.0%) | 0 (0.0%) |
| $100,000+ | 0 (0.0%) | 0 (0.0%) |
| Total | 176 (100.0%) | 169 (100.0%) |
Earnings by Sex by Educational Attainment in Suarez
Average earnings in Suarez are $27,639 for men and $22,143 for women, a difference of 19.9%. Men with an educational attainment of high school diploma enjoy the highest average annual earnings of $19,391, while those with high school diploma education earn the least with $19,391. Women with an educational attainment of college or associate's degree earn the most with the average annual earnings of $21,429, while those with college or associate's degree education have the smallest earnings of $21,429.
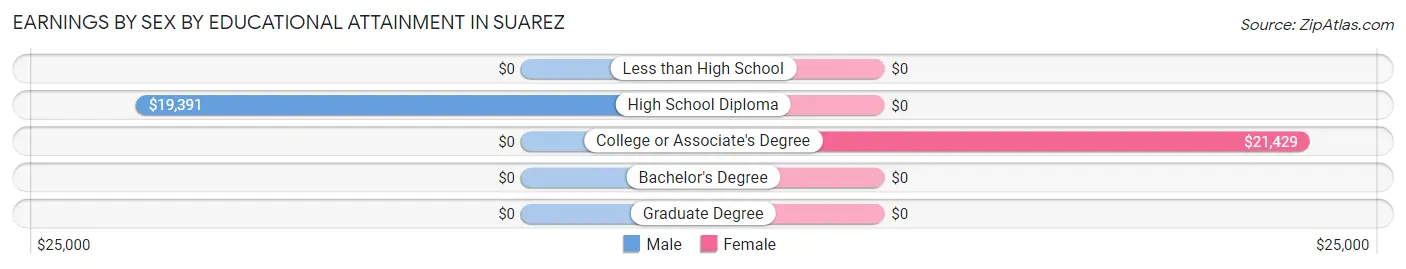
| Educational Attainment | Male Income | Female Income |
| Less than High School | - | - |
| High School Diploma | $19,391 | $0 |
| College or Associate's Degree | - | - |
| Bachelor's Degree | - | - |
| Graduate Degree | - | - |
| Total | $27,639 | $22,143 |
Family Income in Suarez
Family Income Brackets in Suarez
According to the Suarez family income data, there are 98 families falling into the $25,000 to $34,999 income range, which is the most common income bracket and makes up 26.1% of all families.
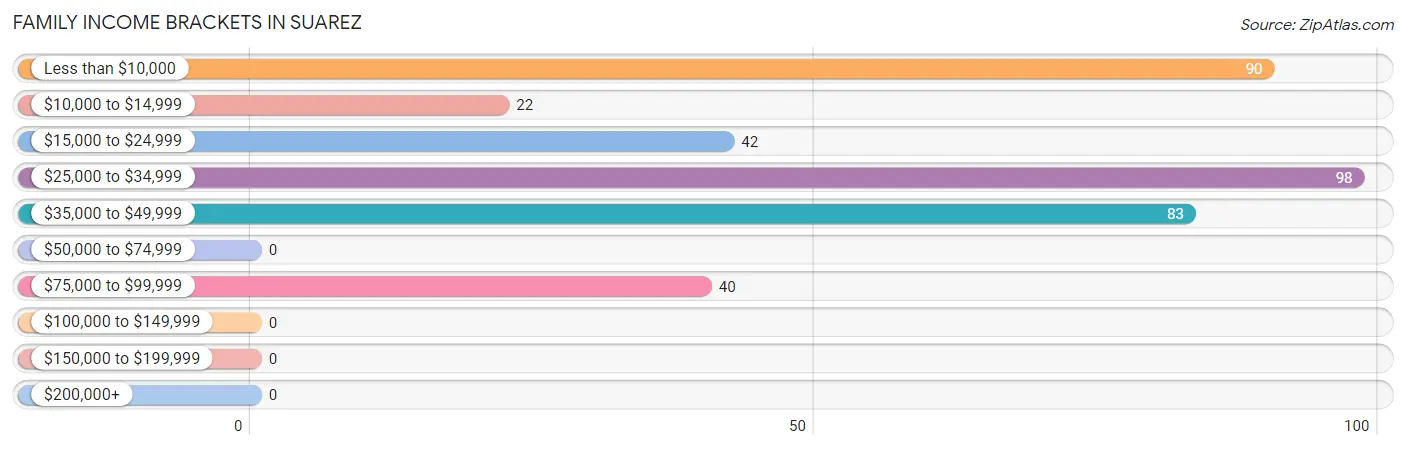
| Income Bracket | # Families | % Families |
| Less than $10,000 | 90 | 24.0% |
| $10,000 to $14,999 | 22 | 5.9% |
| $15,000 to $24,999 | 42 | 11.2% |
| $25,000 to $34,999 | 98 | 26.1% |
| $35,000 to $49,999 | 83 | 22.1% |
| $50,000 to $74,999 | 0 | 0.0% |
| $75,000 to $99,999 | 40 | 10.7% |
| $100,000 to $149,999 | 0 | 0.0% |
| $150,000 to $199,999 | 0 | 0.0% |
| $200,000+ | 0 | 0.0% |
Family Income by Famaliy Size in Suarez
3-person families (98 | 26.1%) account for the highest median family income in Suarez with $28,026 per family, while 3-person families (98 | 26.1%) have the highest median income of $9,342 per family member.
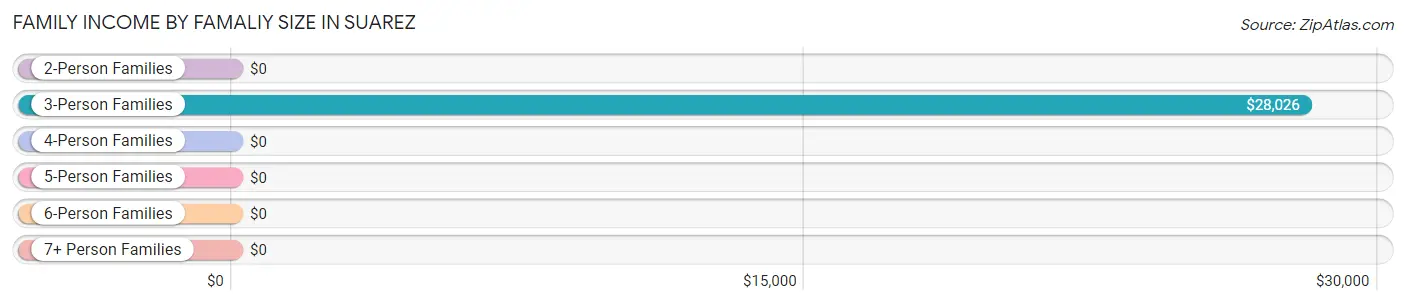
| Income Bracket | # Families | Median Income |
| 2-Person Families | 159 (42.4%) | $0 |
| 3-Person Families | 98 (26.1%) | $28,026 |
| 4-Person Families | 118 (31.5%) | $0 |
| 5-Person Families | 0 (0.0%) | $0 |
| 6-Person Families | 0 (0.0%) | $0 |
| 7+ Person Families | 0 (0.0%) | $0 |
| Total | 375 (100.0%) | $28,378 |
Family Income by Number of Earners in Suarez
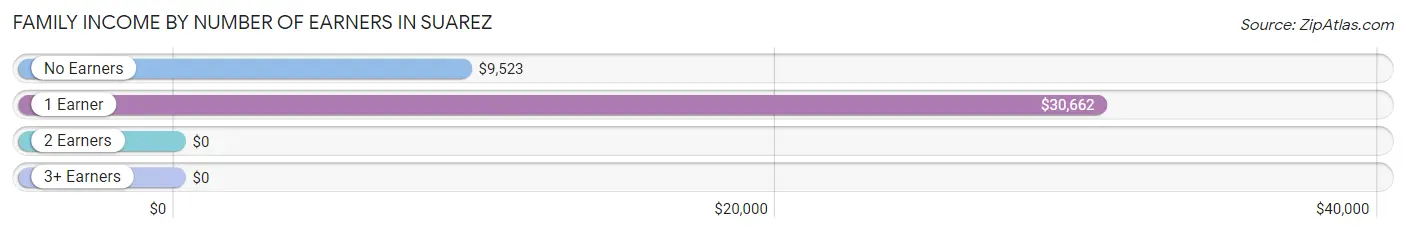
| Number of Earners | # Families | Median Income |
| No Earners | 159 (42.4%) | $9,523 |
| 1 Earner | 176 (46.9%) | $30,662 |
| 2 Earners | 40 (10.7%) | $0 |
| 3+ Earners | 0 (0.0%) | $0 |
| Total | 375 (100.0%) | $28,378 |
Household Income in Suarez
Household Income Brackets in Suarez
With 218 households falling in the category, the less than $10,000 income range is the most frequent in Suarez, accounting for 37.1% of all households.
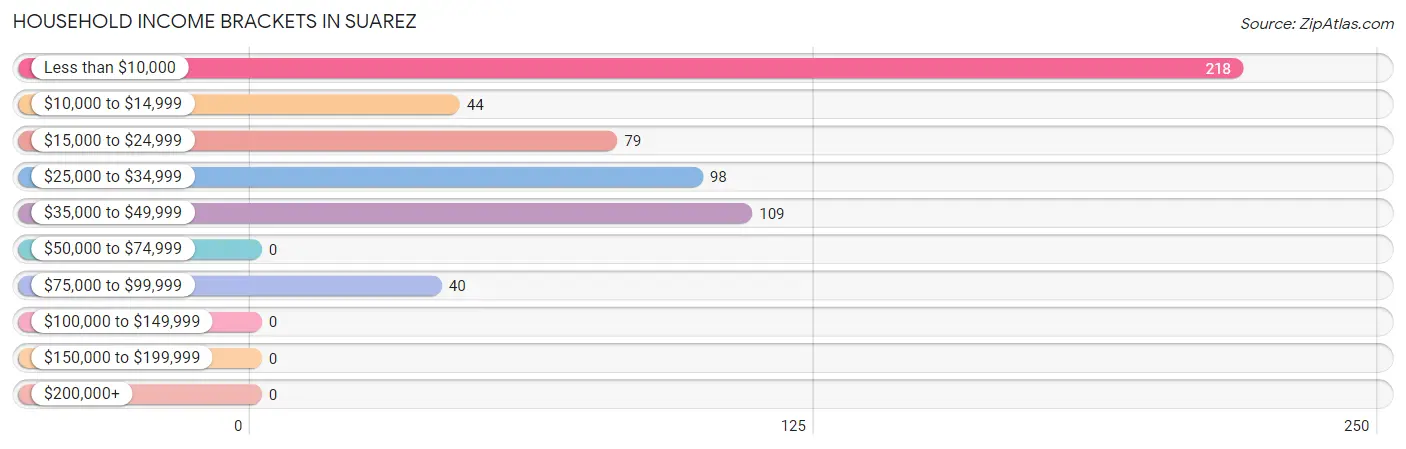
| Income Bracket | # Households | % Households |
| Less than $10,000 | 218 | 37.1% |
| $10,000 to $14,999 | 44 | 7.5% |
| $15,000 to $24,999 | 79 | 13.4% |
| $25,000 to $34,999 | 98 | 16.7% |
| $35,000 to $49,999 | 109 | 18.5% |
| $50,000 to $74,999 | 0 | 0.0% |
| $75,000 to $99,999 | 40 | 6.8% |
| $100,000 to $149,999 | 0 | 0.0% |
| $150,000 to $199,999 | 0 | 0.0% |
| $200,000+ | 0 | 0.0% |
Household Income by Householder Age in Suarez
The median household income in Suarez is $19,625, with the highest median household income of $20,956 found in the 65+ years age bracket for the primary householder. A total of 285 households (48.5%) fall into this category.
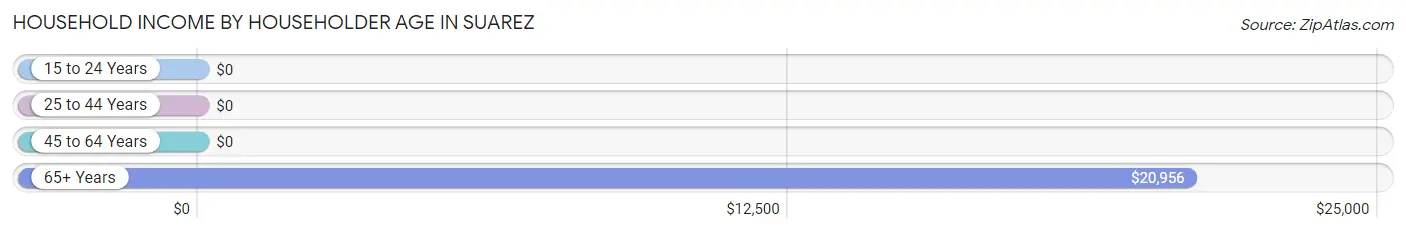
| Income Bracket | # Households | Median Income |
| 15 to 24 Years | 0 (0.0%) | $0 |
| 25 to 44 Years | 88 (15.0%) | $0 |
| 45 to 64 Years | 215 (36.6%) | $0 |
| 65+ Years | 285 (48.5%) | $20,956 |
| Total | 588 (100.0%) | $19,625 |
Poverty in Suarez
Income Below Poverty by Sex and Age in Suarez
With 32.5% poverty level for males and 41.0% for females among the residents of Suarez, 12 to 14 year old males and 16 and 17 year old females are the most vulnerable to poverty, with 12 males (100.0%) and 13 females (100.0%) in their respective age groups living below the poverty level.
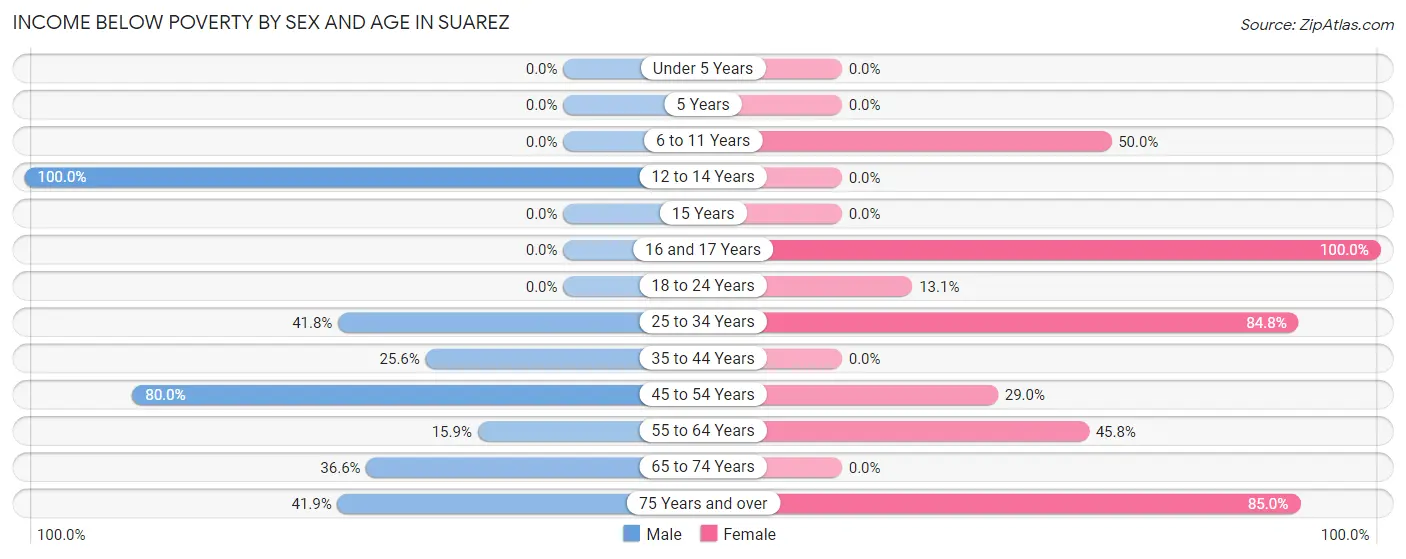
| Age Bracket | Male | Female |
| Under 5 Years | 0 (0.0%) | 0 (0.0%) |
| 5 Years | 0 (0.0%) | 0 (0.0%) |
| 6 to 11 Years | 0 (0.0%) | 15 (50.0%) |
| 12 to 14 Years | 12 (100.0%) | 0 (0.0%) |
| 15 Years | 0 (0.0%) | 0 (0.0%) |
| 16 and 17 Years | 0 (0.0%) | 13 (100.0%) |
| 18 to 24 Years | 0 (0.0%) | 14 (13.1%) |
| 25 to 34 Years | 28 (41.8%) | 89 (84.8%) |
| 35 to 44 Years | 45 (25.6%) | 0 (0.0%) |
| 45 to 54 Years | 32 (80.0%) | 11 (28.9%) |
| 55 to 64 Years | 17 (15.9%) | 99 (45.8%) |
| 65 to 74 Years | 34 (36.6%) | 0 (0.0%) |
| 75 Years and over | 57 (41.9%) | 108 (85.0%) |
| Total | 225 (32.5%) | 349 (41.0%) |
Income Above Poverty by Sex and Age in Suarez
According to the poverty statistics in Suarez, males aged 6 to 11 years and females aged under 5 years are the age groups that are most secure financially, with 100.0% of males and 100.0% of females in these age groups living above the poverty line.
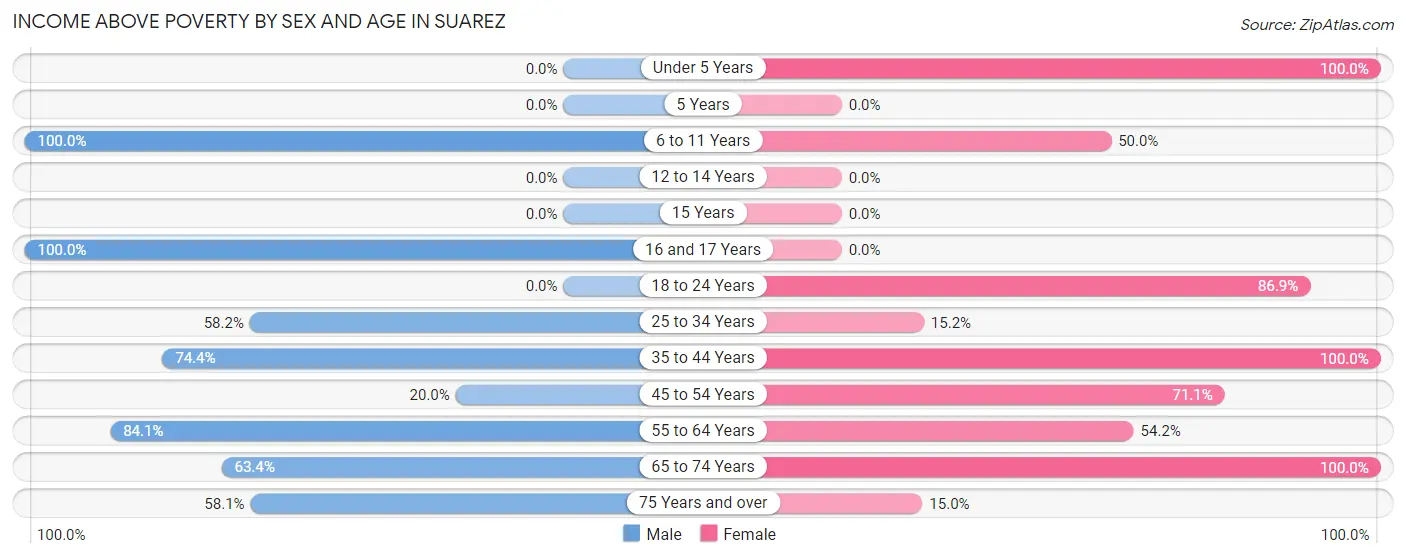
| Age Bracket | Male | Female |
| Under 5 Years | 0 (0.0%) | 35 (100.0%) |
| 5 Years | 0 (0.0%) | 0 (0.0%) |
| 6 to 11 Years | 27 (100.0%) | 15 (50.0%) |
| 12 to 14 Years | 0 (0.0%) | 0 (0.0%) |
| 15 Years | 0 (0.0%) | 0 (0.0%) |
| 16 and 17 Years | 35 (100.0%) | 0 (0.0%) |
| 18 to 24 Years | 0 (0.0%) | 93 (86.9%) |
| 25 to 34 Years | 39 (58.2%) | 16 (15.2%) |
| 35 to 44 Years | 131 (74.4%) | 73 (100.0%) |
| 45 to 54 Years | 8 (20.0%) | 27 (71.1%) |
| 55 to 64 Years | 90 (84.1%) | 117 (54.2%) |
| 65 to 74 Years | 59 (63.4%) | 107 (100.0%) |
| 75 Years and over | 79 (58.1%) | 19 (15.0%) |
| Total | 468 (67.5%) | 502 (59.0%) |
Income Below Poverty Among Married-Couple Families in Suarez
The poverty statistics for married-couple families in Suarez show that 22.2% or 37 of the total 167 families live below the poverty line. Families with no children have the highest poverty rate of 27.0%, comprising of 37 families. On the other hand, families with 1 or 2 children have the lowest poverty rate of 0.0%, which includes 0 families.
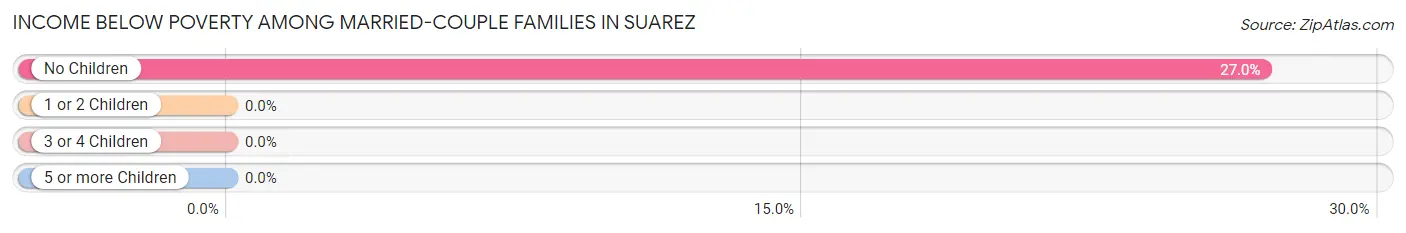
| Children | Above Poverty | Below Poverty |
| No Children | 100 (73.0%) | 37 (27.0%) |
| 1 or 2 Children | 30 (100.0%) | 0 (0.0%) |
| 3 or 4 Children | 0 (0.0%) | 0 (0.0%) |
| 5 or more Children | 0 (0.0%) | 0 (0.0%) |
| Total | 130 (77.8%) | 37 (22.2%) |
Income Below Poverty Among Single-Parent Households in Suarez
According to the poverty data in Suarez, 19.2% or 15 single-father households and 66.1% or 86 single-mother households are living below the poverty line. Among single-father households, those with 1 or 2 children have the highest poverty rate, with 15 households (30.6%) experiencing poverty. Likewise, among single-mother households, those with no children have the highest poverty rate, with 75 households (72.8%) falling below the poverty line.
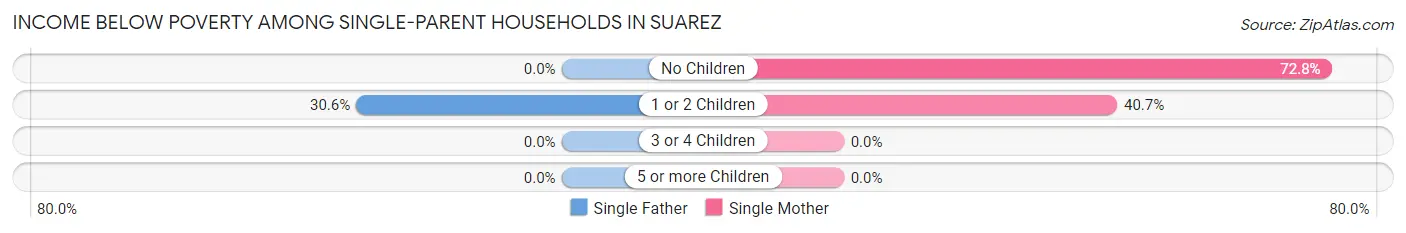
| Children | Single Father | Single Mother |
| No Children | 0 (0.0%) | 75 (72.8%) |
| 1 or 2 Children | 15 (30.6%) | 11 (40.7%) |
| 3 or 4 Children | 0 (0.0%) | 0 (0.0%) |
| 5 or more Children | 0 (0.0%) | 0 (0.0%) |
| Total | 15 (19.2%) | 86 (66.1%) |
Income Below Poverty Among Married-Couple vs Single-Parent Households in Suarez
The poverty data for Suarez shows that 37 of the married-couple family households (22.2%) and 101 of the single-parent households (48.6%) are living below the poverty level. Within the married-couple family households, those with no children have the highest poverty rate, with 37 households (27.0%) falling below the poverty line. Among the single-parent households, those with no children have the highest poverty rate, with 75 household (56.8%) living below poverty.
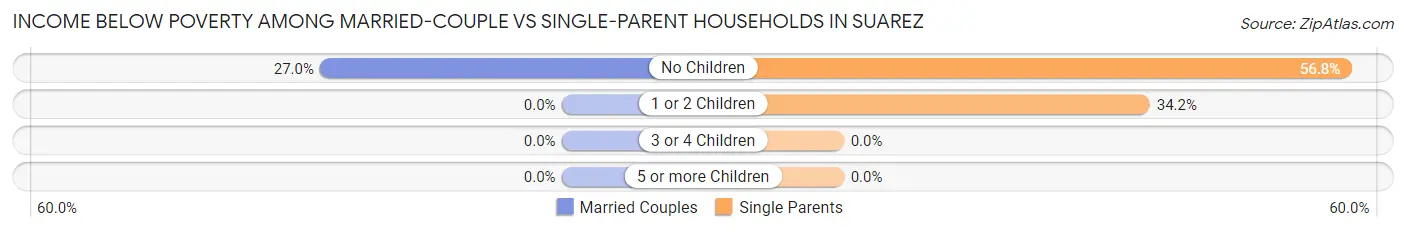
| Children | Married-Couple Families | Single-Parent Households |
| No Children | 37 (27.0%) | 75 (56.8%) |
| 1 or 2 Children | 0 (0.0%) | 26 (34.2%) |
| 3 or 4 Children | 0 (0.0%) | 0 (0.0%) |
| 5 or more Children | 0 (0.0%) | 0 (0.0%) |
| Total | 37 (22.2%) | 101 (48.6%) |
Race in Suarez
The most populous races in Suarez are Hispanic or Latino (1,544 | 100.0%), Black / African American (689 | 44.6%), and Some other Race (660 | 42.7%).
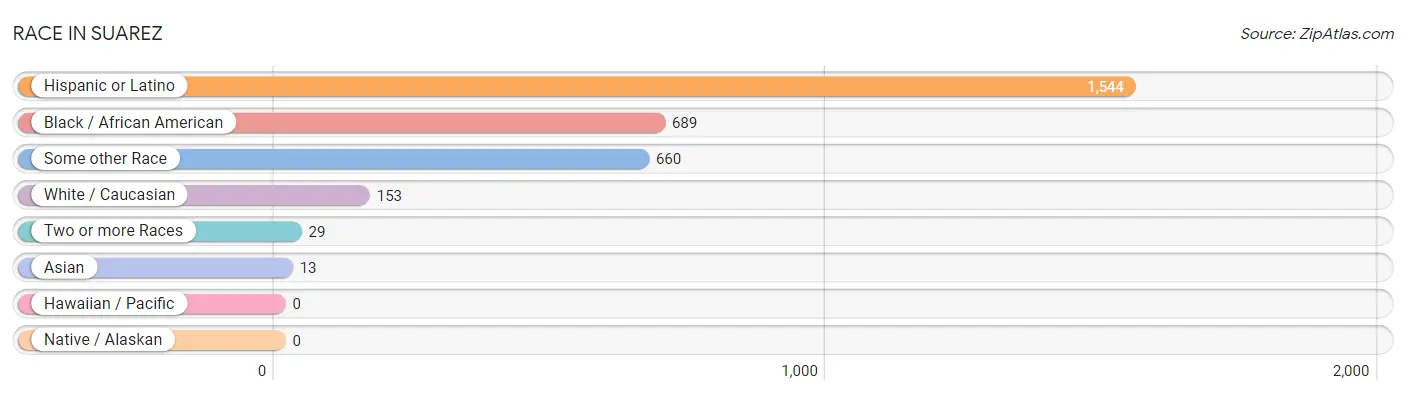
| Race | # Population | % Population |
| Asian | 13 | 0.8% |
| Black / African American | 689 | 44.6% |
| Hawaiian / Pacific | 0 | 0.0% |
| Hispanic or Latino | 1,544 | 100.0% |
| Native / Alaskan | 0 | 0.0% |
| White / Caucasian | 153 | 9.9% |
| Two or more Races | 29 | 1.9% |
| Some other Race | 660 | 42.7% |
| Total | 1,544 | 100.0% |
Ancestry in Suarez
The most populous ancestries reported in Suarez are Puerto Rican (1,544 | 100.0%), and Thai (13 | 0.8%), together accounting for 100.8% of all Suarez residents.
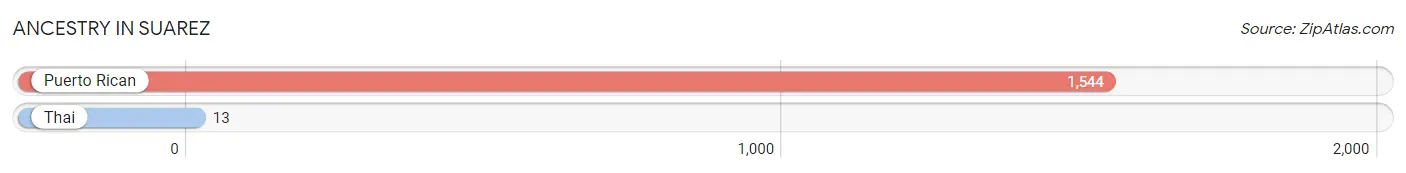
| Ancestry | # Population | % Population |
| Puerto Rican | 1,544 | 100.0% |
| Thai | 13 | 0.8% | View All 2 Rows |
Immigrants in Suarez

| Immigration Origin | # Population | % Population | View All 0 Rows |
Sex and Age in Suarez
Sex and Age in Suarez
The most populous age groups in Suarez are 35 to 39 Years (110 | 15.9%) for men and 55 to 59 Years (117 | 13.8%) for women.
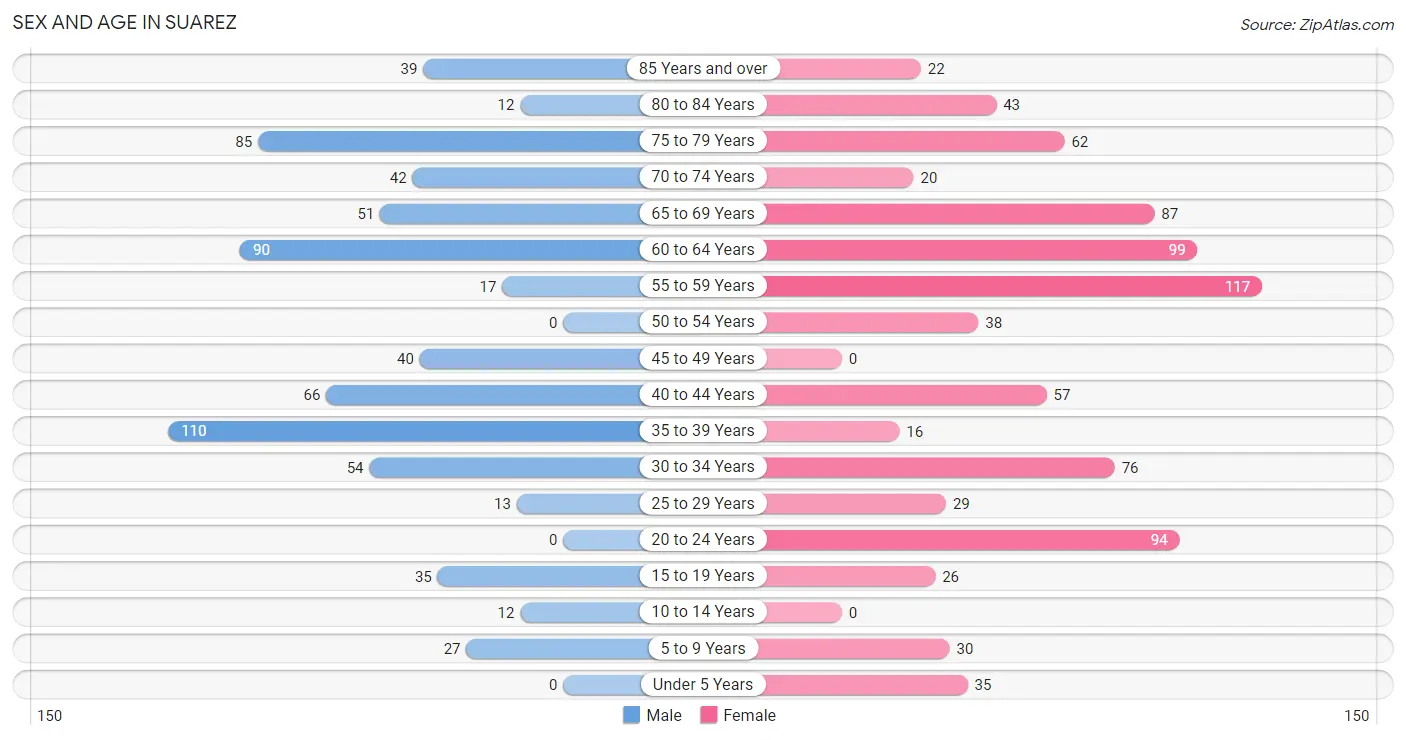
| Age Bracket | Male | Female |
| Under 5 Years | 0 (0.0%) | 35 (4.1%) |
| 5 to 9 Years | 27 (3.9%) | 30 (3.5%) |
| 10 to 14 Years | 12 (1.7%) | 0 (0.0%) |
| 15 to 19 Years | 35 (5.1%) | 26 (3.1%) |
| 20 to 24 Years | 0 (0.0%) | 94 (11.1%) |
| 25 to 29 Years | 13 (1.9%) | 29 (3.4%) |
| 30 to 34 Years | 54 (7.8%) | 76 (8.9%) |
| 35 to 39 Years | 110 (15.9%) | 16 (1.9%) |
| 40 to 44 Years | 66 (9.5%) | 57 (6.7%) |
| 45 to 49 Years | 40 (5.8%) | 0 (0.0%) |
| 50 to 54 Years | 0 (0.0%) | 38 (4.5%) |
| 55 to 59 Years | 17 (2.5%) | 117 (13.8%) |
| 60 to 64 Years | 90 (13.0%) | 99 (11.6%) |
| 65 to 69 Years | 51 (7.4%) | 87 (10.2%) |
| 70 to 74 Years | 42 (6.1%) | 20 (2.4%) |
| 75 to 79 Years | 85 (12.3%) | 62 (7.3%) |
| 80 to 84 Years | 12 (1.7%) | 43 (5.1%) |
| 85 Years and over | 39 (5.6%) | 22 (2.6%) |
| Total | 693 (100.0%) | 851 (100.0%) |
Families and Households in Suarez
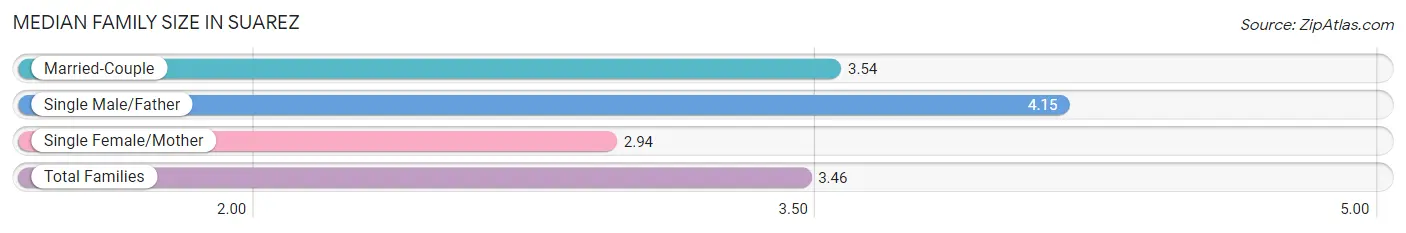
Median Family Size in Suarez
The median family size in Suarez is 3.46 persons per family, with single male/father families (78 | 20.8%) accounting for the largest median family size of 4.15 persons per family. On the other hand, single female/mother families (130 | 34.7%) represent the smallest median family size with 2.94 persons per family.
| Family Type | # Families | Family Size |
| Married-Couple | 167 (44.5%) | 3.54 |
| Single Male/Father | 78 (20.8%) | 4.15 |
| Single Female/Mother | 130 (34.7%) | 2.94 |
| Total Families | 375 (100.0%) | 3.46 |
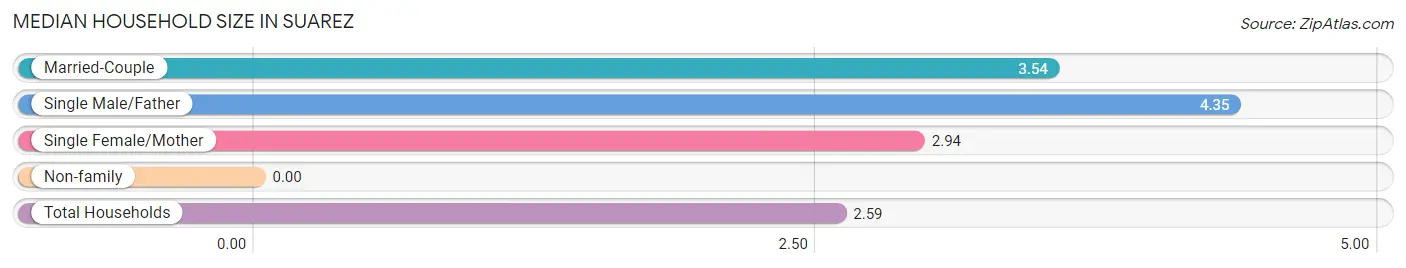
Median Household Size in Suarez
| Household Type | # Households | Household Size |
| Married-Couple | 167 (28.4%) | 3.54 |
| Single Male/Father | 78 (13.3%) | 4.35 |
| Single Female/Mother | 130 (22.1%) | 2.94 |
| Non-family | 213 (36.2%) | - |
| Total Households | 588 (100.0%) | 2.59 |
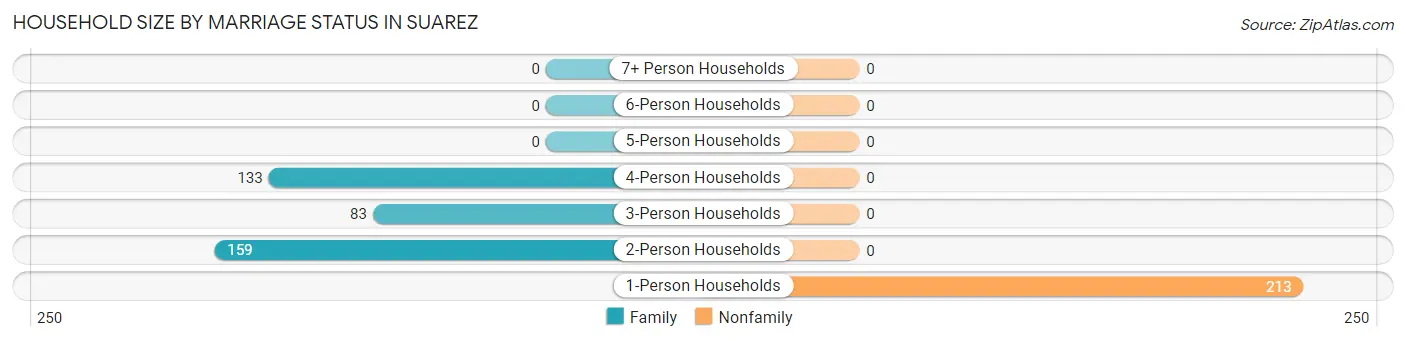
Household Size by Marriage Status in Suarez
Out of a total of 588 households in Suarez, 375 (63.8%) are family households, while 213 (36.2%) are nonfamily households. The most numerous type of family households are 2-person households, comprising 159, and the most common type of nonfamily households are 1-person households, comprising 213.
| Household Size | Family Households | Nonfamily Households |
| 1-Person Households | - | 213 (36.2%) |
| 2-Person Households | 159 (27.0%) | 0 (0.0%) |
| 3-Person Households | 83 (14.1%) | 0 (0.0%) |
| 4-Person Households | 133 (22.6%) | 0 (0.0%) |
| 5-Person Households | 0 (0.0%) | 0 (0.0%) |
| 6-Person Households | 0 (0.0%) | 0 (0.0%) |
| 7+ Person Households | 0 (0.0%) | 0 (0.0%) |
| Total | 375 (63.8%) | 213 (36.2%) |
Female Fertility in Suarez
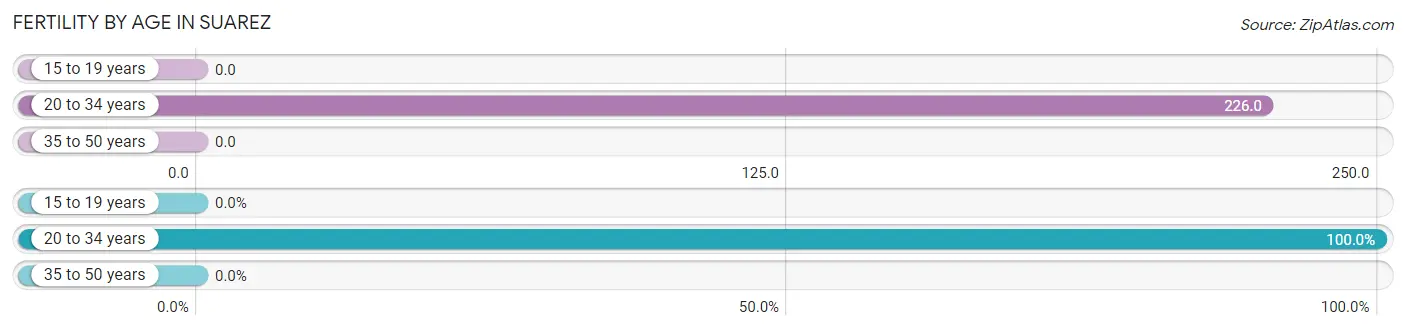
Fertility by Age in Suarez
Average fertility rate in Suarez is 151.0 births per 1,000 women. Women in the age bracket of 20 to 34 years have the highest fertility rate with 226.0 births per 1,000 women. Women in the age bracket of 20 to 34 years acount for 100.0% of all women with births.
| Age Bracket | Women with Births | Births / 1,000 Women |
| 15 to 19 years | 0 (0.0%) | 0.0 |
| 20 to 34 years | 45 (100.0%) | 226.0 |
| 35 to 50 years | 0 (0.0%) | 0.0 |
| Total | 45 (100.0%) | 151.0 |
Fertility by Age by Marriage Status in Suarez
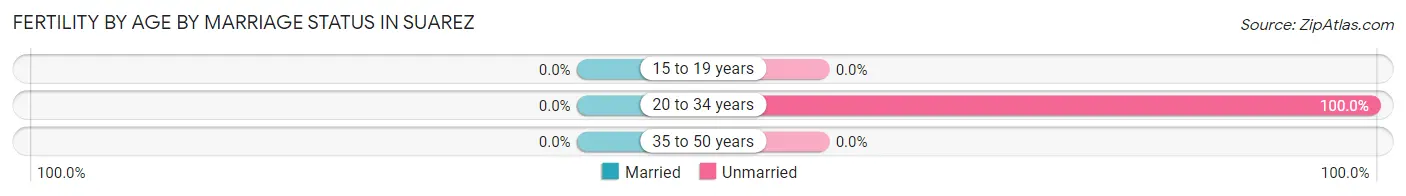
| Age Bracket | Married | Unmarried |
| 15 to 19 years | 0 (0.0%) | 0 (0.0%) |
| 20 to 34 years | 0 (0.0%) | 45 (100.0%) |
| 35 to 50 years | 0 (0.0%) | 0 (0.0%) |
| Total | 0 (0.0%) | 45 (100.0%) |
Fertility by Education in Suarez
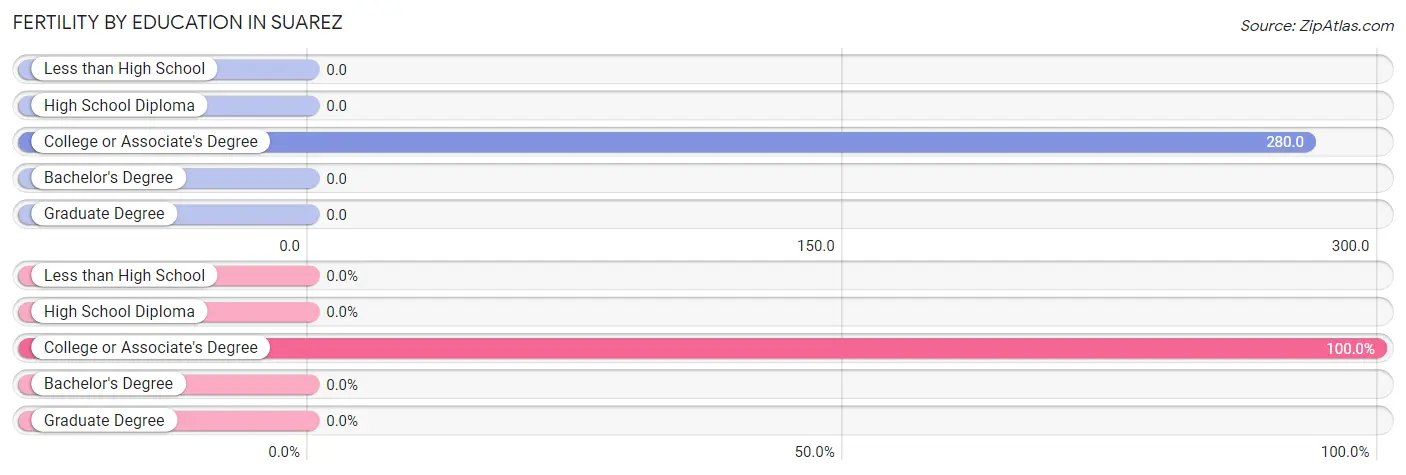
| Educational Attainment | Women with Births | Births / 1,000 Women |
| Less than High School | 0 (0.0%) | 0.0 |
| High School Diploma | 0 (0.0%) | 0.0 |
| College or Associate's Degree | 45 (100.0%) | 280.0 |
| Bachelor's Degree | 0 (0.0%) | 0.0 |
| Graduate Degree | 0 (0.0%) | 0.0 |
| Total | 45 (100.0%) | 151.0 |
Fertility by Education by Marriage Status in Suarez
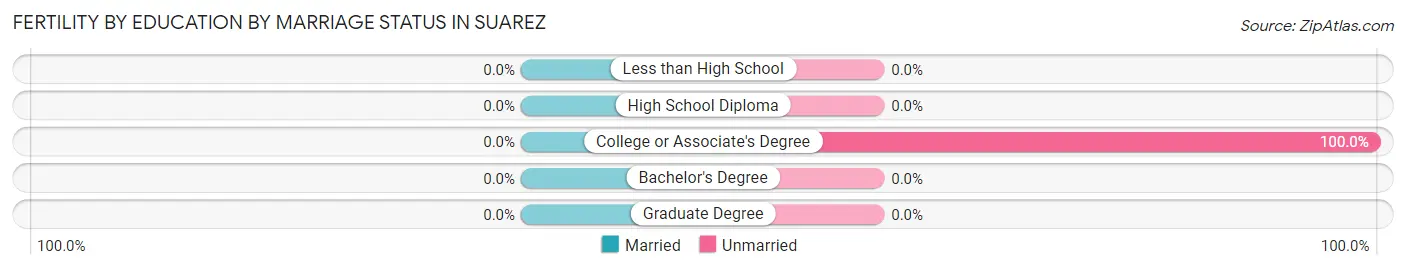
| Educational Attainment | Married | Unmarried |
| Less than High School | 0 (0.0%) | 0 (0.0%) |
| High School Diploma | 0 (0.0%) | 0 (0.0%) |
| College or Associate's Degree | 0 (0.0%) | 45 (100.0%) |
| Bachelor's Degree | 0 (0.0%) | 0 (0.0%) |
| Graduate Degree | 0 (0.0%) | 0 (0.0%) |
| Total | 0 (0.0%) | 45 (100.0%) |
Employment Characteristics in Suarez
Employment by Class of Employer in Suarez
Among the 306 employed individuals in Suarez, private company employees (188 | 61.4%), state government employees (88 | 28.8%), and local government employees (16 | 5.2%) make up the most common classes of employment.
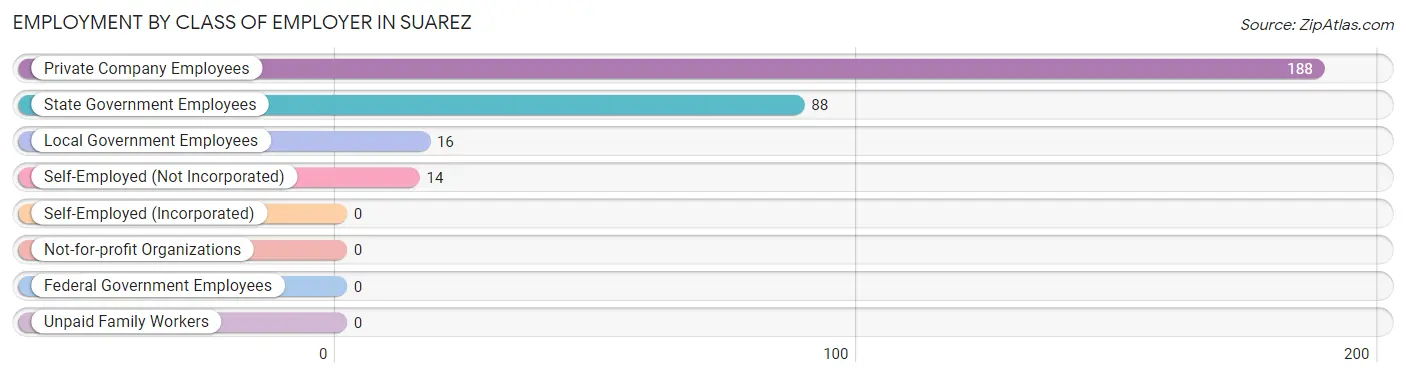
| Employer Class | # Employees | % Employees |
| Private Company Employees | 188 | 61.4% |
| Self-Employed (Incorporated) | 0 | 0.0% |
| Self-Employed (Not Incorporated) | 14 | 4.6% |
| Not-for-profit Organizations | 0 | 0.0% |
| Local Government Employees | 16 | 5.2% |
| State Government Employees | 88 | 28.8% |
| Federal Government Employees | 0 | 0.0% |
| Unpaid Family Workers | 0 | 0.0% |
| Total | 306 | 100.0% |
Employment Status by Age in Suarez
According to the labor force statistics for Suarez, out of the total population over 16 years of age (1,440), 35.7% or 514 individuals are in the labor force, with 40.5% or 208 of them unemployed. The age group with the highest labor force participation rate is 20 to 24 years, with 100.0% or 94 individuals in the labor force. Within the labor force, the 30 to 34 years age range has the highest percentage of unemployed individuals, with 72.2% or 39 of them being unemployed.
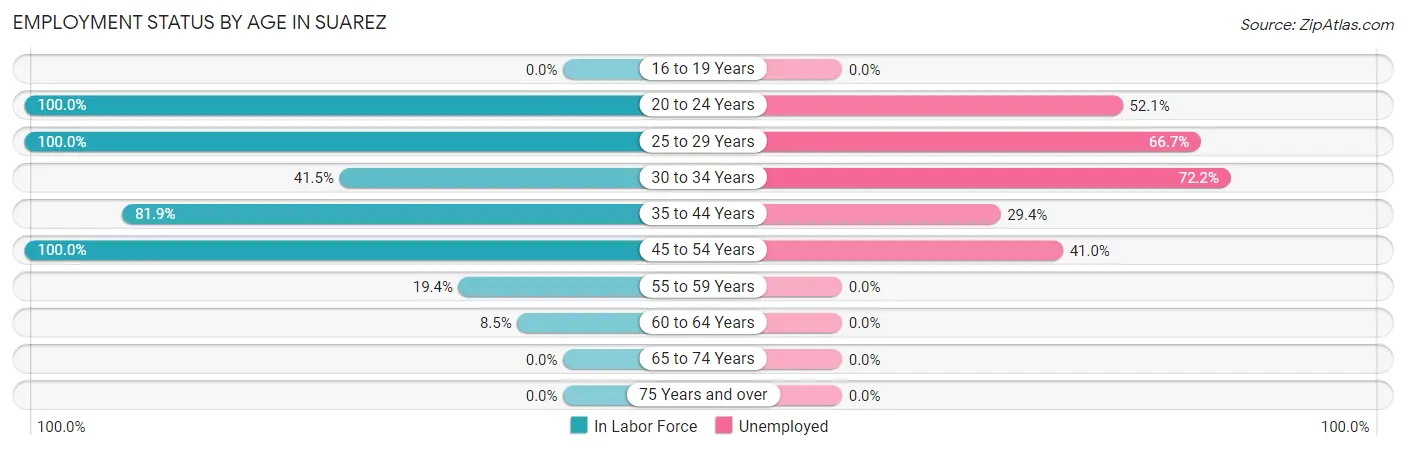
| Age Bracket | In Labor Force | Unemployed |
| 16 to 19 Years | 0 (0.0%) | 0 (0.0%) |
| 20 to 24 Years | 94 (100.0%) | 49 (52.1%) |
| 25 to 29 Years | 42 (100.0%) | 28 (66.7%) |
| 30 to 34 Years | 54 (41.5%) | 39 (72.2%) |
| 35 to 44 Years | 204 (81.9%) | 60 (29.4%) |
| 45 to 54 Years | 78 (100.0%) | 32 (41.0%) |
| 55 to 59 Years | 26 (19.4%) | 0 (0.0%) |
| 60 to 64 Years | 16 (8.5%) | 0 (0.0%) |
| 65 to 74 Years | 0 (0.0%) | 0 (0.0%) |
| 75 Years and over | 0 (0.0%) | 0 (0.0%) |
| Total | 514 (35.7%) | 208 (40.5%) |
Employment Status by Educational Attainment in Suarez
According to labor force statistics for Suarez, 51.1% of individuals (420) out of the total population between 25 and 64 years of age (822) are in the labor force, with 37.9% or 159 of them being unemployed. The group with the highest labor force participation rate are those with the educational attainment of bachelor's degree or higher, with 73.9% or 102 individuals in the labor force. Within the labor force, individuals with high school diploma education have the highest percentage of unemployment, with 54.1% or 99 of them being unemployed.
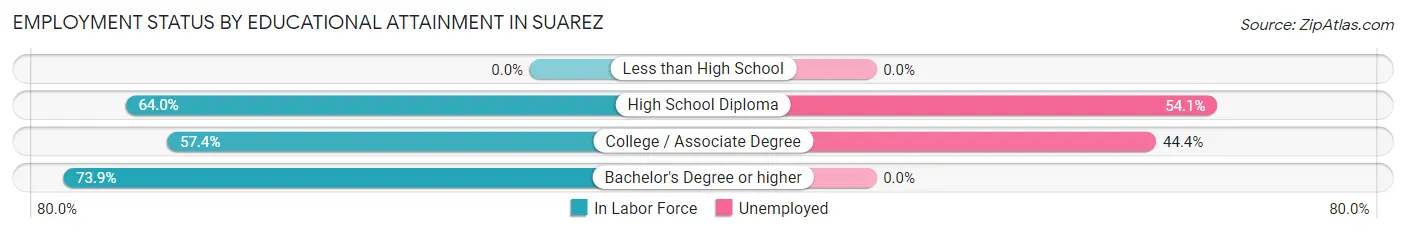
| Educational Attainment | In Labor Force | Unemployed |
| Less than High School | 0 (0.0%) | 0 (0.0%) |
| High School Diploma | 183 (64.0%) | 155 (54.1%) |
| College / Associate Degree | 135 (57.4%) | 104 (44.4%) |
| Bachelor's Degree or higher | 102 (73.9%) | 0 (0.0%) |
| Total | 420 (51.1%) | 312 (37.9%) |
Employment Occupations by Sex in Suarez
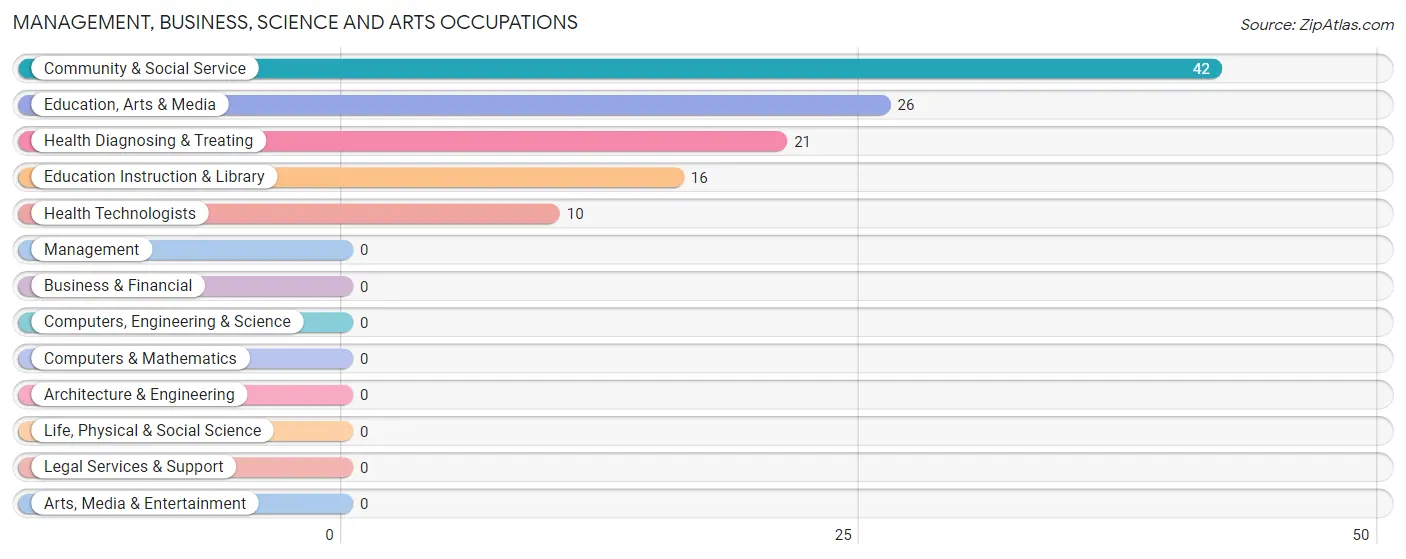
Management, Business, Science and Arts Occupations
The most common Management, Business, Science and Arts occupations in Suarez are Community & Social Service (42 | 13.7%), Education, Arts & Media (26 | 8.5%), Health Diagnosing & Treating (21 | 6.9%), Education Instruction & Library (16 | 5.2%), and Health Technologists (10 | 3.3%).
Management, Business, Science and Arts Occupations by Sex
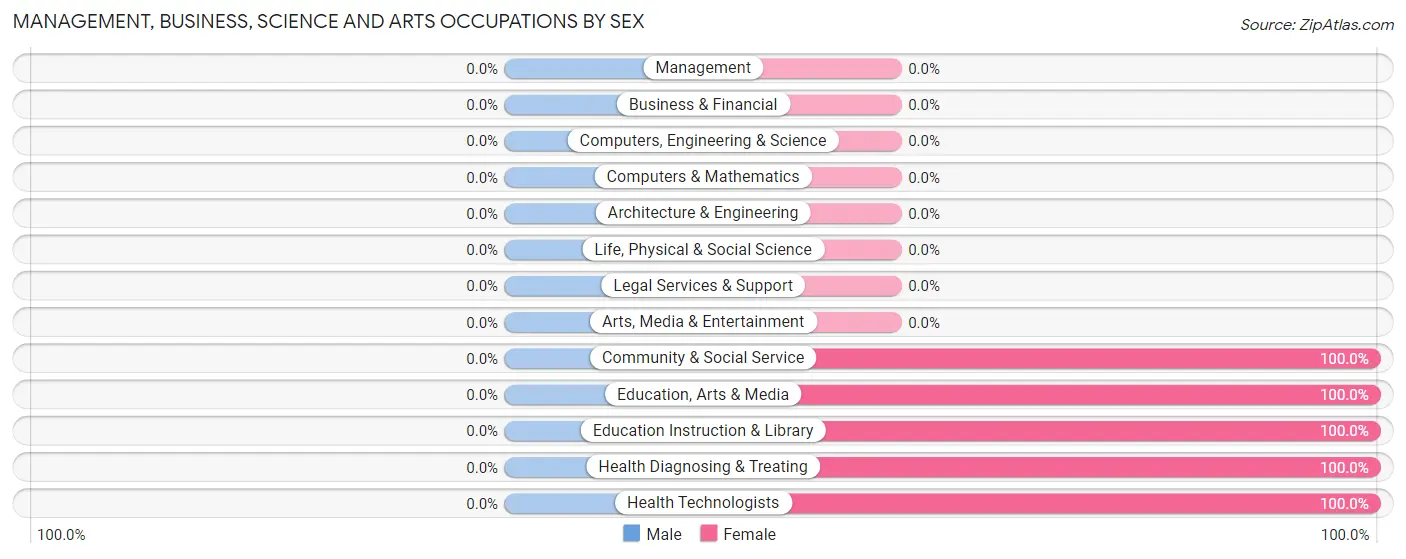
| Occupation | Male | Female |
| Management | 0 (0.0%) | 0 (0.0%) |
| Business & Financial | 0 (0.0%) | 0 (0.0%) |
| Computers, Engineering & Science | 0 (0.0%) | 0 (0.0%) |
| Computers & Mathematics | 0 (0.0%) | 0 (0.0%) |
| Architecture & Engineering | 0 (0.0%) | 0 (0.0%) |
| Life, Physical & Social Science | 0 (0.0%) | 0 (0.0%) |
| Community & Social Service | 0 (0.0%) | 42 (100.0%) |
| Education, Arts & Media | 0 (0.0%) | 26 (100.0%) |
| Legal Services & Support | 0 (0.0%) | 0 (0.0%) |
| Education Instruction & Library | 0 (0.0%) | 16 (100.0%) |
| Arts, Media & Entertainment | 0 (0.0%) | 0 (0.0%) |
| Health Diagnosing & Treating | 0 (0.0%) | 21 (100.0%) |
| Health Technologists | 0 (0.0%) | 10 (100.0%) |
| Total (Category) | 0 (0.0%) | 63 (100.0%) |
| Total (Overall) | 137 (44.8%) | 169 (55.2%) |
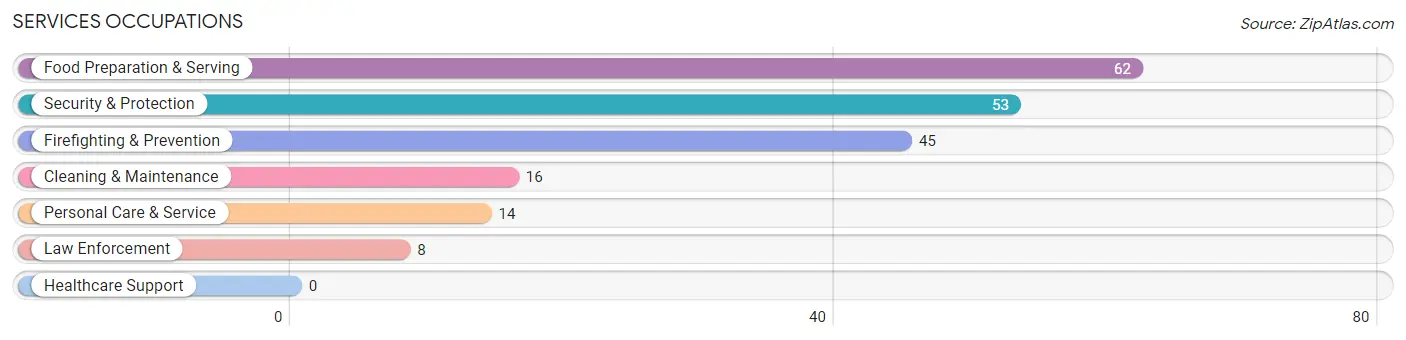
Services Occupations
The most common Services occupations in Suarez are Food Preparation & Serving (62 | 20.3%), Security & Protection (53 | 17.3%), Firefighting & Prevention (45 | 14.7%), Cleaning & Maintenance (16 | 5.2%), and Personal Care & Service (14 | 4.6%).
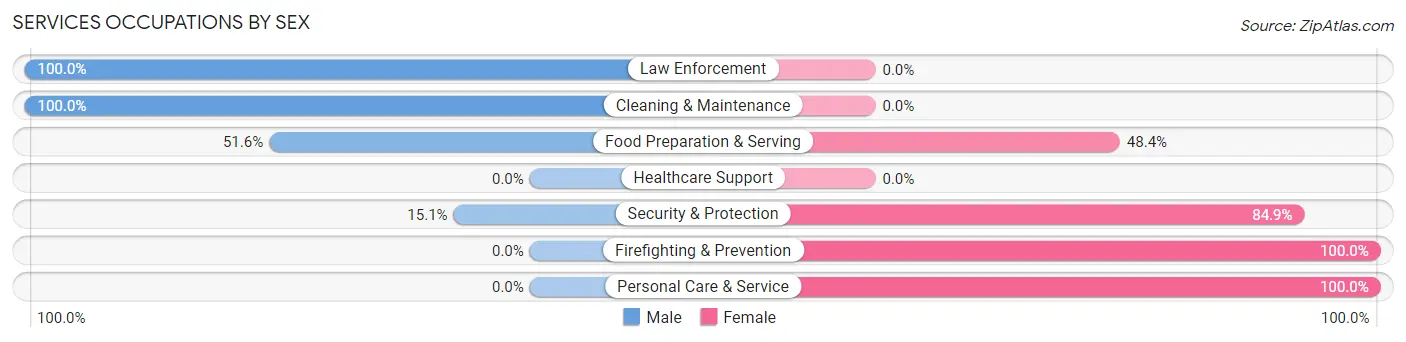
Services Occupations by Sex
Within the Services occupations in Suarez, the most male-oriented occupations are Law Enforcement (100.0%), Cleaning & Maintenance (100.0%), and Food Preparation & Serving (51.6%), while the most female-oriented occupations are Firefighting & Prevention (100.0%), Personal Care & Service (100.0%), and Security & Protection (84.9%).
| Occupation | Male | Female |
| Healthcare Support | 0 (0.0%) | 0 (0.0%) |
| Security & Protection | 8 (15.1%) | 45 (84.9%) |
| Firefighting & Prevention | 0 (0.0%) | 45 (100.0%) |
| Law Enforcement | 8 (100.0%) | 0 (0.0%) |
| Food Preparation & Serving | 32 (51.6%) | 30 (48.4%) |
| Cleaning & Maintenance | 16 (100.0%) | 0 (0.0%) |
| Personal Care & Service | 0 (0.0%) | 14 (100.0%) |
| Total (Category) | 56 (38.6%) | 89 (61.4%) |
| Total (Overall) | 137 (44.8%) | 169 (55.2%) |
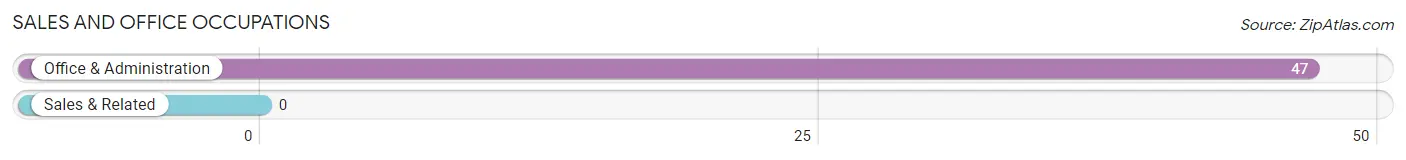
Sales and Office Occupations
The most common Sales and Office occupations in Suarez are , and Office & Administration (47 | 15.4%).
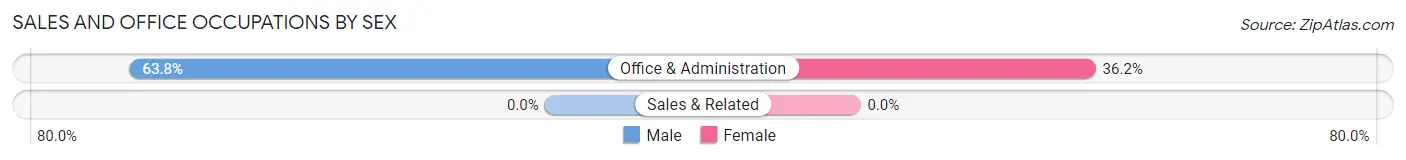
Sales and Office Occupations by Sex
| Occupation | Male | Female |
| Sales & Related | 0 (0.0%) | 0 (0.0%) |
| Office & Administration | 30 (63.8%) | 17 (36.2%) |
| Total (Category) | 30 (63.8%) | 17 (36.2%) |
| Total (Overall) | 137 (44.8%) | 169 (55.2%) |
Natural Resources, Construction and Maintenance Occupations
Natural Resources, Construction and Maintenance Occupations by Sex
| Occupation | Male | Female |
| Farming, Fishing & Forestry | 0 (0.0%) | 0 (0.0%) |
| Construction & Extraction | 0 (0.0%) | 0 (0.0%) |
| Installation, Maintenance & Repair | 0 (0.0%) | 0 (0.0%) |
| Total (Category) | 0 (0.0%) | 0 (0.0%) |
| Total (Overall) | 137 (44.8%) | 169 (55.2%) |
Production, Transportation and Moving Occupations
The most common Production, Transportation and Moving occupations in Suarez are Production (36 | 11.8%), and Material Moving (15 | 4.9%).
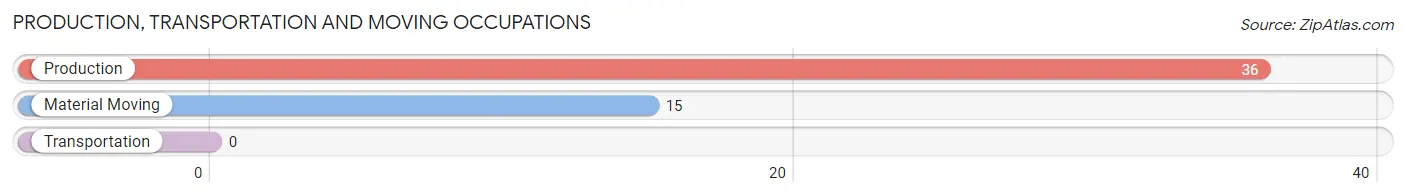
Production, Transportation and Moving Occupations by Sex
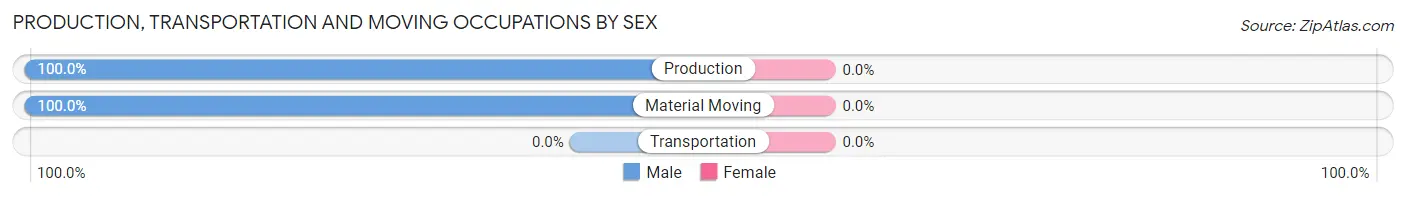
| Occupation | Male | Female |
| Production | 36 (100.0%) | 0 (0.0%) |
| Transportation | 0 (0.0%) | 0 (0.0%) |
| Material Moving | 15 (100.0%) | 0 (0.0%) |
| Total (Category) | 51 (100.0%) | 0 (0.0%) |
| Total (Overall) | 137 (44.8%) | 169 (55.2%) |
Employment Industries by Sex in Suarez
Employment Industries in Suarez
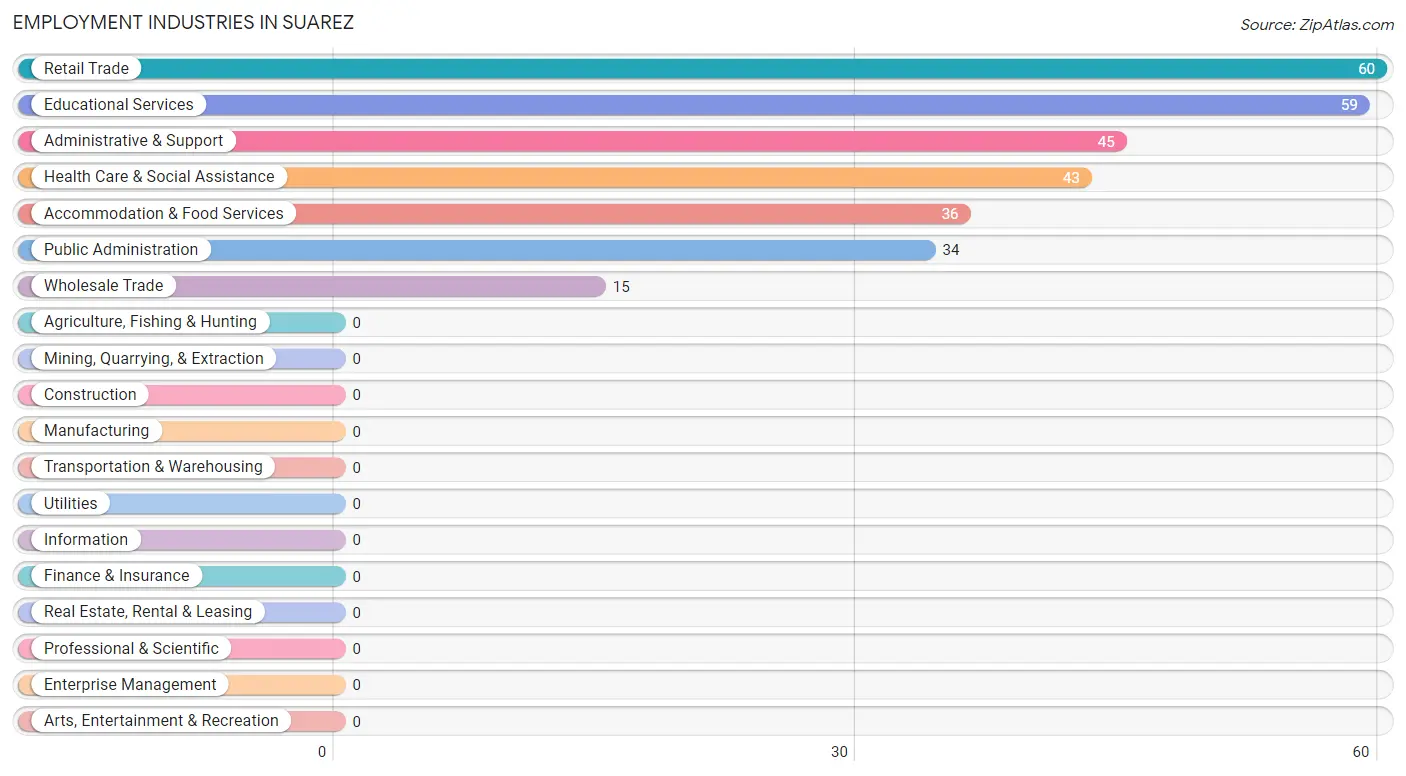
The major employment industries in Suarez include Retail Trade (60 | 19.6%), Educational Services (59 | 19.3%), Administrative & Support (45 | 14.7%), Health Care & Social Assistance (43 | 14.1%), and Accommodation & Food Services (36 | 11.8%).
Employment Industries by Sex in Suarez
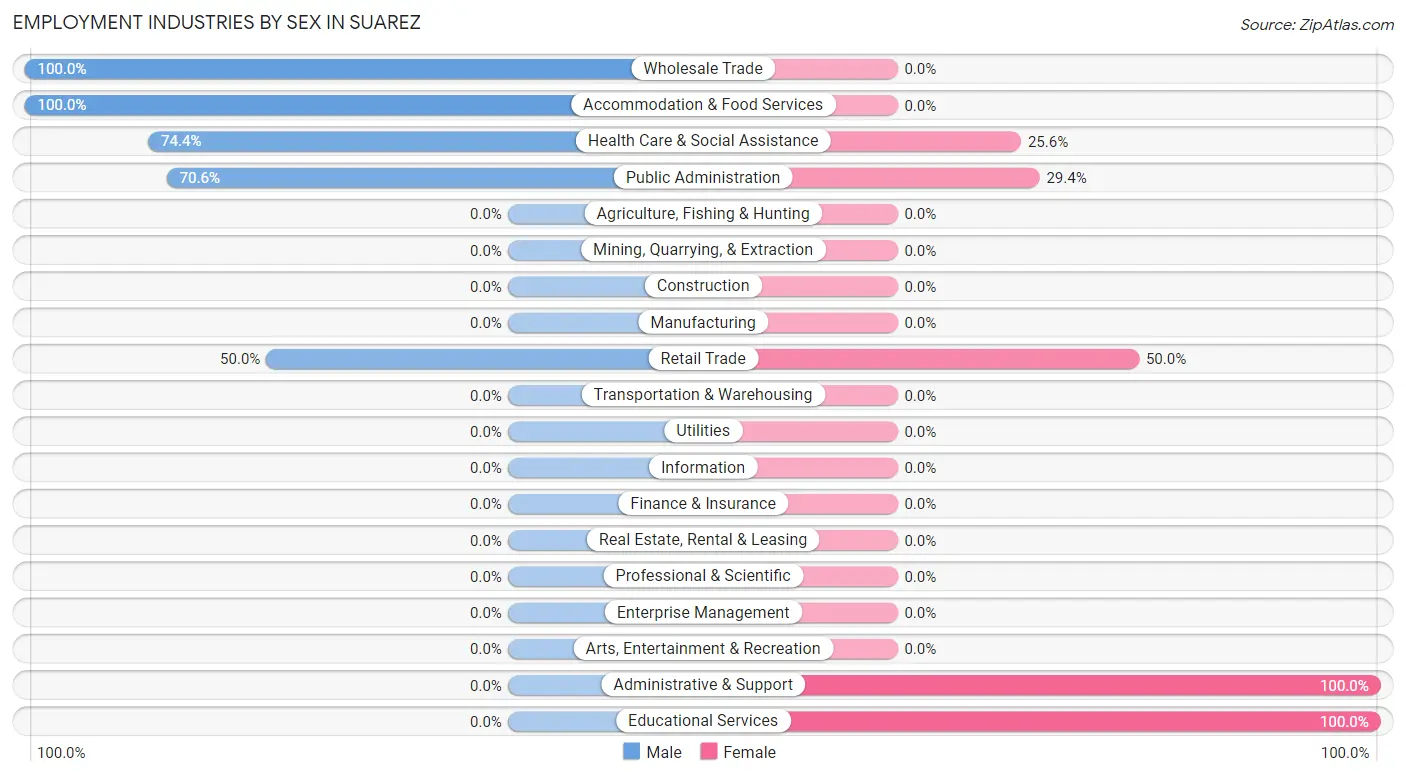
The Suarez industries that see more men than women are Wholesale Trade (100.0%), Accommodation & Food Services (100.0%), and Health Care & Social Assistance (74.4%), whereas the industries that tend to have a higher number of women are Administrative & Support (100.0%), Educational Services (100.0%), and Retail Trade (50.0%).
| Industry | Male | Female |
| Agriculture, Fishing & Hunting | 0 (0.0%) | 0 (0.0%) |
| Mining, Quarrying, & Extraction | 0 (0.0%) | 0 (0.0%) |
| Construction | 0 (0.0%) | 0 (0.0%) |
| Manufacturing | 0 (0.0%) | 0 (0.0%) |
| Wholesale Trade | 15 (100.0%) | 0 (0.0%) |
| Retail Trade | 30 (50.0%) | 30 (50.0%) |
| Transportation & Warehousing | 0 (0.0%) | 0 (0.0%) |
| Utilities | 0 (0.0%) | 0 (0.0%) |
| Information | 0 (0.0%) | 0 (0.0%) |
| Finance & Insurance | 0 (0.0%) | 0 (0.0%) |
| Real Estate, Rental & Leasing | 0 (0.0%) | 0 (0.0%) |
| Professional & Scientific | 0 (0.0%) | 0 (0.0%) |
| Enterprise Management | 0 (0.0%) | 0 (0.0%) |
| Administrative & Support | 0 (0.0%) | 45 (100.0%) |
| Educational Services | 0 (0.0%) | 59 (100.0%) |
| Health Care & Social Assistance | 32 (74.4%) | 11 (25.6%) |
| Arts, Entertainment & Recreation | 0 (0.0%) | 0 (0.0%) |
| Accommodation & Food Services | 36 (100.0%) | 0 (0.0%) |
| Public Administration | 24 (70.6%) | 10 (29.4%) |
| Total | 137 (44.8%) | 169 (55.2%) |
Education in Suarez
School Enrollment in Suarez
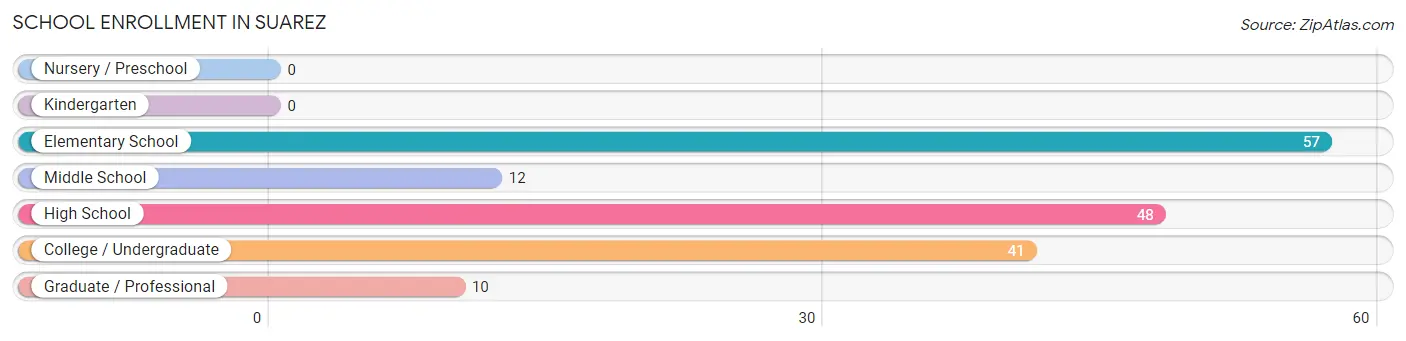
The most common levels of schooling among the 168 students in Suarez are elementary school (57 | 33.9%), high school (48 | 28.6%), and college / undergraduate (41 | 24.4%).
| School Level | # Students | % Students |
| Nursery / Preschool | 0 | 0.0% |
| Kindergarten | 0 | 0.0% |
| Elementary School | 57 | 33.9% |
| Middle School | 12 | 7.1% |
| High School | 48 | 28.6% |
| College / Undergraduate | 41 | 24.4% |
| Graduate / Professional | 10 | 5.9% |
| Total | 168 | 100.0% |
School Enrollment by Age by Funding Source in Suarez
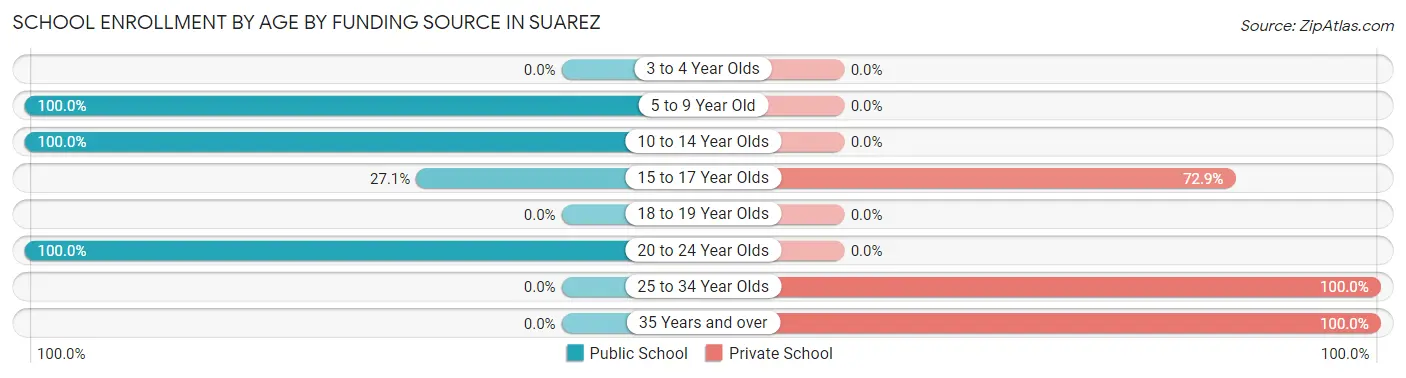
Out of a total of 168 students who are enrolled in schools in Suarez, 72 (42.9%) attend a private institution, while the remaining 96 (57.1%) are enrolled in public schools. The age group of 25 to 34 year olds has the highest likelihood of being enrolled in private schools, with 15 (100.0% in the age bracket) enrolled. Conversely, the age group of 5 to 9 year old has the lowest likelihood of being enrolled in a private school, with 57 (100.0% in the age bracket) attending a public institution.
| Age Bracket | Public School | Private School |
| 3 to 4 Year Olds | 0 (0.0%) | 0 (0.0%) |
| 5 to 9 Year Old | 57 (100.0%) | 0 (0.0%) |
| 10 to 14 Year Olds | 12 (100.0%) | 0 (0.0%) |
| 15 to 17 Year Olds | 13 (27.1%) | 35 (72.9%) |
| 18 to 19 Year Olds | 0 (0.0%) | 0 (0.0%) |
| 20 to 24 Year Olds | 14 (100.0%) | 0 (0.0%) |
| 25 to 34 Year Olds | 0 (0.0%) | 15 (100.0%) |
| 35 Years and over | 0 (0.0%) | 22 (100.0%) |
| Total | 96 (57.1%) | 72 (42.9%) |
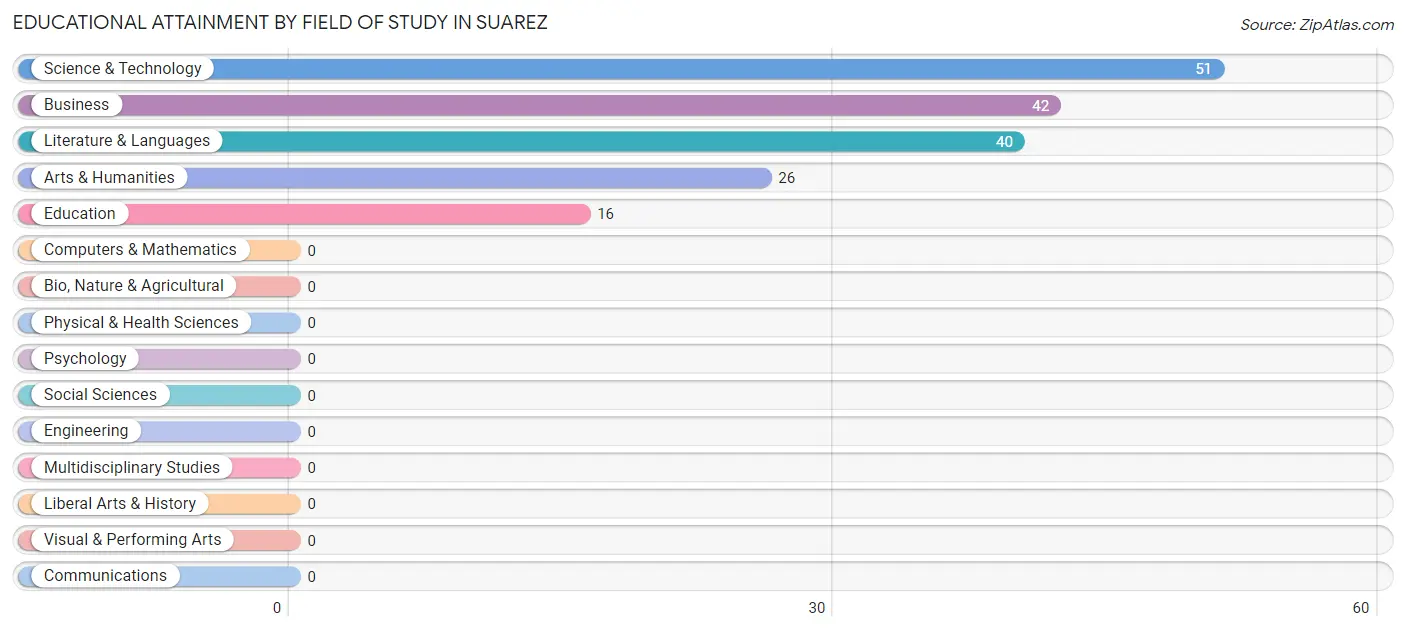
Educational Attainment by Field of Study in Suarez
Science & technology (51 | 29.1%), business (42 | 24.0%), literature & languages (40 | 22.9%), arts & humanities (26 | 14.9%), and education (16 | 9.1%) are the most common fields of study among 175 individuals in Suarez who have obtained a bachelor's degree or higher.
| Field of Study | # Graduates | % Graduates |
| Computers & Mathematics | 0 | 0.0% |
| Bio, Nature & Agricultural | 0 | 0.0% |
| Physical & Health Sciences | 0 | 0.0% |
| Psychology | 0 | 0.0% |
| Social Sciences | 0 | 0.0% |
| Engineering | 0 | 0.0% |
| Multidisciplinary Studies | 0 | 0.0% |
| Science & Technology | 51 | 29.1% |
| Business | 42 | 24.0% |
| Education | 16 | 9.1% |
| Literature & Languages | 40 | 22.9% |
| Liberal Arts & History | 0 | 0.0% |
| Visual & Performing Arts | 0 | 0.0% |
| Communications | 0 | 0.0% |
| Arts & Humanities | 26 | 14.9% |
| Total | 175 | 100.0% |
Transportation & Commute in Suarez
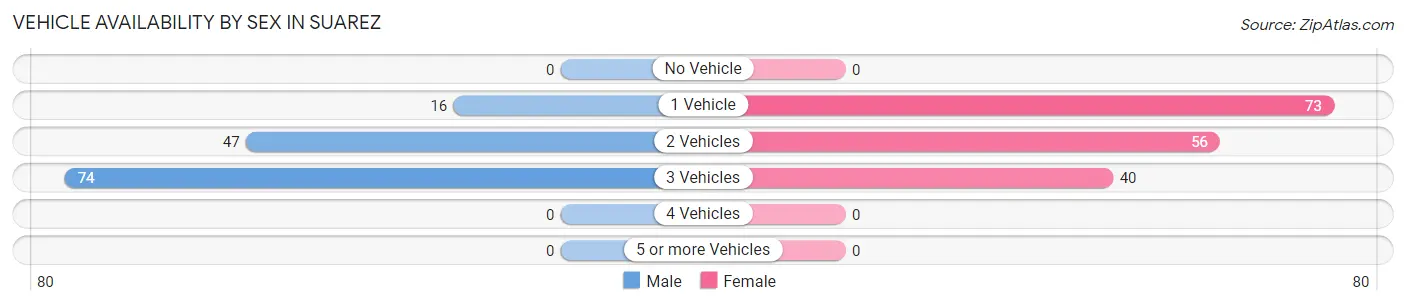
Vehicle Availability by Sex in Suarez
The most prevalent vehicle ownership categories in Suarez are males with 3 vehicles (74, accounting for 54.0%) and females with 3 vehicles (40, making up 43.8%).
| Vehicles Available | Male | Female |
| No Vehicle | 0 (0.0%) | 0 (0.0%) |
| 1 Vehicle | 16 (11.7%) | 73 (43.2%) |
| 2 Vehicles | 47 (34.3%) | 56 (33.1%) |
| 3 Vehicles | 74 (54.0%) | 40 (23.7%) |
| 4 Vehicles | 0 (0.0%) | 0 (0.0%) |
| 5 or more Vehicles | 0 (0.0%) | 0 (0.0%) |
| Total | 137 (100.0%) | 169 (100.0%) |
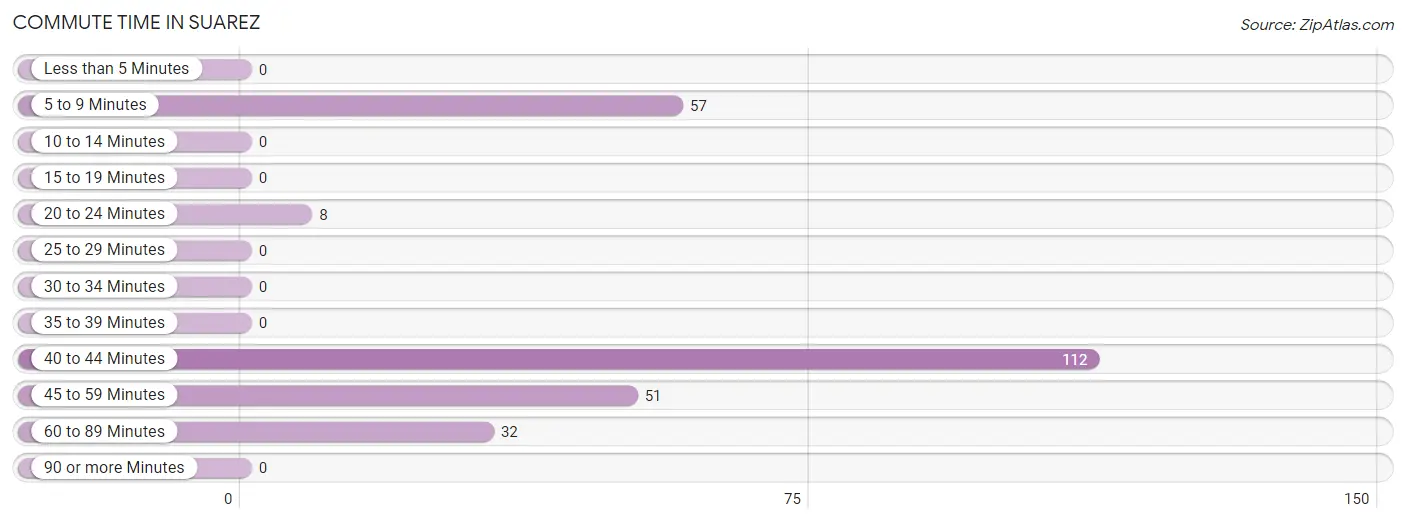
Commute Time in Suarez
The most frequently occuring commute durations in Suarez are 40 to 44 minutes (112 commuters, 43.1%), 5 to 9 minutes (57 commuters, 21.9%), and 45 to 59 minutes (51 commuters, 19.6%).
| Commute Time | # Commuters | % Commuters |
| Less than 5 Minutes | 0 | 0.0% |
| 5 to 9 Minutes | 57 | 21.9% |
| 10 to 14 Minutes | 0 | 0.0% |
| 15 to 19 Minutes | 0 | 0.0% |
| 20 to 24 Minutes | 8 | 3.1% |
| 25 to 29 Minutes | 0 | 0.0% |
| 30 to 34 Minutes | 0 | 0.0% |
| 35 to 39 Minutes | 0 | 0.0% |
| 40 to 44 Minutes | 112 | 43.1% |
| 45 to 59 Minutes | 51 | 19.6% |
| 60 to 89 Minutes | 32 | 12.3% |
| 90 or more Minutes | 0 | 0.0% |
Commute Time by Sex in Suarez
The most common commute times in Suarez are 40 to 44 minutes (67 commuters, 48.9%) for males and 5 to 9 minutes (57 commuters, 46.3%) for females.

| Commute Time | Male | Female |
| Less than 5 Minutes | 0 (0.0%) | 0 (0.0%) |
| 5 to 9 Minutes | 0 (0.0%) | 57 (46.3%) |
| 10 to 14 Minutes | 0 (0.0%) | 0 (0.0%) |
| 15 to 19 Minutes | 0 (0.0%) | 0 (0.0%) |
| 20 to 24 Minutes | 8 (5.8%) | 0 (0.0%) |
| 25 to 29 Minutes | 0 (0.0%) | 0 (0.0%) |
| 30 to 34 Minutes | 0 (0.0%) | 0 (0.0%) |
| 35 to 39 Minutes | 0 (0.0%) | 0 (0.0%) |
| 40 to 44 Minutes | 67 (48.9%) | 45 (36.6%) |
| 45 to 59 Minutes | 30 (21.9%) | 21 (17.1%) |
| 60 to 89 Minutes | 32 (23.4%) | 0 (0.0%) |
| 90 or more Minutes | 0 (0.0%) | 0 (0.0%) |
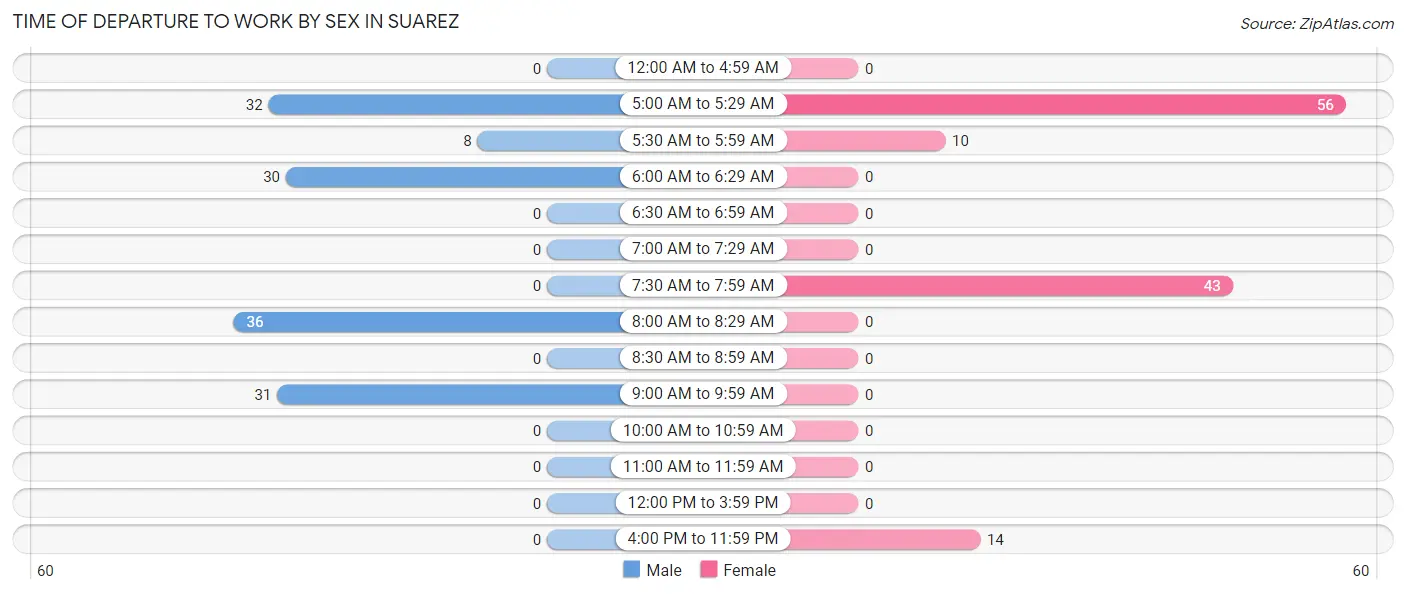
Time of Departure to Work by Sex in Suarez
The most frequent times of departure to work in Suarez are 8:00 AM to 8:29 AM (36, 26.3%) for males and 5:00 AM to 5:29 AM (56, 45.5%) for females.
| Time of Departure | Male | Female |
| 12:00 AM to 4:59 AM | 0 (0.0%) | 0 (0.0%) |
| 5:00 AM to 5:29 AM | 32 (23.4%) | 56 (45.5%) |
| 5:30 AM to 5:59 AM | 8 (5.8%) | 10 (8.1%) |
| 6:00 AM to 6:29 AM | 30 (21.9%) | 0 (0.0%) |
| 6:30 AM to 6:59 AM | 0 (0.0%) | 0 (0.0%) |
| 7:00 AM to 7:29 AM | 0 (0.0%) | 0 (0.0%) |
| 7:30 AM to 7:59 AM | 0 (0.0%) | 43 (35.0%) |
| 8:00 AM to 8:29 AM | 36 (26.3%) | 0 (0.0%) |
| 8:30 AM to 8:59 AM | 0 (0.0%) | 0 (0.0%) |
| 9:00 AM to 9:59 AM | 31 (22.6%) | 0 (0.0%) |
| 10:00 AM to 10:59 AM | 0 (0.0%) | 0 (0.0%) |
| 11:00 AM to 11:59 AM | 0 (0.0%) | 0 (0.0%) |
| 12:00 PM to 3:59 PM | 0 (0.0%) | 0 (0.0%) |
| 4:00 PM to 11:59 PM | 0 (0.0%) | 14 (11.4%) |
| Total | 137 (100.0%) | 123 (100.0%) |
Housing Occupancy in Suarez
Occupancy by Ownership in Suarez
Of the total 588 dwellings in Suarez, owner-occupied units account for 466 (79.2%), while renter-occupied units make up 122 (20.7%).
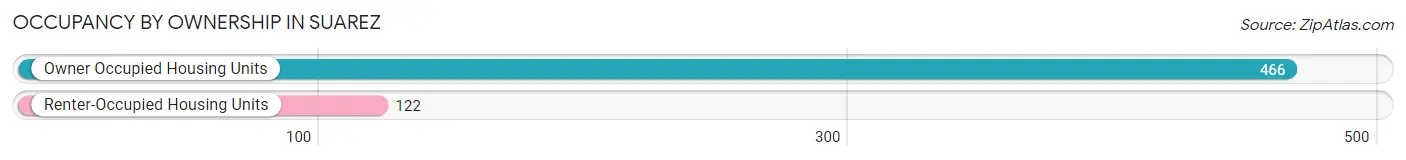
| Occupancy | # Housing Units | % Housing Units |
| Owner Occupied Housing Units | 466 | 79.2% |
| Renter-Occupied Housing Units | 122 | 20.7% |
| Total Occupied Housing Units | 588 | 100.0% |
Occupancy by Household Size in Suarez
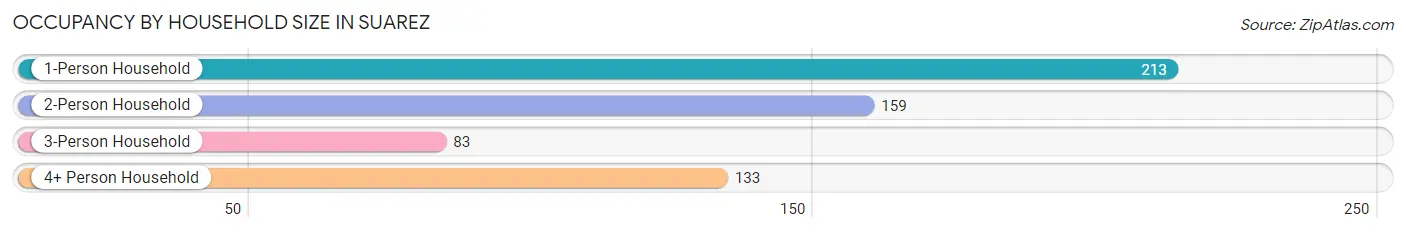
| Household Size | # Housing Units | % Housing Units |
| 1-Person Household | 213 | 36.2% |
| 2-Person Household | 159 | 27.0% |
| 3-Person Household | 83 | 14.1% |
| 4+ Person Household | 133 | 22.6% |
| Total Housing Units | 588 | 100.0% |
Occupancy by Ownership by Household Size in Suarez
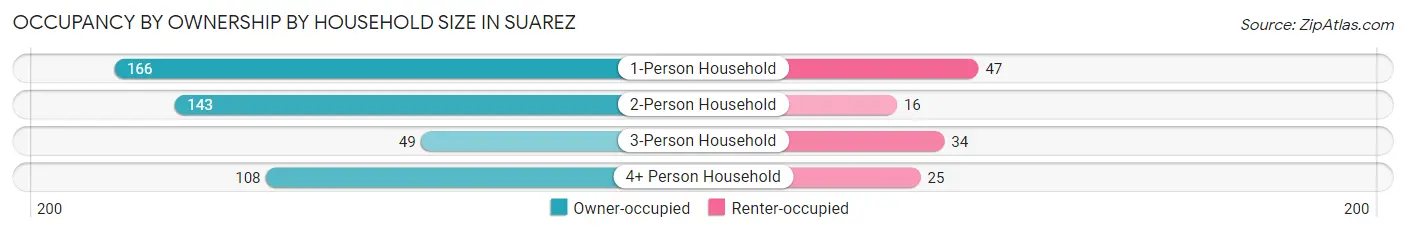
| Household Size | Owner-occupied | Renter-occupied |
| 1-Person Household | 166 (77.9%) | 47 (22.1%) |
| 2-Person Household | 143 (89.9%) | 16 (10.1%) |
| 3-Person Household | 49 (59.0%) | 34 (41.0%) |
| 4+ Person Household | 108 (81.2%) | 25 (18.8%) |
| Total Housing Units | 466 (79.2%) | 122 (20.7%) |
Occupancy by Educational Attainment in Suarez
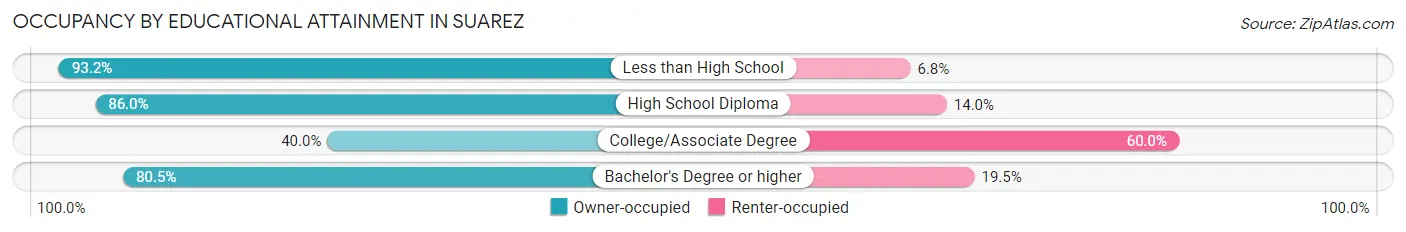
| Household Size | Owner-occupied | Renter-occupied |
| Less than High School | 260 (93.2%) | 19 (6.8%) |
| High School Diploma | 92 (86.0%) | 15 (14.0%) |
| College/Associate Degree | 48 (40.0%) | 72 (60.0%) |
| Bachelor's Degree or higher | 66 (80.5%) | 16 (19.5%) |
Occupancy by Age of Householder in Suarez
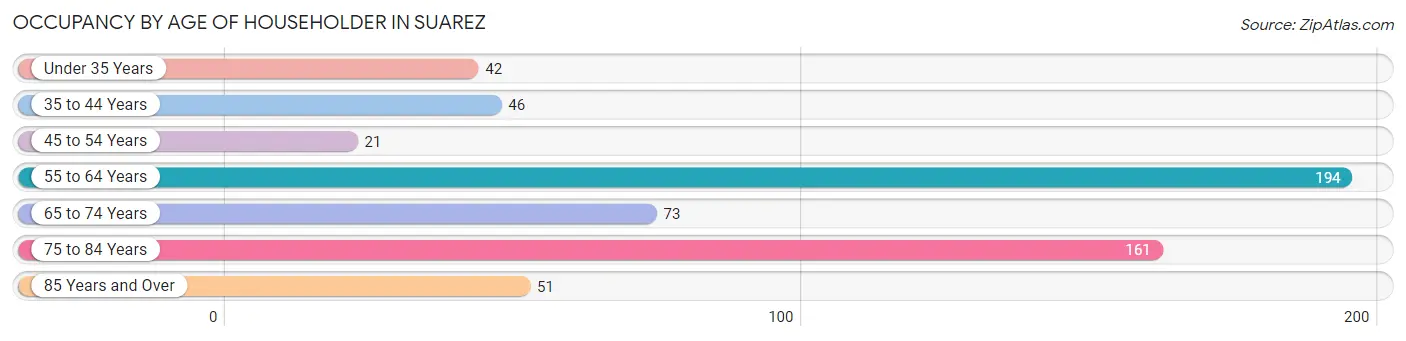
| Age Bracket | # Households | % Households |
| Under 35 Years | 42 | 7.1% |
| 35 to 44 Years | 46 | 7.8% |
| 45 to 54 Years | 21 | 3.6% |
| 55 to 64 Years | 194 | 33.0% |
| 65 to 74 Years | 73 | 12.4% |
| 75 to 84 Years | 161 | 27.4% |
| 85 Years and Over | 51 | 8.7% |
| Total | 588 | 100.0% |
Housing Finances in Suarez
Median Income by Occupancy in Suarez
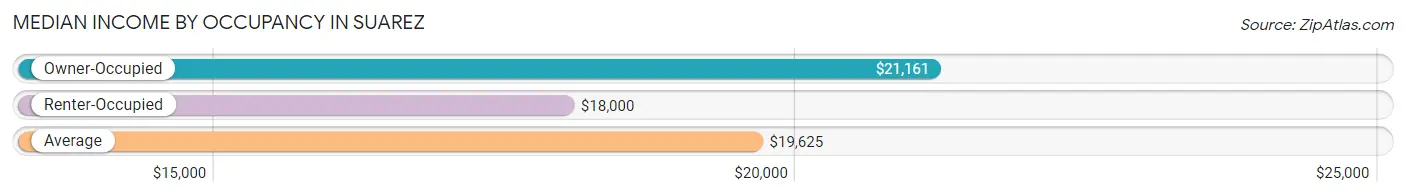
| Occupancy Type | # Households | Median Income |
| Owner-Occupied | 466 (79.2%) | $21,161 |
| Renter-Occupied | 122 (20.7%) | $18,000 |
| Average | 588 (100.0%) | $19,625 |
Occupancy by Householder Income Bracket in Suarez
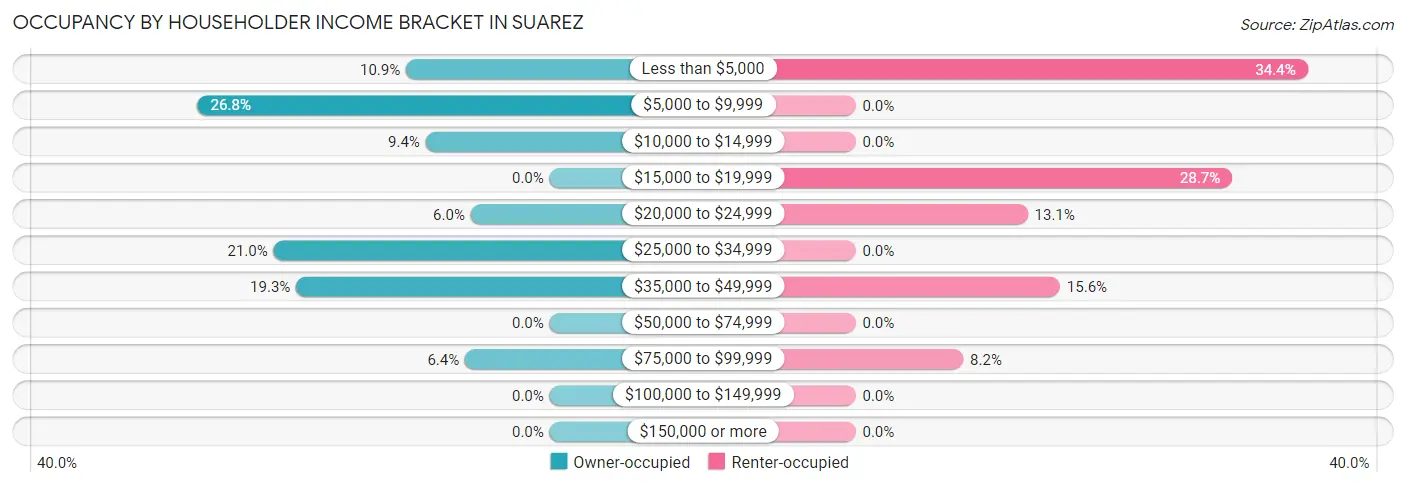
| Income Bracket | Owner-occupied | Renter-occupied |
| Less than $5,000 | 51 (10.9%) | 42 (34.4%) |
| $5,000 to $9,999 | 125 (26.8%) | 0 (0.0%) |
| $10,000 to $14,999 | 44 (9.4%) | 0 (0.0%) |
| $15,000 to $19,999 | 0 (0.0%) | 35 (28.7%) |
| $20,000 to $24,999 | 28 (6.0%) | 16 (13.1%) |
| $25,000 to $34,999 | 98 (21.0%) | 0 (0.0%) |
| $35,000 to $49,999 | 90 (19.3%) | 19 (15.6%) |
| $50,000 to $74,999 | 0 (0.0%) | 0 (0.0%) |
| $75,000 to $99,999 | 30 (6.4%) | 10 (8.2%) |
| $100,000 to $149,999 | 0 (0.0%) | 0 (0.0%) |
| $150,000 or more | 0 (0.0%) | 0 (0.0%) |
| Total | 466 (100.0%) | 122 (100.0%) |
Monthly Housing Cost Tiers in Suarez
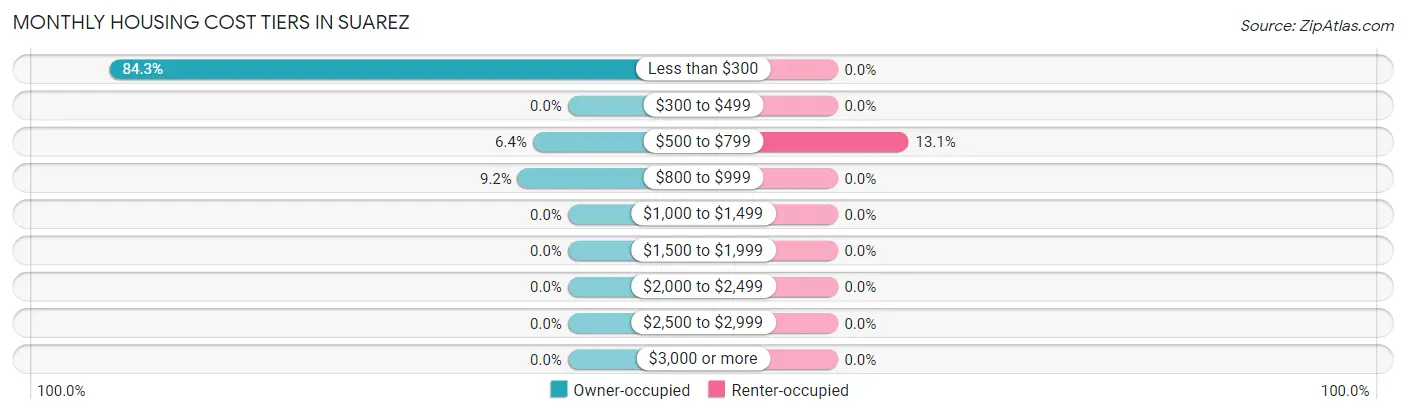
| Monthly Cost | Owner-occupied | Renter-occupied |
| Less than $300 | 393 (84.3%) | 0 (0.0%) |
| $300 to $499 | 0 (0.0%) | 0 (0.0%) |
| $500 to $799 | 30 (6.4%) | 16 (13.1%) |
| $800 to $999 | 43 (9.2%) | 0 (0.0%) |
| $1,000 to $1,499 | 0 (0.0%) | 0 (0.0%) |
| $1,500 to $1,999 | 0 (0.0%) | 0 (0.0%) |
| $2,000 to $2,499 | 0 (0.0%) | 0 (0.0%) |
| $2,500 to $2,999 | 0 (0.0%) | 0 (0.0%) |
| $3,000 or more | 0 (0.0%) | 0 (0.0%) |
| Total | 466 (100.0%) | 122 (100.0%) |
Physical Housing Characteristics in Suarez
Housing Structures in Suarez
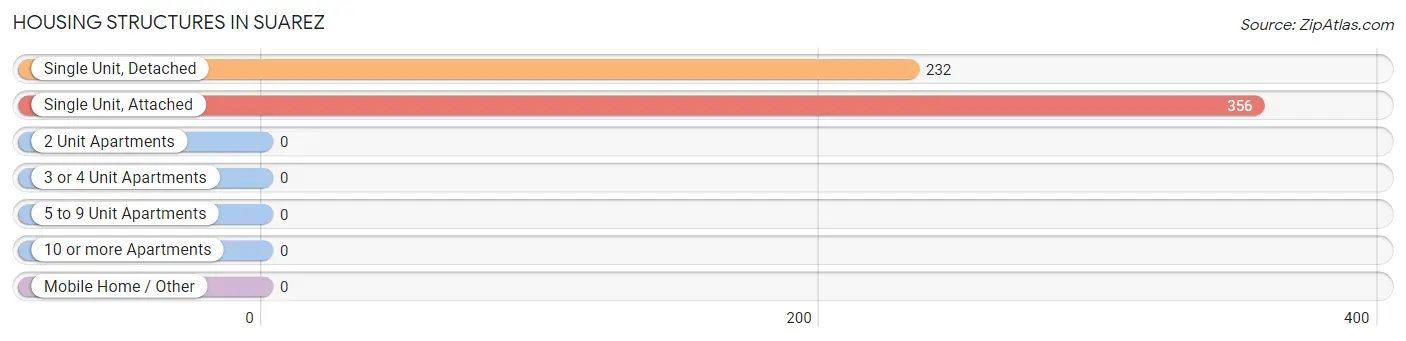
| Structure Type | # Housing Units | % Housing Units |
| Single Unit, Detached | 232 | 39.5% |
| Single Unit, Attached | 356 | 60.5% |
| 2 Unit Apartments | 0 | 0.0% |
| 3 or 4 Unit Apartments | 0 | 0.0% |
| 5 to 9 Unit Apartments | 0 | 0.0% |
| 10 or more Apartments | 0 | 0.0% |
| Mobile Home / Other | 0 | 0.0% |
| Total | 588 | 100.0% |
Housing Structures by Occupancy in Suarez
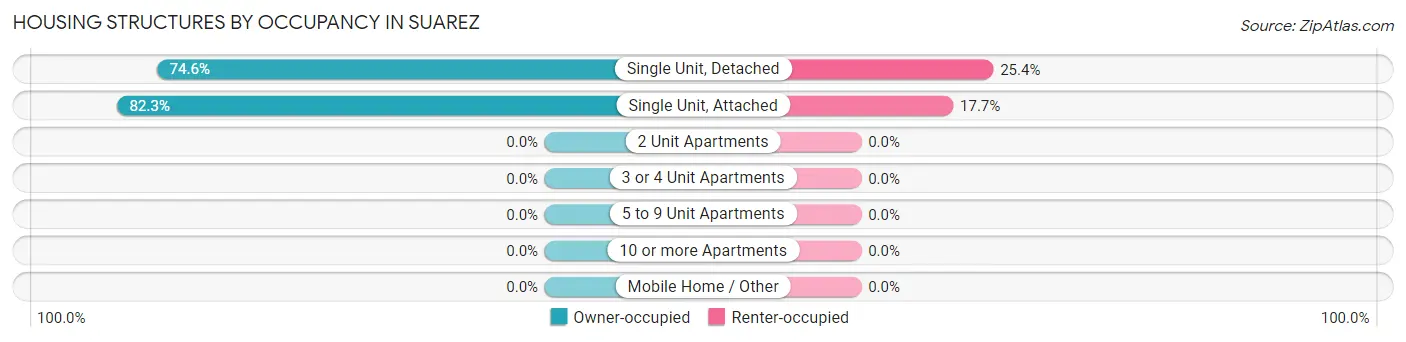
| Structure Type | Owner-occupied | Renter-occupied |
| Single Unit, Detached | 173 (74.6%) | 59 (25.4%) |
| Single Unit, Attached | 293 (82.3%) | 63 (17.7%) |
| 2 Unit Apartments | 0 (0.0%) | 0 (0.0%) |
| 3 or 4 Unit Apartments | 0 (0.0%) | 0 (0.0%) |
| 5 to 9 Unit Apartments | 0 (0.0%) | 0 (0.0%) |
| 10 or more Apartments | 0 (0.0%) | 0 (0.0%) |
| Mobile Home / Other | 0 (0.0%) | 0 (0.0%) |
| Total | 466 (79.2%) | 122 (20.7%) |
Housing Structures by Number of Rooms in Suarez
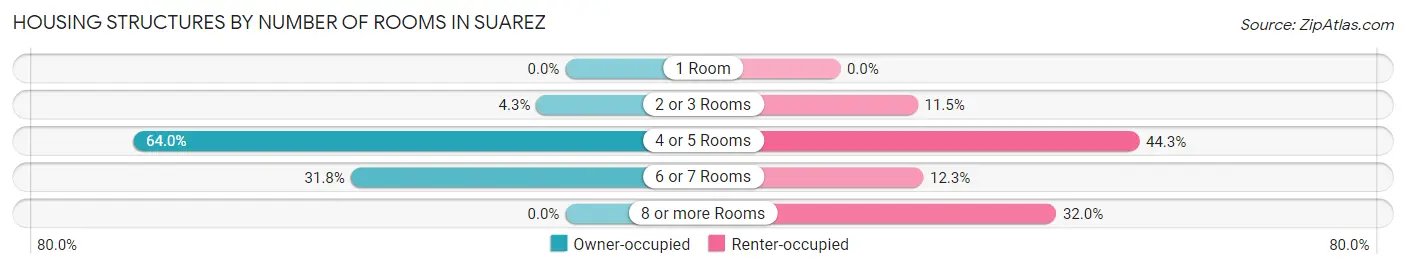
| Number of Rooms | Owner-occupied | Renter-occupied |
| 1 Room | 0 (0.0%) | 0 (0.0%) |
| 2 or 3 Rooms | 20 (4.3%) | 14 (11.5%) |
| 4 or 5 Rooms | 298 (63.9%) | 54 (44.3%) |
| 6 or 7 Rooms | 148 (31.8%) | 15 (12.3%) |
| 8 or more Rooms | 0 (0.0%) | 39 (32.0%) |
| Total | 466 (100.0%) | 122 (100.0%) |
Housing Structure by Heating Type in Suarez
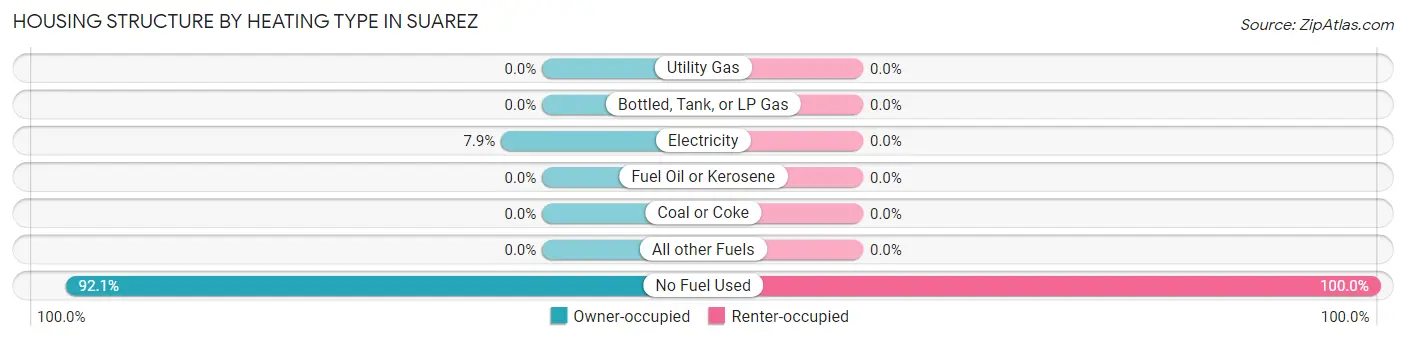
| Heating Type | Owner-occupied | Renter-occupied |
| Utility Gas | 0 (0.0%) | 0 (0.0%) |
| Bottled, Tank, or LP Gas | 0 (0.0%) | 0 (0.0%) |
| Electricity | 37 (7.9%) | 0 (0.0%) |
| Fuel Oil or Kerosene | 0 (0.0%) | 0 (0.0%) |
| Coal or Coke | 0 (0.0%) | 0 (0.0%) |
| All other Fuels | 0 (0.0%) | 0 (0.0%) |
| No Fuel Used | 429 (92.1%) | 122 (100.0%) |
| Total | 466 (100.0%) | 122 (100.0%) |
Household Vehicle Usage in Suarez
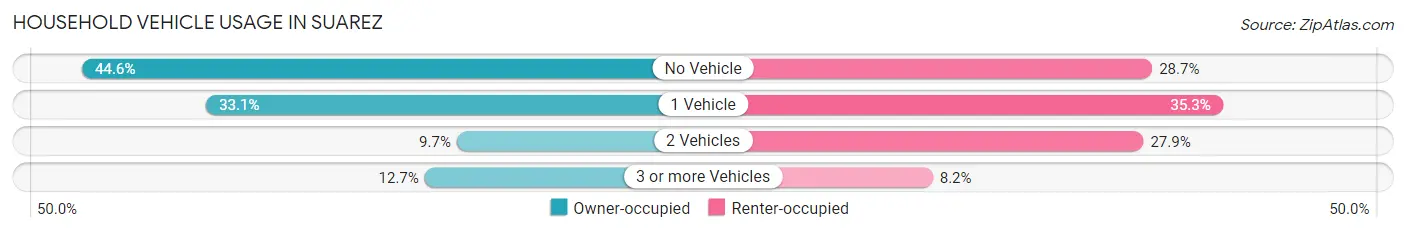
| Vehicles per Household | Owner-occupied | Renter-occupied |
| No Vehicle | 208 (44.6%) | 35 (28.7%) |
| 1 Vehicle | 154 (33.1%) | 43 (35.2%) |
| 2 Vehicles | 45 (9.7%) | 34 (27.9%) |
| 3 or more Vehicles | 59 (12.7%) | 10 (8.2%) |
| Total | 466 (100.0%) | 122 (100.0%) |
Real Estate & Mortgages in Suarez
Real Estate and Mortgage Overview in Suarez
| Characteristic | Without Mortgage | With Mortgage |
| Housing Units | 393 | 73 |
| Median Property Value | $94,700 | $109,600 |
| Median Household Income | - | - |
| Monthly Housing Costs | $99 | $0 |
| Real Estate Taxes | - | - |
Property Value by Mortgage Status in Suarez
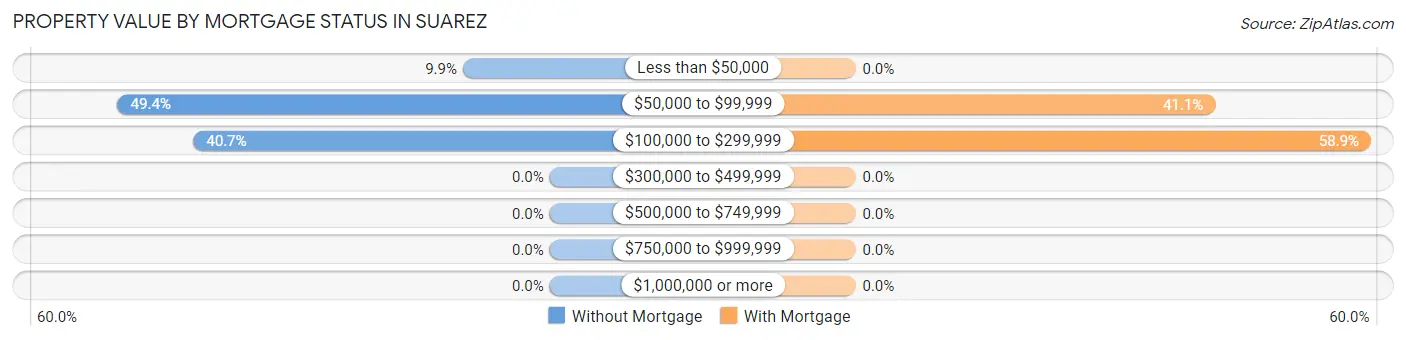
| Property Value | Without Mortgage | With Mortgage |
| Less than $50,000 | 39 (9.9%) | 0 (0.0%) |
| $50,000 to $99,999 | 194 (49.4%) | 30 (41.1%) |
| $100,000 to $299,999 | 160 (40.7%) | 43 (58.9%) |
| $300,000 to $499,999 | 0 (0.0%) | 0 (0.0%) |
| $500,000 to $749,999 | 0 (0.0%) | 0 (0.0%) |
| $750,000 to $999,999 | 0 (0.0%) | 0 (0.0%) |
| $1,000,000 or more | 0 (0.0%) | 0 (0.0%) |
| Total | 393 (100.0%) | 73 (100.0%) |
Household Income by Mortgage Status in Suarez
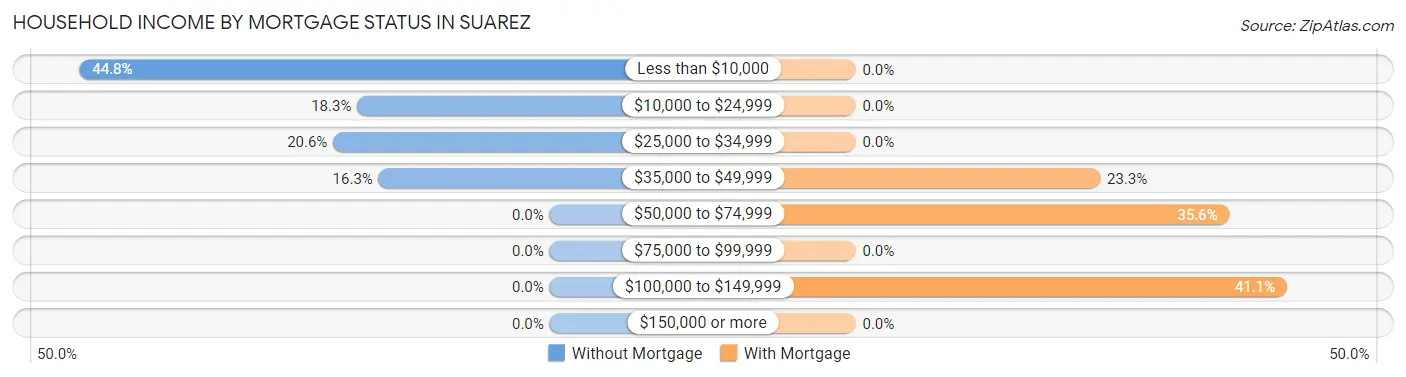
| Household Income | Without Mortgage | With Mortgage |
| Less than $10,000 | 176 (44.8%) | 0 (0.0%) |
| $10,000 to $24,999 | 72 (18.3%) | 0 (0.0%) |
| $25,000 to $34,999 | 81 (20.6%) | 0 (0.0%) |
| $35,000 to $49,999 | 64 (16.3%) | 17 (23.3%) |
| $50,000 to $74,999 | 0 (0.0%) | 26 (35.6%) |
| $75,000 to $99,999 | 0 (0.0%) | 0 (0.0%) |
| $100,000 to $149,999 | 0 (0.0%) | 30 (41.1%) |
| $150,000 or more | 0 (0.0%) | 0 (0.0%) |
| Total | 393 (100.0%) | 73 (100.0%) |
Property Value to Household Income Ratio in Suarez
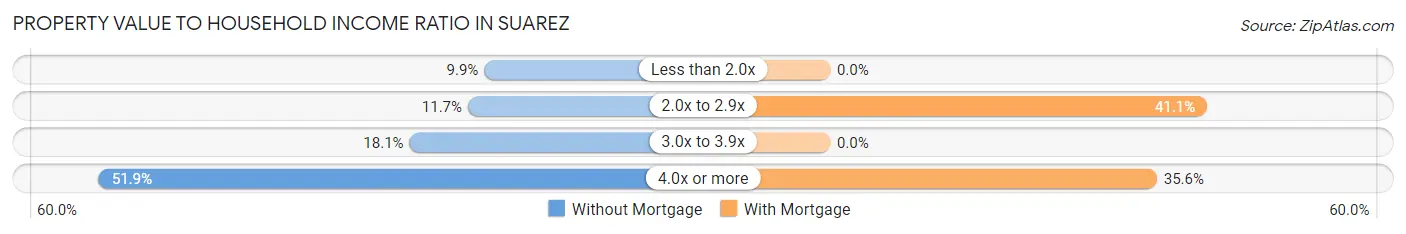
| Value-to-Income Ratio | Without Mortgage | With Mortgage |
| Less than 2.0x | 39 (9.9%) | 0 (0.0%) |
| 2.0x to 2.9x | 46 (11.7%) | 30 (41.1%) |
| 3.0x to 3.9x | 71 (18.1%) | 0 (0.0%) |
| 4.0x or more | 204 (51.9%) | 26 (35.6%) |
| Total | 393 (100.0%) | 73 (100.0%) |
Real Estate Taxes by Mortgage Status in Suarez
| Property Taxes | Without Mortgage | With Mortgage |
| Less than $800 | 0 (0.0%) | 0 (0.0%) |
| $800 to $1,499 | 0 (0.0%) | 0 (0.0%) |
| $800 to $1,499 | 0 (0.0%) | 0 (0.0%) |
| Total | 393 (100.0%) | 73 (100.0%) |
Health & Disability in Suarez
Health Insurance Coverage by Age in Suarez
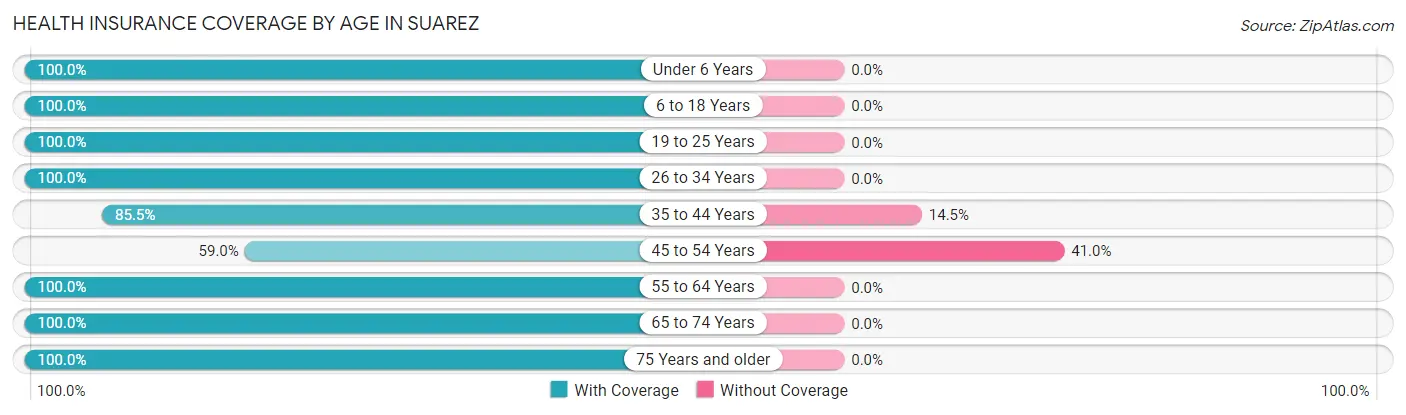
| Age Bracket | With Coverage | Without Coverage |
| Under 6 Years | 35 (100.0%) | 0 (0.0%) |
| 6 to 18 Years | 130 (100.0%) | 0 (0.0%) |
| 19 to 25 Years | 107 (100.0%) | 0 (0.0%) |
| 26 to 34 Years | 159 (100.0%) | 0 (0.0%) |
| 35 to 44 Years | 213 (85.5%) | 36 (14.5%) |
| 45 to 54 Years | 46 (59.0%) | 32 (41.0%) |
| 55 to 64 Years | 323 (100.0%) | 0 (0.0%) |
| 65 to 74 Years | 200 (100.0%) | 0 (0.0%) |
| 75 Years and older | 263 (100.0%) | 0 (0.0%) |
| Total | 1,476 (95.6%) | 68 (4.4%) |
Health Insurance Coverage by Citizenship Status in Suarez
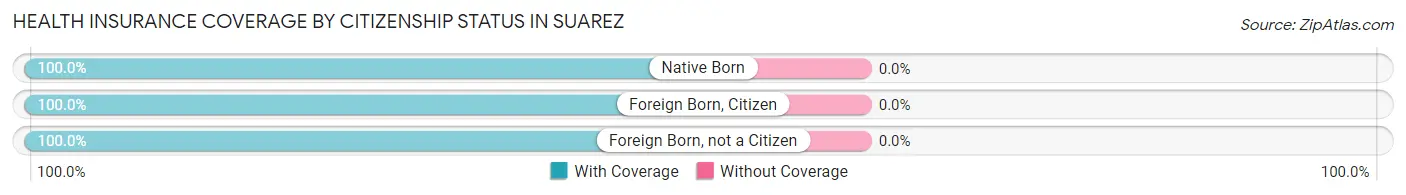
| Citizenship Status | With Coverage | Without Coverage |
| Native Born | 35 (100.0%) | 0 (0.0%) |
| Foreign Born, Citizen | 130 (100.0%) | 0 (0.0%) |
| Foreign Born, not a Citizen | 107 (100.0%) | 0 (0.0%) |
Health Insurance Coverage by Household Income in Suarez
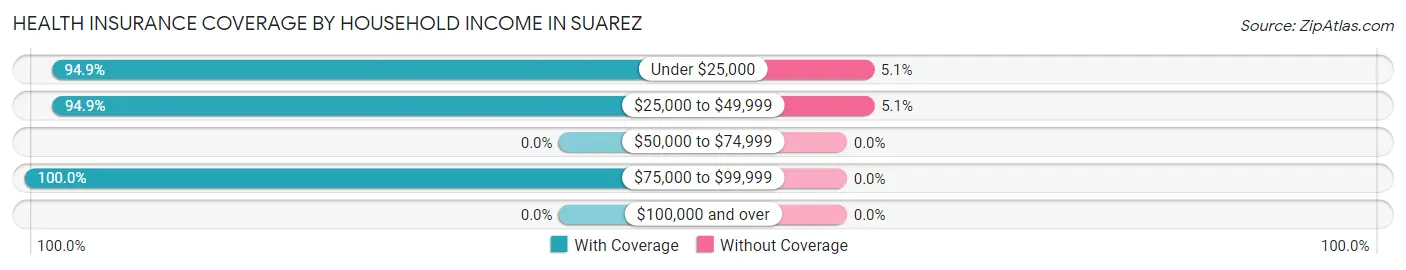
| Household Income | With Coverage | Without Coverage |
| Under $25,000 | 601 (94.9%) | 32 (5.1%) |
| $25,000 to $49,999 | 664 (94.9%) | 36 (5.1%) |
| $50,000 to $74,999 | 0 (0.0%) | 0 (0.0%) |
| $75,000 to $99,999 | 192 (100.0%) | 0 (0.0%) |
| $100,000 and over | 0 (0.0%) | 0 (0.0%) |
Public vs Private Health Insurance Coverage by Age in Suarez
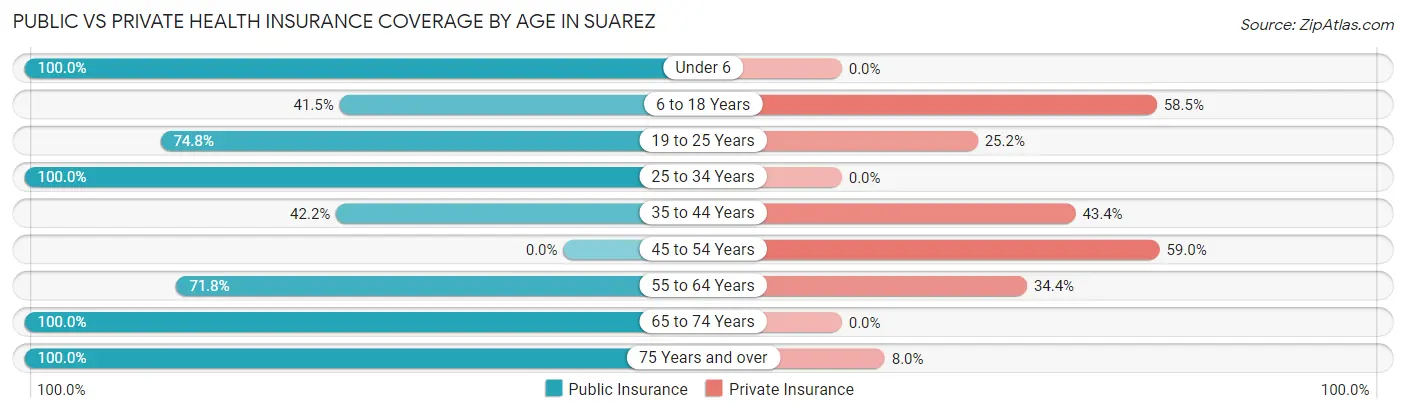
| Age Bracket | Public Insurance | Private Insurance |
| Under 6 | 35 (100.0%) | 0 (0.0%) |
| 6 to 18 Years | 54 (41.5%) | 76 (58.5%) |
| 19 to 25 Years | 80 (74.8%) | 27 (25.2%) |
| 25 to 34 Years | 159 (100.0%) | 0 (0.0%) |
| 35 to 44 Years | 105 (42.2%) | 108 (43.4%) |
| 45 to 54 Years | 0 (0.0%) | 46 (59.0%) |
| 55 to 64 Years | 232 (71.8%) | 111 (34.4%) |
| 65 to 74 Years | 200 (100.0%) | 0 (0.0%) |
| 75 Years and over | 263 (100.0%) | 21 (8.0%) |
| Total | 1,128 (73.1%) | 389 (25.2%) |
Disability Status by Sex by Age in Suarez
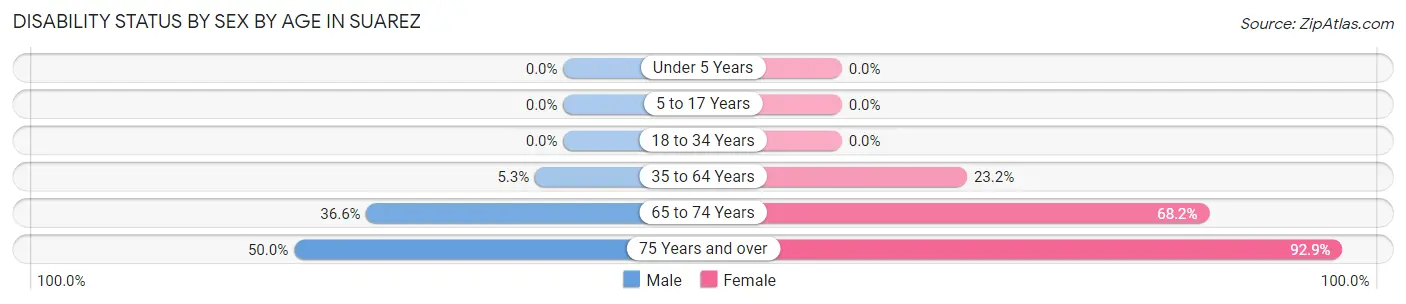
| Age Bracket | Male | Female |
| Under 5 Years | 0 (0.0%) | 0 (0.0%) |
| 5 to 17 Years | 0 (0.0%) | 0 (0.0%) |
| 18 to 34 Years | 0 (0.0%) | 0 (0.0%) |
| 35 to 64 Years | 17 (5.3%) | 76 (23.2%) |
| 65 to 74 Years | 34 (36.6%) | 73 (68.2%) |
| 75 Years and over | 68 (50.0%) | 118 (92.9%) |
Disability Class by Sex by Age in Suarez
Disability Class: Hearing Difficulty
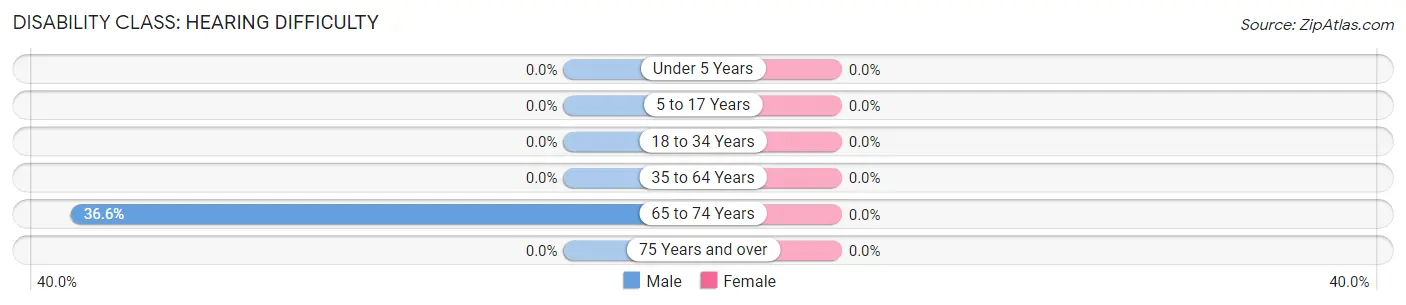
| Age Bracket | Male | Female |
| Under 5 Years | 0 (0.0%) | 0 (0.0%) |
| 5 to 17 Years | 0 (0.0%) | 0 (0.0%) |
| 18 to 34 Years | 0 (0.0%) | 0 (0.0%) |
| 35 to 64 Years | 0 (0.0%) | 0 (0.0%) |
| 65 to 74 Years | 34 (36.6%) | 0 (0.0%) |
| 75 Years and over | 0 (0.0%) | 0 (0.0%) |
Disability Class: Vision Difficulty
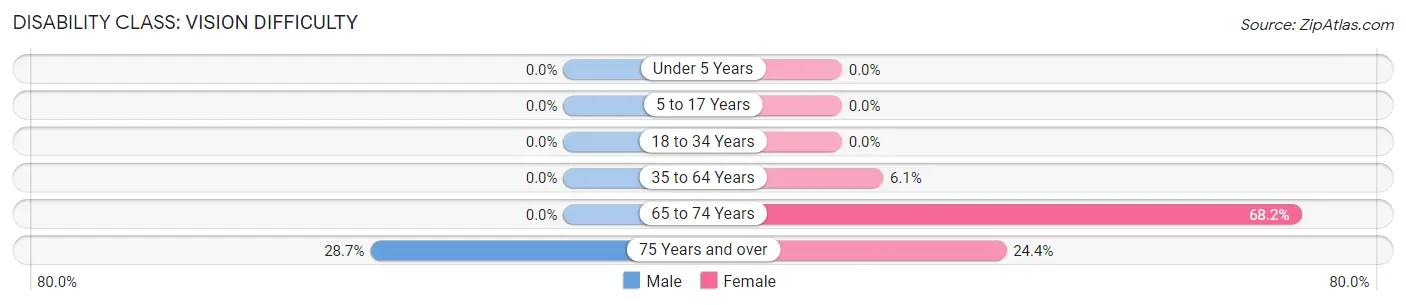
| Age Bracket | Male | Female |
| Under 5 Years | 0 (0.0%) | 0 (0.0%) |
| 5 to 17 Years | 0 (0.0%) | 0 (0.0%) |
| 18 to 34 Years | 0 (0.0%) | 0 (0.0%) |
| 35 to 64 Years | 0 (0.0%) | 20 (6.1%) |
| 65 to 74 Years | 0 (0.0%) | 73 (68.2%) |
| 75 Years and over | 39 (28.7%) | 31 (24.4%) |
Disability Class: Cognitive Difficulty
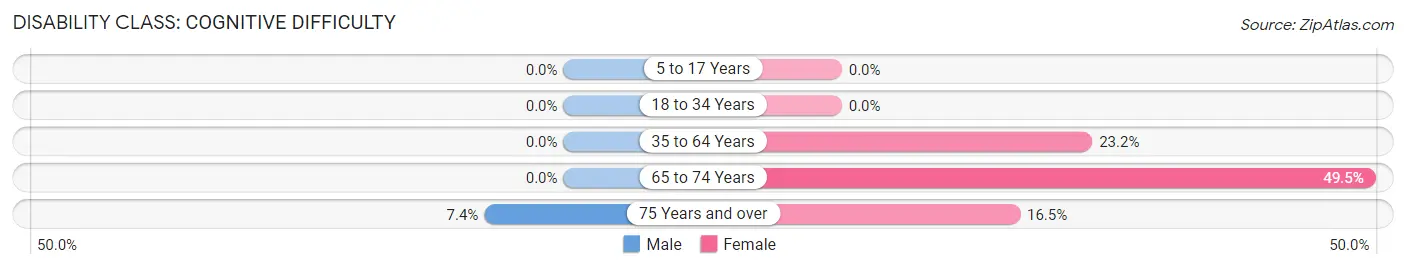
| Age Bracket | Male | Female |
| 5 to 17 Years | 0 (0.0%) | 0 (0.0%) |
| 18 to 34 Years | 0 (0.0%) | 0 (0.0%) |
| 35 to 64 Years | 0 (0.0%) | 76 (23.2%) |
| 65 to 74 Years | 0 (0.0%) | 53 (49.5%) |
| 75 Years and over | 10 (7.3%) | 21 (16.5%) |
Disability Class: Ambulatory Difficulty
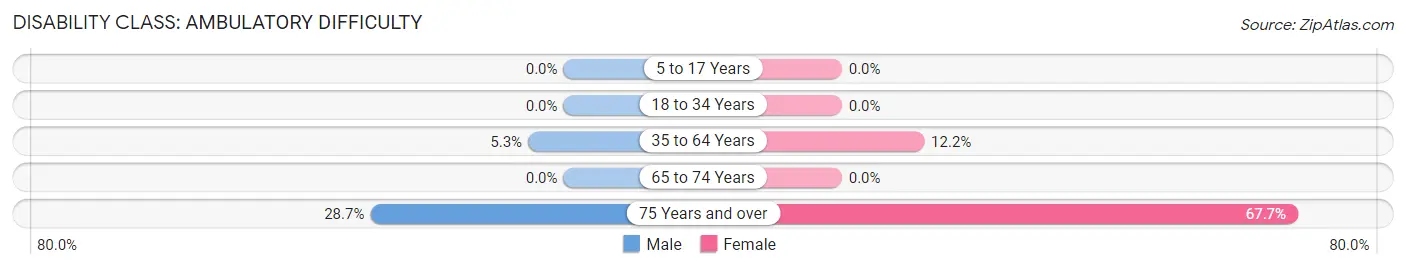
| Age Bracket | Male | Female |
| 5 to 17 Years | 0 (0.0%) | 0 (0.0%) |
| 18 to 34 Years | 0 (0.0%) | 0 (0.0%) |
| 35 to 64 Years | 17 (5.3%) | 40 (12.2%) |
| 65 to 74 Years | 0 (0.0%) | 0 (0.0%) |
| 75 Years and over | 39 (28.7%) | 86 (67.7%) |
Disability Class: Self-Care Difficulty
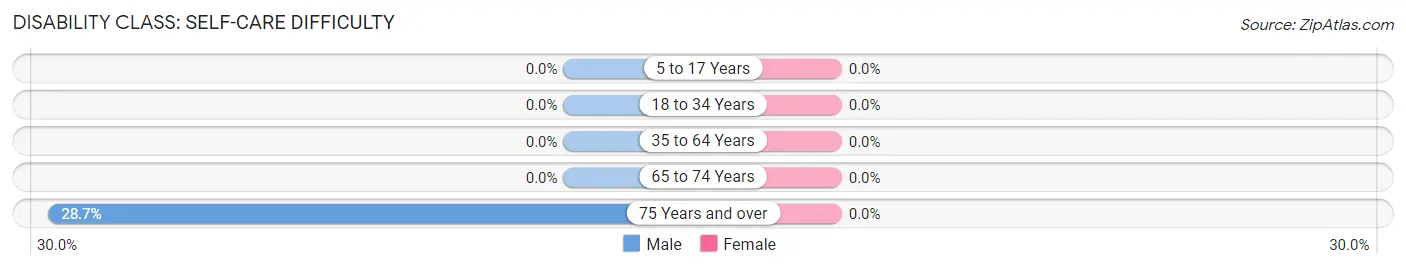
| Age Bracket | Male | Female |
| 5 to 17 Years | 0 (0.0%) | 0 (0.0%) |
| 18 to 34 Years | 0 (0.0%) | 0 (0.0%) |
| 35 to 64 Years | 0 (0.0%) | 0 (0.0%) |
| 65 to 74 Years | 0 (0.0%) | 0 (0.0%) |
| 75 Years and over | 39 (28.7%) | 0 (0.0%) |
Technology Access in Suarez
Computing Device Access in Suarez
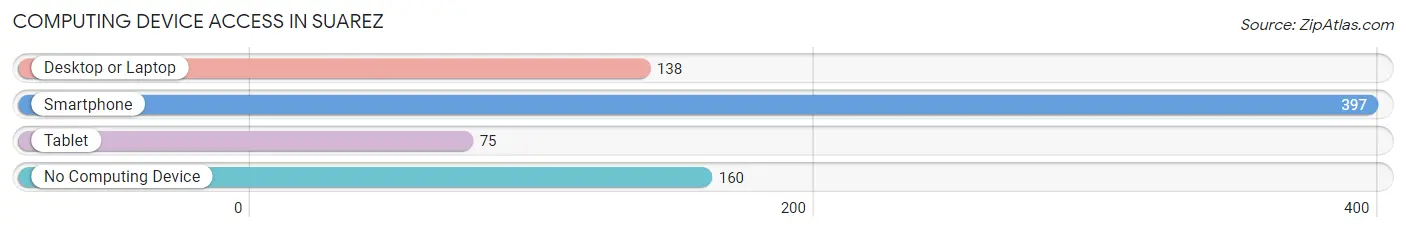
| Device Type | # Households | % Households |
| Desktop or Laptop | 138 | 23.5% |
| Smartphone | 397 | 67.5% |
| Tablet | 75 | 12.8% |
| No Computing Device | 160 | 27.2% |
| Total | 588 | 100.0% |
Internet Access in Suarez
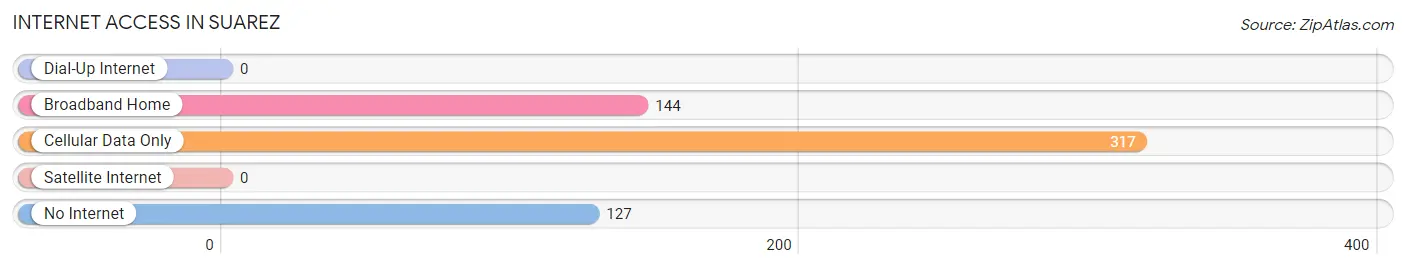
| Internet Type | # Households | % Households |
| Dial-Up Internet | 0 | 0.0% |
| Broadband Home | 144 | 24.5% |
| Cellular Data Only | 317 | 53.9% |
| Satellite Internet | 0 | 0.0% |
| No Internet | 127 | 21.6% |
| Total | 588 | 100.0% |
Suarez Summary
Puerto Rico is an unincorporated territory of the United States located in the Caribbean Sea. It is an archipelago consisting of the main island of Puerto Rico and several smaller islands. The main island is the smallest and most populated of the Greater Antilles. Puerto Rico is located east of the Dominican Republic and west of the Virgin Islands. It is a self-governing commonwealth of the United States, with its own constitution and government.
History
Puerto Rico has a long and rich history. It was inhabited by the Taíno people for centuries before the arrival of the Spanish in 1493. The Spanish colonized the island and named it San Juan Bautista. The Taíno people were enslaved and forced to work in the gold mines and on the plantations. The Spanish also brought African slaves to the island to work in the mines and on the plantations.
In 1898, after the Spanish-American War, Puerto Rico became a U.S. territory. In 1917, the Jones-Shafroth Act granted U.S. citizenship to all Puerto Ricans. In 1952, Puerto Rico became a self-governing commonwealth of the United States.
Geography
Puerto Rico is located in the Caribbean Sea, east of the Dominican Republic and west of the Virgin Islands. It is an archipelago consisting of the main island of Puerto Rico and several smaller islands. The main island is the smallest and most populated of the Greater Antilles. It is about 100 miles long and 35 miles wide. The terrain is mostly mountainous, with the highest point being Cerro de Punta at 4,390 feet. The climate is tropical, with temperatures ranging from 70 to 90 degrees Fahrenheit.
Economy
Puerto Rico has a mixed economy, with both private and public sectors. The main industries are tourism, pharmaceuticals, manufacturing, and agriculture. The main agricultural products are sugarcane, coffee, and bananas. The main exports are chemicals, electronics, and apparel. The main trading partners are the United States, the Dominican Republic, and the Netherlands.
Demographics
Puerto Rico has a population of 3.2 million people. The majority of the population is of mixed European and African descent. Spanish is the official language, although English is also widely spoken. The majority of the population is Roman Catholic.
Conclusion
Puerto Rico is an unincorporated territory of the United States located in the Caribbean Sea. It has a long and rich history, and is a self-governing commonwealth of the United States. It has a mixed economy, with both private and public sectors. The main industries are tourism, pharmaceuticals, manufacturing, and agriculture. The population is mostly of mixed European and African descent, and Spanish is the official language. Puerto Rico is an important part of the United States, and its history, geography, economy, and demographics are all important aspects of its identity.
Common Questions
What is Per Capita Income in Suarez?
Per Capita income in Suarez is $10,060.
What is the Median Family Income in Suarez?
Median Family Income in Suarez is $28,378.
What is the Median Household income in Suarez?
Median Household Income in Suarez is $19,625.
What is Income or Wage Gap in Suarez?
Income or Wage Gap in Suarez is 29.0%.
Women in Suarez earn 71.0 cents for every dollar earned by a man.
What is Inequality or Gini Index in Suarez?
Inequality or Gini Index in Suarez is 0.47.
What is the Total Population of Suarez?
Total Population of Suarez is 1,544.
What is the Total Male Population of Suarez?
Total Male Population of Suarez is 693.
What is the Total Female Population of Suarez?
Total Female Population of Suarez is 851.
What is the Ratio of Males per 100 Females in Suarez?
There are 81.43 Males per 100 Females in Suarez.
What is the Ratio of Females per 100 Males in Suarez?
There are 122.80 Females per 100 Males in Suarez.
What is the Median Population Age in Suarez?
Median Population Age in Suarez is 56.3 Years.
What is the Average Family Size in Suarez
Average Family Size in Suarez is 3.5 People.
What is the Average Household Size in Suarez
Average Household Size in Suarez is 2.6 People.
How Large is the Labor Force in Suarez?
There are 514 People in the Labor Forcein in Suarez.
What is the Percentage of People in the Labor Force in Suarez?
35.7% of People are in the Labor Force in Suarez.
What is the Unemployment Rate in Suarez?
Unemployment Rate in Suarez is 40.5%.