El Mango, PR Map & Demographics
El Mango Overview
$17,138
PER CAPITA INCOME
$42,750
AVG FAMILY INCOME
$26,394
AVG HOUSEHOLD INCOME
55.6%
WAGE / INCOME GAP [ % ]
44.4¢/ $1
WAGE / INCOME GAP [ $ ]
0.52
INEQUALITY / GINI INDEX
1,648
TOTAL POPULATION
1,019
MALE POPULATION
629
FEMALE POPULATION
162.00
MALES / 100 FEMALES
61.73
FEMALES / 100 MALES
44.6
MEDIAN AGE
3.8
AVG FAMILY SIZE
3.0
AVG HOUSEHOLD SIZE
840
LABOR FORCE [ PEOPLE ]
56.9%
PERCENT IN LABOR FORCE
31.8%
UNEMPLOYMENT RATE
Income in El Mango
Income Overview in El Mango
Per Capita Income in El Mango is $17,138, while median incomes of families and households are $42,750 and $26,394 respectively.
| Characteristic | Number | Measure |
| Per Capita Income | 1,648 | $17,138 |
| Median Family Income | 363 | $42,750 |
| Mean Family Income | 363 | $50,938 |
| Median Household Income | 533 | $26,394 |
| Mean Household Income | 533 | $41,306 |
| Income Deficit | 363 | $0 |
| Wage / Income Gap (%) | 1,648 | 55.64% |
| Wage / Income Gap ($) | 1,648 | 44.36¢ per $1 |
| Gini / Inequality Index | 1,648 | 0.52 |
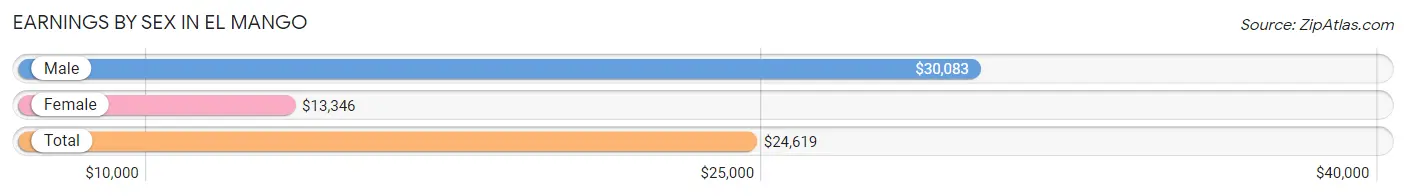
Earnings by Sex in El Mango
Average Earnings in El Mango are $24,619, $30,083 for men and $13,346 for women, a difference of 55.6%.
| Sex | Number | Average Earnings |
| Male | 507 (75.7%) | $30,083 |
| Female | 163 (24.3%) | $13,346 |
| Total | 670 (100.0%) | $24,619 |
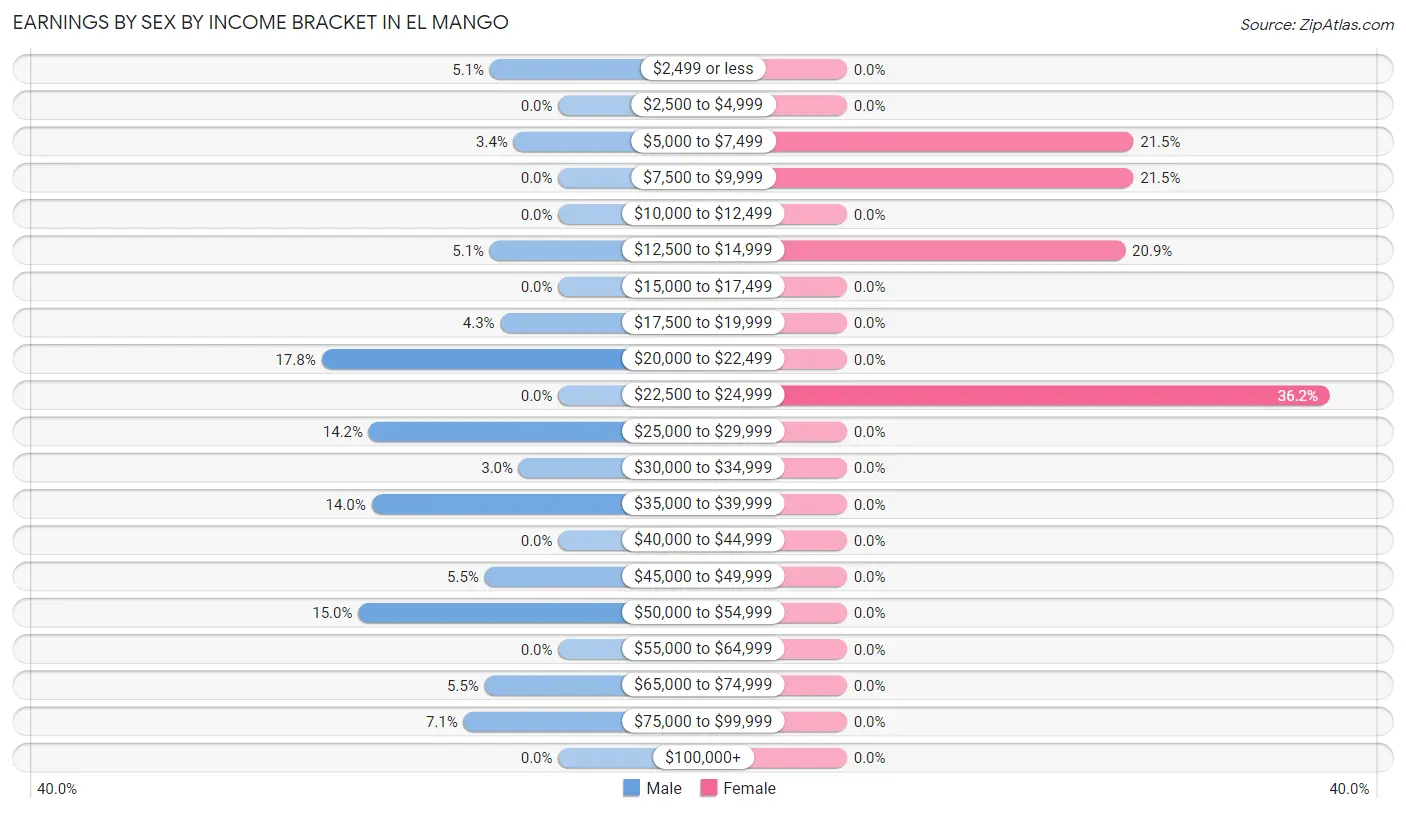
Earnings by Sex by Income Bracket in El Mango
The most common earnings brackets in El Mango are $20,000 to $22,499 for men (90 | 17.7%) and $22,500 to $24,999 for women (59 | 36.2%).
| Income | Male | Female |
| $2,499 or less | 26 (5.1%) | 0 (0.0%) |
| $2,500 to $4,999 | 0 (0.0%) | 0 (0.0%) |
| $5,000 to $7,499 | 17 (3.4%) | 35 (21.5%) |
| $7,500 to $9,999 | 0 (0.0%) | 35 (21.5%) |
| $10,000 to $12,499 | 0 (0.0%) | 0 (0.0%) |
| $12,500 to $14,999 | 26 (5.1%) | 34 (20.9%) |
| $15,000 to $17,499 | 0 (0.0%) | 0 (0.0%) |
| $17,500 to $19,999 | 22 (4.3%) | 0 (0.0%) |
| $20,000 to $22,499 | 90 (17.7%) | 0 (0.0%) |
| $22,500 to $24,999 | 0 (0.0%) | 59 (36.2%) |
| $25,000 to $29,999 | 72 (14.2%) | 0 (0.0%) |
| $30,000 to $34,999 | 15 (3.0%) | 0 (0.0%) |
| $35,000 to $39,999 | 71 (14.0%) | 0 (0.0%) |
| $40,000 to $44,999 | 0 (0.0%) | 0 (0.0%) |
| $45,000 to $49,999 | 28 (5.5%) | 0 (0.0%) |
| $50,000 to $54,999 | 76 (15.0%) | 0 (0.0%) |
| $55,000 to $64,999 | 0 (0.0%) | 0 (0.0%) |
| $65,000 to $74,999 | 28 (5.5%) | 0 (0.0%) |
| $75,000 to $99,999 | 36 (7.1%) | 0 (0.0%) |
| $100,000+ | 0 (0.0%) | 0 (0.0%) |
| Total | 507 (100.0%) | 163 (100.0%) |
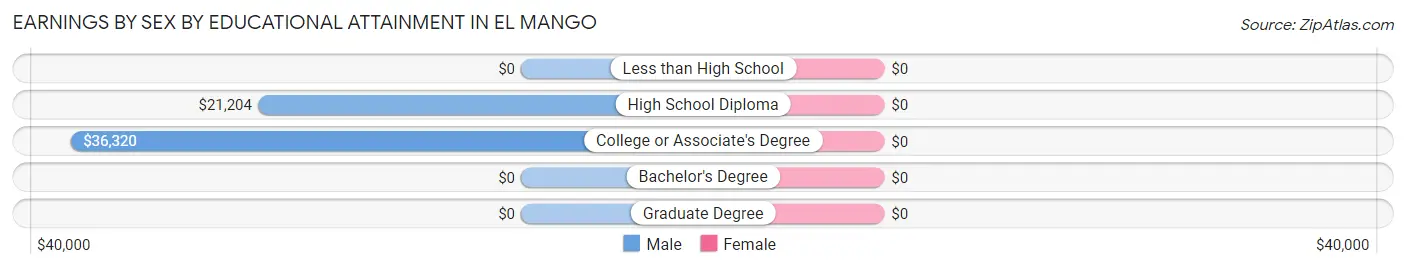
Earnings by Sex by Educational Attainment in El Mango
| Educational Attainment | Male Income | Female Income |
| Less than High School | - | - |
| High School Diploma | $21,204 | $0 |
| College or Associate's Degree | $36,320 | $0 |
| Bachelor's Degree | - | - |
| Graduate Degree | - | - |
| Total | $31,500 | $0 |
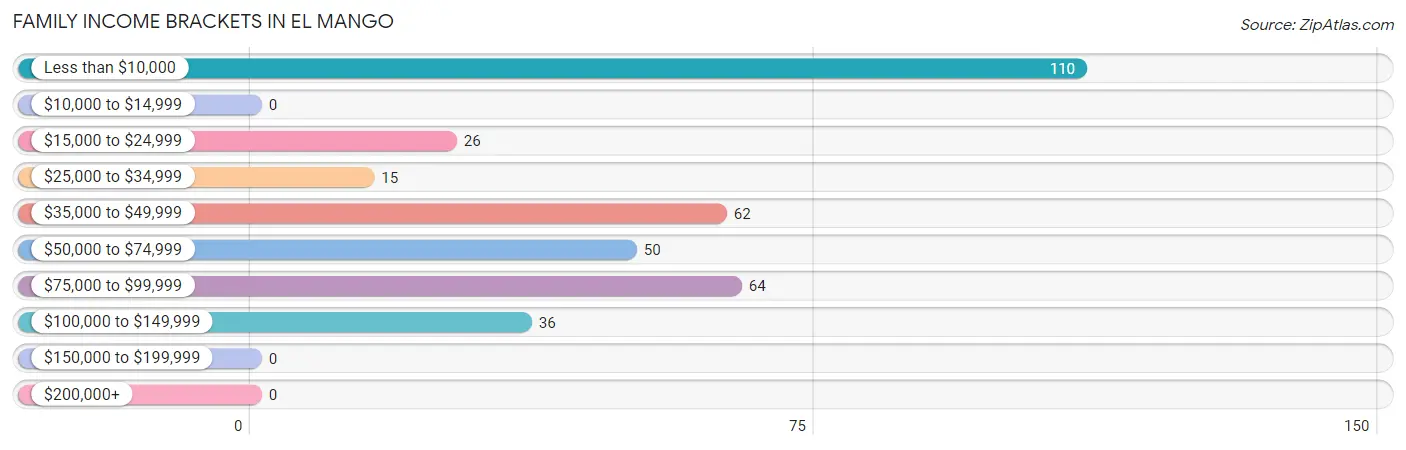
Family Income in El Mango
Family Income Brackets in El Mango
According to the El Mango family income data, there are 110 families falling into the less than $10,000 income range, which is the most common income bracket and makes up 30.3% of all families.
| Income Bracket | # Families | % Families |
| Less than $10,000 | 110 | 30.3% |
| $10,000 to $14,999 | 0 | 0.0% |
| $15,000 to $24,999 | 26 | 7.2% |
| $25,000 to $34,999 | 15 | 4.1% |
| $35,000 to $49,999 | 62 | 17.1% |
| $50,000 to $74,999 | 50 | 13.8% |
| $75,000 to $99,999 | 64 | 17.6% |
| $100,000 to $149,999 | 36 | 9.9% |
| $150,000 to $199,999 | 0 | 0.0% |
| $200,000+ | 0 | 0.0% |
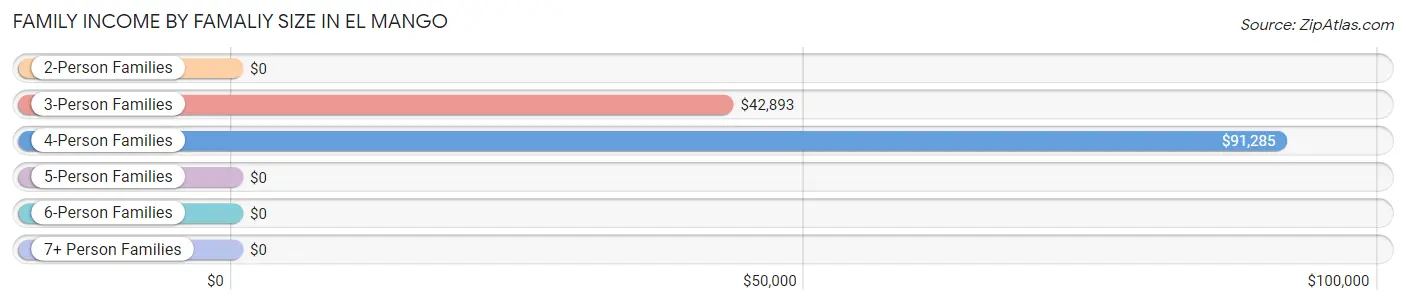
Family Income by Famaliy Size in El Mango
4-person families (91 | 25.1%) account for the highest median family income in El Mango with $91,285 per family, while 4-person families (91 | 25.1%) have the highest median income of $22,821 per family member.
| Income Bracket | # Families | Median Income |
| 2-Person Families | 109 (30.0%) | $0 |
| 3-Person Families | 163 (44.9%) | $42,893 |
| 4-Person Families | 91 (25.1%) | $91,285 |
| 5-Person Families | 0 (0.0%) | $0 |
| 6-Person Families | 0 (0.0%) | $0 |
| 7+ Person Families | 0 (0.0%) | $0 |
| Total | 363 (100.0%) | $42,750 |
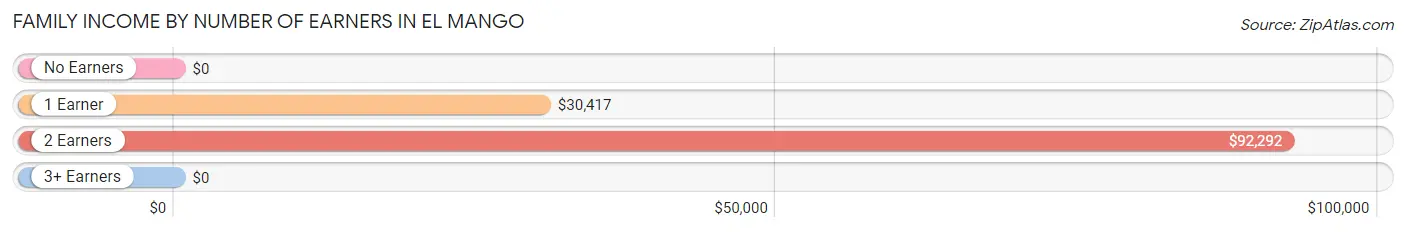
Family Income by Number of Earners in El Mango
| Number of Earners | # Families | Median Income |
| No Earners | 75 (20.7%) | $0 |
| 1 Earner | 127 (35.0%) | $30,417 |
| 2 Earners | 134 (36.9%) | $92,292 |
| 3+ Earners | 27 (7.4%) | $0 |
| Total | 363 (100.0%) | $42,750 |
Household Income in El Mango
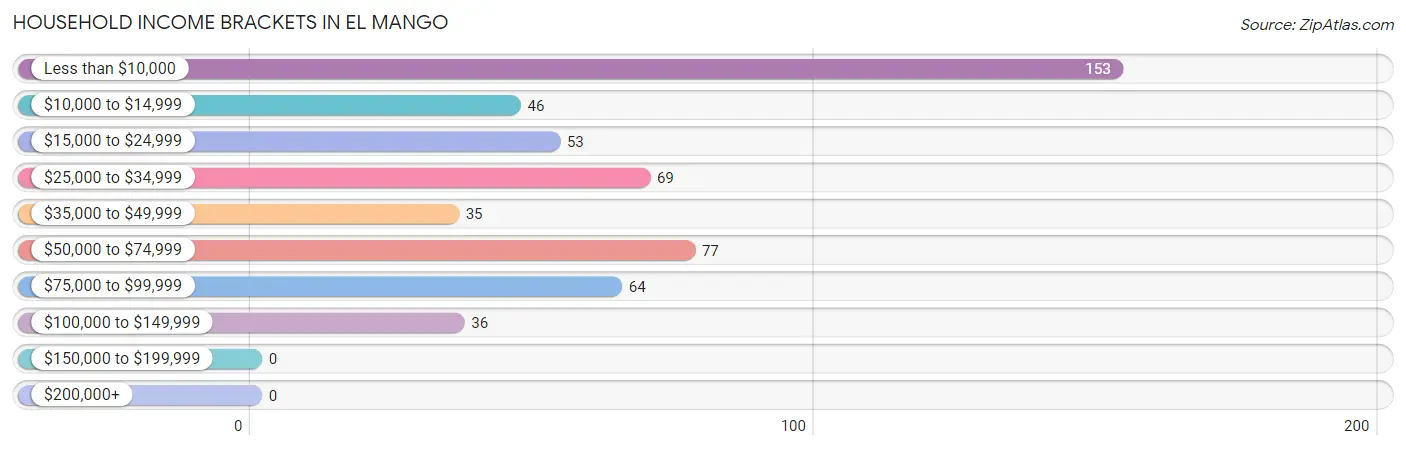
Household Income Brackets in El Mango
With 153 households falling in the category, the less than $10,000 income range is the most frequent in El Mango, accounting for 28.7% of all households.
| Income Bracket | # Households | % Households |
| Less than $10,000 | 153 | 28.7% |
| $10,000 to $14,999 | 46 | 8.6% |
| $15,000 to $24,999 | 53 | 9.9% |
| $25,000 to $34,999 | 69 | 12.9% |
| $35,000 to $49,999 | 35 | 6.6% |
| $50,000 to $74,999 | 77 | 14.4% |
| $75,000 to $99,999 | 64 | 12.0% |
| $100,000 to $149,999 | 36 | 6.8% |
| $150,000 to $199,999 | 0 | 0.0% |
| $200,000+ | 0 | 0.0% |
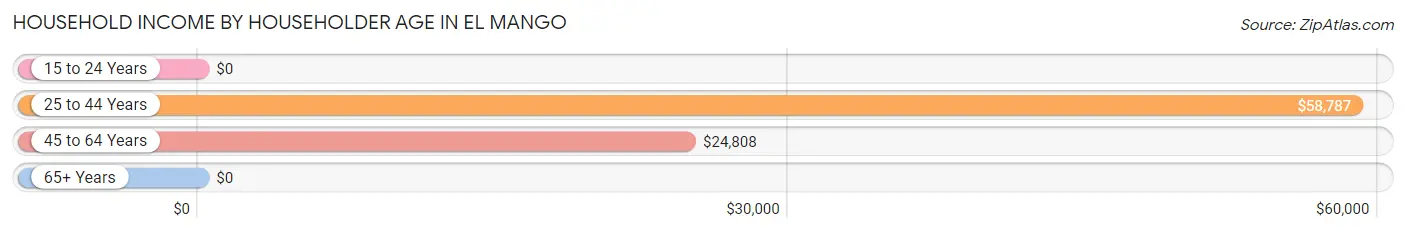
Household Income by Householder Age in El Mango
The median household income in El Mango is $26,394, with the highest median household income of $58,787 found in the 25 to 44 years age bracket for the primary householder. A total of 89 households (16.7%) fall into this category.
| Income Bracket | # Households | Median Income |
| 15 to 24 Years | 0 (0.0%) | $0 |
| 25 to 44 Years | 89 (16.7%) | $58,787 |
| 45 to 64 Years | 214 (40.2%) | $24,808 |
| 65+ Years | 230 (43.1%) | $0 |
| Total | 533 (100.0%) | $26,394 |
Poverty in El Mango
Income Below Poverty by Sex and Age in El Mango
With 30.8% poverty level for males and 23.1% for females among the residents of El Mango, 6 to 11 year old males and 25 to 34 year old females are the most vulnerable to poverty, with 43 males (100.0%) and 9 females (100.0%) in their respective age groups living below the poverty level.
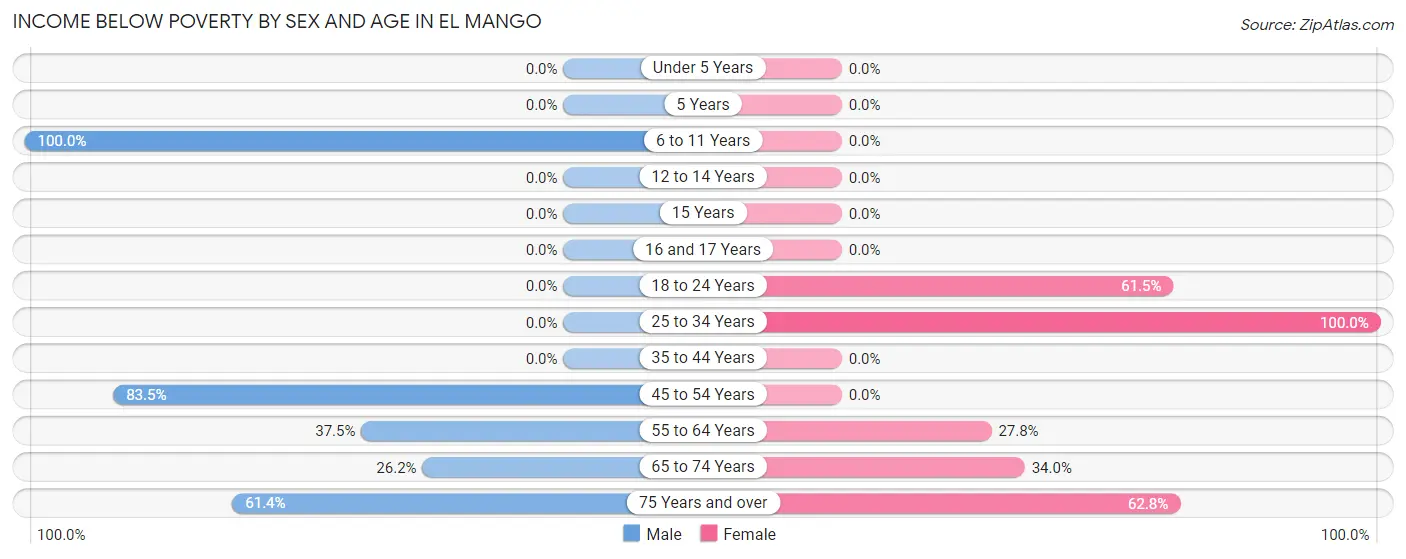
| Age Bracket | Male | Female |
| Under 5 Years | 0 (0.0%) | 0 (0.0%) |
| 5 Years | 0 (0.0%) | 0 (0.0%) |
| 6 to 11 Years | 43 (100.0%) | 0 (0.0%) |
| 12 to 14 Years | 0 (0.0%) | 0 (0.0%) |
| 15 Years | 0 (0.0%) | 0 (0.0%) |
| 16 and 17 Years | 0 (0.0%) | 0 (0.0%) |
| 18 to 24 Years | 0 (0.0%) | 56 (61.5%) |
| 25 to 34 Years | 0 (0.0%) | 9 (100.0%) |
| 35 to 44 Years | 0 (0.0%) | 0 (0.0%) |
| 45 to 54 Years | 132 (83.5%) | 0 (0.0%) |
| 55 to 64 Years | 51 (37.5%) | 35 (27.8%) |
| 65 to 74 Years | 45 (26.2%) | 18 (34.0%) |
| 75 Years and over | 43 (61.4%) | 27 (62.8%) |
| Total | 314 (30.8%) | 145 (23.1%) |
Income Above Poverty by Sex and Age in El Mango
According to the poverty statistics in El Mango, males aged 18 to 24 years and females aged 6 to 11 years are the age groups that are most secure financially, with 100.0% of males and 100.0% of females in these age groups living above the poverty line.
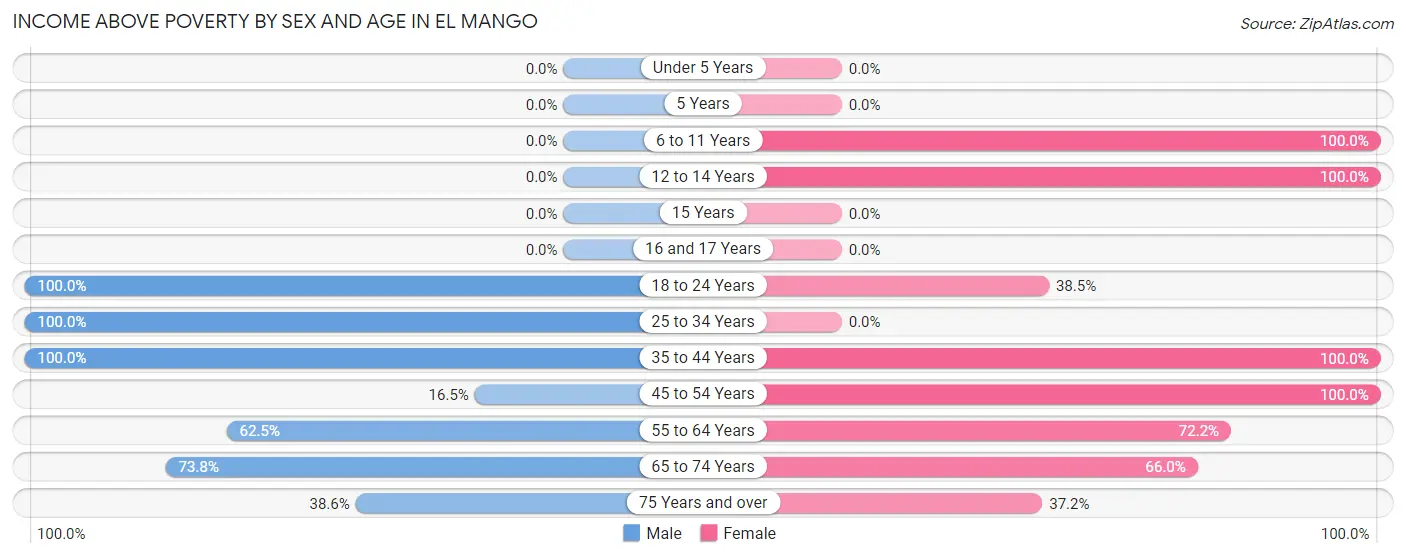
| Age Bracket | Male | Female |
| Under 5 Years | 0 (0.0%) | 0 (0.0%) |
| 5 Years | 0 (0.0%) | 0 (0.0%) |
| 6 to 11 Years | 0 (0.0%) | 37 (100.0%) |
| 12 to 14 Years | 0 (0.0%) | 91 (100.0%) |
| 15 Years | 0 (0.0%) | 0 (0.0%) |
| 16 and 17 Years | 0 (0.0%) | 0 (0.0%) |
| 18 to 24 Years | 17 (100.0%) | 35 (38.5%) |
| 25 to 34 Years | 202 (100.0%) | 0 (0.0%) |
| 35 to 44 Years | 221 (100.0%) | 123 (100.0%) |
| 45 to 54 Years | 26 (16.5%) | 56 (100.0%) |
| 55 to 64 Years | 85 (62.5%) | 91 (72.2%) |
| 65 to 74 Years | 127 (73.8%) | 35 (66.0%) |
| 75 Years and over | 27 (38.6%) | 16 (37.2%) |
| Total | 705 (69.2%) | 484 (76.9%) |
Income Below Poverty Among Married-Couple Families in El Mango
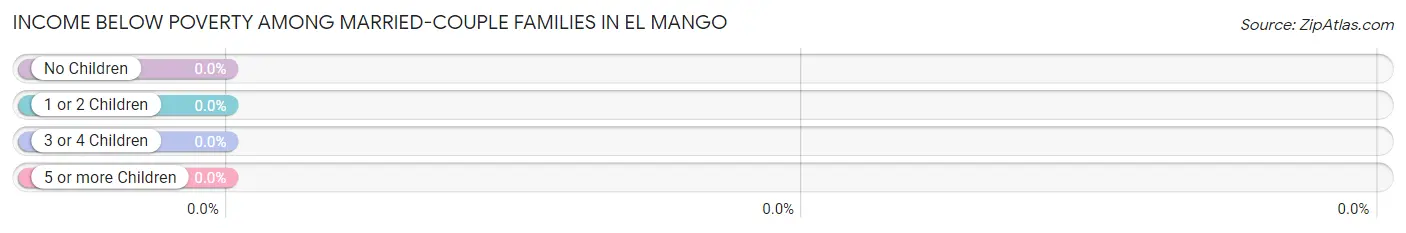
| Children | Above Poverty | Below Poverty |
| No Children | 167 (100.0%) | 0 (0.0%) |
| 1 or 2 Children | 43 (100.0%) | 0 (0.0%) |
| 3 or 4 Children | 0 (0.0%) | 0 (0.0%) |
| 5 or more Children | 0 (0.0%) | 0 (0.0%) |
| Total | 210 (100.0%) | 0 (0.0%) |
Income Below Poverty Among Single-Parent Households in El Mango
According to the poverty data in El Mango, 100.0% or 48 single-father households and 59.1% or 62 single-mother households are living below the poverty line. Among single-father households, those with no children have the highest poverty rate, with 48 households (100.0%) experiencing poverty. Likewise, among single-mother households, those with no children have the highest poverty rate, with 27 households (62.8%) falling below the poverty line.
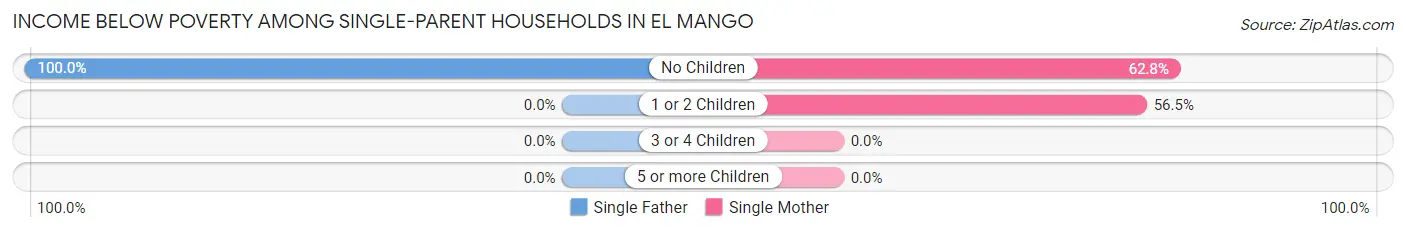
| Children | Single Father | Single Mother |
| No Children | 48 (100.0%) | 27 (62.8%) |
| 1 or 2 Children | 0 (0.0%) | 35 (56.5%) |
| 3 or 4 Children | 0 (0.0%) | 0 (0.0%) |
| 5 or more Children | 0 (0.0%) | 0 (0.0%) |
| Total | 48 (100.0%) | 62 (59.1%) |
Income Below Poverty Among Married-Couple vs Single-Parent Households in El Mango
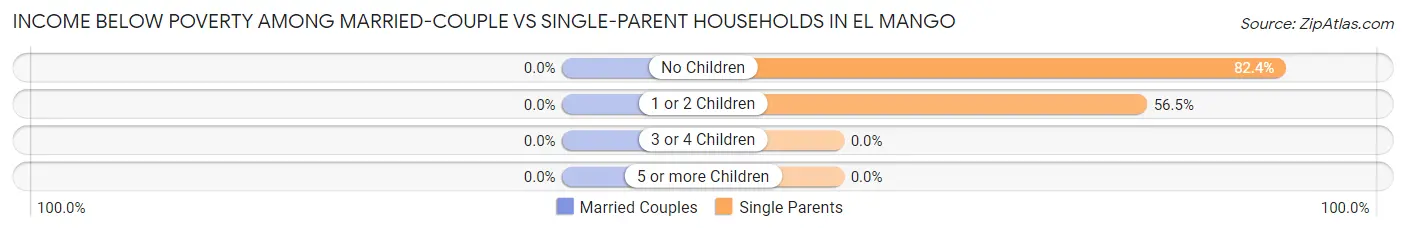
| Children | Married-Couple Families | Single-Parent Households |
| No Children | 0 (0.0%) | 75 (82.4%) |
| 1 or 2 Children | 0 (0.0%) | 35 (56.5%) |
| 3 or 4 Children | 0 (0.0%) | 0 (0.0%) |
| 5 or more Children | 0 (0.0%) | 0 (0.0%) |
| Total | 0 (0.0%) | 110 (71.9%) |
Race in El Mango
The most populous races in El Mango are Hispanic or Latino (1,648 | 100.0%), White / Caucasian (878 | 53.3%), and Some other Race (414 | 25.1%).
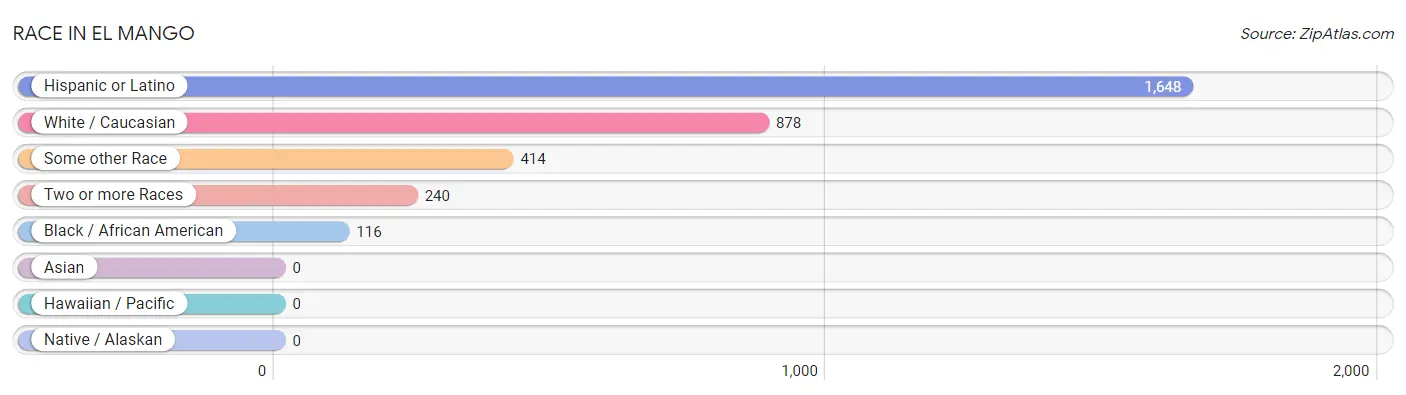
| Race | # Population | % Population |
| Asian | 0 | 0.0% |
| Black / African American | 116 | 7.0% |
| Hawaiian / Pacific | 0 | 0.0% |
| Hispanic or Latino | 1,648 | 100.0% |
| Native / Alaskan | 0 | 0.0% |
| White / Caucasian | 878 | 53.3% |
| Two or more Races | 240 | 14.6% |
| Some other Race | 414 | 25.1% |
| Total | 1,648 | 100.0% |
Ancestry in El Mango
The most populous ancestries reported in El Mango are , and Puerto Rican (1,648 | 100.0%), together accounting for 100.0% of all El Mango residents.

| Ancestry | # Population | % Population |
| Puerto Rican | 1,648 | 100.0% | View All 1 Rows |
Immigrants in El Mango

| Immigration Origin | # Population | % Population | View All 0 Rows |
Sex and Age in El Mango
Sex and Age in El Mango
The most populous age groups in El Mango are 45 to 49 Years (158 | 15.5%) for men and 10 to 14 Years (128 | 20.3%) for women.
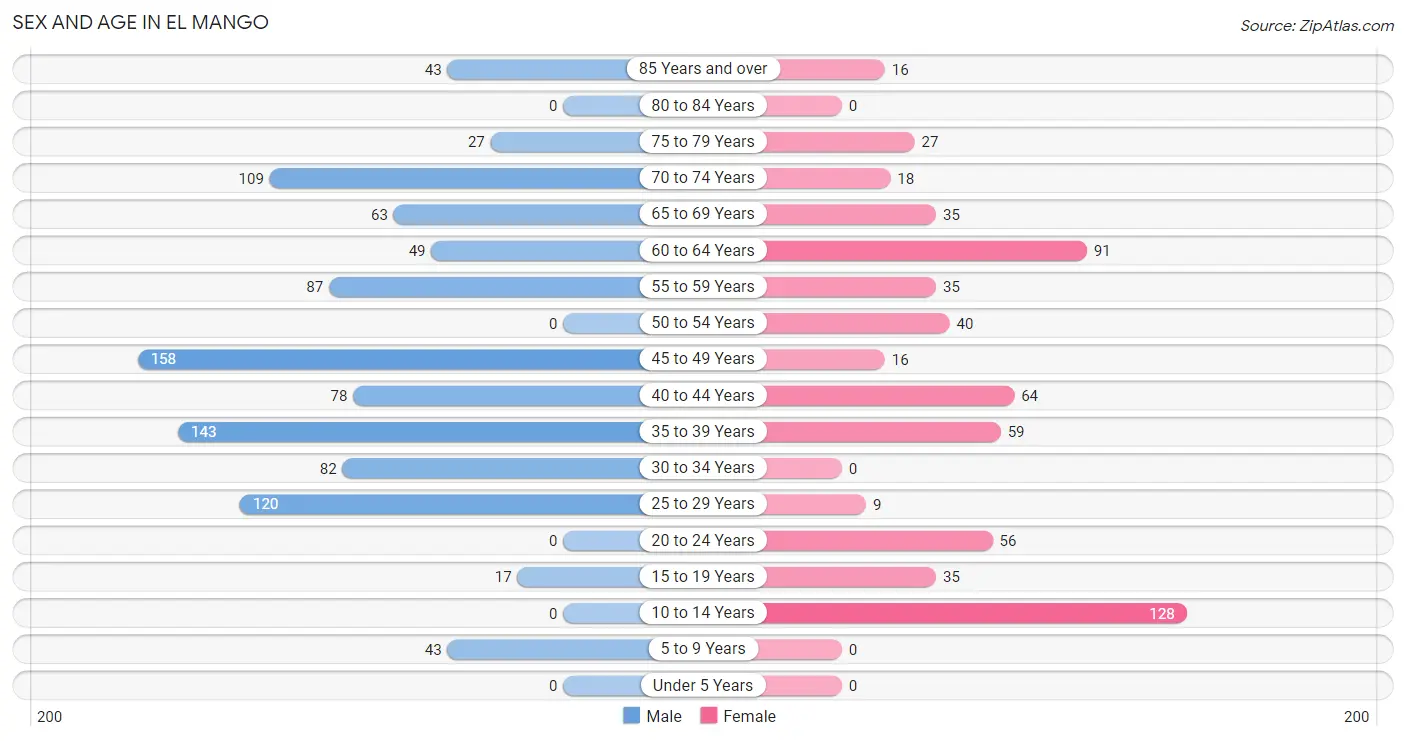
| Age Bracket | Male | Female |
| Under 5 Years | 0 (0.0%) | 0 (0.0%) |
| 5 to 9 Years | 43 (4.2%) | 0 (0.0%) |
| 10 to 14 Years | 0 (0.0%) | 128 (20.3%) |
| 15 to 19 Years | 17 (1.7%) | 35 (5.6%) |
| 20 to 24 Years | 0 (0.0%) | 56 (8.9%) |
| 25 to 29 Years | 120 (11.8%) | 9 (1.4%) |
| 30 to 34 Years | 82 (8.1%) | 0 (0.0%) |
| 35 to 39 Years | 143 (14.0%) | 59 (9.4%) |
| 40 to 44 Years | 78 (7.6%) | 64 (10.2%) |
| 45 to 49 Years | 158 (15.5%) | 16 (2.5%) |
| 50 to 54 Years | 0 (0.0%) | 40 (6.4%) |
| 55 to 59 Years | 87 (8.5%) | 35 (5.6%) |
| 60 to 64 Years | 49 (4.8%) | 91 (14.5%) |
| 65 to 69 Years | 63 (6.2%) | 35 (5.6%) |
| 70 to 74 Years | 109 (10.7%) | 18 (2.9%) |
| 75 to 79 Years | 27 (2.6%) | 27 (4.3%) |
| 80 to 84 Years | 0 (0.0%) | 0 (0.0%) |
| 85 Years and over | 43 (4.2%) | 16 (2.5%) |
| Total | 1,019 (100.0%) | 629 (100.0%) |
Families and Households in El Mango
Median Family Size in El Mango
The median family size in El Mango is 3.82 persons per family, with married-couple families (210 | 57.9%) accounting for the largest median family size of 4.14 persons per family. On the other hand, single male/father families (48 | 13.2%) represent the smallest median family size with 2.75 persons per family.
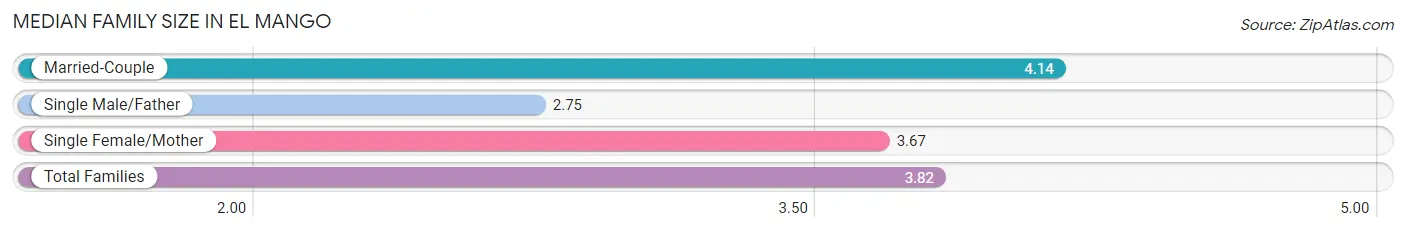
| Family Type | # Families | Family Size |
| Married-Couple | 210 (57.9%) | 4.14 |
| Single Male/Father | 48 (13.2%) | 2.75 |
| Single Female/Mother | 105 (28.9%) | 3.67 |
| Total Families | 363 (100.0%) | 3.82 |
Median Household Size in El Mango
The median household size in El Mango is 3.05 persons per household, with married-couple households (210 | 39.4%) accounting for the largest median household size of 4.14 persons per household. non-family households (170 | 31.9%) represent the smallest median household size with 1.26 persons per household.
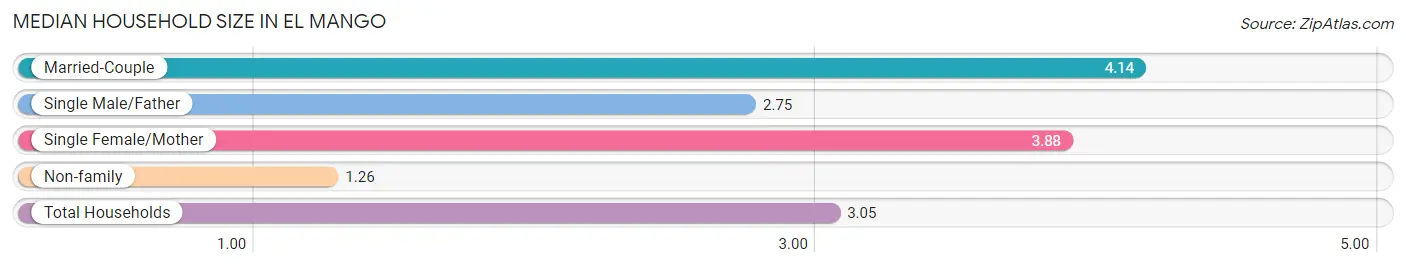
| Household Type | # Households | Household Size |
| Married-Couple | 210 (39.4%) | 4.14 |
| Single Male/Father | 48 (9.0%) | 2.75 |
| Single Female/Mother | 105 (19.7%) | 3.88 |
| Non-family | 170 (31.9%) | 1.26 |
| Total Households | 533 (100.0%) | 3.05 |
Household Size by Marriage Status in El Mango
Out of a total of 533 households in El Mango, 363 (68.1%) are family households, while 170 (31.9%) are nonfamily households. The most numerous type of family households are 3-person households, comprising 163, and the most common type of nonfamily households are 1-person households, comprising 144.
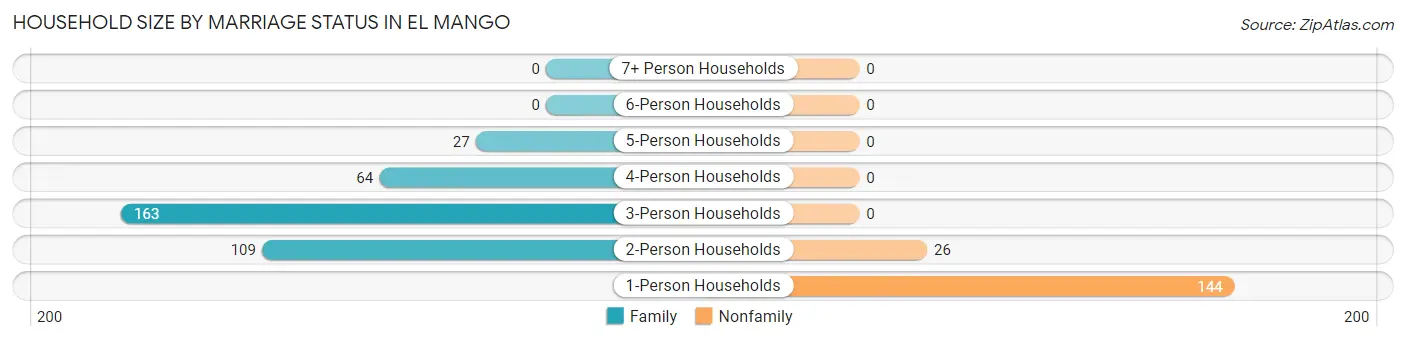
| Household Size | Family Households | Nonfamily Households |
| 1-Person Households | - | 144 (27.0%) |
| 2-Person Households | 109 (20.4%) | 26 (4.9%) |
| 3-Person Households | 163 (30.6%) | 0 (0.0%) |
| 4-Person Households | 64 (12.0%) | 0 (0.0%) |
| 5-Person Households | 27 (5.1%) | 0 (0.0%) |
| 6-Person Households | 0 (0.0%) | 0 (0.0%) |
| 7+ Person Households | 0 (0.0%) | 0 (0.0%) |
| Total | 363 (68.1%) | 170 (31.9%) |
Female Fertility in El Mango
Fertility by Age in El Mango
Average fertility rate in El Mango is 234.0 births per 1,000 women. Women in the age bracket of 20 to 34 years have the highest fertility rate with 862.0 births per 1,000 women. Women in the age bracket of 20 to 34 years acount for 100.0% of all women with births.
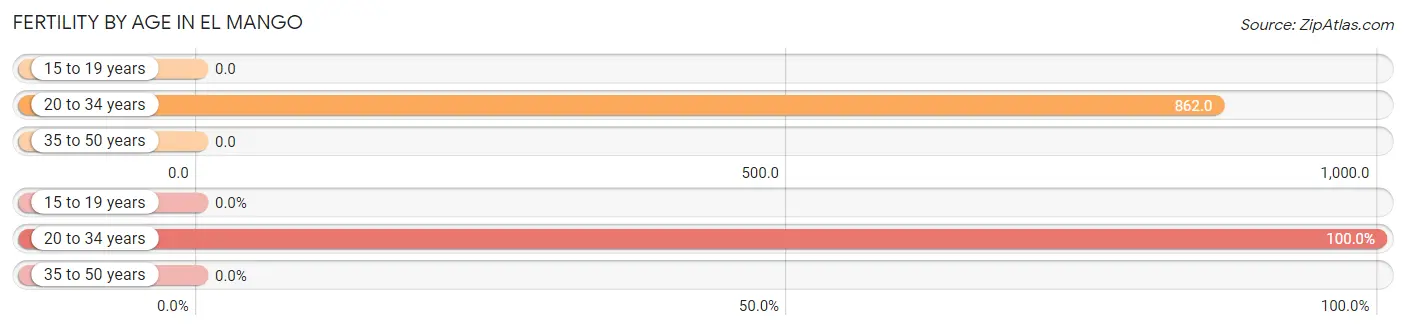
| Age Bracket | Women with Births | Births / 1,000 Women |
| 15 to 19 years | 0 (0.0%) | 0.0 |
| 20 to 34 years | 56 (100.0%) | 862.0 |
| 35 to 50 years | 0 (0.0%) | 0.0 |
| Total | 56 (100.0%) | 234.0 |
Fertility by Age by Marriage Status in El Mango
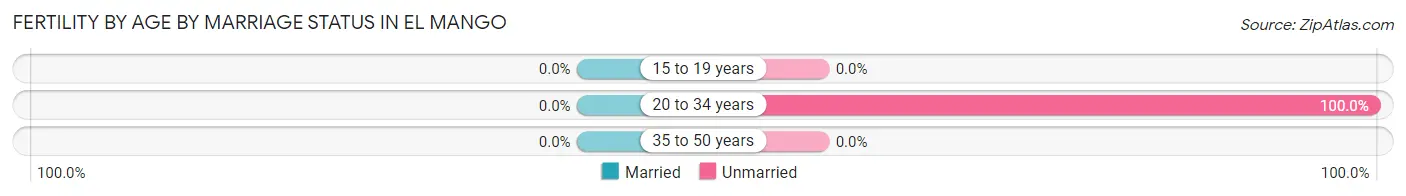
| Age Bracket | Married | Unmarried |
| 15 to 19 years | 0 (0.0%) | 0 (0.0%) |
| 20 to 34 years | 0 (0.0%) | 56 (100.0%) |
| 35 to 50 years | 0 (0.0%) | 0 (0.0%) |
| Total | 0 (0.0%) | 56 (100.0%) |
Fertility by Education in El Mango
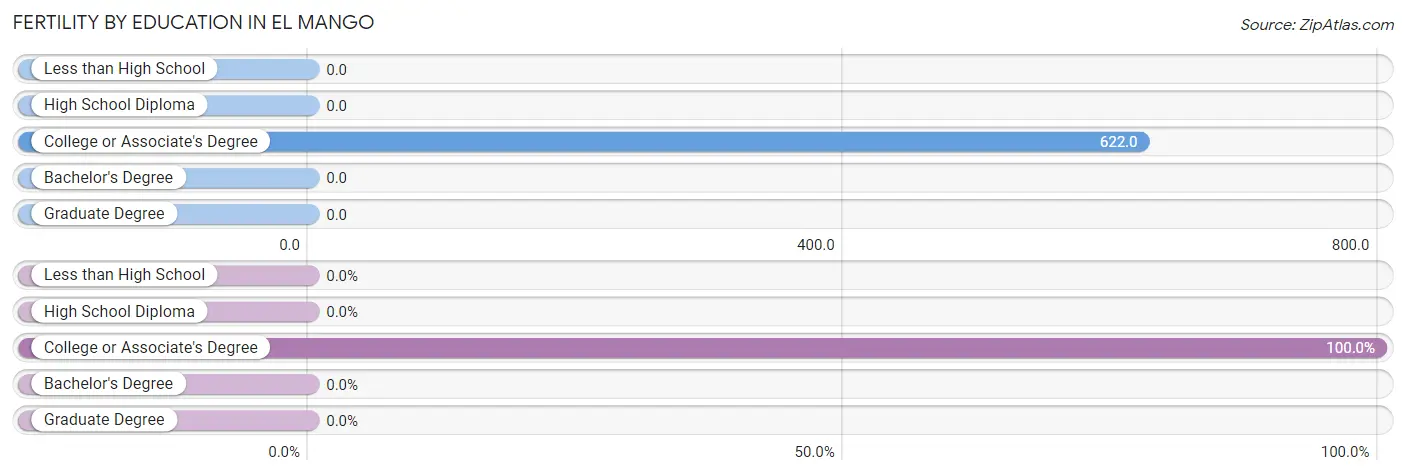
| Educational Attainment | Women with Births | Births / 1,000 Women |
| Less than High School | 0 (0.0%) | 0.0 |
| High School Diploma | 0 (0.0%) | 0.0 |
| College or Associate's Degree | 56 (100.0%) | 622.0 |
| Bachelor's Degree | 0 (0.0%) | 0.0 |
| Graduate Degree | 0 (0.0%) | 0.0 |
| Total | 56 (100.0%) | 234.0 |
Fertility by Education by Marriage Status in El Mango
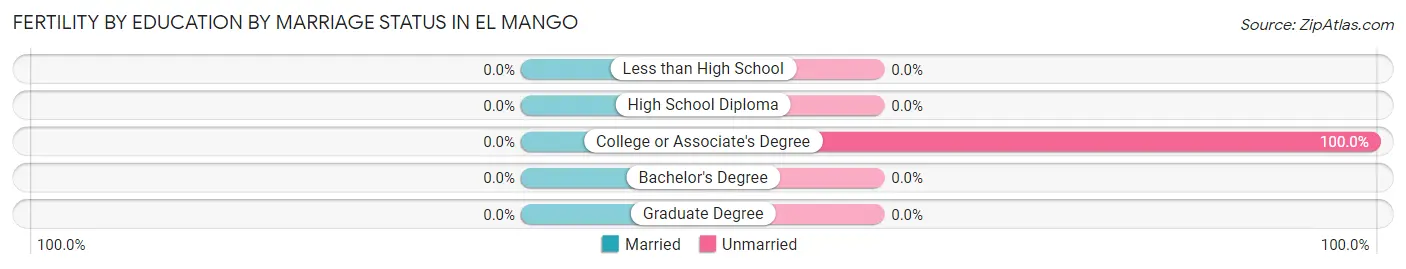
| Educational Attainment | Married | Unmarried |
| Less than High School | 0 (0.0%) | 0 (0.0%) |
| High School Diploma | 0 (0.0%) | 0 (0.0%) |
| College or Associate's Degree | 0 (0.0%) | 56 (100.0%) |
| Bachelor's Degree | 0 (0.0%) | 0 (0.0%) |
| Graduate Degree | 0 (0.0%) | 0 (0.0%) |
| Total | 0 (0.0%) | 56 (100.0%) |
Employment Characteristics in El Mango
Employment by Class of Employer in El Mango
Among the 573 employed individuals in El Mango, private company employees (401 | 70.0%), local government employees (117 | 20.4%), and state government employees (32 | 5.6%) make up the most common classes of employment.
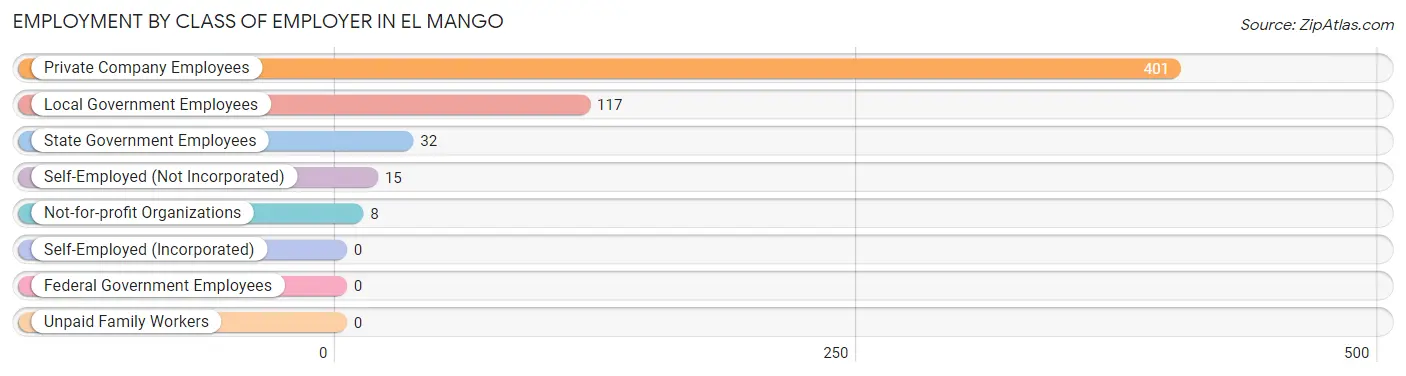
| Employer Class | # Employees | % Employees |
| Private Company Employees | 401 | 70.0% |
| Self-Employed (Incorporated) | 0 | 0.0% |
| Self-Employed (Not Incorporated) | 15 | 2.6% |
| Not-for-profit Organizations | 8 | 1.4% |
| Local Government Employees | 117 | 20.4% |
| State Government Employees | 32 | 5.6% |
| Federal Government Employees | 0 | 0.0% |
| Unpaid Family Workers | 0 | 0.0% |
| Total | 573 | 100.0% |
Employment Status by Age in El Mango
According to the labor force statistics for El Mango, out of the total population over 16 years of age (1,477), 56.9% or 840 individuals are in the labor force, with 31.8% or 267 of them unemployed. The age group with the highest labor force participation rate is 16 to 19 years, with 100.0% or 52 individuals in the labor force. Within the labor force, the 20 to 24 years age range has the highest percentage of unemployed individuals, with 100.0% or 56 of them being unemployed.
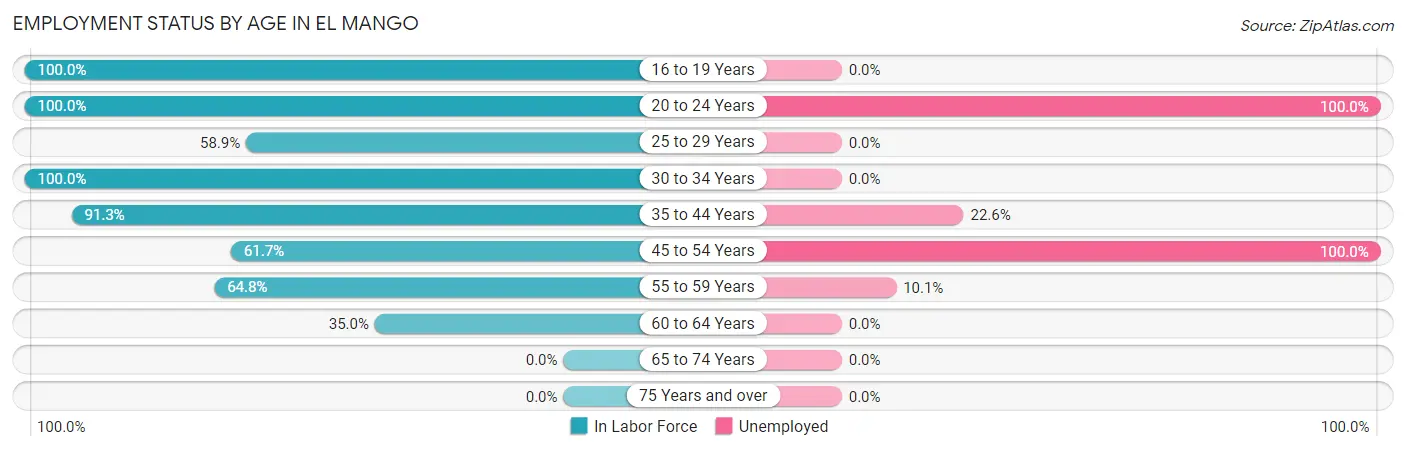
| Age Bracket | In Labor Force | Unemployed |
| 16 to 19 Years | 52 (100.0%) | 0 (0.0%) |
| 20 to 24 Years | 56 (100.0%) | 56 (100.0%) |
| 25 to 29 Years | 76 (58.9%) | 0 (0.0%) |
| 30 to 34 Years | 82 (100.0%) | 0 (0.0%) |
| 35 to 44 Years | 314 (91.3%) | 71 (22.6%) |
| 45 to 54 Years | 132 (61.7%) | 132 (100.0%) |
| 55 to 59 Years | 79 (64.8%) | 8 (10.1%) |
| 60 to 64 Years | 49 (35.0%) | 0 (0.0%) |
| 65 to 74 Years | 0 (0.0%) | 0 (0.0%) |
| 75 Years and over | 0 (0.0%) | 0 (0.0%) |
| Total | 840 (56.9%) | 267 (31.8%) |
Employment Status by Educational Attainment in El Mango
According to labor force statistics for El Mango, 71.0% of individuals (732) out of the total population between 25 and 64 years of age (1,031) are in the labor force, with 28.8% or 211 of them being unemployed. The group with the highest labor force participation rate are those with the educational attainment of college / associate degree, with 87.2% or 253 individuals in the labor force. Within the labor force, individuals with less than high school education have the highest percentage of unemployment, with 100.0% or 140 of them being unemployed.
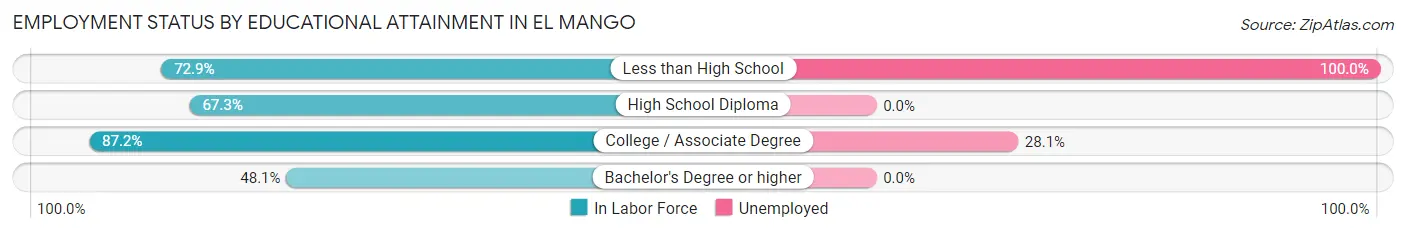
| Educational Attainment | In Labor Force | Unemployed |
| Less than High School | 140 (72.9%) | 192 (100.0%) |
| High School Diploma | 263 (67.3%) | 0 (0.0%) |
| College / Associate Degree | 253 (87.2%) | 81 (28.1%) |
| Bachelor's Degree or higher | 76 (48.1%) | 0 (0.0%) |
| Total | 732 (71.0%) | 297 (28.8%) |
Employment Occupations by Sex in El Mango
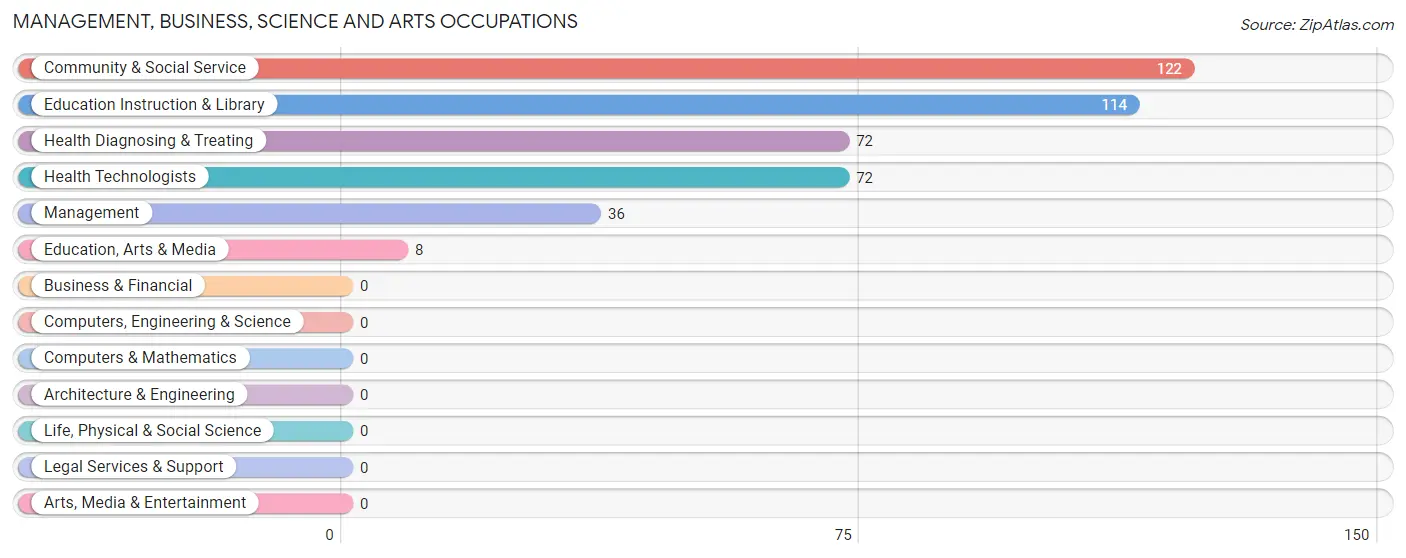
Management, Business, Science and Arts Occupations
The most common Management, Business, Science and Arts occupations in El Mango are Community & Social Service (122 | 21.3%), Education Instruction & Library (114 | 19.9%), Health Diagnosing & Treating (72 | 12.6%), Health Technologists (72 | 12.6%), and Management (36 | 6.3%).
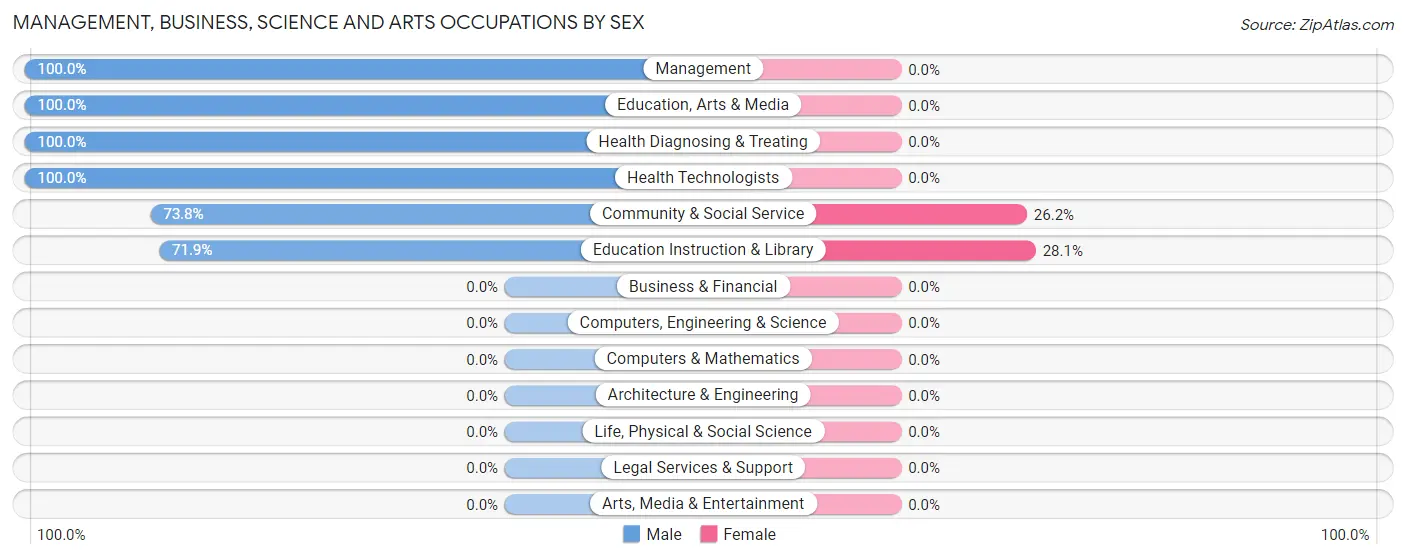
Management, Business, Science and Arts Occupations by Sex
Within the Management, Business, Science and Arts occupations in El Mango, the most male-oriented occupations are Management (100.0%), Education, Arts & Media (100.0%), and Health Diagnosing & Treating (100.0%), while the most female-oriented occupations are Education Instruction & Library (28.1%), and Community & Social Service (26.2%).
| Occupation | Male | Female |
| Management | 36 (100.0%) | 0 (0.0%) |
| Business & Financial | 0 (0.0%) | 0 (0.0%) |
| Computers, Engineering & Science | 0 (0.0%) | 0 (0.0%) |
| Computers & Mathematics | 0 (0.0%) | 0 (0.0%) |
| Architecture & Engineering | 0 (0.0%) | 0 (0.0%) |
| Life, Physical & Social Science | 0 (0.0%) | 0 (0.0%) |
| Community & Social Service | 90 (73.8%) | 32 (26.2%) |
| Education, Arts & Media | 8 (100.0%) | 0 (0.0%) |
| Legal Services & Support | 0 (0.0%) | 0 (0.0%) |
| Education Instruction & Library | 82 (71.9%) | 32 (28.1%) |
| Arts, Media & Entertainment | 0 (0.0%) | 0 (0.0%) |
| Health Diagnosing & Treating | 72 (100.0%) | 0 (0.0%) |
| Health Technologists | 72 (100.0%) | 0 (0.0%) |
| Total (Category) | 198 (86.1%) | 32 (13.9%) |
| Total (Overall) | 410 (71.6%) | 163 (28.4%) |
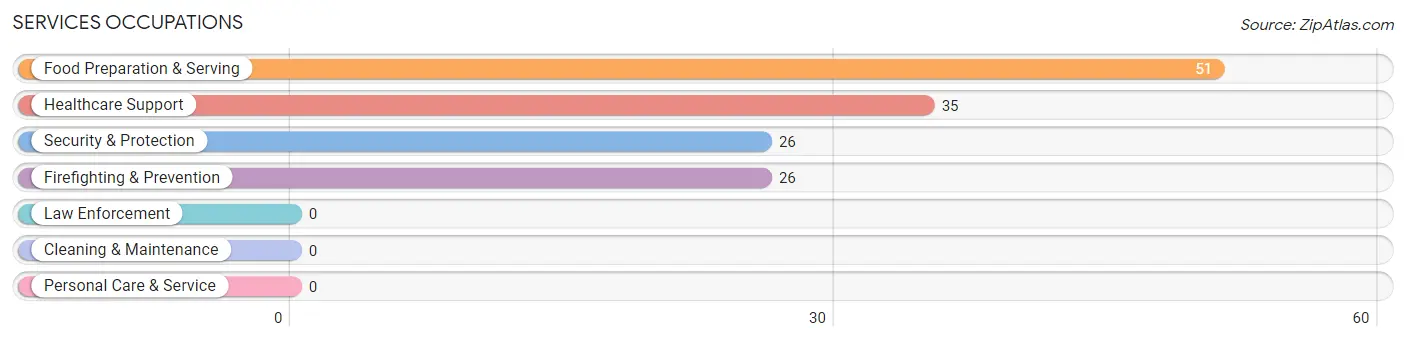
Services Occupations
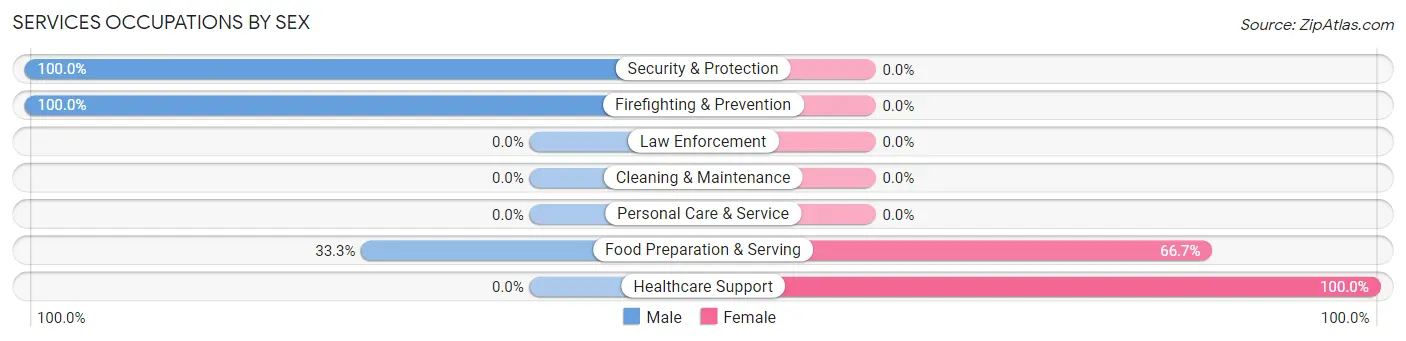
The most common Services occupations in El Mango are Food Preparation & Serving (51 | 8.9%), Healthcare Support (35 | 6.1%), Security & Protection (26 | 4.5%), and Firefighting & Prevention (26 | 4.5%).
Services Occupations by Sex
Within the Services occupations in El Mango, the most male-oriented occupations are Security & Protection (100.0%), Firefighting & Prevention (100.0%), and Food Preparation & Serving (33.3%), while the most female-oriented occupations are Healthcare Support (100.0%), and Food Preparation & Serving (66.7%).
| Occupation | Male | Female |
| Healthcare Support | 0 (0.0%) | 35 (100.0%) |
| Security & Protection | 26 (100.0%) | 0 (0.0%) |
| Firefighting & Prevention | 26 (100.0%) | 0 (0.0%) |
| Law Enforcement | 0 (0.0%) | 0 (0.0%) |
| Food Preparation & Serving | 17 (33.3%) | 34 (66.7%) |
| Cleaning & Maintenance | 0 (0.0%) | 0 (0.0%) |
| Personal Care & Service | 0 (0.0%) | 0 (0.0%) |
| Total (Category) | 43 (38.4%) | 69 (61.6%) |
| Total (Overall) | 410 (71.6%) | 163 (28.4%) |
Sales and Office Occupations
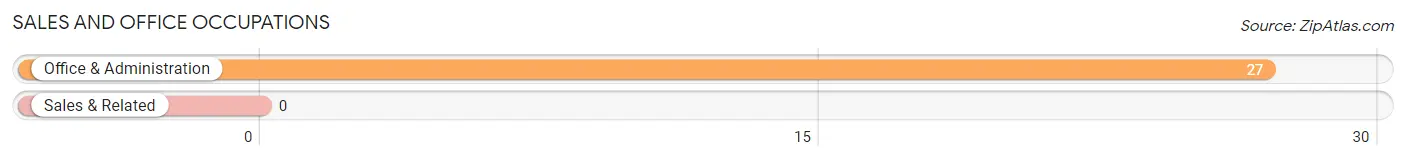
The most common Sales and Office occupations in El Mango are , and Office & Administration (27 | 4.7%).
Sales and Office Occupations by Sex

| Occupation | Male | Female |
| Sales & Related | 0 (0.0%) | 0 (0.0%) |
| Office & Administration | 0 (0.0%) | 27 (100.0%) |
| Total (Category) | 0 (0.0%) | 27 (100.0%) |
| Total (Overall) | 410 (71.6%) | 163 (28.4%) |
Natural Resources, Construction and Maintenance Occupations
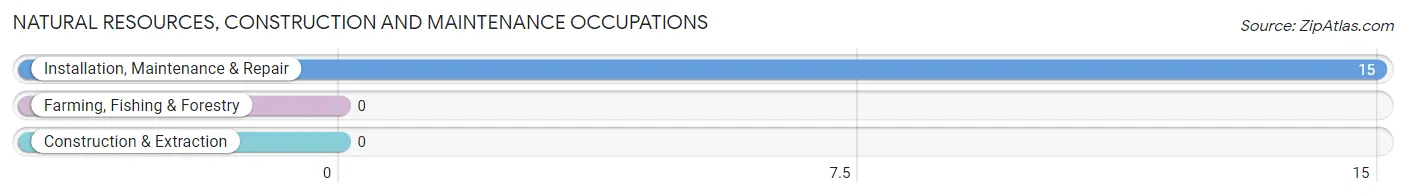
The most common Natural Resources, Construction and Maintenance occupations in El Mango are , and Installation, Maintenance & Repair (15 | 2.6%).
Natural Resources, Construction and Maintenance Occupations by Sex
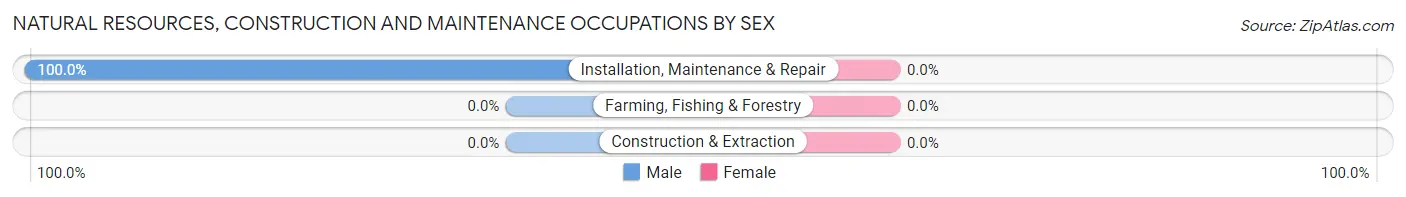
| Occupation | Male | Female |
| Farming, Fishing & Forestry | 0 (0.0%) | 0 (0.0%) |
| Construction & Extraction | 0 (0.0%) | 0 (0.0%) |
| Installation, Maintenance & Repair | 15 (100.0%) | 0 (0.0%) |
| Total (Category) | 15 (100.0%) | 0 (0.0%) |
| Total (Overall) | 410 (71.6%) | 163 (28.4%) |
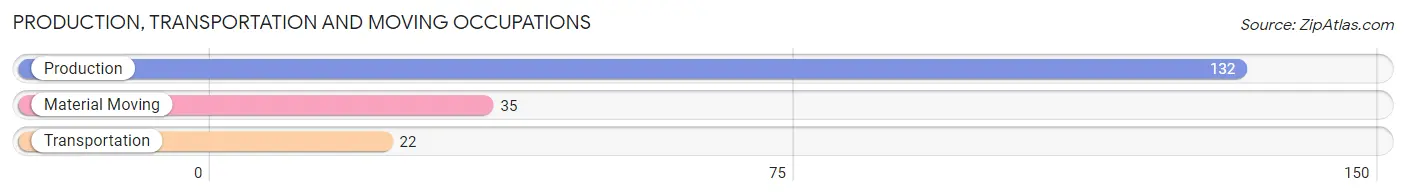
Production, Transportation and Moving Occupations
The most common Production, Transportation and Moving occupations in El Mango are Production (132 | 23.0%), Material Moving (35 | 6.1%), and Transportation (22 | 3.8%).
Production, Transportation and Moving Occupations by Sex
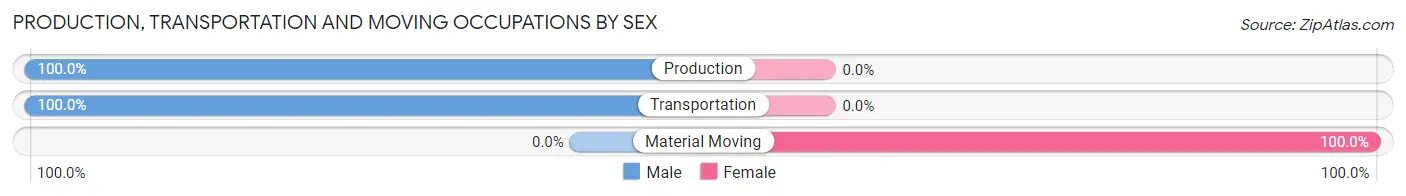
| Occupation | Male | Female |
| Production | 132 (100.0%) | 0 (0.0%) |
| Transportation | 22 (100.0%) | 0 (0.0%) |
| Material Moving | 0 (0.0%) | 35 (100.0%) |
| Total (Category) | 154 (81.5%) | 35 (18.5%) |
| Total (Overall) | 410 (71.6%) | 163 (28.4%) |
Employment Industries by Sex in El Mango
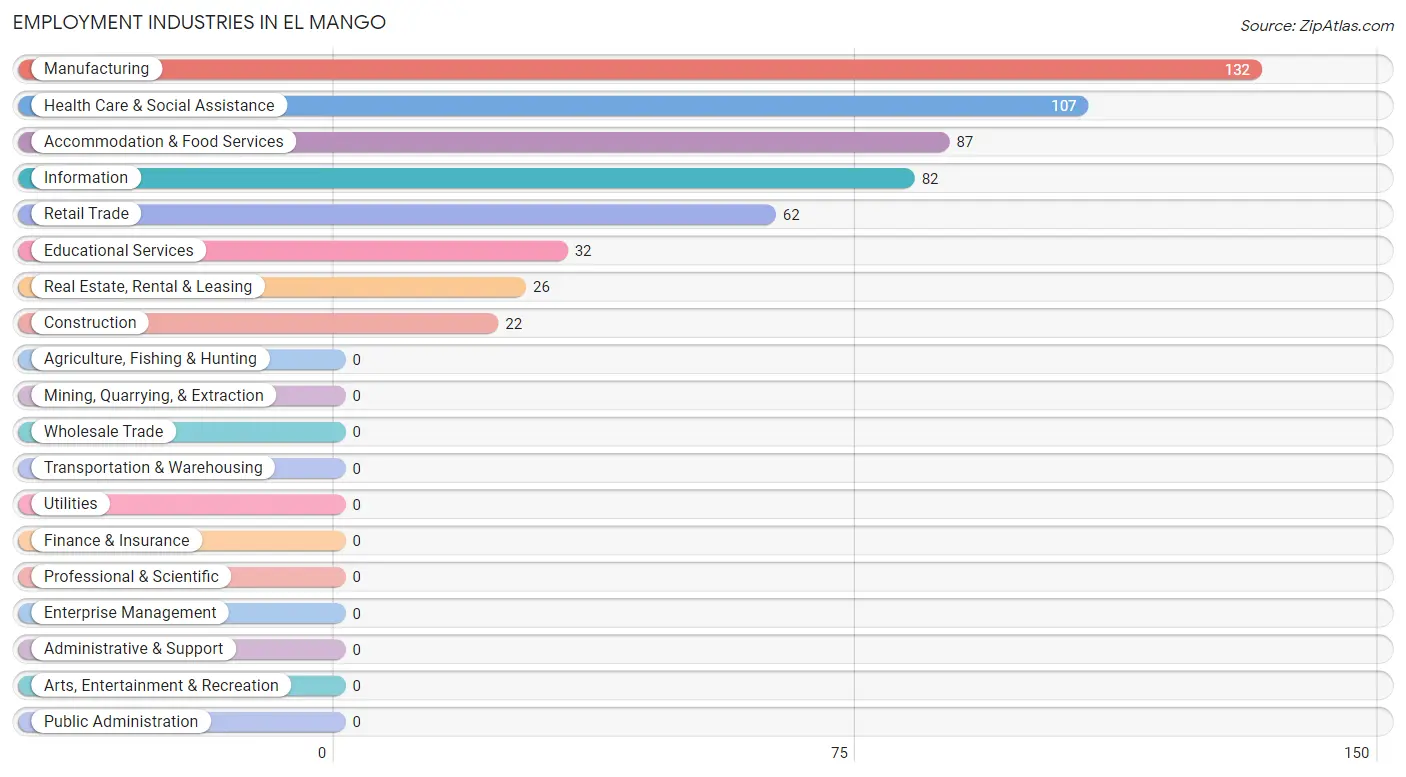
Employment Industries in El Mango
The major employment industries in El Mango include Manufacturing (132 | 23.0%), Health Care & Social Assistance (107 | 18.7%), Accommodation & Food Services (87 | 15.2%), Information (82 | 14.3%), and Retail Trade (62 | 10.8%).
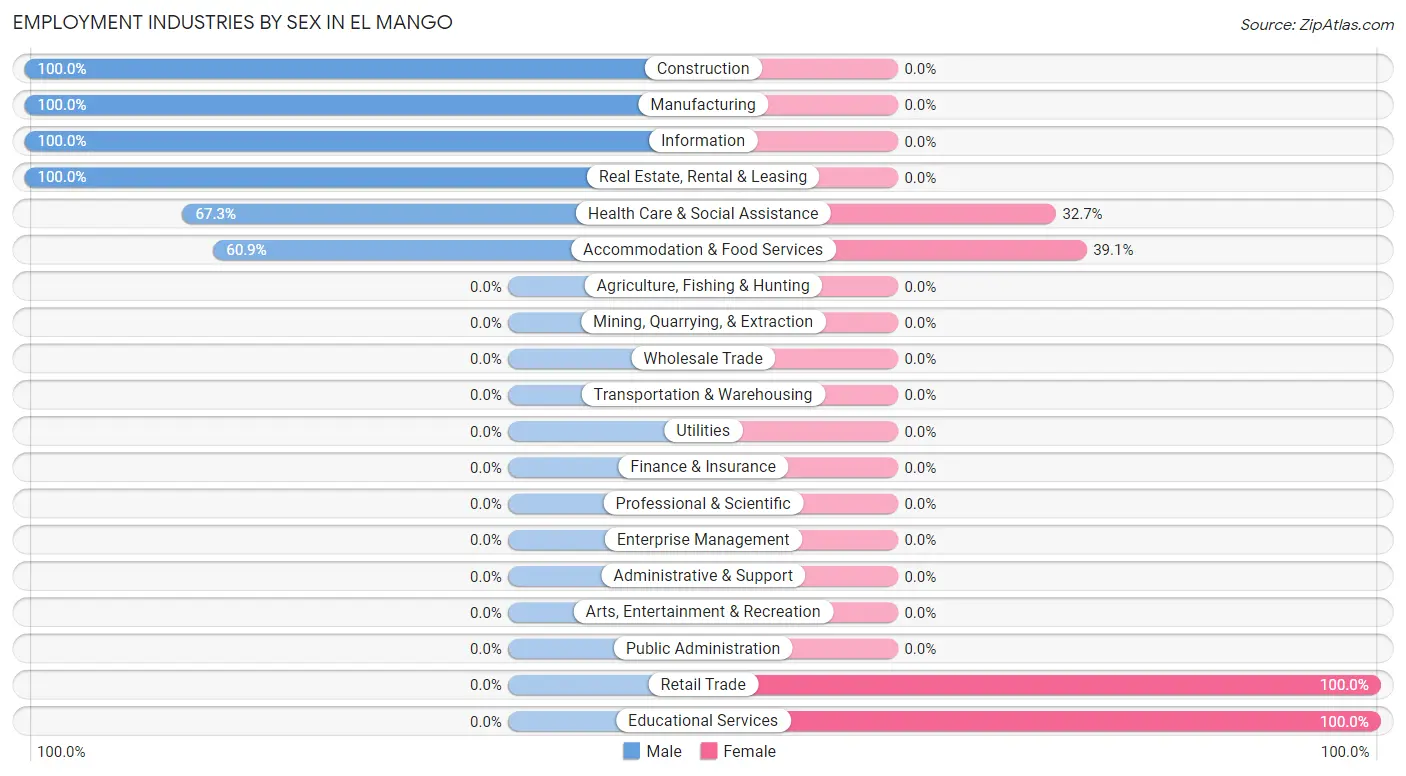
Employment Industries by Sex in El Mango
The El Mango industries that see more men than women are Construction (100.0%), Manufacturing (100.0%), and Information (100.0%), whereas the industries that tend to have a higher number of women are Retail Trade (100.0%), Educational Services (100.0%), and Accommodation & Food Services (39.1%).
| Industry | Male | Female |
| Agriculture, Fishing & Hunting | 0 (0.0%) | 0 (0.0%) |
| Mining, Quarrying, & Extraction | 0 (0.0%) | 0 (0.0%) |
| Construction | 22 (100.0%) | 0 (0.0%) |
| Manufacturing | 132 (100.0%) | 0 (0.0%) |
| Wholesale Trade | 0 (0.0%) | 0 (0.0%) |
| Retail Trade | 0 (0.0%) | 62 (100.0%) |
| Transportation & Warehousing | 0 (0.0%) | 0 (0.0%) |
| Utilities | 0 (0.0%) | 0 (0.0%) |
| Information | 82 (100.0%) | 0 (0.0%) |
| Finance & Insurance | 0 (0.0%) | 0 (0.0%) |
| Real Estate, Rental & Leasing | 26 (100.0%) | 0 (0.0%) |
| Professional & Scientific | 0 (0.0%) | 0 (0.0%) |
| Enterprise Management | 0 (0.0%) | 0 (0.0%) |
| Administrative & Support | 0 (0.0%) | 0 (0.0%) |
| Educational Services | 0 (0.0%) | 32 (100.0%) |
| Health Care & Social Assistance | 72 (67.3%) | 35 (32.7%) |
| Arts, Entertainment & Recreation | 0 (0.0%) | 0 (0.0%) |
| Accommodation & Food Services | 53 (60.9%) | 34 (39.1%) |
| Public Administration | 0 (0.0%) | 0 (0.0%) |
| Total | 410 (71.6%) | 163 (28.4%) |
Education in El Mango
School Enrollment in El Mango
The most common levels of schooling among the 171 students in El Mango are middle school (128 | 74.9%), and elementary school (43 | 25.2%).
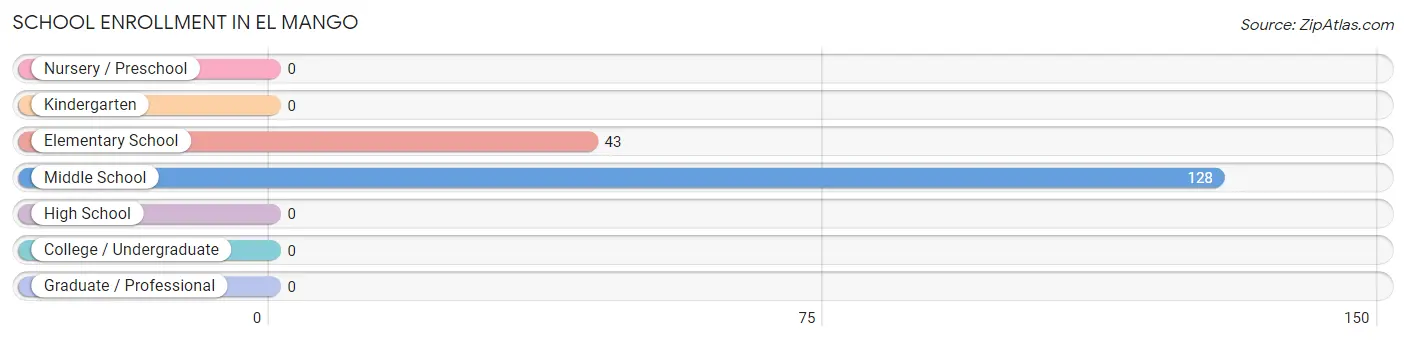
| School Level | # Students | % Students |
| Nursery / Preschool | 0 | 0.0% |
| Kindergarten | 0 | 0.0% |
| Elementary School | 43 | 25.2% |
| Middle School | 128 | 74.9% |
| High School | 0 | 0.0% |
| College / Undergraduate | 0 | 0.0% |
| Graduate / Professional | 0 | 0.0% |
| Total | 171 | 100.0% |
School Enrollment by Age by Funding Source in El Mango
Out of a total of 171 students who are enrolled in schools in El Mango, 66 (38.6%) attend a private institution, while the remaining 105 (61.4%) are enrolled in public schools. The age group of 5 to 9 year old has the highest likelihood of being enrolled in private schools, with 43 (100.0% in the age bracket) enrolled. Conversely, the age group of 10 to 14 year olds has the lowest likelihood of being enrolled in a private school, with 105 (82.0% in the age bracket) attending a public institution.
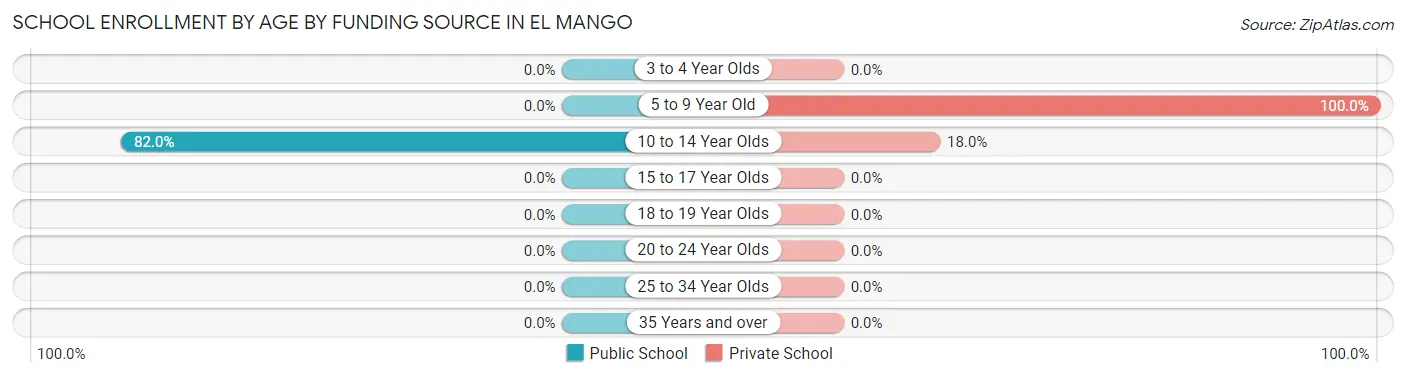
| Age Bracket | Public School | Private School |
| 3 to 4 Year Olds | 0 (0.0%) | 0 (0.0%) |
| 5 to 9 Year Old | 0 (0.0%) | 43 (100.0%) |
| 10 to 14 Year Olds | 105 (82.0%) | 23 (18.0%) |
| 15 to 17 Year Olds | 0 (0.0%) | 0 (0.0%) |
| 18 to 19 Year Olds | 0 (0.0%) | 0 (0.0%) |
| 20 to 24 Year Olds | 0 (0.0%) | 0 (0.0%) |
| 25 to 34 Year Olds | 0 (0.0%) | 0 (0.0%) |
| 35 Years and over | 0 (0.0%) | 0 (0.0%) |
| Total | 105 (61.4%) | 66 (38.6%) |
Educational Attainment by Field of Study in El Mango
Business (76 | 43.2%), education (66 | 37.5%), science & technology (26 | 14.8%), and liberal arts & history (8 | 4.5%) are the most common fields of study among 176 individuals in El Mango who have obtained a bachelor's degree or higher.
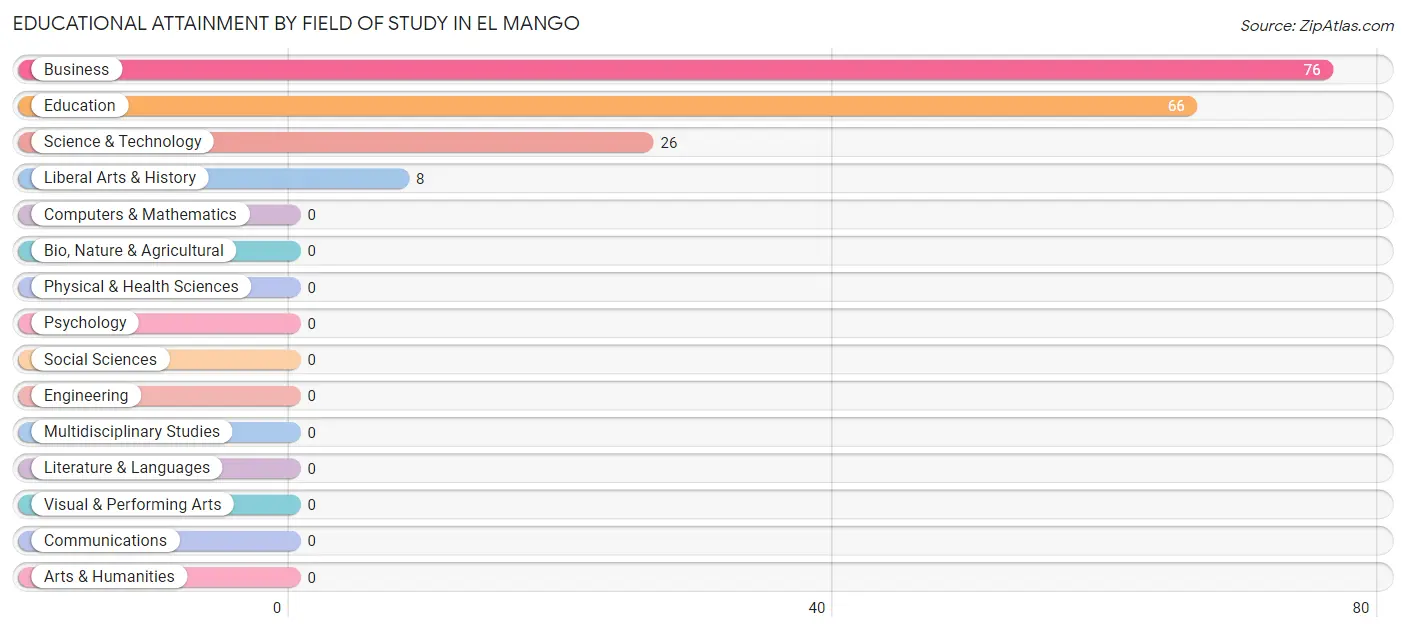
| Field of Study | # Graduates | % Graduates |
| Computers & Mathematics | 0 | 0.0% |
| Bio, Nature & Agricultural | 0 | 0.0% |
| Physical & Health Sciences | 0 | 0.0% |
| Psychology | 0 | 0.0% |
| Social Sciences | 0 | 0.0% |
| Engineering | 0 | 0.0% |
| Multidisciplinary Studies | 0 | 0.0% |
| Science & Technology | 26 | 14.8% |
| Business | 76 | 43.2% |
| Education | 66 | 37.5% |
| Literature & Languages | 0 | 0.0% |
| Liberal Arts & History | 8 | 4.5% |
| Visual & Performing Arts | 0 | 0.0% |
| Communications | 0 | 0.0% |
| Arts & Humanities | 0 | 0.0% |
| Total | 176 | 100.0% |
Transportation & Commute in El Mango
Vehicle Availability by Sex in El Mango
The most prevalent vehicle ownership categories in El Mango are males with 3 vehicles (225, accounting for 56.0%) and females with 3 vehicles (0, making up 138.0%).
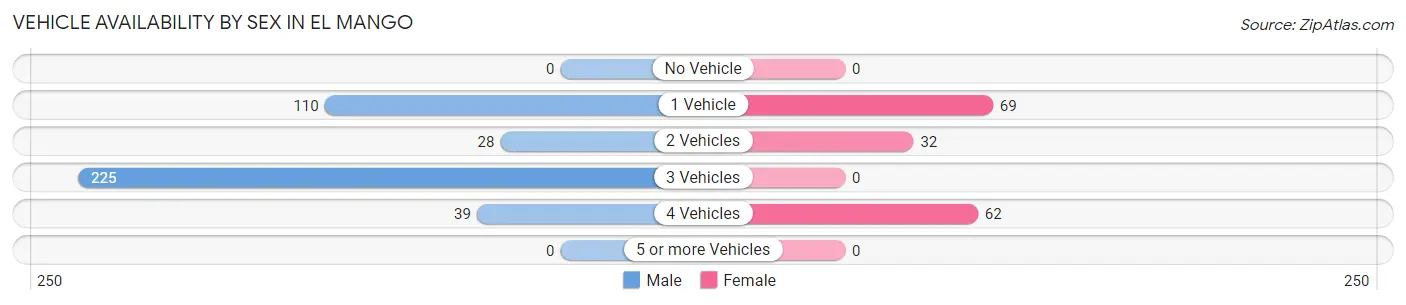
| Vehicles Available | Male | Female |
| No Vehicle | 0 (0.0%) | 0 (0.0%) |
| 1 Vehicle | 110 (27.4%) | 69 (42.3%) |
| 2 Vehicles | 28 (7.0%) | 32 (19.6%) |
| 3 Vehicles | 225 (56.0%) | 0 (0.0%) |
| 4 Vehicles | 39 (9.7%) | 62 (38.0%) |
| 5 or more Vehicles | 0 (0.0%) | 0 (0.0%) |
| Total | 402 (100.0%) | 163 (100.0%) |
Commute Time in El Mango
The most frequently occuring commute durations in El Mango are 30 to 34 minutes (283 commuters, 50.1%), 10 to 14 minutes (96 commuters, 17.0%), and 45 to 59 minutes (72 commuters, 12.7%).
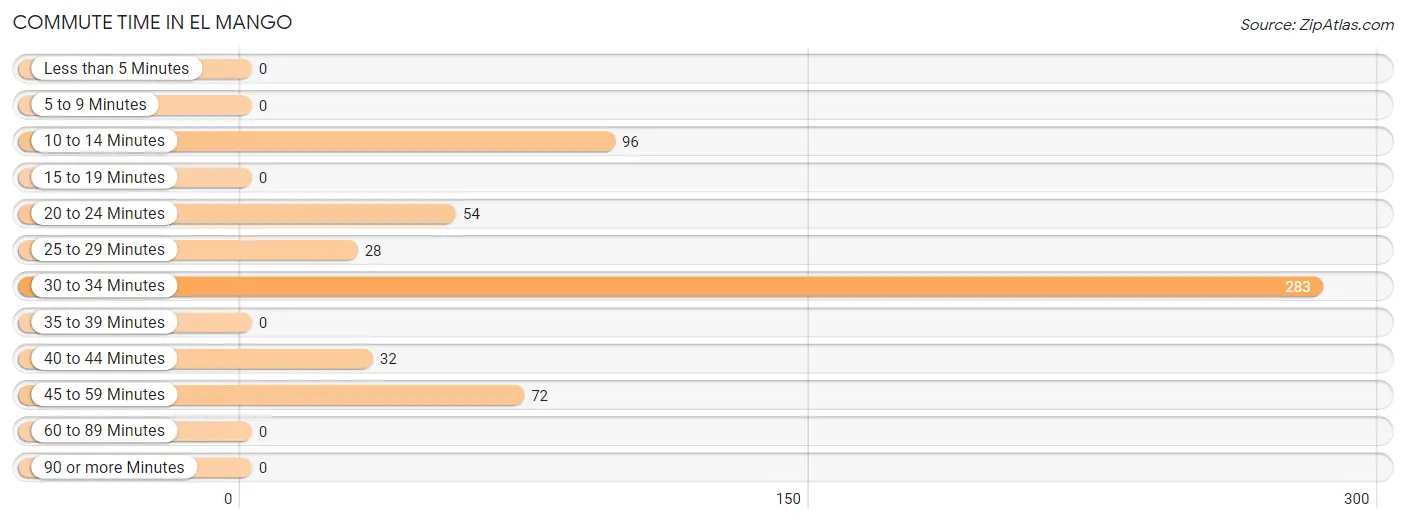
| Commute Time | # Commuters | % Commuters |
| Less than 5 Minutes | 0 | 0.0% |
| 5 to 9 Minutes | 0 | 0.0% |
| 10 to 14 Minutes | 96 | 17.0% |
| 15 to 19 Minutes | 0 | 0.0% |
| 20 to 24 Minutes | 54 | 9.6% |
| 25 to 29 Minutes | 28 | 5.0% |
| 30 to 34 Minutes | 283 | 50.1% |
| 35 to 39 Minutes | 0 | 0.0% |
| 40 to 44 Minutes | 32 | 5.7% |
| 45 to 59 Minutes | 72 | 12.7% |
| 60 to 89 Minutes | 0 | 0.0% |
| 90 or more Minutes | 0 | 0.0% |
Commute Time by Sex in El Mango
The most common commute times in El Mango are 30 to 34 minutes (248 commuters, 61.7%) for males and 10 to 14 minutes (96 commuters, 58.9%) for females.
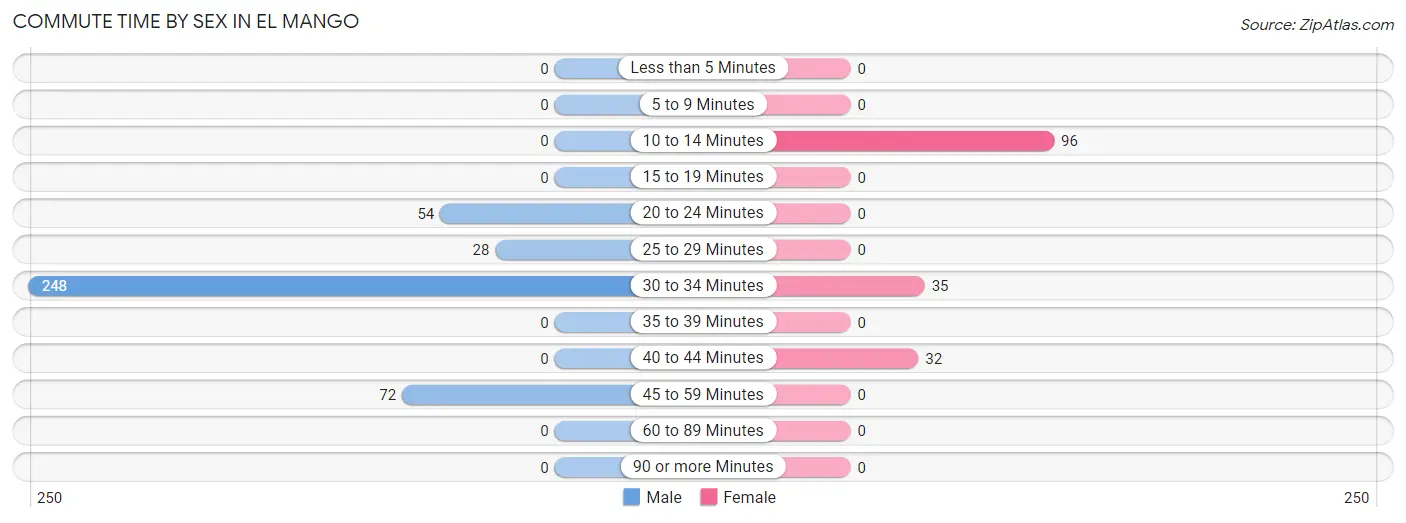
| Commute Time | Male | Female |
| Less than 5 Minutes | 0 (0.0%) | 0 (0.0%) |
| 5 to 9 Minutes | 0 (0.0%) | 0 (0.0%) |
| 10 to 14 Minutes | 0 (0.0%) | 96 (58.9%) |
| 15 to 19 Minutes | 0 (0.0%) | 0 (0.0%) |
| 20 to 24 Minutes | 54 (13.4%) | 0 (0.0%) |
| 25 to 29 Minutes | 28 (7.0%) | 0 (0.0%) |
| 30 to 34 Minutes | 248 (61.7%) | 35 (21.5%) |
| 35 to 39 Minutes | 0 (0.0%) | 0 (0.0%) |
| 40 to 44 Minutes | 0 (0.0%) | 32 (19.6%) |
| 45 to 59 Minutes | 72 (17.9%) | 0 (0.0%) |
| 60 to 89 Minutes | 0 (0.0%) | 0 (0.0%) |
| 90 or more Minutes | 0 (0.0%) | 0 (0.0%) |
Time of Departure to Work by Sex in El Mango
The most frequent times of departure to work in El Mango are 6:00 AM to 6:29 AM (98, 24.4%) for males and 6:30 AM to 6:59 AM (67, 41.1%) for females.
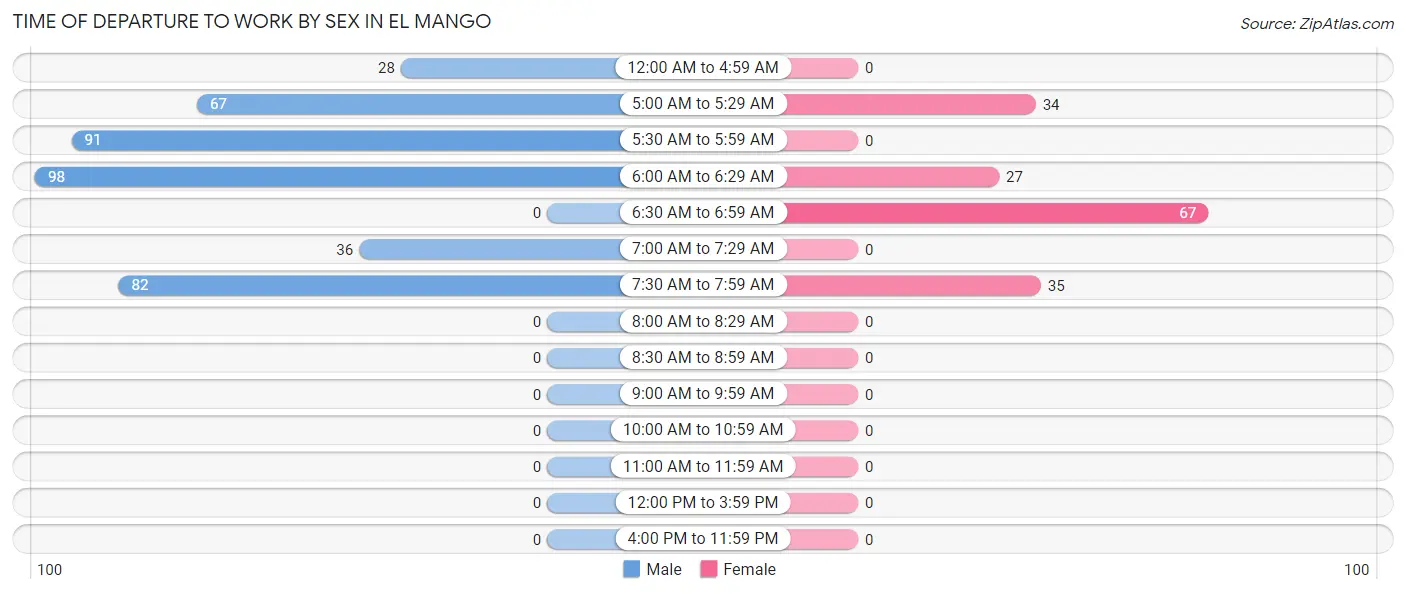
| Time of Departure | Male | Female |
| 12:00 AM to 4:59 AM | 28 (7.0%) | 0 (0.0%) |
| 5:00 AM to 5:29 AM | 67 (16.7%) | 34 (20.9%) |
| 5:30 AM to 5:59 AM | 91 (22.6%) | 0 (0.0%) |
| 6:00 AM to 6:29 AM | 98 (24.4%) | 27 (16.6%) |
| 6:30 AM to 6:59 AM | 0 (0.0%) | 67 (41.1%) |
| 7:00 AM to 7:29 AM | 36 (9.0%) | 0 (0.0%) |
| 7:30 AM to 7:59 AM | 82 (20.4%) | 35 (21.5%) |
| 8:00 AM to 8:29 AM | 0 (0.0%) | 0 (0.0%) |
| 8:30 AM to 8:59 AM | 0 (0.0%) | 0 (0.0%) |
| 9:00 AM to 9:59 AM | 0 (0.0%) | 0 (0.0%) |
| 10:00 AM to 10:59 AM | 0 (0.0%) | 0 (0.0%) |
| 11:00 AM to 11:59 AM | 0 (0.0%) | 0 (0.0%) |
| 12:00 PM to 3:59 PM | 0 (0.0%) | 0 (0.0%) |
| 4:00 PM to 11:59 PM | 0 (0.0%) | 0 (0.0%) |
| Total | 402 (100.0%) | 163 (100.0%) |
Housing Occupancy in El Mango
Occupancy by Ownership in El Mango
Of the total 533 dwellings in El Mango, owner-occupied units account for 471 (88.4%), while renter-occupied units make up 62 (11.6%).
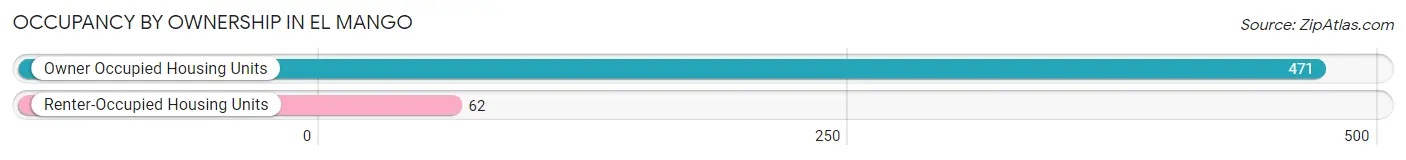
| Occupancy | # Housing Units | % Housing Units |
| Owner Occupied Housing Units | 471 | 88.4% |
| Renter-Occupied Housing Units | 62 | 11.6% |
| Total Occupied Housing Units | 533 | 100.0% |
Occupancy by Household Size in El Mango
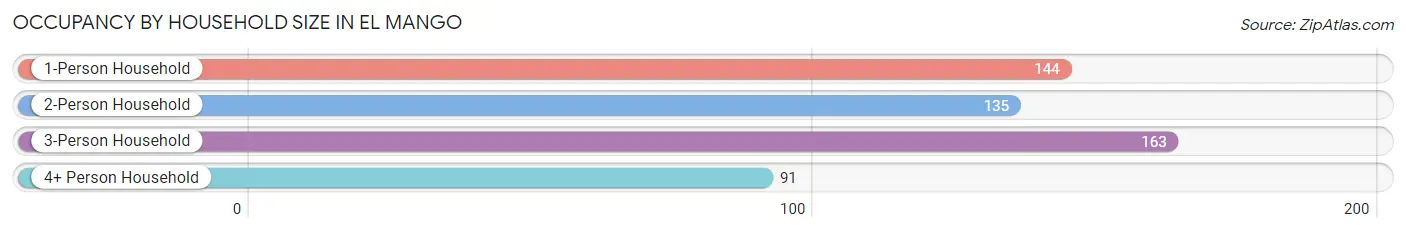
| Household Size | # Housing Units | % Housing Units |
| 1-Person Household | 144 | 27.0% |
| 2-Person Household | 135 | 25.3% |
| 3-Person Household | 163 | 30.6% |
| 4+ Person Household | 91 | 17.1% |
| Total Housing Units | 533 | 100.0% |
Occupancy by Ownership by Household Size in El Mango
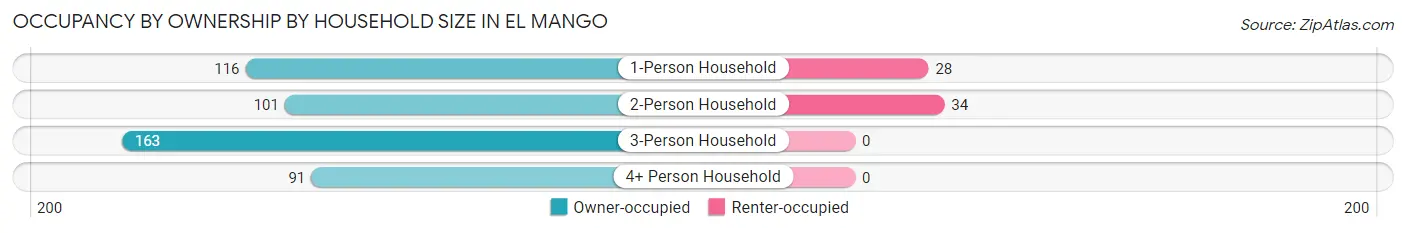
| Household Size | Owner-occupied | Renter-occupied |
| 1-Person Household | 116 (80.6%) | 28 (19.4%) |
| 2-Person Household | 101 (74.8%) | 34 (25.2%) |
| 3-Person Household | 163 (100.0%) | 0 (0.0%) |
| 4+ Person Household | 91 (100.0%) | 0 (0.0%) |
| Total Housing Units | 471 (88.4%) | 62 (11.6%) |
Occupancy by Educational Attainment in El Mango
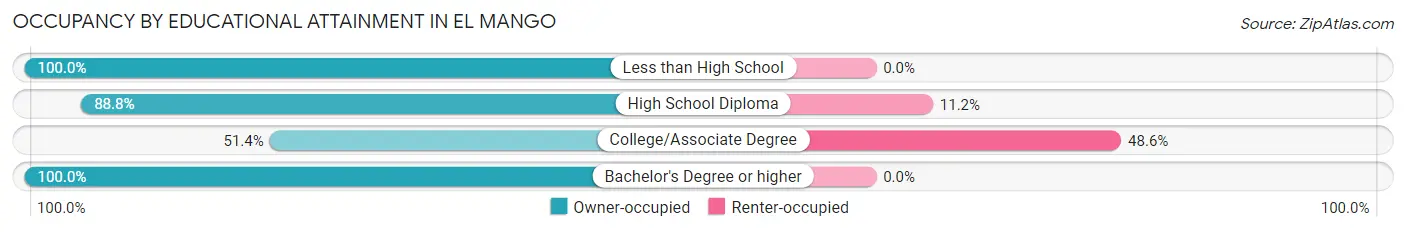
| Household Size | Owner-occupied | Renter-occupied |
| Less than High School | 134 (100.0%) | 0 (0.0%) |
| High School Diploma | 221 (88.8%) | 28 (11.2%) |
| College/Associate Degree | 36 (51.4%) | 34 (48.6%) |
| Bachelor's Degree or higher | 80 (100.0%) | 0 (0.0%) |
Occupancy by Age of Householder in El Mango
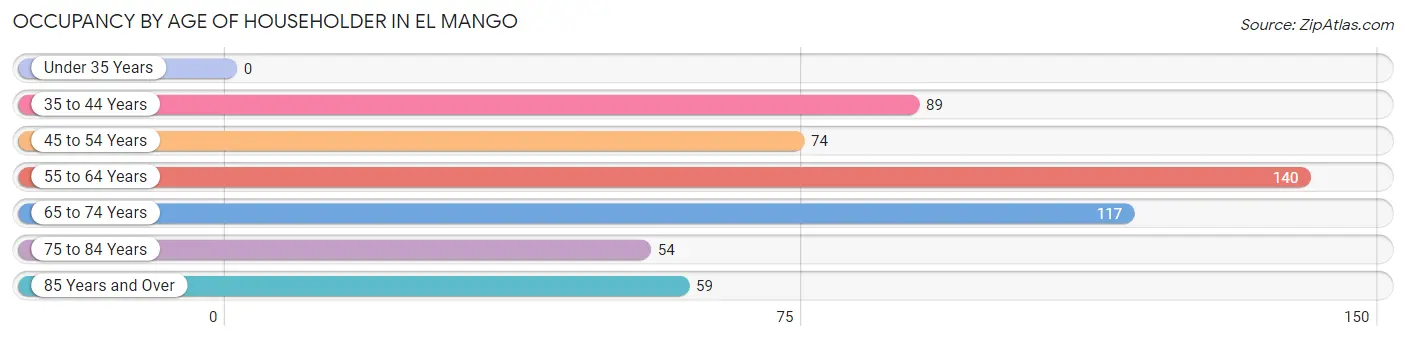
| Age Bracket | # Households | % Households |
| Under 35 Years | 0 | 0.0% |
| 35 to 44 Years | 89 | 16.7% |
| 45 to 54 Years | 74 | 13.9% |
| 55 to 64 Years | 140 | 26.3% |
| 65 to 74 Years | 117 | 22.0% |
| 75 to 84 Years | 54 | 10.1% |
| 85 Years and Over | 59 | 11.1% |
| Total | 533 | 100.0% |
Housing Finances in El Mango
Median Income by Occupancy in El Mango
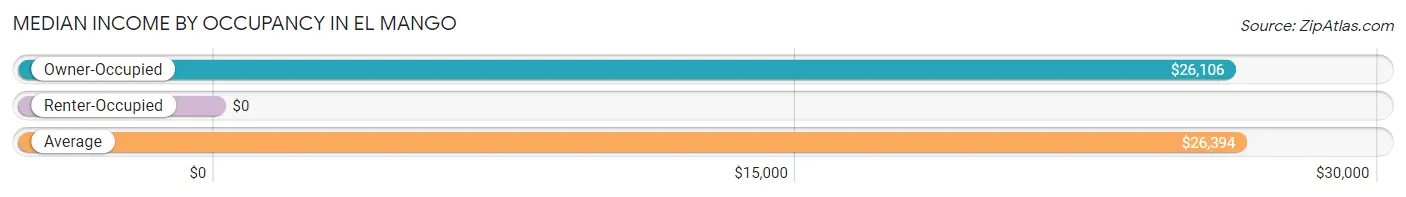
| Occupancy Type | # Households | Median Income |
| Owner-Occupied | 471 (88.4%) | $26,106 |
| Renter-Occupied | 62 (11.6%) | $0 |
| Average | 533 (100.0%) | $26,394 |
Occupancy by Householder Income Bracket in El Mango
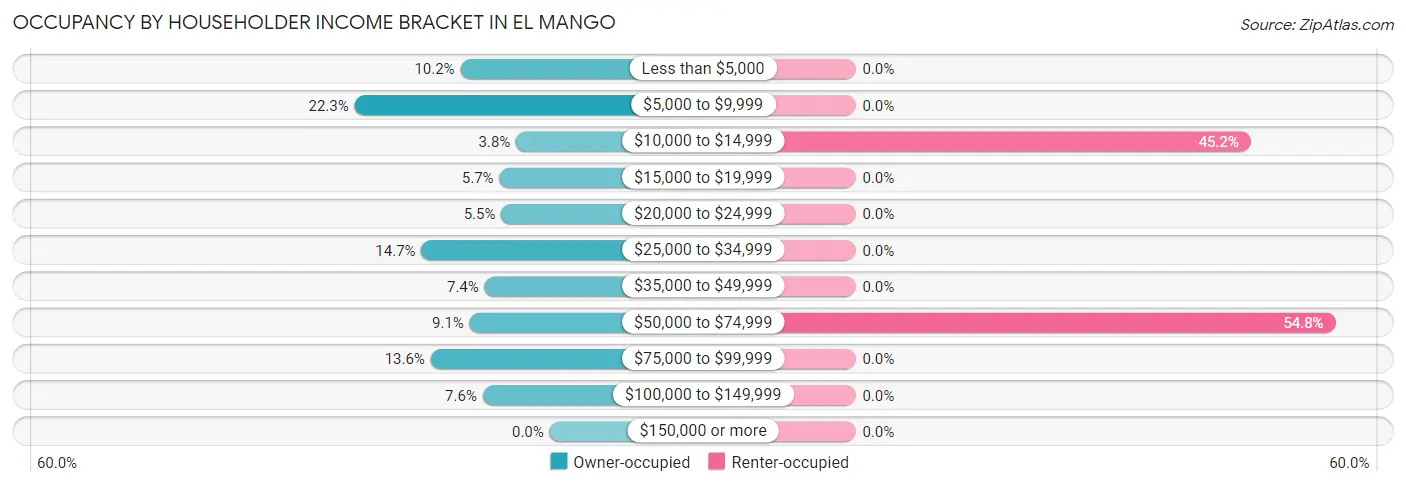
| Income Bracket | Owner-occupied | Renter-occupied |
| Less than $5,000 | 48 (10.2%) | 0 (0.0%) |
| $5,000 to $9,999 | 105 (22.3%) | 0 (0.0%) |
| $10,000 to $14,999 | 18 (3.8%) | 28 (45.2%) |
| $15,000 to $19,999 | 27 (5.7%) | 0 (0.0%) |
| $20,000 to $24,999 | 26 (5.5%) | 0 (0.0%) |
| $25,000 to $34,999 | 69 (14.6%) | 0 (0.0%) |
| $35,000 to $49,999 | 35 (7.4%) | 0 (0.0%) |
| $50,000 to $74,999 | 43 (9.1%) | 34 (54.8%) |
| $75,000 to $99,999 | 64 (13.6%) | 0 (0.0%) |
| $100,000 to $149,999 | 36 (7.6%) | 0 (0.0%) |
| $150,000 or more | 0 (0.0%) | 0 (0.0%) |
| Total | 471 (100.0%) | 62 (100.0%) |
Monthly Housing Cost Tiers in El Mango
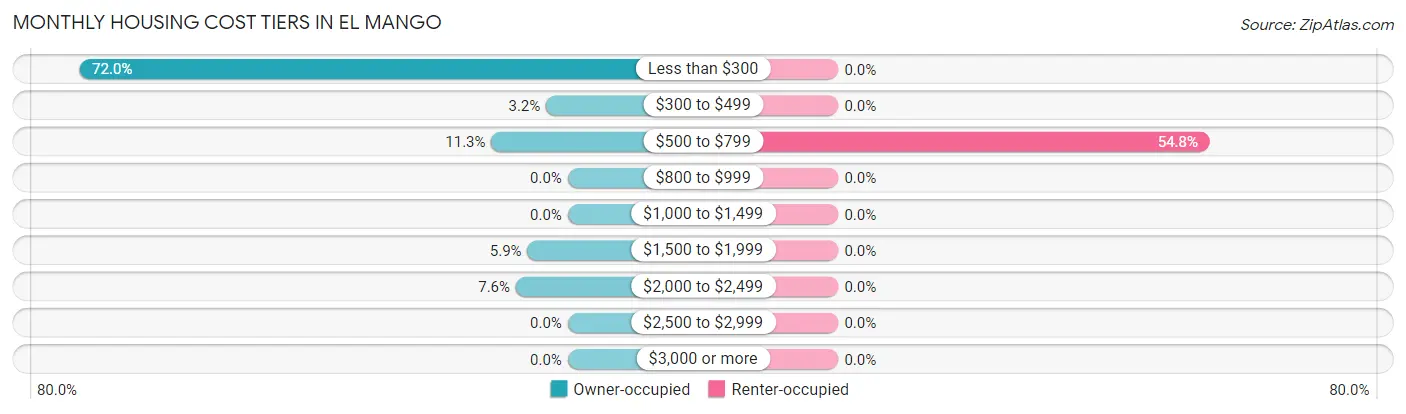
| Monthly Cost | Owner-occupied | Renter-occupied |
| Less than $300 | 339 (72.0%) | 0 (0.0%) |
| $300 to $499 | 15 (3.2%) | 0 (0.0%) |
| $500 to $799 | 53 (11.3%) | 34 (54.8%) |
| $800 to $999 | 0 (0.0%) | 0 (0.0%) |
| $1,000 to $1,499 | 0 (0.0%) | 0 (0.0%) |
| $1,500 to $1,999 | 28 (5.9%) | 0 (0.0%) |
| $2,000 to $2,499 | 36 (7.6%) | 0 (0.0%) |
| $2,500 to $2,999 | 0 (0.0%) | 0 (0.0%) |
| $3,000 or more | 0 (0.0%) | 0 (0.0%) |
| Total | 471 (100.0%) | 62 (100.0%) |
Physical Housing Characteristics in El Mango
Housing Structures in El Mango
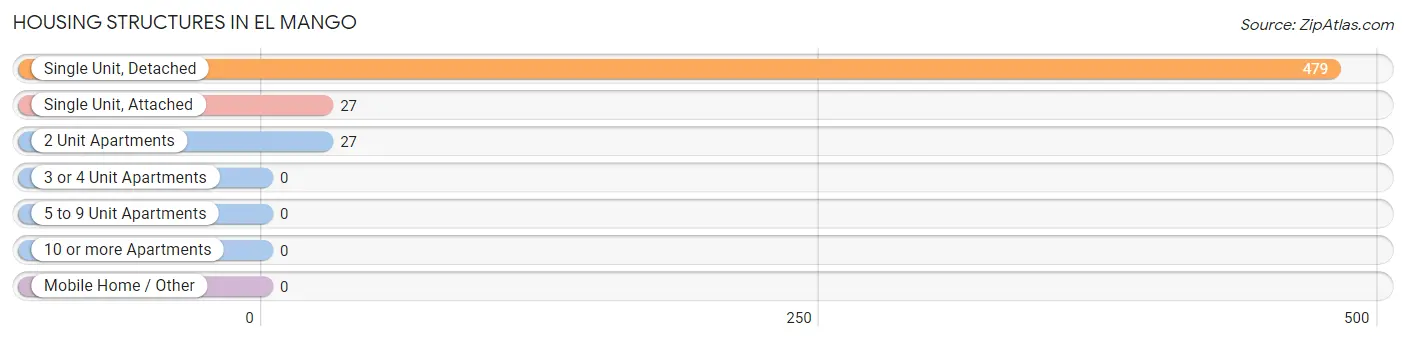
| Structure Type | # Housing Units | % Housing Units |
| Single Unit, Detached | 479 | 89.9% |
| Single Unit, Attached | 27 | 5.1% |
| 2 Unit Apartments | 27 | 5.1% |
| 3 or 4 Unit Apartments | 0 | 0.0% |
| 5 to 9 Unit Apartments | 0 | 0.0% |
| 10 or more Apartments | 0 | 0.0% |
| Mobile Home / Other | 0 | 0.0% |
| Total | 533 | 100.0% |
Housing Structures by Occupancy in El Mango
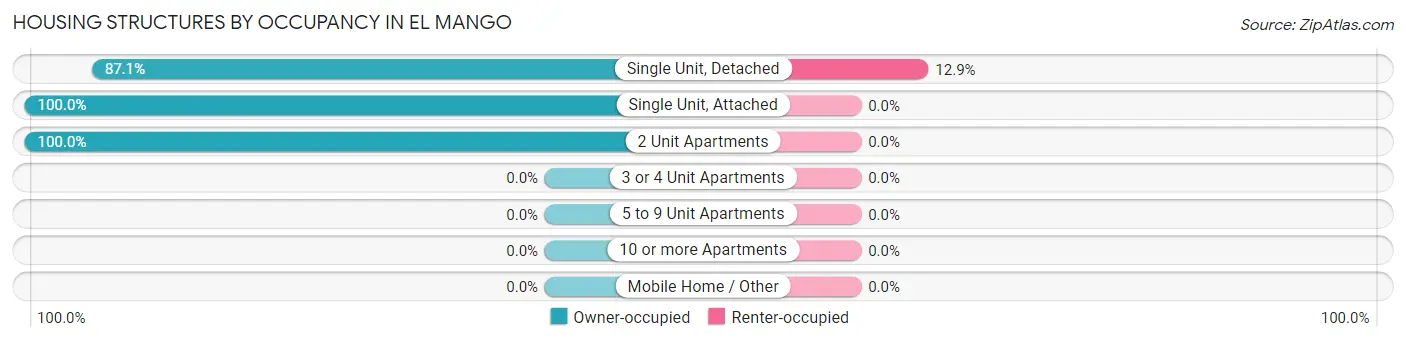
| Structure Type | Owner-occupied | Renter-occupied |
| Single Unit, Detached | 417 (87.1%) | 62 (12.9%) |
| Single Unit, Attached | 27 (100.0%) | 0 (0.0%) |
| 2 Unit Apartments | 27 (100.0%) | 0 (0.0%) |
| 3 or 4 Unit Apartments | 0 (0.0%) | 0 (0.0%) |
| 5 to 9 Unit Apartments | 0 (0.0%) | 0 (0.0%) |
| 10 or more Apartments | 0 (0.0%) | 0 (0.0%) |
| Mobile Home / Other | 0 (0.0%) | 0 (0.0%) |
| Total | 471 (88.4%) | 62 (11.6%) |
Housing Structures by Number of Rooms in El Mango
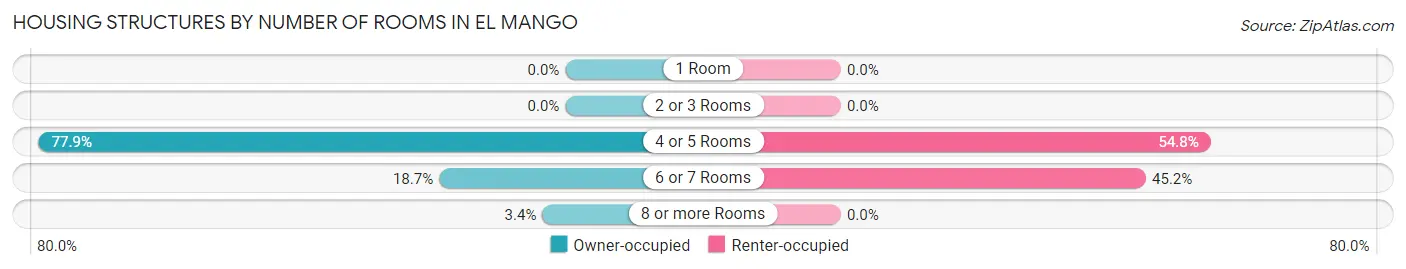
| Number of Rooms | Owner-occupied | Renter-occupied |
| 1 Room | 0 (0.0%) | 0 (0.0%) |
| 2 or 3 Rooms | 0 (0.0%) | 0 (0.0%) |
| 4 or 5 Rooms | 367 (77.9%) | 34 (54.8%) |
| 6 or 7 Rooms | 88 (18.7%) | 28 (45.2%) |
| 8 or more Rooms | 16 (3.4%) | 0 (0.0%) |
| Total | 471 (100.0%) | 62 (100.0%) |
Housing Structure by Heating Type in El Mango
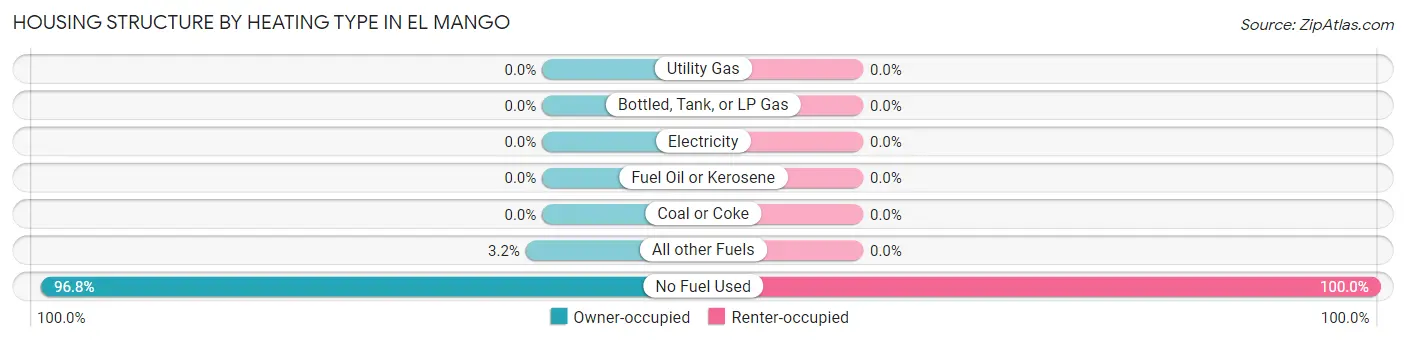
| Heating Type | Owner-occupied | Renter-occupied |
| Utility Gas | 0 (0.0%) | 0 (0.0%) |
| Bottled, Tank, or LP Gas | 0 (0.0%) | 0 (0.0%) |
| Electricity | 0 (0.0%) | 0 (0.0%) |
| Fuel Oil or Kerosene | 0 (0.0%) | 0 (0.0%) |
| Coal or Coke | 0 (0.0%) | 0 (0.0%) |
| All other Fuels | 15 (3.2%) | 0 (0.0%) |
| No Fuel Used | 456 (96.8%) | 62 (100.0%) |
| Total | 471 (100.0%) | 62 (100.0%) |
Household Vehicle Usage in El Mango
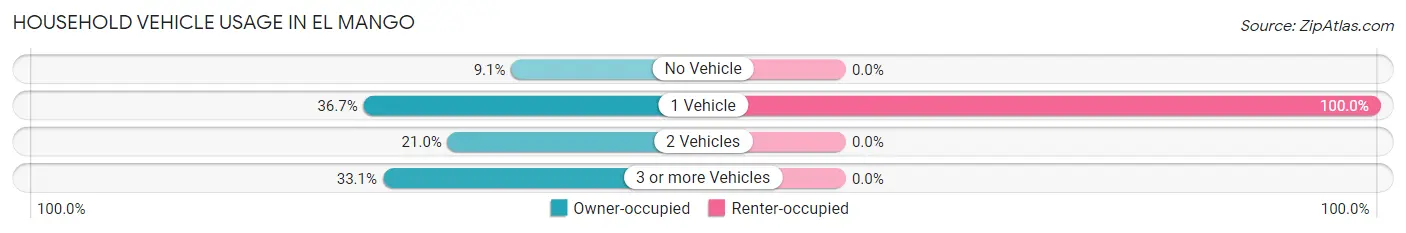
| Vehicles per Household | Owner-occupied | Renter-occupied |
| No Vehicle | 43 (9.1%) | 0 (0.0%) |
| 1 Vehicle | 173 (36.7%) | 62 (100.0%) |
| 2 Vehicles | 99 (21.0%) | 0 (0.0%) |
| 3 or more Vehicles | 156 (33.1%) | 0 (0.0%) |
| Total | 471 (100.0%) | 62 (100.0%) |
Real Estate & Mortgages in El Mango
Real Estate and Mortgage Overview in El Mango
| Characteristic | Without Mortgage | With Mortgage |
| Housing Units | 354 | 117 |
| Median Property Value | $106,800 | $179,900 |
| Median Household Income | $18,056 | $0 |
| Monthly Housing Costs | $179 | $0 |
| Real Estate Taxes | - | - |
Property Value by Mortgage Status in El Mango
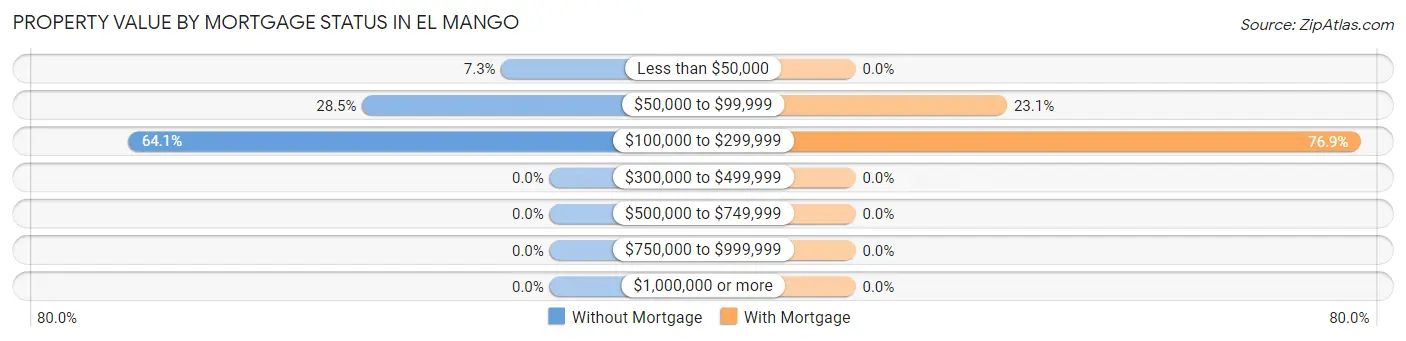
| Property Value | Without Mortgage | With Mortgage |
| Less than $50,000 | 26 (7.3%) | 0 (0.0%) |
| $50,000 to $99,999 | 101 (28.5%) | 27 (23.1%) |
| $100,000 to $299,999 | 227 (64.1%) | 90 (76.9%) |
| $300,000 to $499,999 | 0 (0.0%) | 0 (0.0%) |
| $500,000 to $749,999 | 0 (0.0%) | 0 (0.0%) |
| $750,000 to $999,999 | 0 (0.0%) | 0 (0.0%) |
| $1,000,000 or more | 0 (0.0%) | 0 (0.0%) |
| Total | 354 (100.0%) | 117 (100.0%) |
Household Income by Mortgage Status in El Mango
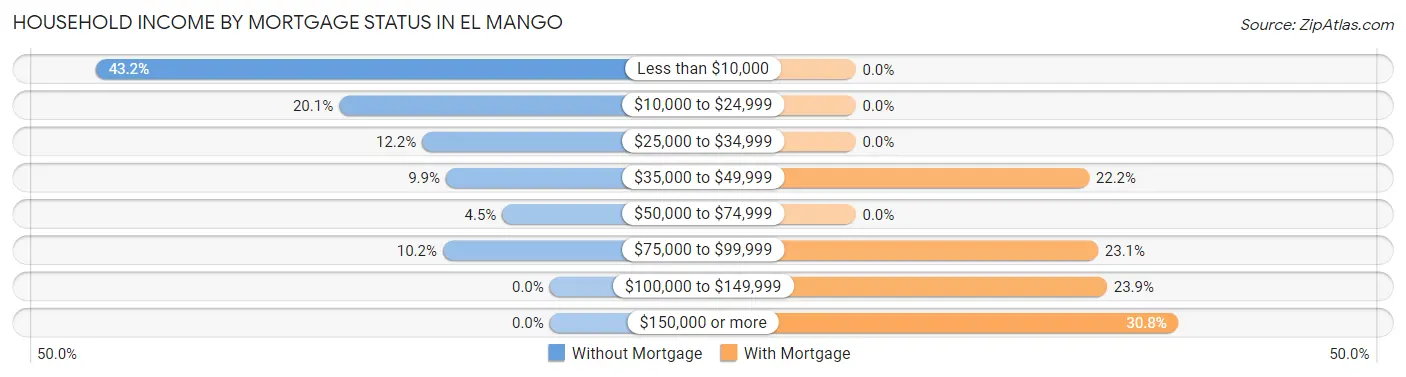
| Household Income | Without Mortgage | With Mortgage |
| Less than $10,000 | 153 (43.2%) | 0 (0.0%) |
| $10,000 to $24,999 | 71 (20.1%) | 0 (0.0%) |
| $25,000 to $34,999 | 43 (12.1%) | 0 (0.0%) |
| $35,000 to $49,999 | 35 (9.9%) | 26 (22.2%) |
| $50,000 to $74,999 | 16 (4.5%) | 0 (0.0%) |
| $75,000 to $99,999 | 36 (10.2%) | 27 (23.1%) |
| $100,000 to $149,999 | 0 (0.0%) | 28 (23.9%) |
| $150,000 or more | 0 (0.0%) | 36 (30.8%) |
| Total | 354 (100.0%) | 117 (100.0%) |
Property Value to Household Income Ratio in El Mango
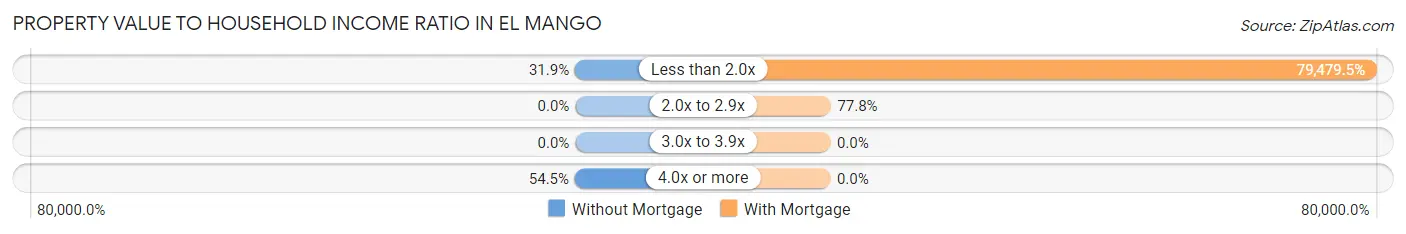
| Value-to-Income Ratio | Without Mortgage | With Mortgage |
| Less than 2.0x | 113 (31.9%) | 92,991 (79,479.5%) |
| 2.0x to 2.9x | 0 (0.0%) | 91 (77.8%) |
| 3.0x to 3.9x | 0 (0.0%) | 0 (0.0%) |
| 4.0x or more | 193 (54.5%) | 0 (0.0%) |
| Total | 354 (100.0%) | 117 (100.0%) |
Real Estate Taxes by Mortgage Status in El Mango
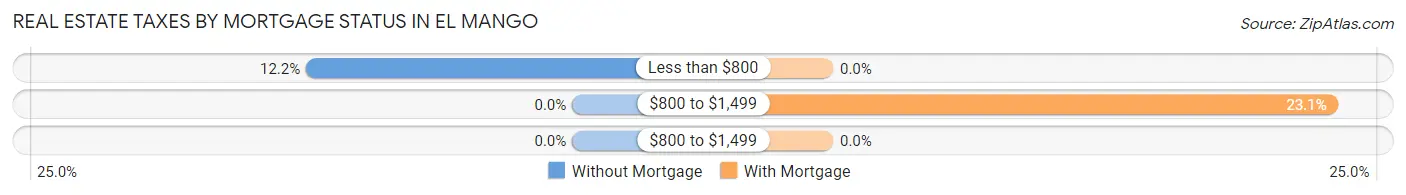
| Property Taxes | Without Mortgage | With Mortgage |
| Less than $800 | 43 (12.1%) | 0 (0.0%) |
| $800 to $1,499 | 0 (0.0%) | 27 (23.1%) |
| $800 to $1,499 | 0 (0.0%) | 0 (0.0%) |
| Total | 354 (100.0%) | 117 (100.0%) |
Health & Disability in El Mango
Health Insurance Coverage by Age in El Mango
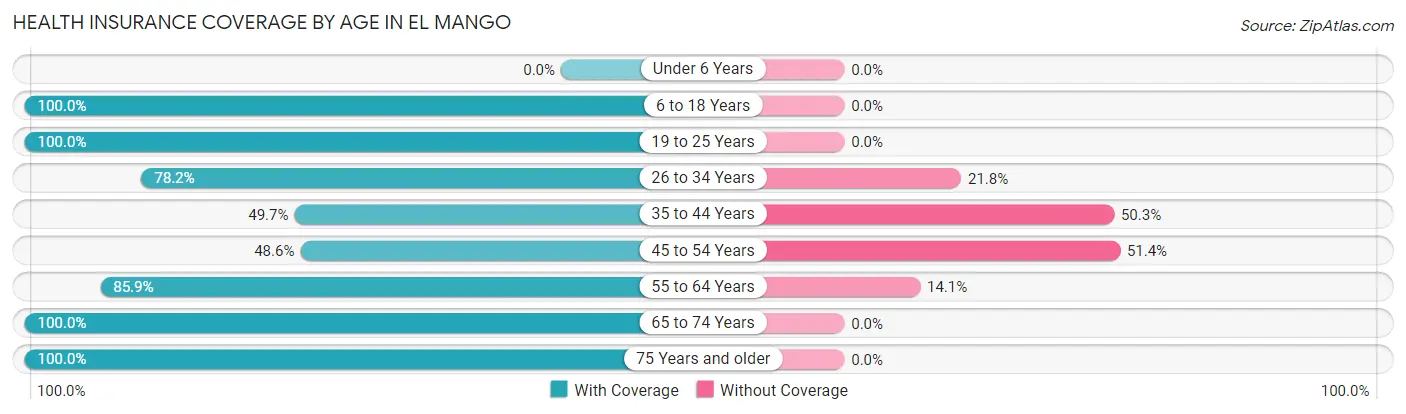
| Age Bracket | With Coverage | Without Coverage |
| Under 6 Years | 0 (0.0%) | 0 (0.0%) |
| 6 to 18 Years | 188 (100.0%) | 0 (0.0%) |
| 19 to 25 Years | 100 (100.0%) | 0 (0.0%) |
| 26 to 34 Years | 158 (78.2%) | 44 (21.8%) |
| 35 to 44 Years | 171 (49.7%) | 173 (50.3%) |
| 45 to 54 Years | 104 (48.6%) | 110 (51.4%) |
| 55 to 64 Years | 225 (85.9%) | 37 (14.1%) |
| 65 to 74 Years | 225 (100.0%) | 0 (0.0%) |
| 75 Years and older | 113 (100.0%) | 0 (0.0%) |
| Total | 1,284 (77.9%) | 364 (22.1%) |
Health Insurance Coverage by Citizenship Status in El Mango
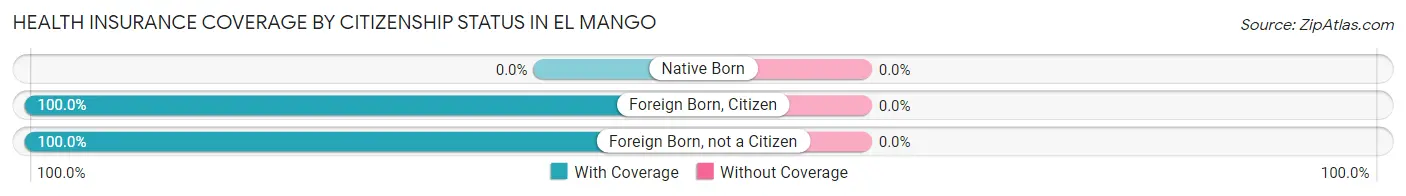
| Citizenship Status | With Coverage | Without Coverage |
| Native Born | 0 (0.0%) | 0 (0.0%) |
| Foreign Born, Citizen | 188 (100.0%) | 0 (0.0%) |
| Foreign Born, not a Citizen | 100 (100.0%) | 0 (0.0%) |
Health Insurance Coverage by Household Income in El Mango
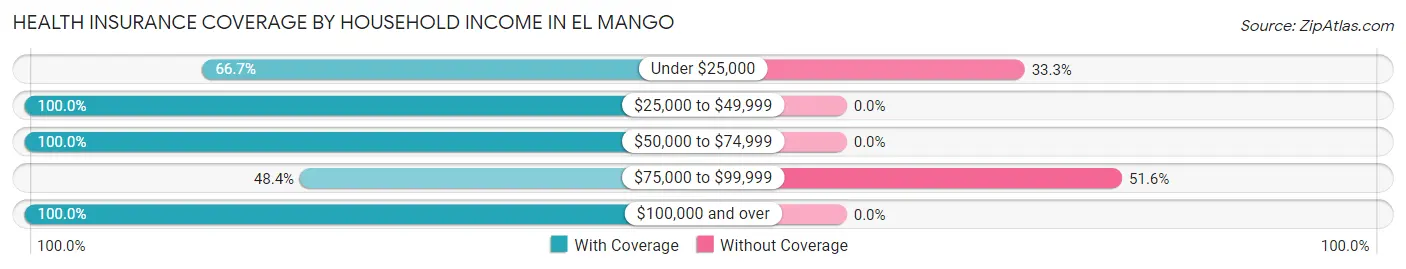
| Household Income | With Coverage | Without Coverage |
| Under $25,000 | 368 (66.7%) | 184 (33.3%) |
| $25,000 to $49,999 | 305 (100.0%) | 0 (0.0%) |
| $50,000 to $74,999 | 265 (100.0%) | 0 (0.0%) |
| $75,000 to $99,999 | 169 (48.4%) | 180 (51.6%) |
| $100,000 and over | 152 (100.0%) | 0 (0.0%) |
Public vs Private Health Insurance Coverage by Age in El Mango
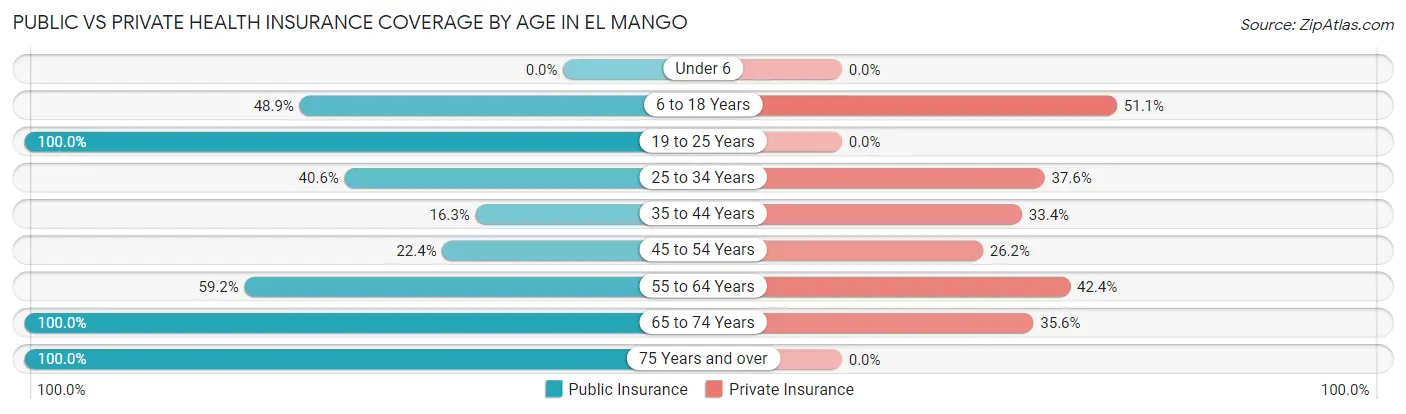
| Age Bracket | Public Insurance | Private Insurance |
| Under 6 | 0 (0.0%) | 0 (0.0%) |
| 6 to 18 Years | 92 (48.9%) | 96 (51.1%) |
| 19 to 25 Years | 100 (100.0%) | 0 (0.0%) |
| 25 to 34 Years | 82 (40.6%) | 76 (37.6%) |
| 35 to 44 Years | 56 (16.3%) | 115 (33.4%) |
| 45 to 54 Years | 48 (22.4%) | 56 (26.2%) |
| 55 to 64 Years | 155 (59.2%) | 111 (42.4%) |
| 65 to 74 Years | 225 (100.0%) | 80 (35.6%) |
| 75 Years and over | 113 (100.0%) | 0 (0.0%) |
| Total | 871 (52.8%) | 534 (32.4%) |
Disability Status by Sex by Age in El Mango
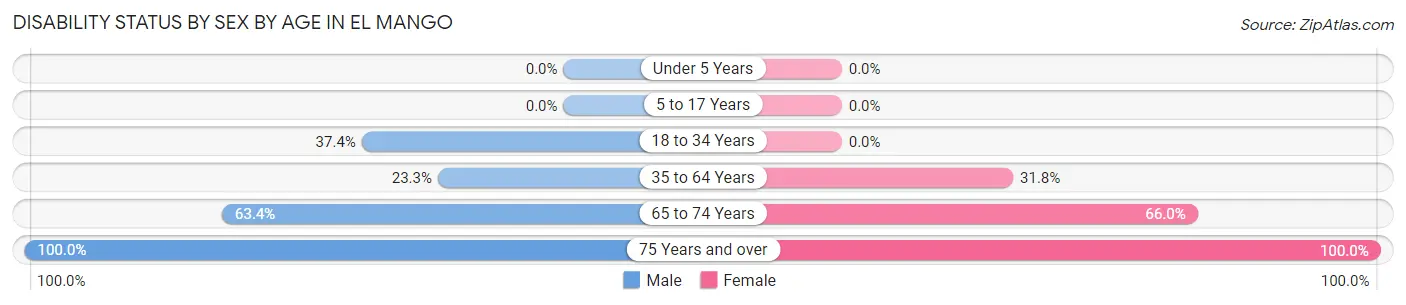
| Age Bracket | Male | Female |
| Under 5 Years | 0 (0.0%) | 0 (0.0%) |
| 5 to 17 Years | 0 (0.0%) | 0 (0.0%) |
| 18 to 34 Years | 82 (37.4%) | 0 (0.0%) |
| 35 to 64 Years | 120 (23.3%) | 97 (31.8%) |
| 65 to 74 Years | 109 (63.4%) | 35 (66.0%) |
| 75 Years and over | 70 (100.0%) | 43 (100.0%) |
Disability Class by Sex by Age in El Mango
Disability Class: Hearing Difficulty
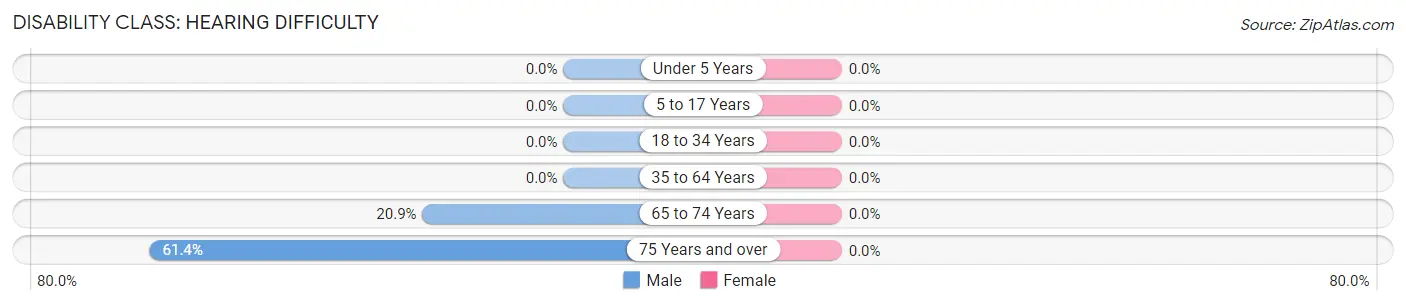
| Age Bracket | Male | Female |
| Under 5 Years | 0 (0.0%) | 0 (0.0%) |
| 5 to 17 Years | 0 (0.0%) | 0 (0.0%) |
| 18 to 34 Years | 0 (0.0%) | 0 (0.0%) |
| 35 to 64 Years | 0 (0.0%) | 0 (0.0%) |
| 65 to 74 Years | 36 (20.9%) | 0 (0.0%) |
| 75 Years and over | 43 (61.4%) | 0 (0.0%) |
Disability Class: Vision Difficulty
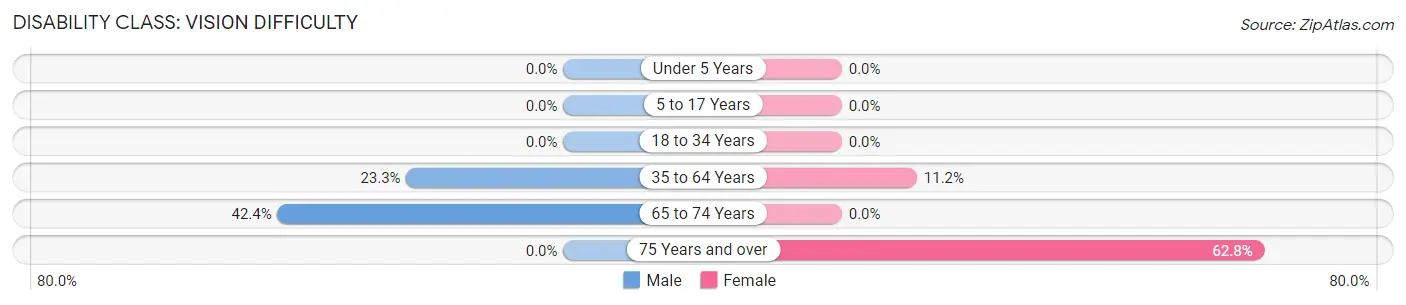
| Age Bracket | Male | Female |
| Under 5 Years | 0 (0.0%) | 0 (0.0%) |
| 5 to 17 Years | 0 (0.0%) | 0 (0.0%) |
| 18 to 34 Years | 0 (0.0%) | 0 (0.0%) |
| 35 to 64 Years | 120 (23.3%) | 34 (11.2%) |
| 65 to 74 Years | 73 (42.4%) | 0 (0.0%) |
| 75 Years and over | 0 (0.0%) | 27 (62.8%) |
Disability Class: Cognitive Difficulty
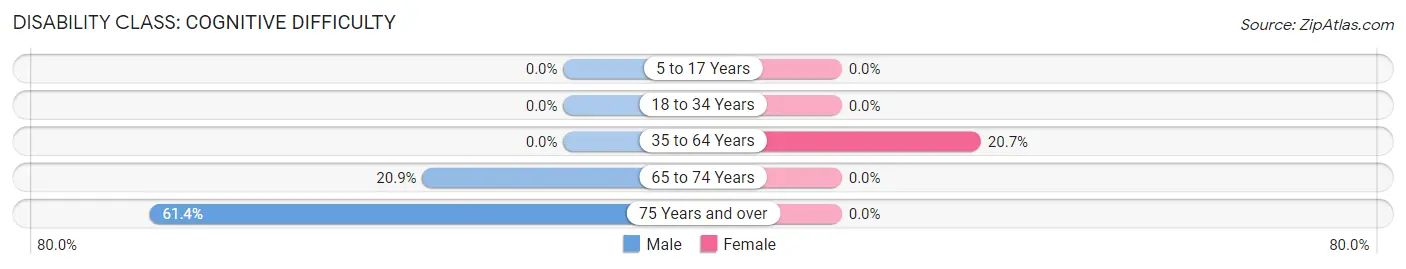
| Age Bracket | Male | Female |
| 5 to 17 Years | 0 (0.0%) | 0 (0.0%) |
| 18 to 34 Years | 0 (0.0%) | 0 (0.0%) |
| 35 to 64 Years | 0 (0.0%) | 63 (20.7%) |
| 65 to 74 Years | 36 (20.9%) | 0 (0.0%) |
| 75 Years and over | 43 (61.4%) | 0 (0.0%) |
Disability Class: Ambulatory Difficulty
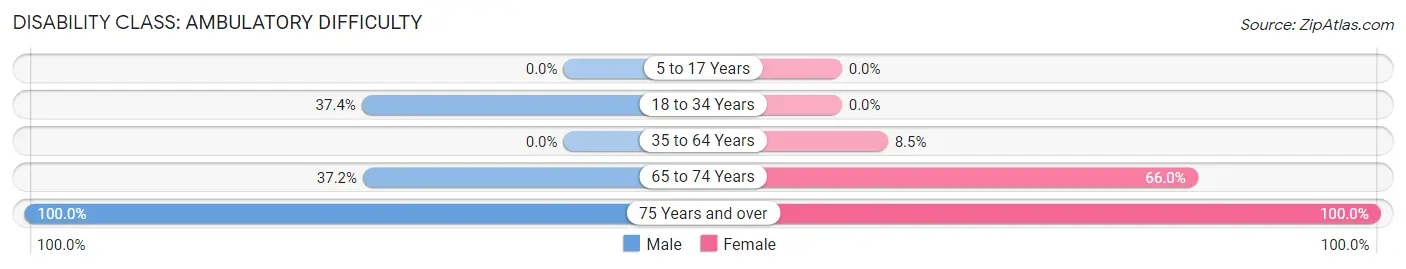
| Age Bracket | Male | Female |
| 5 to 17 Years | 0 (0.0%) | 0 (0.0%) |
| 18 to 34 Years | 82 (37.4%) | 0 (0.0%) |
| 35 to 64 Years | 0 (0.0%) | 26 (8.5%) |
| 65 to 74 Years | 64 (37.2%) | 35 (66.0%) |
| 75 Years and over | 70 (100.0%) | 43 (100.0%) |
Disability Class: Self-Care Difficulty
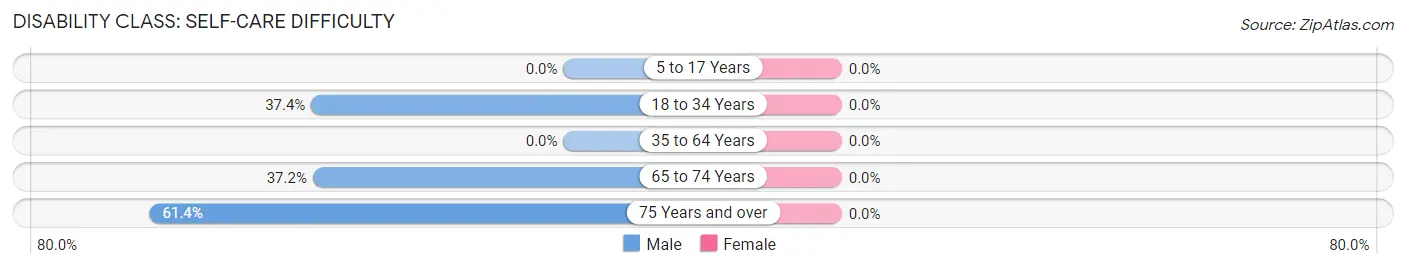
| Age Bracket | Male | Female |
| 5 to 17 Years | 0 (0.0%) | 0 (0.0%) |
| 18 to 34 Years | 82 (37.4%) | 0 (0.0%) |
| 35 to 64 Years | 0 (0.0%) | 0 (0.0%) |
| 65 to 74 Years | 64 (37.2%) | 0 (0.0%) |
| 75 Years and over | 43 (61.4%) | 0 (0.0%) |
Technology Access in El Mango
Computing Device Access in El Mango
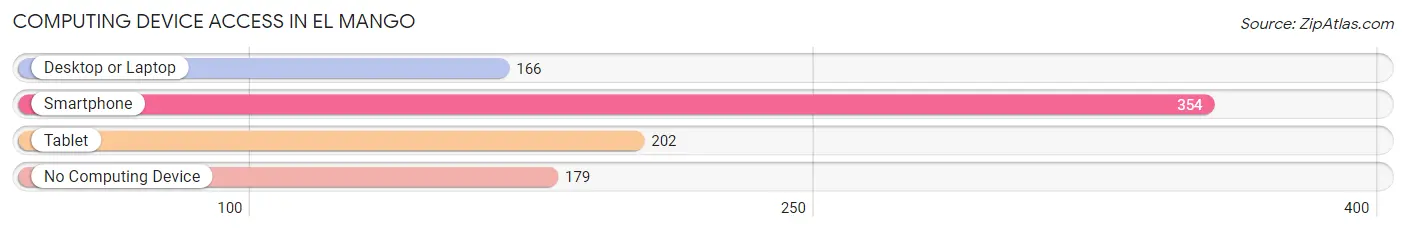
| Device Type | # Households | % Households |
| Desktop or Laptop | 166 | 31.1% |
| Smartphone | 354 | 66.4% |
| Tablet | 202 | 37.9% |
| No Computing Device | 179 | 33.6% |
| Total | 533 | 100.0% |
Internet Access in El Mango
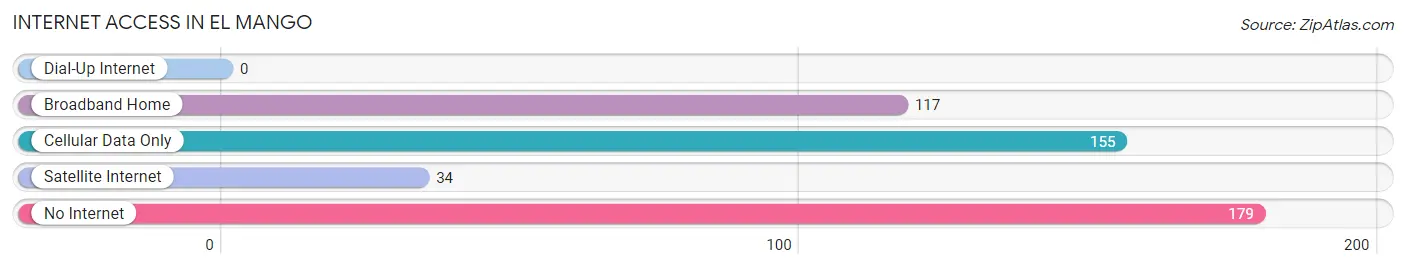
| Internet Type | # Households | % Households |
| Dial-Up Internet | 0 | 0.0% |
| Broadband Home | 117 | 22.0% |
| Cellular Data Only | 155 | 29.1% |
| Satellite Internet | 34 | 6.4% |
| No Internet | 179 | 33.6% |
| Total | 533 | 100.0% |
El Mango Summary
El Mango is a small municipality located in the northern region of Puerto Rico. It is part of the San Juan-Caguas-Guaynabo Metropolitan Statistical Area. The municipality is bordered by the municipalities of Toa Alta, Bayamón, Naranjito, and Corozal. El Mango is located in the northern part of the island, approximately 20 miles from San Juan, the capital of Puerto Rico.
Geography
El Mango is located in the northern region of Puerto Rico, in the San Juan-Caguas-Guaynabo Metropolitan Statistical Area. The municipality is bordered by the municipalities of Toa Alta, Bayamón, Naranjito, and Corozal. El Mango is located in the northern part of the island, approximately 20 miles from San Juan, the capital of Puerto Rico. The municipality has a total area of 8.2 square miles, of which 7.9 square miles is land and 0.3 square miles is water. The terrain is mostly flat, with some hills in the northern part of the municipality. The highest point in El Mango is Cerro El Mango, which is located in the northern part of the municipality and has an elevation of 1,000 feet.
History
El Mango was founded in 1820 by Don Juan de la Cruz, who named the town after the mango trees that grew in the area. The town was originally part of the municipality of Toa Alta, but was separated in 1824 and became its own municipality. During the 19th century, El Mango was an important agricultural center, producing coffee, sugar cane, and tobacco. In the early 20th century, the economy shifted to manufacturing, with the establishment of several factories in the area.
Economy
The economy of El Mango is largely based on manufacturing and agriculture. The municipality is home to several factories, including a pharmaceutical plant, a plastics factory, and a food processing plant. Agriculture is also an important part of the economy, with the production of coffee, sugar cane, and tobacco. The municipality also has a growing tourism industry, with several hotels and resorts located in the area.
Demographics
As of the 2010 census, El Mango had a population of 8,945. The population is mostly of Puerto Rican descent, with a small percentage of other ethnicities. The median household income in El Mango is $20,845, and the median age is 38. The unemployment rate in El Mango is 8.3%, which is slightly higher than the national average.
Conclusion
El Mango is a small municipality located in the northern region of Puerto Rico. It is part of the San Juan-Caguas-Guaynabo Metropolitan Statistical Area and is bordered by the municipalities of Toa Alta, Bayamón, Naranjito, and Corozal. El Mango was founded in 1820 and has a total area of 8.2 square miles. The economy of El Mango is largely based on manufacturing and agriculture, and the municipality also has a growing tourism industry. As of the 2010 census, El Mango had a population of 8,945, with a median household income of $20,845 and a median age of 38.
Common Questions
What is Per Capita Income in El Mango?
Per Capita income in El Mango is $17,138.
What is the Median Family Income in El Mango?
Median Family Income in El Mango is $42,750.
What is the Median Household income in El Mango?
Median Household Income in El Mango is $26,394.
What is Income or Wage Gap in El Mango?
Income or Wage Gap in El Mango is 55.6%.
Women in El Mango earn 44.4 cents for every dollar earned by a man.
What is Inequality or Gini Index in El Mango?
Inequality or Gini Index in El Mango is 0.52.
What is the Total Population of El Mango?
Total Population of El Mango is 1,648.
What is the Total Male Population of El Mango?
Total Male Population of El Mango is 1,019.
What is the Total Female Population of El Mango?
Total Female Population of El Mango is 629.
What is the Ratio of Males per 100 Females in El Mango?
There are 162.00 Males per 100 Females in El Mango.
What is the Ratio of Females per 100 Males in El Mango?
There are 61.73 Females per 100 Males in El Mango.
What is the Median Population Age in El Mango?
Median Population Age in El Mango is 44.6 Years.
What is the Average Family Size in El Mango
Average Family Size in El Mango is 3.8 People.
What is the Average Household Size in El Mango
Average Household Size in El Mango is 3.0 People.
How Large is the Labor Force in El Mango?
There are 840 People in the Labor Forcein in El Mango.
What is the Percentage of People in the Labor Force in El Mango?
56.9% of People are in the Labor Force in El Mango.
What is the Unemployment Rate in El Mango?
Unemployment Rate in El Mango is 31.8%.