Bartolo, PR Map & Demographics
Bartolo Map
Bartolo Overview
$7,483
PER CAPITA INCOME
$17,847
AVG FAMILY INCOME
$15,274
AVG HOUSEHOLD INCOME
30.2%
WAGE / INCOME GAP [ % ]
69.8¢/ $1
WAGE / INCOME GAP [ $ ]
$14,225
FAMILY INCOME DEFICIT
0.46
INEQUALITY / GINI INDEX
1,304
TOTAL POPULATION
605
MALE POPULATION
699
FEMALE POPULATION
86.55
MALES / 100 FEMALES
115.54
FEMALES / 100 MALES
42.2
MEDIAN AGE
3.7
AVG FAMILY SIZE
3.1
AVG HOUSEHOLD SIZE
617
LABOR FORCE [ PEOPLE ]
54.3%
PERCENT IN LABOR FORCE
53.8%
UNEMPLOYMENT RATE
Income in Bartolo
Income Overview in Bartolo
Per Capita Income in Bartolo is $7,483, while median incomes of families and households are $17,847 and $15,274 respectively.
| Characteristic | Number | Measure |
| Per Capita Income | 1,304 | $7,483 |
| Median Family Income | 331 | $17,847 |
| Mean Family Income | 331 | $22,436 |
| Median Household Income | 425 | $15,274 |
| Mean Household Income | 425 | $20,903 |
| Income Deficit | 331 | $14,225 |
| Wage / Income Gap (%) | 1,304 | 30.21% |
| Wage / Income Gap ($) | 1,304 | 69.79¢ per $1 |
| Gini / Inequality Index | 1,304 | 0.46 |
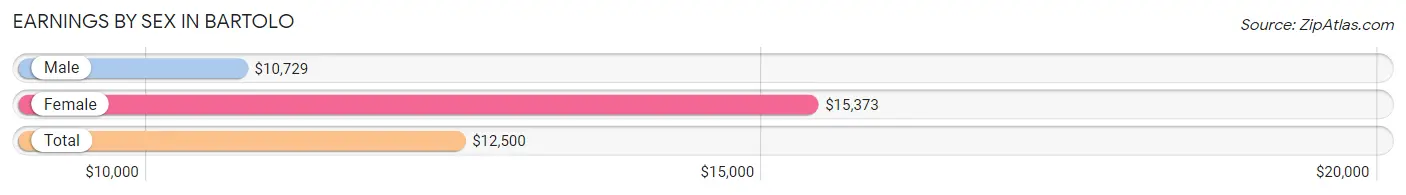
Earnings by Sex in Bartolo
Average Earnings in Bartolo are $12,500, $10,729 for men and $15,373 for women, a difference of 30.2%.
| Sex | Number | Average Earnings |
| Male | 181 (42.7%) | $10,729 |
| Female | 243 (57.3%) | $15,373 |
| Total | 424 (100.0%) | $12,500 |
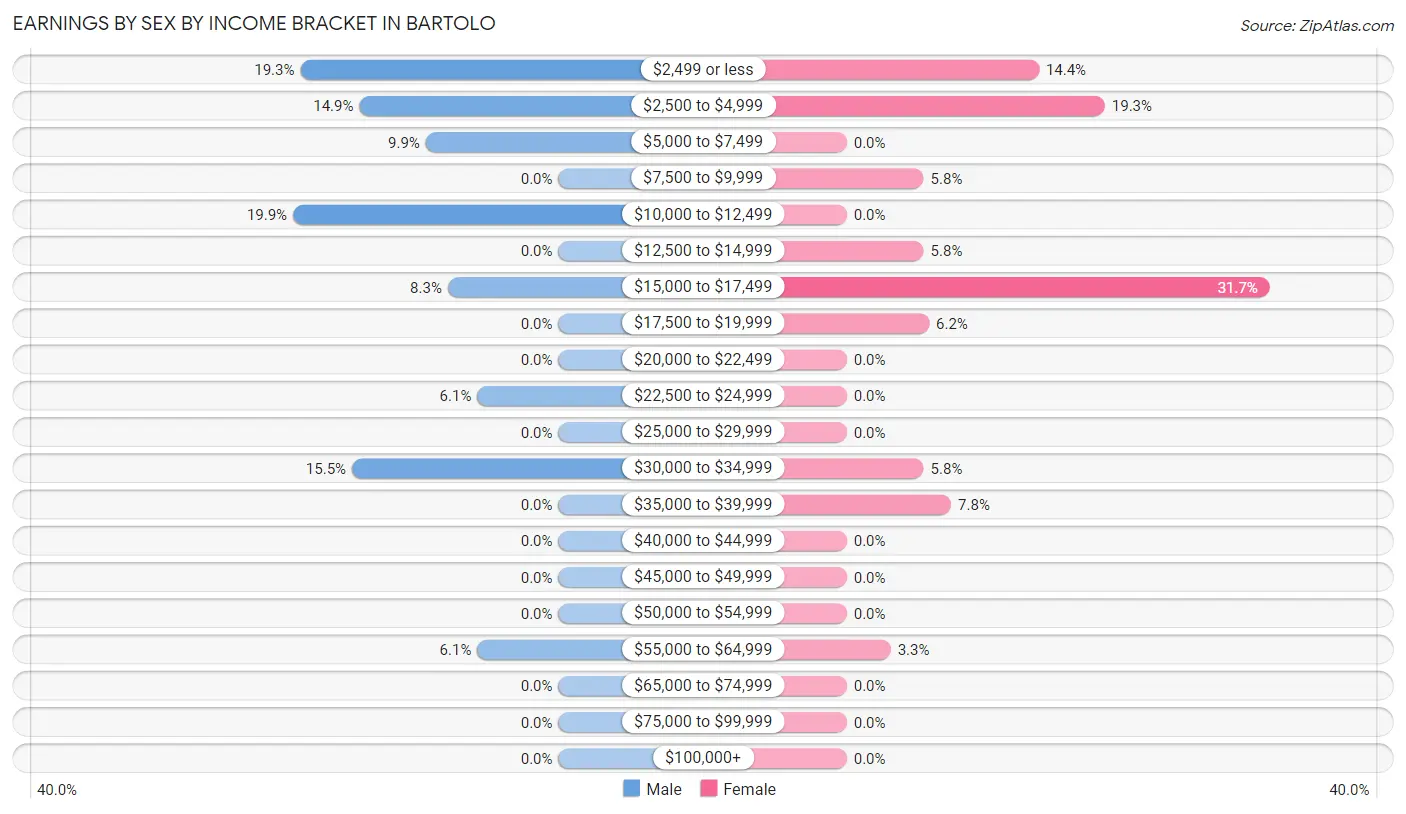
Earnings by Sex by Income Bracket in Bartolo
The most common earnings brackets in Bartolo are $10,000 to $12,499 for men (36 | 19.9%) and $15,000 to $17,499 for women (77 | 31.7%).
| Income | Male | Female |
| $2,499 or less | 35 (19.3%) | 35 (14.4%) |
| $2,500 to $4,999 | 27 (14.9%) | 47 (19.3%) |
| $5,000 to $7,499 | 18 (9.9%) | 0 (0.0%) |
| $7,500 to $9,999 | 0 (0.0%) | 14 (5.8%) |
| $10,000 to $12,499 | 36 (19.9%) | 0 (0.0%) |
| $12,500 to $14,999 | 0 (0.0%) | 14 (5.8%) |
| $15,000 to $17,499 | 15 (8.3%) | 77 (31.7%) |
| $17,500 to $19,999 | 0 (0.0%) | 15 (6.2%) |
| $20,000 to $22,499 | 0 (0.0%) | 0 (0.0%) |
| $22,500 to $24,999 | 11 (6.1%) | 0 (0.0%) |
| $25,000 to $29,999 | 0 (0.0%) | 0 (0.0%) |
| $30,000 to $34,999 | 28 (15.5%) | 14 (5.8%) |
| $35,000 to $39,999 | 0 (0.0%) | 19 (7.8%) |
| $40,000 to $44,999 | 0 (0.0%) | 0 (0.0%) |
| $45,000 to $49,999 | 0 (0.0%) | 0 (0.0%) |
| $50,000 to $54,999 | 0 (0.0%) | 0 (0.0%) |
| $55,000 to $64,999 | 11 (6.1%) | 8 (3.3%) |
| $65,000 to $74,999 | 0 (0.0%) | 0 (0.0%) |
| $75,000 to $99,999 | 0 (0.0%) | 0 (0.0%) |
| $100,000+ | 0 (0.0%) | 0 (0.0%) |
| Total | 181 (100.0%) | 243 (100.0%) |
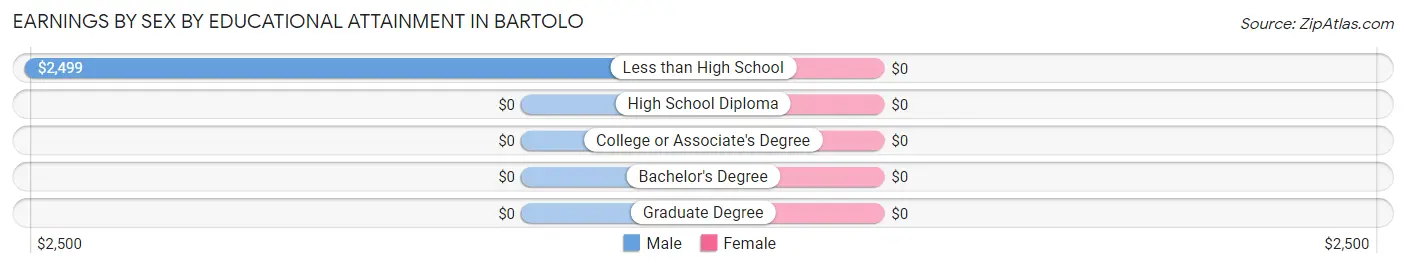
Earnings by Sex by Educational Attainment in Bartolo
| Educational Attainment | Male Income | Female Income |
| Less than High School | $2,499 | $0 |
| High School Diploma | - | - |
| College or Associate's Degree | - | - |
| Bachelor's Degree | - | - |
| Graduate Degree | - | - |
| Total | - | - |
Family Income in Bartolo
Family Income Brackets in Bartolo
According to the Bartolo family income data, there are 111 families falling into the less than $10,000 income range, which is the most common income bracket and makes up 33.5% of all families.
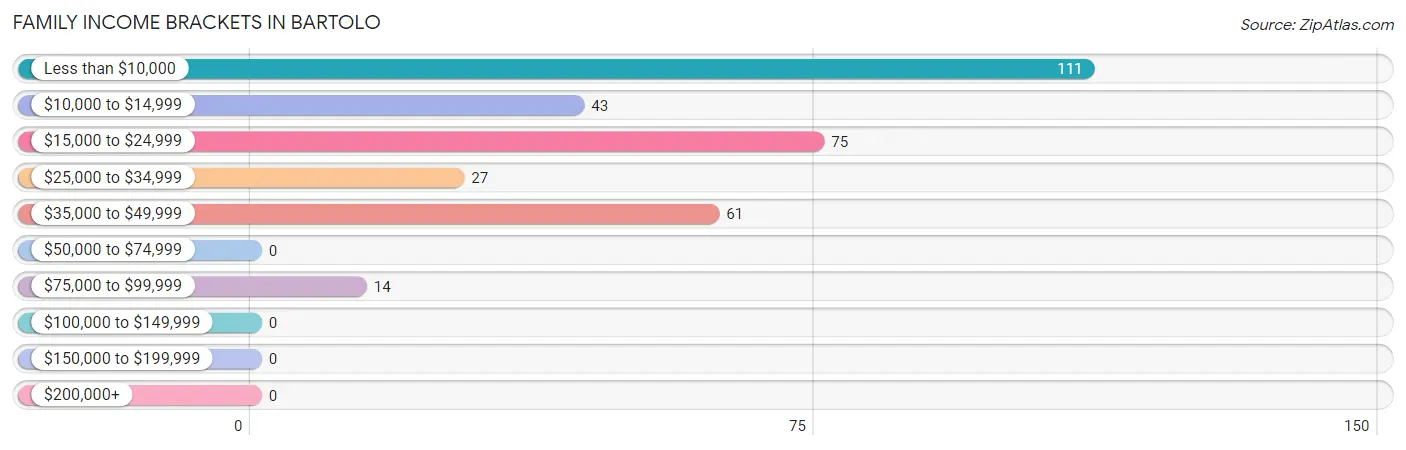
| Income Bracket | # Families | % Families |
| Less than $10,000 | 111 | 33.5% |
| $10,000 to $14,999 | 43 | 13.0% |
| $15,000 to $24,999 | 75 | 22.7% |
| $25,000 to $34,999 | 27 | 8.2% |
| $35,000 to $49,999 | 61 | 18.4% |
| $50,000 to $74,999 | 0 | 0.0% |
| $75,000 to $99,999 | 14 | 4.2% |
| $100,000 to $149,999 | 0 | 0.0% |
| $150,000 to $199,999 | 0 | 0.0% |
| $200,000+ | 0 | 0.0% |
Family Income by Famaliy Size in Bartolo
3-person families (61 | 18.4%) account for the highest median family income in Bartolo with $31,435 per family, while 3-person families (61 | 18.4%) have the highest median income of $10,478 per family member.
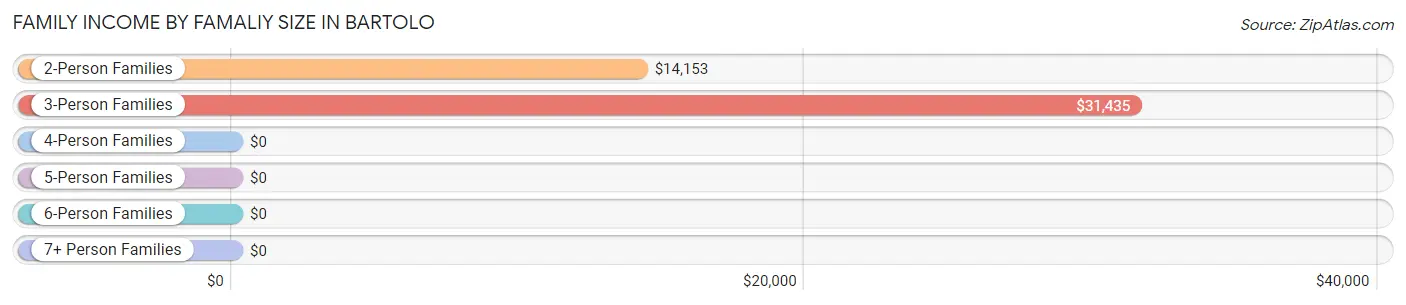
| Income Bracket | # Families | Median Income |
| 2-Person Families | 163 (49.2%) | $14,153 |
| 3-Person Families | 61 (18.4%) | $31,435 |
| 4-Person Families | 99 (29.9%) | $0 |
| 5-Person Families | 0 (0.0%) | $0 |
| 6-Person Families | 0 (0.0%) | $0 |
| 7+ Person Families | 8 (2.4%) | $0 |
| Total | 331 (100.0%) | $17,847 |
Family Income by Number of Earners in Bartolo
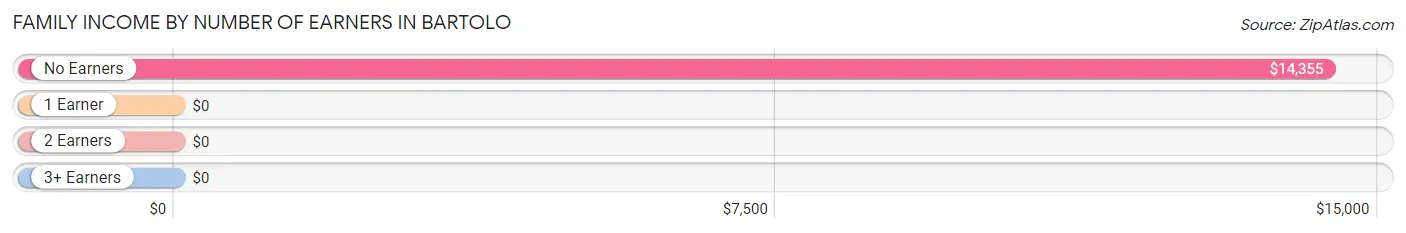
| Number of Earners | # Families | Median Income |
| No Earners | 132 (39.9%) | $14,355 |
| 1 Earner | 119 (35.9%) | $0 |
| 2 Earners | 52 (15.7%) | $0 |
| 3+ Earners | 28 (8.5%) | $0 |
| Total | 331 (100.0%) | $17,847 |
Household Income in Bartolo
Household Income Brackets in Bartolo
With 153 households falling in the category, the less than $10,000 income range is the most frequent in Bartolo, accounting for 36.0% of all households.
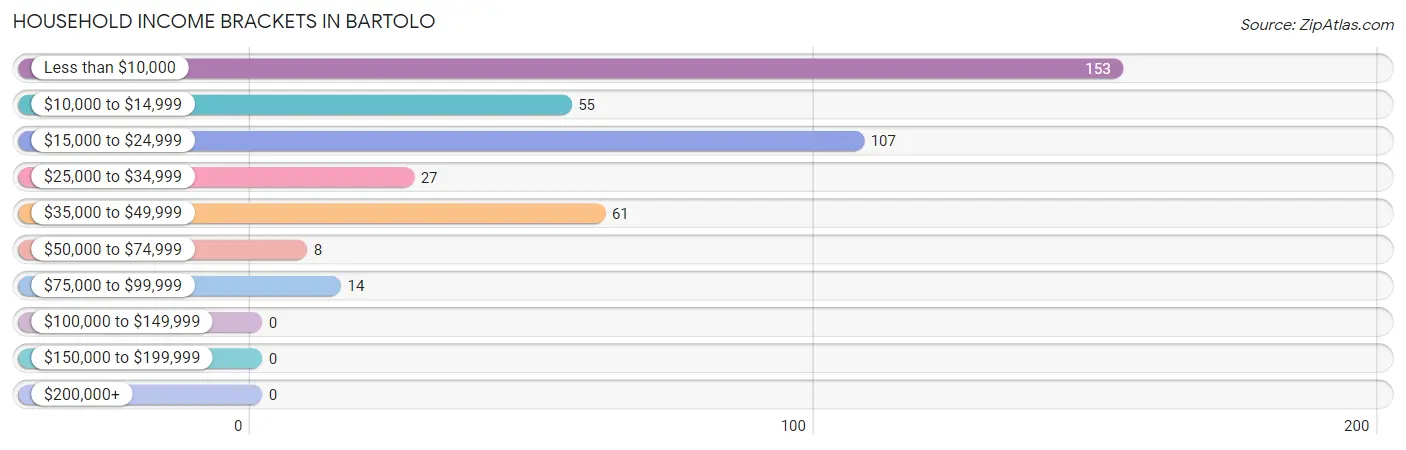
| Income Bracket | # Households | % Households |
| Less than $10,000 | 153 | 36.0% |
| $10,000 to $14,999 | 55 | 12.9% |
| $15,000 to $24,999 | 107 | 25.2% |
| $25,000 to $34,999 | 27 | 6.4% |
| $35,000 to $49,999 | 61 | 14.4% |
| $50,000 to $74,999 | 8 | 1.9% |
| $75,000 to $99,999 | 14 | 3.3% |
| $100,000 to $149,999 | 0 | 0.0% |
| $150,000 to $199,999 | 0 | 0.0% |
| $200,000+ | 0 | 0.0% |
Household Income by Householder Age in Bartolo
The median household income in Bartolo is $15,274, with the highest median household income of $16,296 found in the 65+ years age bracket for the primary householder. A total of 198 households (46.6%) fall into this category.
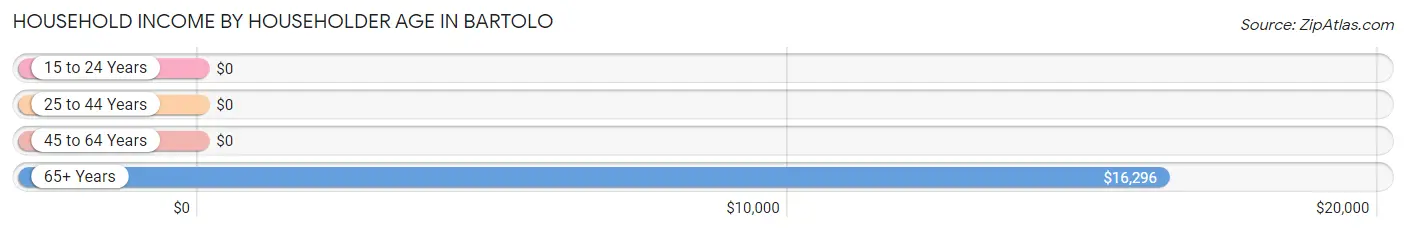
| Income Bracket | # Households | Median Income |
| 15 to 24 Years | 0 (0.0%) | $0 |
| 25 to 44 Years | 79 (18.6%) | $0 |
| 45 to 64 Years | 148 (34.8%) | $0 |
| 65+ Years | 198 (46.6%) | $16,296 |
| Total | 425 (100.0%) | $15,274 |
Poverty in Bartolo
Income Below Poverty by Sex and Age in Bartolo
With 58.2% poverty level for males and 55.4% for females among the residents of Bartolo, under 5 year old males and under 5 year old females are the most vulnerable to poverty, with 10 males (100.0%) and 48 females (100.0%) in their respective age groups living below the poverty level.
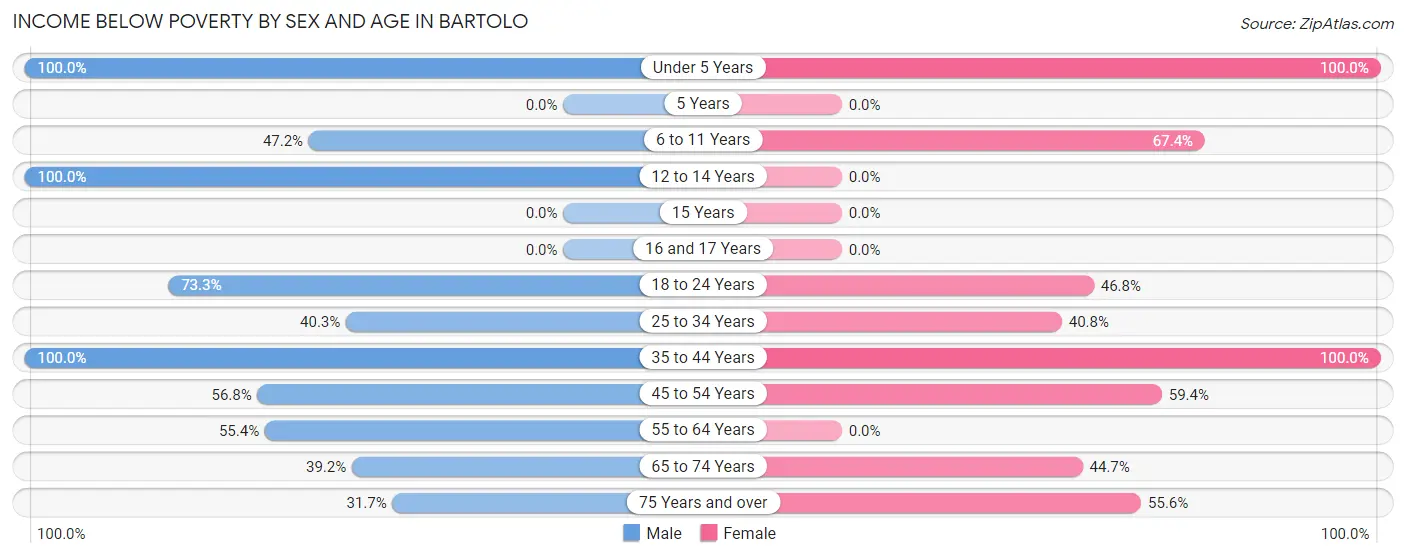
| Age Bracket | Male | Female |
| Under 5 Years | 10 (100.0%) | 48 (100.0%) |
| 5 Years | 0 (0.0%) | 0 (0.0%) |
| 6 to 11 Years | 17 (47.2%) | 31 (67.4%) |
| 12 to 14 Years | 13 (100.0%) | 0 (0.0%) |
| 15 Years | 0 (0.0%) | 0 (0.0%) |
| 16 and 17 Years | 0 (0.0%) | 0 (0.0%) |
| 18 to 24 Years | 55 (73.3%) | 58 (46.8%) |
| 25 to 34 Years | 25 (40.3%) | 49 (40.8%) |
| 35 to 44 Years | 79 (100.0%) | 30 (100.0%) |
| 45 to 54 Years | 84 (56.8%) | 79 (59.4%) |
| 55 to 64 Years | 36 (55.4%) | 0 (0.0%) |
| 65 to 74 Years | 20 (39.2%) | 42 (44.7%) |
| 75 Years and over | 13 (31.7%) | 50 (55.6%) |
| Total | 352 (58.2%) | 387 (55.4%) |
Income Above Poverty by Sex and Age in Bartolo
According to the poverty statistics in Bartolo, males aged 16 and 17 years and females aged 12 to 14 years are the age groups that are most secure financially, with 100.0% of males and 100.0% of females in these age groups living above the poverty line.
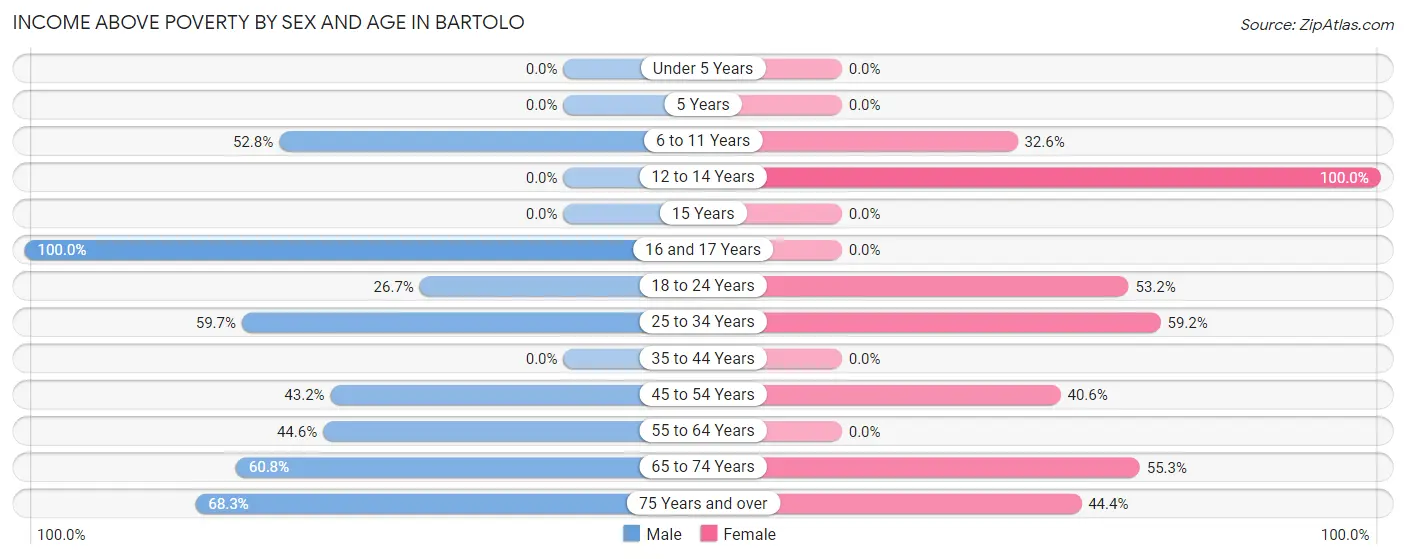
| Age Bracket | Male | Female |
| Under 5 Years | 0 (0.0%) | 0 (0.0%) |
| 5 Years | 0 (0.0%) | 0 (0.0%) |
| 6 to 11 Years | 19 (52.8%) | 15 (32.6%) |
| 12 to 14 Years | 0 (0.0%) | 14 (100.0%) |
| 15 Years | 0 (0.0%) | 0 (0.0%) |
| 16 and 17 Years | 25 (100.0%) | 0 (0.0%) |
| 18 to 24 Years | 20 (26.7%) | 66 (53.2%) |
| 25 to 34 Years | 37 (59.7%) | 71 (59.2%) |
| 35 to 44 Years | 0 (0.0%) | 0 (0.0%) |
| 45 to 54 Years | 64 (43.2%) | 54 (40.6%) |
| 55 to 64 Years | 29 (44.6%) | 0 (0.0%) |
| 65 to 74 Years | 31 (60.8%) | 52 (55.3%) |
| 75 Years and over | 28 (68.3%) | 40 (44.4%) |
| Total | 253 (41.8%) | 312 (44.6%) |
Income Below Poverty Among Married-Couple Families in Bartolo
The poverty statistics for married-couple families in Bartolo show that 45.9% or 90 of the total 196 families live below the poverty line. Families with 1 or 2 children have the highest poverty rate of 100.0%, comprising of 53 families. On the other hand, families with no children have the lowest poverty rate of 25.9%, which includes 37 families.
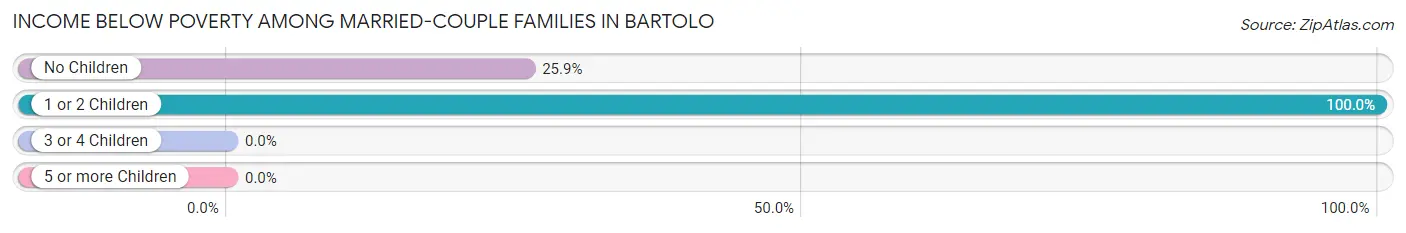
| Children | Above Poverty | Below Poverty |
| No Children | 106 (74.1%) | 37 (25.9%) |
| 1 or 2 Children | 0 (0.0%) | 53 (100.0%) |
| 3 or 4 Children | 0 (0.0%) | 0 (0.0%) |
| 5 or more Children | 0 (0.0%) | 0 (0.0%) |
| Total | 106 (54.1%) | 90 (45.9%) |
Income Below Poverty Among Single-Parent Households in Bartolo
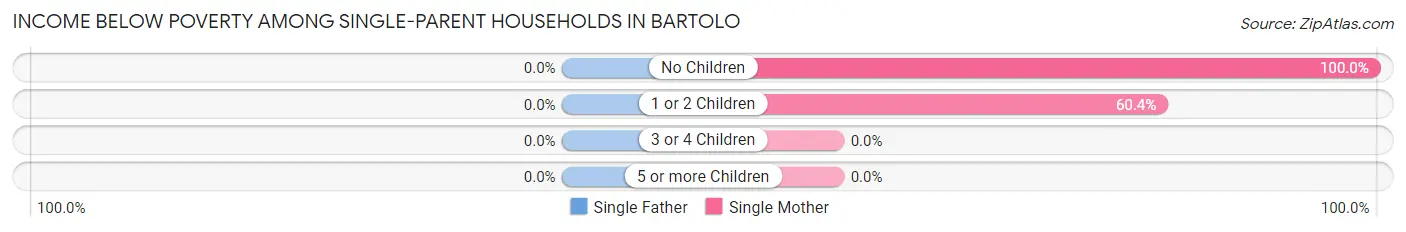
| Children | Single Father | Single Mother |
| No Children | 0 (0.0%) | 62 (100.0%) |
| 1 or 2 Children | 0 (0.0%) | 29 (60.4%) |
| 3 or 4 Children | 0 (0.0%) | 0 (0.0%) |
| 5 or more Children | 0 (0.0%) | 0 (0.0%) |
| Total | 0 (0.0%) | 91 (73.4%) |
Income Below Poverty Among Married-Couple vs Single-Parent Households in Bartolo
The poverty data for Bartolo shows that 90 of the married-couple family households (45.9%) and 91 of the single-parent households (67.4%) are living below the poverty level. Within the married-couple family households, those with 1 or 2 children have the highest poverty rate, with 53 households (100.0%) falling below the poverty line. Among the single-parent households, those with no children have the highest poverty rate, with 62 household (84.9%) living below poverty.
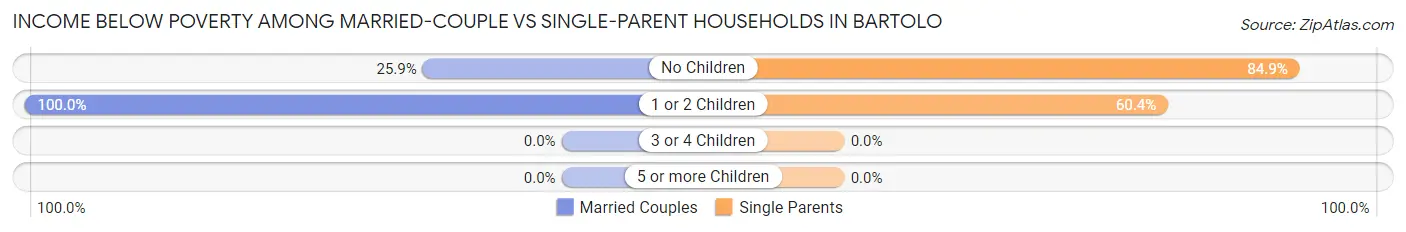
| Children | Married-Couple Families | Single-Parent Households |
| No Children | 37 (25.9%) | 62 (84.9%) |
| 1 or 2 Children | 53 (100.0%) | 29 (60.4%) |
| 3 or 4 Children | 0 (0.0%) | 0 (0.0%) |
| 5 or more Children | 0 (0.0%) | 0 (0.0%) |
| Total | 90 (45.9%) | 91 (67.4%) |
Race in Bartolo
The most populous races in Bartolo are Hispanic or Latino (1,304 | 100.0%), Some other Race (454 | 34.8%), and White / Caucasian (436 | 33.4%).
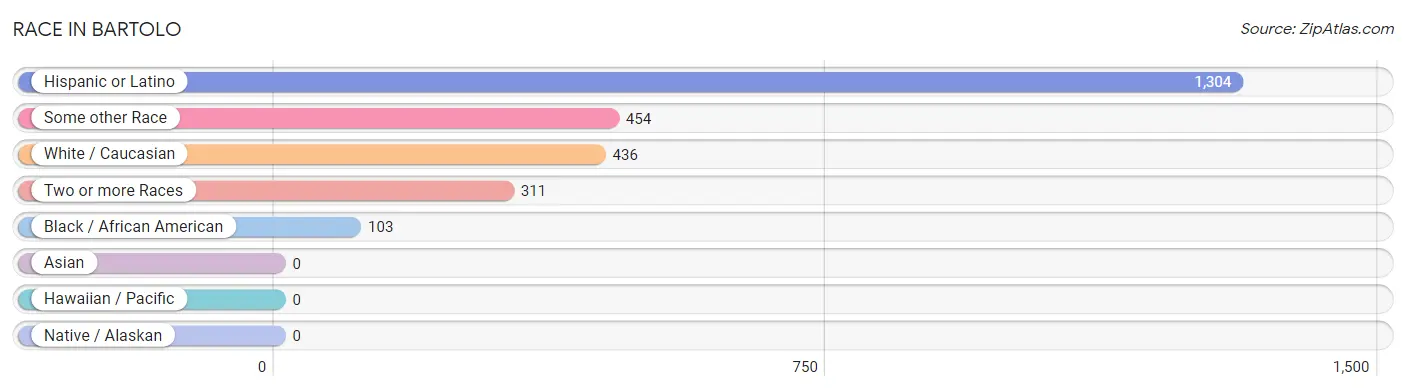
| Race | # Population | % Population |
| Asian | 0 | 0.0% |
| Black / African American | 103 | 7.9% |
| Hawaiian / Pacific | 0 | 0.0% |
| Hispanic or Latino | 1,304 | 100.0% |
| Native / Alaskan | 0 | 0.0% |
| White / Caucasian | 436 | 33.4% |
| Two or more Races | 311 | 23.8% |
| Some other Race | 454 | 34.8% |
| Total | 1,304 | 100.0% |
Ancestry in Bartolo
The most populous ancestries reported in Bartolo are , and Puerto Rican (1,304 | 100.0%), together accounting for 100.0% of all Bartolo residents.

| Ancestry | # Population | % Population |
| Puerto Rican | 1,304 | 100.0% | View All 1 Rows |
Immigrants in Bartolo

| Immigration Origin | # Population | % Population | View All 0 Rows |
Sex and Age in Bartolo
Sex and Age in Bartolo
The most populous age groups in Bartolo are 45 to 49 Years (148 | 24.5%) for men and 25 to 29 Years (106 | 15.2%) for women.
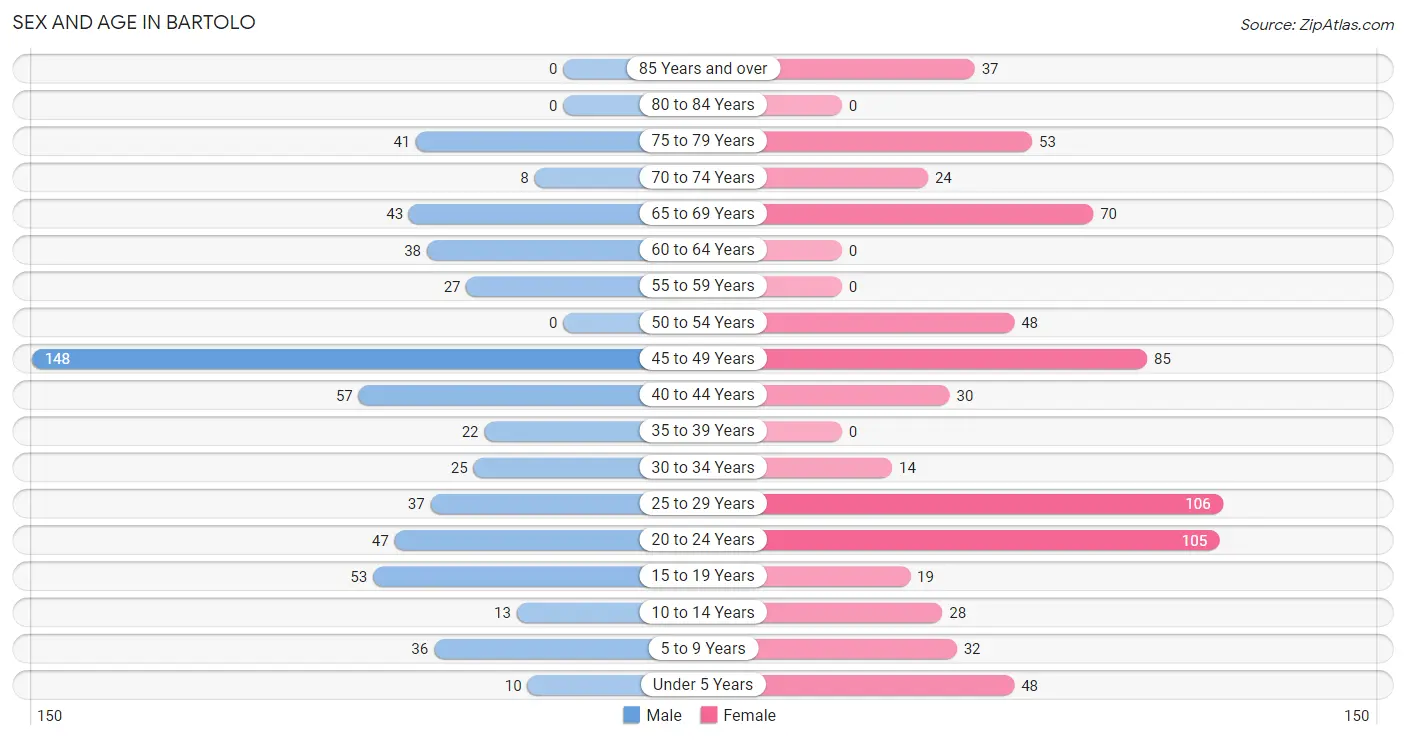
| Age Bracket | Male | Female |
| Under 5 Years | 10 (1.7%) | 48 (6.9%) |
| 5 to 9 Years | 36 (5.9%) | 32 (4.6%) |
| 10 to 14 Years | 13 (2.1%) | 28 (4.0%) |
| 15 to 19 Years | 53 (8.8%) | 19 (2.7%) |
| 20 to 24 Years | 47 (7.8%) | 105 (15.0%) |
| 25 to 29 Years | 37 (6.1%) | 106 (15.2%) |
| 30 to 34 Years | 25 (4.1%) | 14 (2.0%) |
| 35 to 39 Years | 22 (3.6%) | 0 (0.0%) |
| 40 to 44 Years | 57 (9.4%) | 30 (4.3%) |
| 45 to 49 Years | 148 (24.5%) | 85 (12.2%) |
| 50 to 54 Years | 0 (0.0%) | 48 (6.9%) |
| 55 to 59 Years | 27 (4.5%) | 0 (0.0%) |
| 60 to 64 Years | 38 (6.3%) | 0 (0.0%) |
| 65 to 69 Years | 43 (7.1%) | 70 (10.0%) |
| 70 to 74 Years | 8 (1.3%) | 24 (3.4%) |
| 75 to 79 Years | 41 (6.8%) | 53 (7.6%) |
| 80 to 84 Years | 0 (0.0%) | 0 (0.0%) |
| 85 Years and over | 0 (0.0%) | 37 (5.3%) |
| Total | 605 (100.0%) | 699 (100.0%) |
Families and Households in Bartolo
Median Family Size in Bartolo
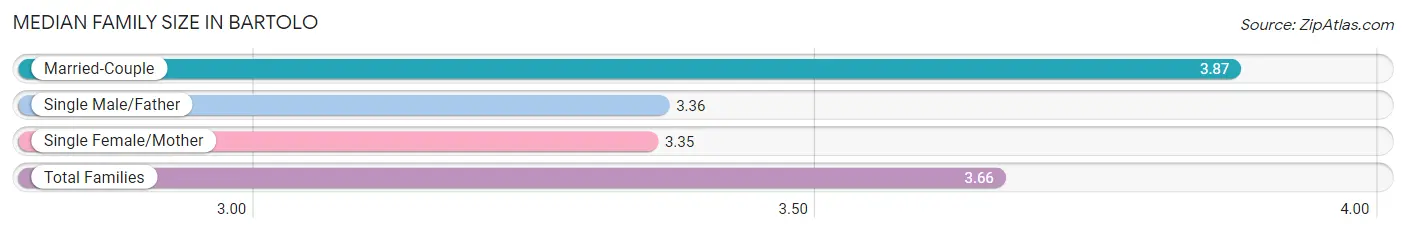
The median family size in Bartolo is 3.66 persons per family, with married-couple families (196 | 59.2%) accounting for the largest median family size of 3.87 persons per family. On the other hand, single female/mother families (124 | 37.5%) represent the smallest median family size with 3.35 persons per family.
| Family Type | # Families | Family Size |
| Married-Couple | 196 (59.2%) | 3.87 |
| Single Male/Father | 11 (3.3%) | 3.36 |
| Single Female/Mother | 124 (37.5%) | 3.35 |
| Total Families | 331 (100.0%) | 3.66 |
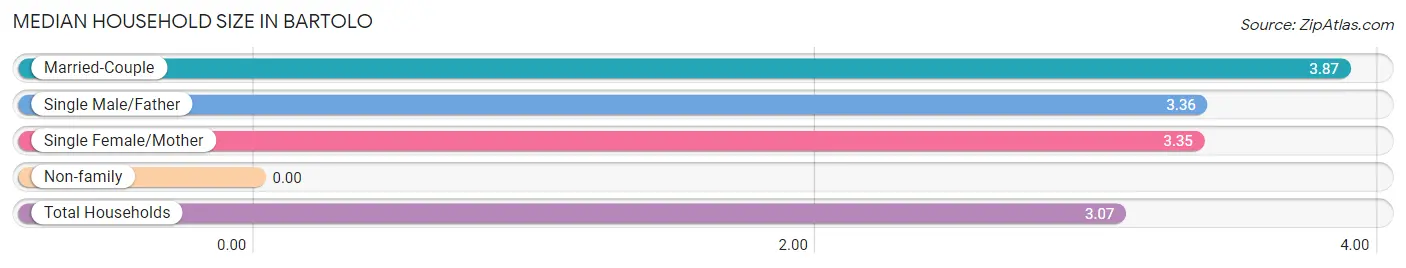
Median Household Size in Bartolo
| Household Type | # Households | Household Size |
| Married-Couple | 196 (46.1%) | 3.87 |
| Single Male/Father | 11 (2.6%) | 3.36 |
| Single Female/Mother | 124 (29.2%) | 3.35 |
| Non-family | 94 (22.1%) | - |
| Total Households | 425 (100.0%) | 3.07 |
Household Size by Marriage Status in Bartolo
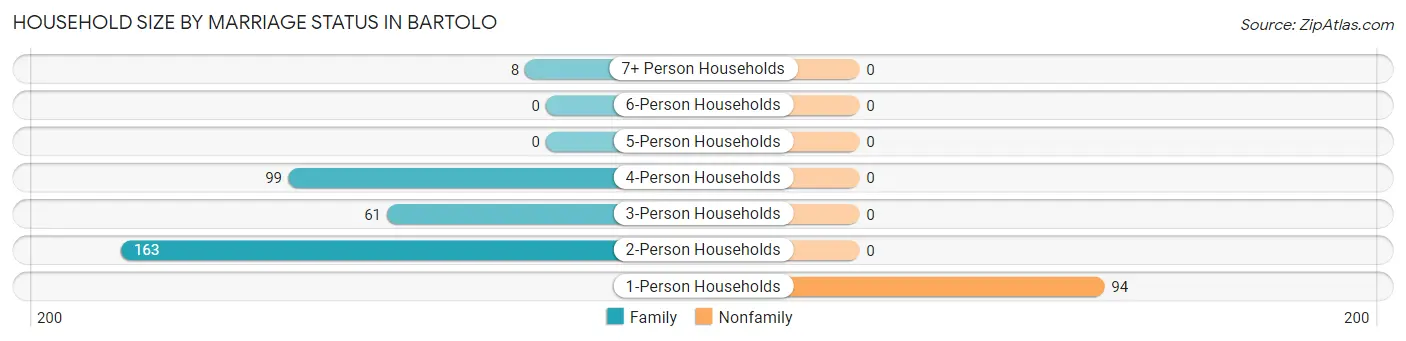
Out of a total of 425 households in Bartolo, 331 (77.9%) are family households, while 94 (22.1%) are nonfamily households. The most numerous type of family households are 2-person households, comprising 163, and the most common type of nonfamily households are 1-person households, comprising 94.
| Household Size | Family Households | Nonfamily Households |
| 1-Person Households | - | 94 (22.1%) |
| 2-Person Households | 163 (38.4%) | 0 (0.0%) |
| 3-Person Households | 61 (14.3%) | 0 (0.0%) |
| 4-Person Households | 99 (23.3%) | 0 (0.0%) |
| 5-Person Households | 0 (0.0%) | 0 (0.0%) |
| 6-Person Households | 0 (0.0%) | 0 (0.0%) |
| 7+ Person Households | 8 (1.9%) | 0 (0.0%) |
| Total | 331 (77.9%) | 94 (22.1%) |
Female Fertility in Bartolo
Fertility by Age in Bartolo
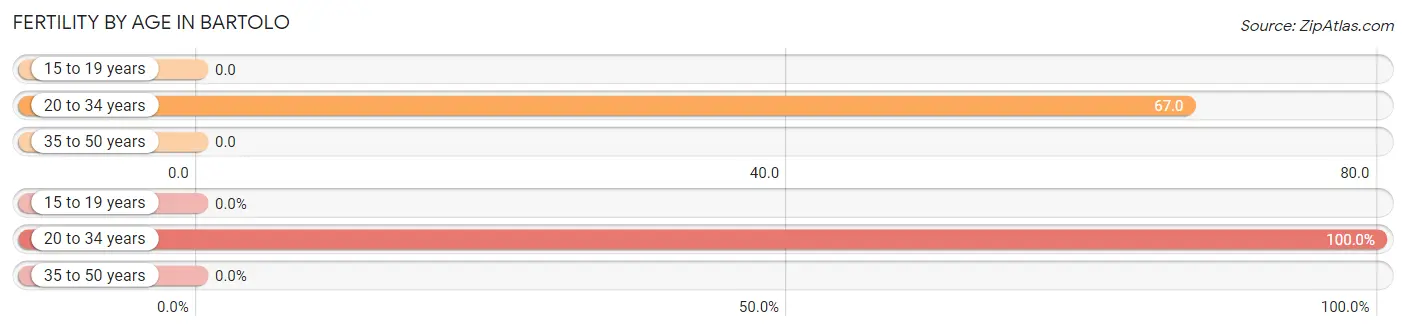
Average fertility rate in Bartolo is 42.0 births per 1,000 women. Women in the age bracket of 20 to 34 years have the highest fertility rate with 67.0 births per 1,000 women. Women in the age bracket of 20 to 34 years acount for 100.0% of all women with births.
| Age Bracket | Women with Births | Births / 1,000 Women |
| 15 to 19 years | 0 (0.0%) | 0.0 |
| 20 to 34 years | 15 (100.0%) | 67.0 |
| 35 to 50 years | 0 (0.0%) | 0.0 |
| Total | 15 (100.0%) | 42.0 |
Fertility by Age by Marriage Status in Bartolo
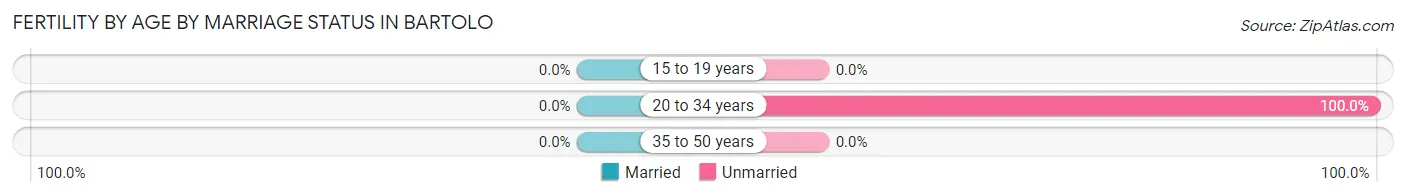
| Age Bracket | Married | Unmarried |
| 15 to 19 years | 0 (0.0%) | 0 (0.0%) |
| 20 to 34 years | 0 (0.0%) | 15 (100.0%) |
| 35 to 50 years | 0 (0.0%) | 0 (0.0%) |
| Total | 0 (0.0%) | 15 (100.0%) |
Fertility by Education in Bartolo
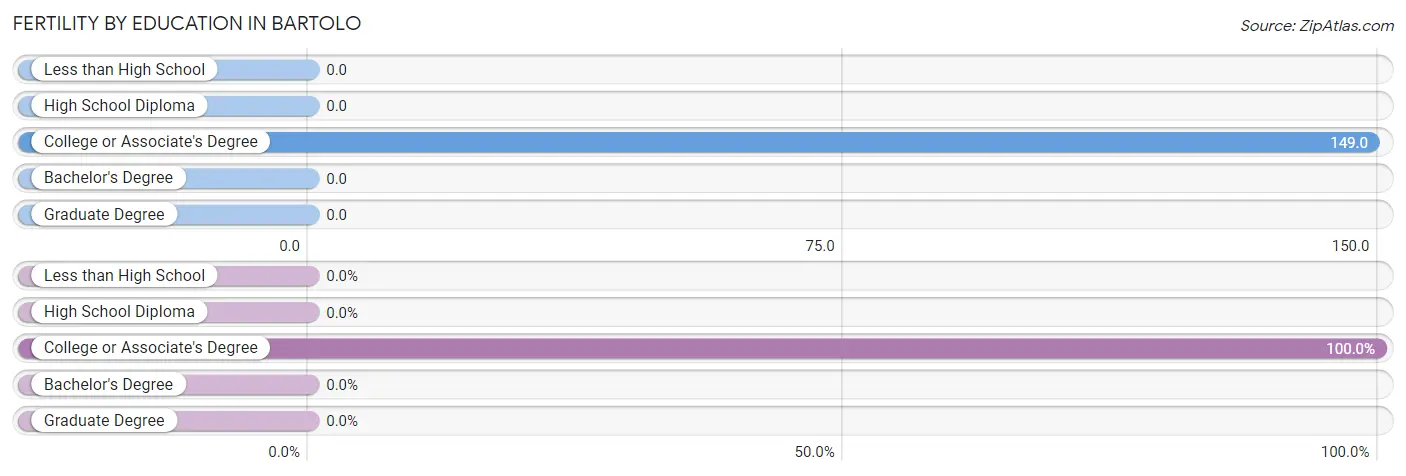
| Educational Attainment | Women with Births | Births / 1,000 Women |
| Less than High School | 0 (0.0%) | 0.0 |
| High School Diploma | 0 (0.0%) | 0.0 |
| College or Associate's Degree | 15 (100.0%) | 149.0 |
| Bachelor's Degree | 0 (0.0%) | 0.0 |
| Graduate Degree | 0 (0.0%) | 0.0 |
| Total | 15 (100.0%) | 42.0 |
Fertility by Education by Marriage Status in Bartolo
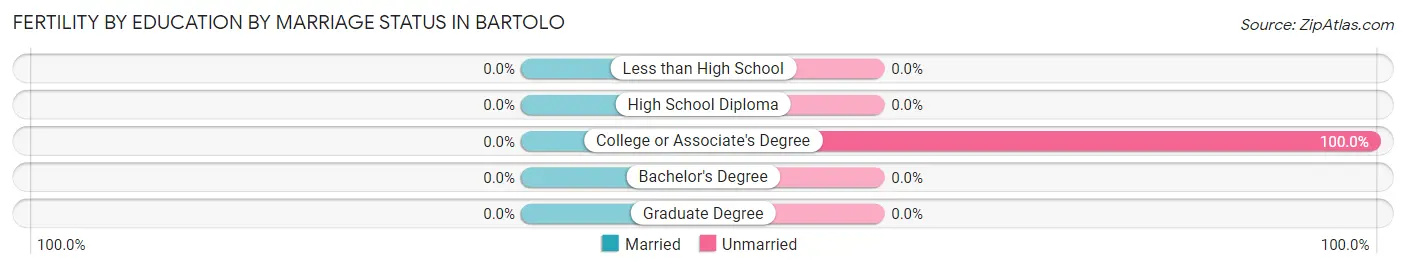
| Educational Attainment | Married | Unmarried |
| Less than High School | 0 (0.0%) | 0 (0.0%) |
| High School Diploma | 0 (0.0%) | 0 (0.0%) |
| College or Associate's Degree | 0 (0.0%) | 15 (100.0%) |
| Bachelor's Degree | 0 (0.0%) | 0 (0.0%) |
| Graduate Degree | 0 (0.0%) | 0 (0.0%) |
| Total | 0 (0.0%) | 15 (100.0%) |
Employment Characteristics in Bartolo
Employment by Class of Employer in Bartolo
Among the 270 employed individuals in Bartolo, private company employees (213 | 78.9%), self-employed (not incorporated) (29 | 10.7%), and not-for-profit organizations (20 | 7.4%) make up the most common classes of employment.
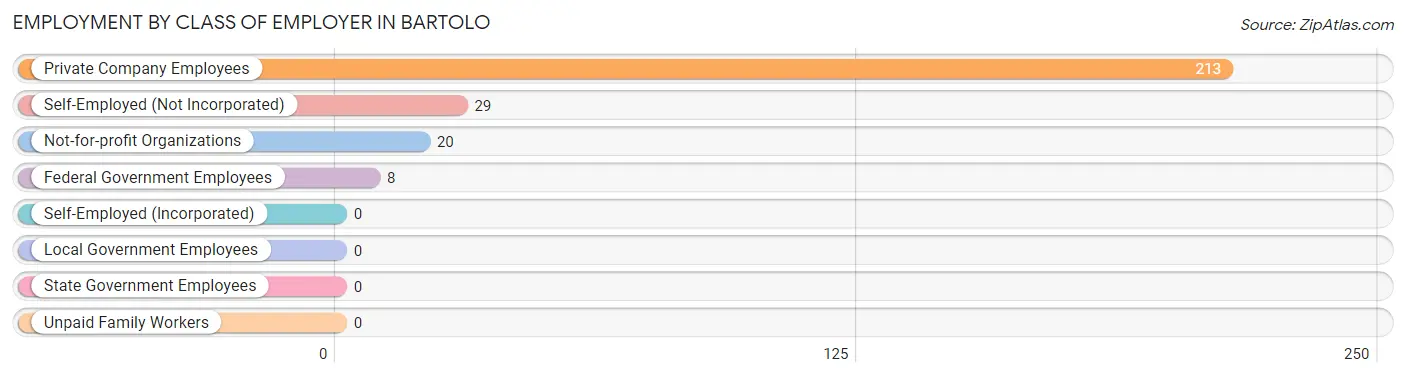
| Employer Class | # Employees | % Employees |
| Private Company Employees | 213 | 78.9% |
| Self-Employed (Incorporated) | 0 | 0.0% |
| Self-Employed (Not Incorporated) | 29 | 10.7% |
| Not-for-profit Organizations | 20 | 7.4% |
| Local Government Employees | 0 | 0.0% |
| State Government Employees | 0 | 0.0% |
| Federal Government Employees | 8 | 3.0% |
| Unpaid Family Workers | 0 | 0.0% |
| Total | 270 | 100.0% |
Employment Status by Age in Bartolo
According to the labor force statistics for Bartolo, out of the total population over 16 years of age (1,137), 54.3% or 617 individuals are in the labor force, with 53.8% or 332 of them unemployed. The age group with the highest labor force participation rate is 30 to 34 years, with 100.0% or 39 individuals in the labor force. Within the labor force, the 16 to 19 years age range has the highest percentage of unemployed individuals, with 100.0% or 28 of them being unemployed.
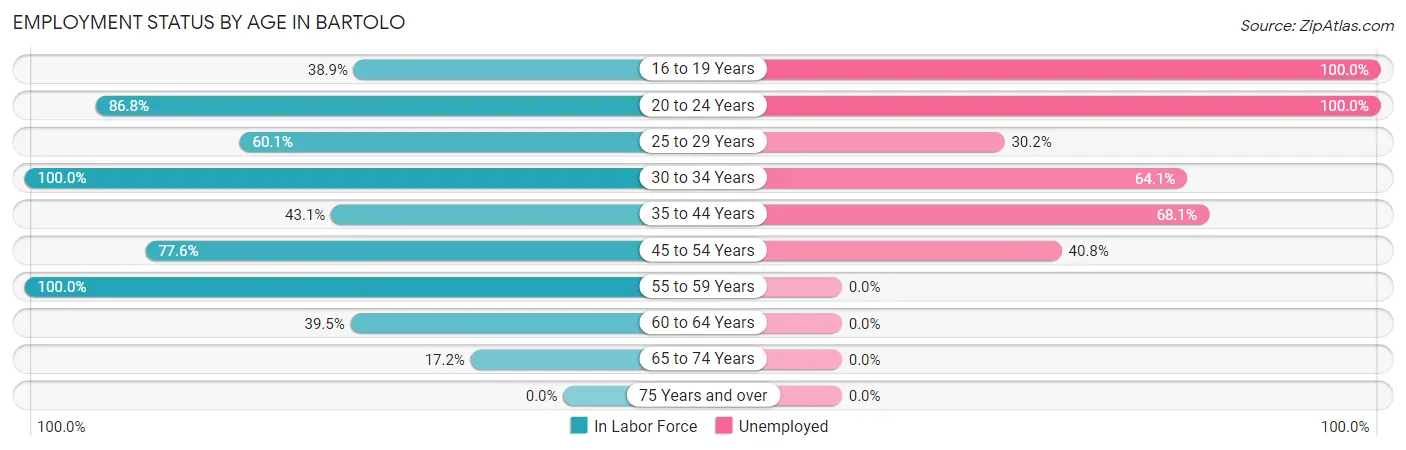
| Age Bracket | In Labor Force | Unemployed |
| 16 to 19 Years | 28 (38.9%) | 28 (100.0%) |
| 20 to 24 Years | 132 (86.8%) | 132 (100.0%) |
| 25 to 29 Years | 86 (60.1%) | 26 (30.2%) |
| 30 to 34 Years | 39 (100.0%) | 25 (64.1%) |
| 35 to 44 Years | 47 (43.1%) | 32 (68.1%) |
| 45 to 54 Years | 218 (77.6%) | 89 (40.8%) |
| 55 to 59 Years | 27 (100.0%) | 0 (0.0%) |
| 60 to 64 Years | 15 (39.5%) | 0 (0.0%) |
| 65 to 74 Years | 25 (17.2%) | 0 (0.0%) |
| 75 Years and over | 0 (0.0%) | 0 (0.0%) |
| Total | 617 (54.3%) | 332 (53.8%) |
Employment Status by Educational Attainment in Bartolo
According to labor force statistics for Bartolo, 67.8% of individuals (432) out of the total population between 25 and 64 years of age (637) are in the labor force, with 39.8% or 172 of them being unemployed. The group with the highest labor force participation rate are those with the educational attainment of college / associate degree, with 100.0% or 90 individuals in the labor force. Within the labor force, individuals with less than high school education have the highest percentage of unemployment, with 51.7% or 45 of them being unemployed.
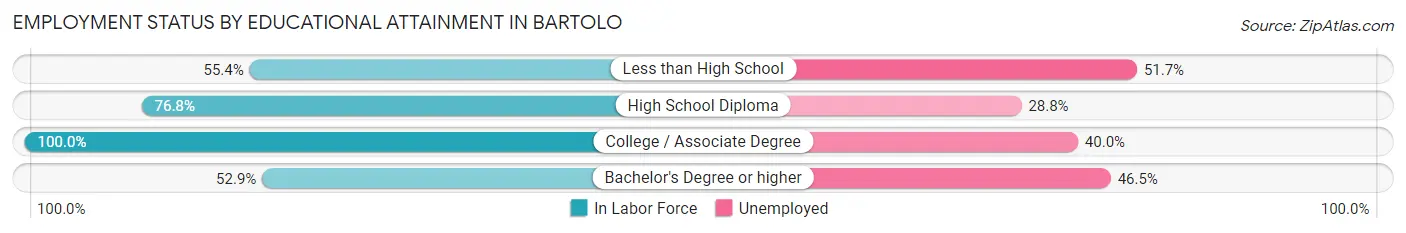
| Educational Attainment | In Labor Force | Unemployed |
| Less than High School | 87 (55.4%) | 81 (51.7%) |
| High School Diploma | 156 (76.8%) | 58 (28.8%) |
| College / Associate Degree | 90 (100.0%) | 36 (40.0%) |
| Bachelor's Degree or higher | 99 (52.9%) | 87 (46.5%) |
| Total | 432 (67.8%) | 254 (39.8%) |
Employment Occupations by Sex in Bartolo
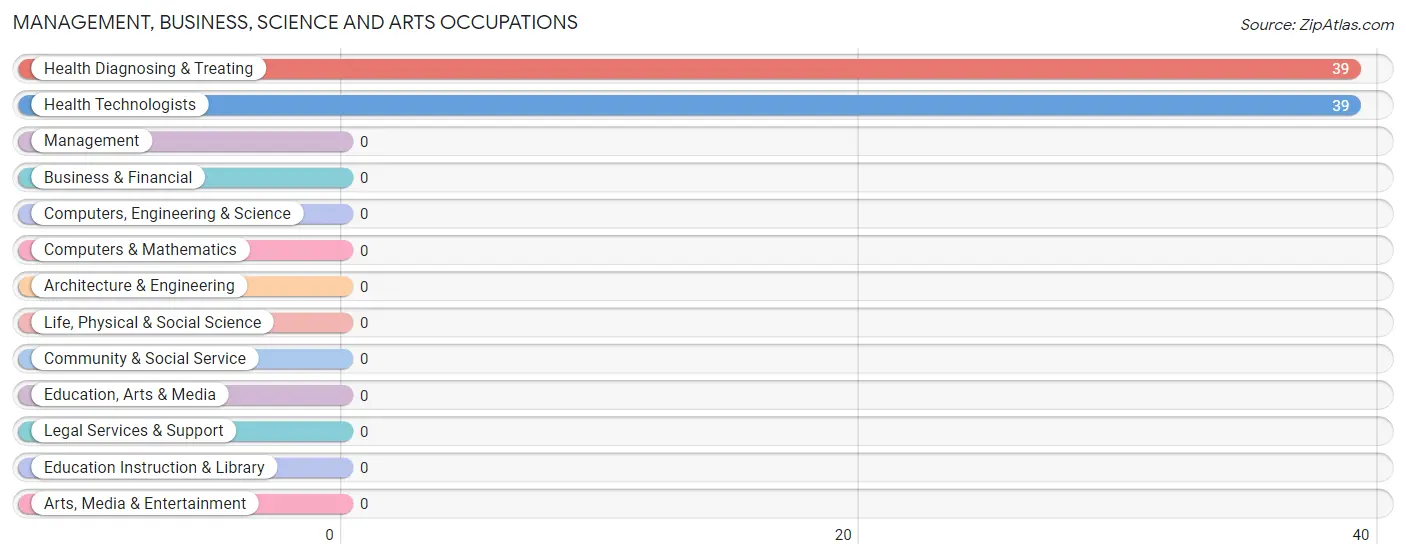
Management, Business, Science and Arts Occupations
The most common Management, Business, Science and Arts occupations in Bartolo are Health Diagnosing & Treating (39 | 13.7%), and Health Technologists (39 | 13.7%).
Management, Business, Science and Arts Occupations by Sex
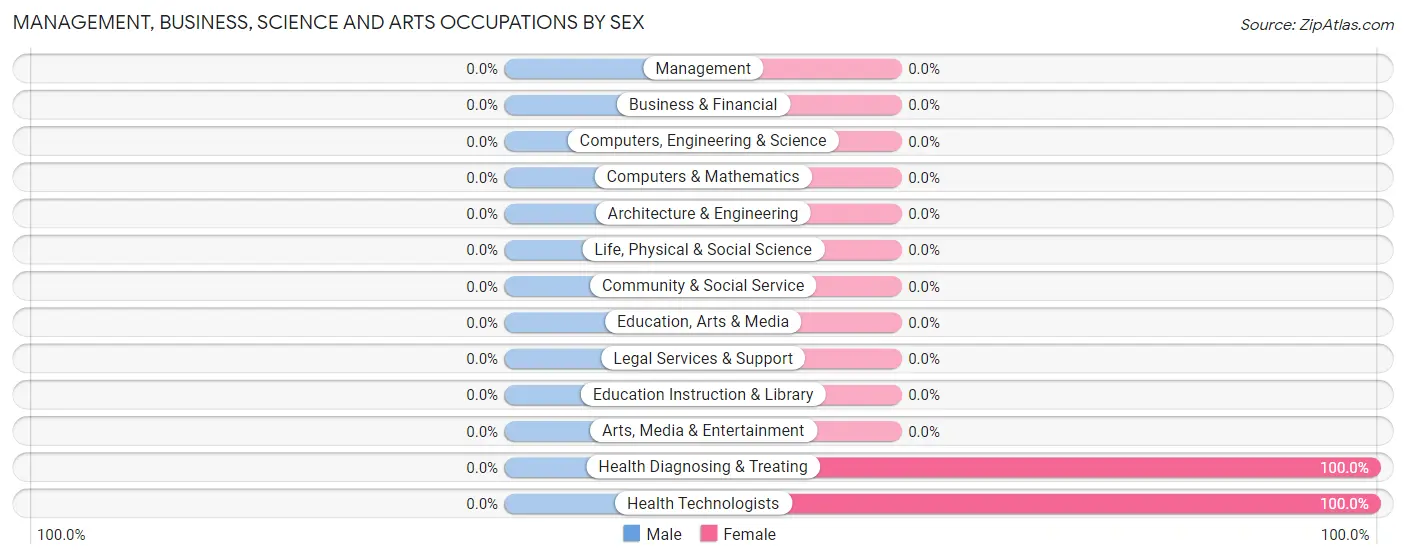
| Occupation | Male | Female |
| Management | 0 (0.0%) | 0 (0.0%) |
| Business & Financial | 0 (0.0%) | 0 (0.0%) |
| Computers, Engineering & Science | 0 (0.0%) | 0 (0.0%) |
| Computers & Mathematics | 0 (0.0%) | 0 (0.0%) |
| Architecture & Engineering | 0 (0.0%) | 0 (0.0%) |
| Life, Physical & Social Science | 0 (0.0%) | 0 (0.0%) |
| Community & Social Service | 0 (0.0%) | 0 (0.0%) |
| Education, Arts & Media | 0 (0.0%) | 0 (0.0%) |
| Legal Services & Support | 0 (0.0%) | 0 (0.0%) |
| Education Instruction & Library | 0 (0.0%) | 0 (0.0%) |
| Arts, Media & Entertainment | 0 (0.0%) | 0 (0.0%) |
| Health Diagnosing & Treating | 0 (0.0%) | 39 (100.0%) |
| Health Technologists | 0 (0.0%) | 39 (100.0%) |
| Total (Category) | 0 (0.0%) | 39 (100.0%) |
| Total (Overall) | 146 (51.2%) | 139 (48.8%) |
Services Occupations
The most common Services occupations in Bartolo are Cleaning & Maintenance (40 | 14.0%), Food Preparation & Serving (15 | 5.3%), and Personal Care & Service (15 | 5.3%).
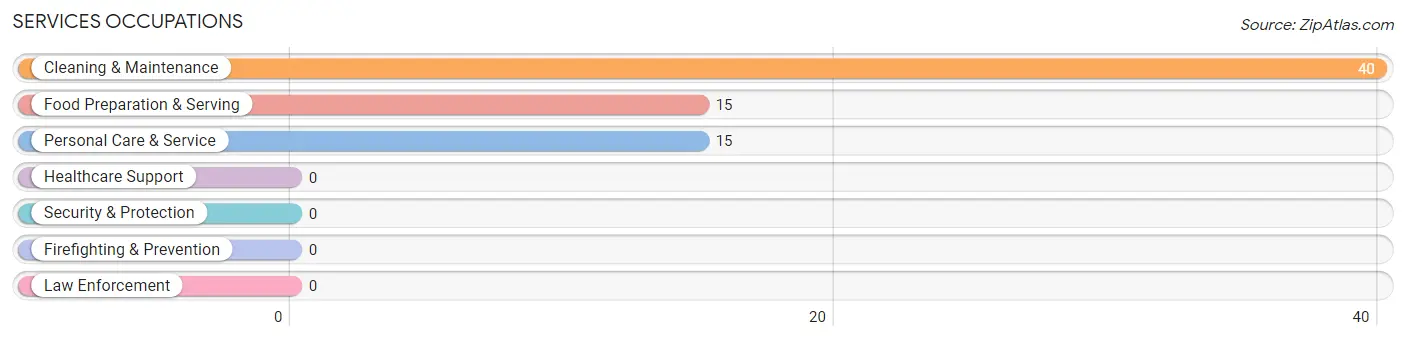
Services Occupations by Sex
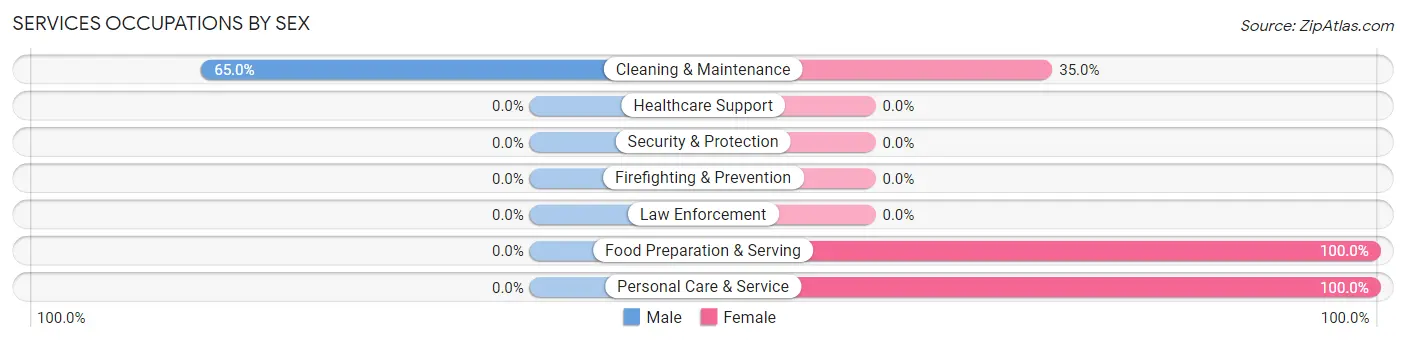
| Occupation | Male | Female |
| Healthcare Support | 0 (0.0%) | 0 (0.0%) |
| Security & Protection | 0 (0.0%) | 0 (0.0%) |
| Firefighting & Prevention | 0 (0.0%) | 0 (0.0%) |
| Law Enforcement | 0 (0.0%) | 0 (0.0%) |
| Food Preparation & Serving | 0 (0.0%) | 15 (100.0%) |
| Cleaning & Maintenance | 26 (65.0%) | 14 (35.0%) |
| Personal Care & Service | 0 (0.0%) | 15 (100.0%) |
| Total (Category) | 26 (37.1%) | 44 (62.9%) |
| Total (Overall) | 146 (51.2%) | 139 (48.8%) |
Sales and Office Occupations
The most common Sales and Office occupations in Bartolo are , and Office & Administration (36 | 12.6%).
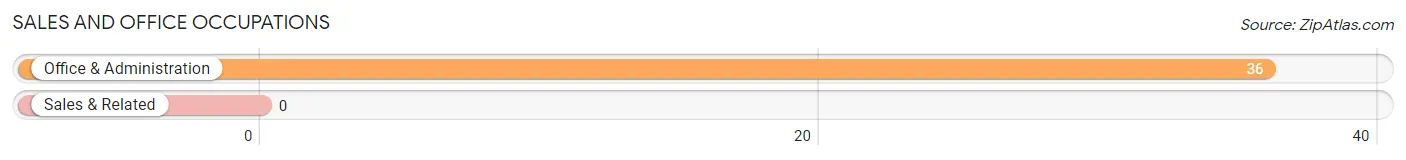
Sales and Office Occupations by Sex
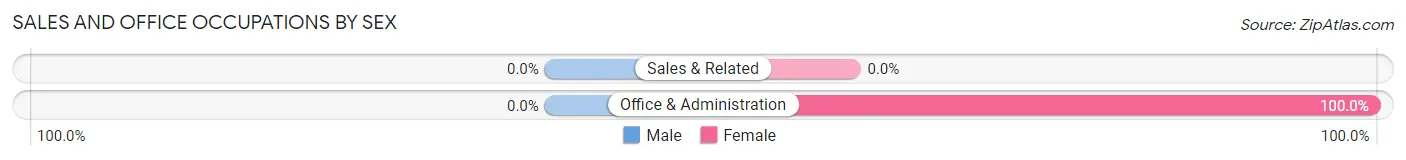
| Occupation | Male | Female |
| Sales & Related | 0 (0.0%) | 0 (0.0%) |
| Office & Administration | 0 (0.0%) | 36 (100.0%) |
| Total (Category) | 0 (0.0%) | 36 (100.0%) |
| Total (Overall) | 146 (51.2%) | 139 (48.8%) |
Natural Resources, Construction and Maintenance Occupations
The most common Natural Resources, Construction and Maintenance occupations in Bartolo are Construction & Extraction (45 | 15.8%), and Installation, Maintenance & Repair (11 | 3.9%).
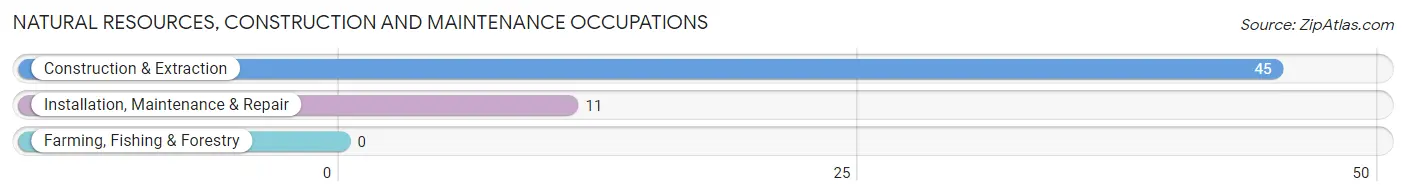
Natural Resources, Construction and Maintenance Occupations by Sex
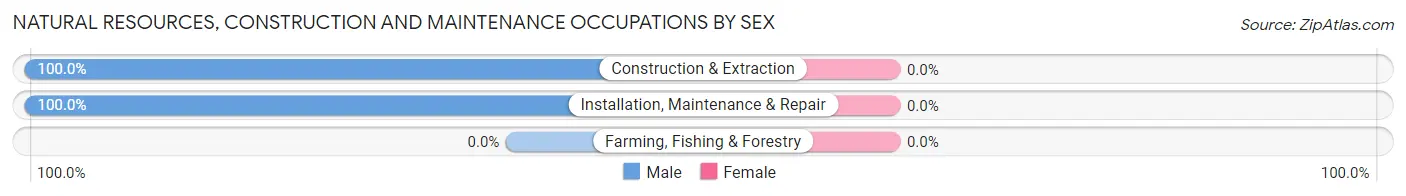
| Occupation | Male | Female |
| Farming, Fishing & Forestry | 0 (0.0%) | 0 (0.0%) |
| Construction & Extraction | 45 (100.0%) | 0 (0.0%) |
| Installation, Maintenance & Repair | 11 (100.0%) | 0 (0.0%) |
| Total (Category) | 56 (100.0%) | 0 (0.0%) |
| Total (Overall) | 146 (51.2%) | 139 (48.8%) |
Production, Transportation and Moving Occupations
The most common Production, Transportation and Moving occupations in Bartolo are Transportation (48 | 16.8%), and Production (36 | 12.6%).
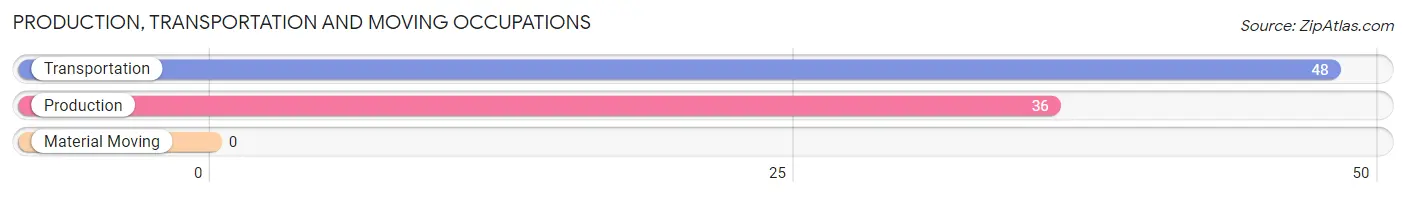
Production, Transportation and Moving Occupations by Sex
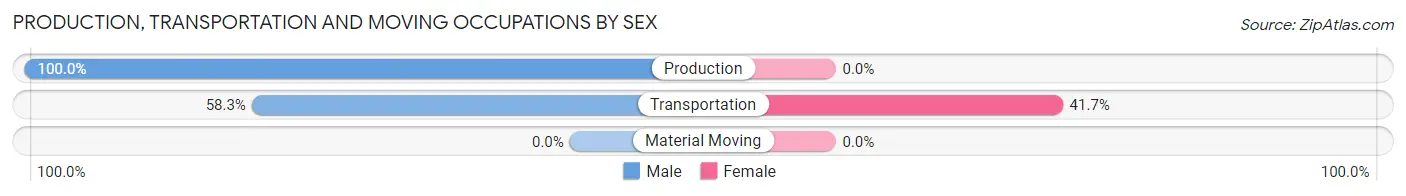
| Occupation | Male | Female |
| Production | 36 (100.0%) | 0 (0.0%) |
| Transportation | 28 (58.3%) | 20 (41.7%) |
| Material Moving | 0 (0.0%) | 0 (0.0%) |
| Total (Category) | 64 (76.2%) | 20 (23.8%) |
| Total (Overall) | 146 (51.2%) | 139 (48.8%) |
Employment Industries by Sex in Bartolo
Employment Industries in Bartolo
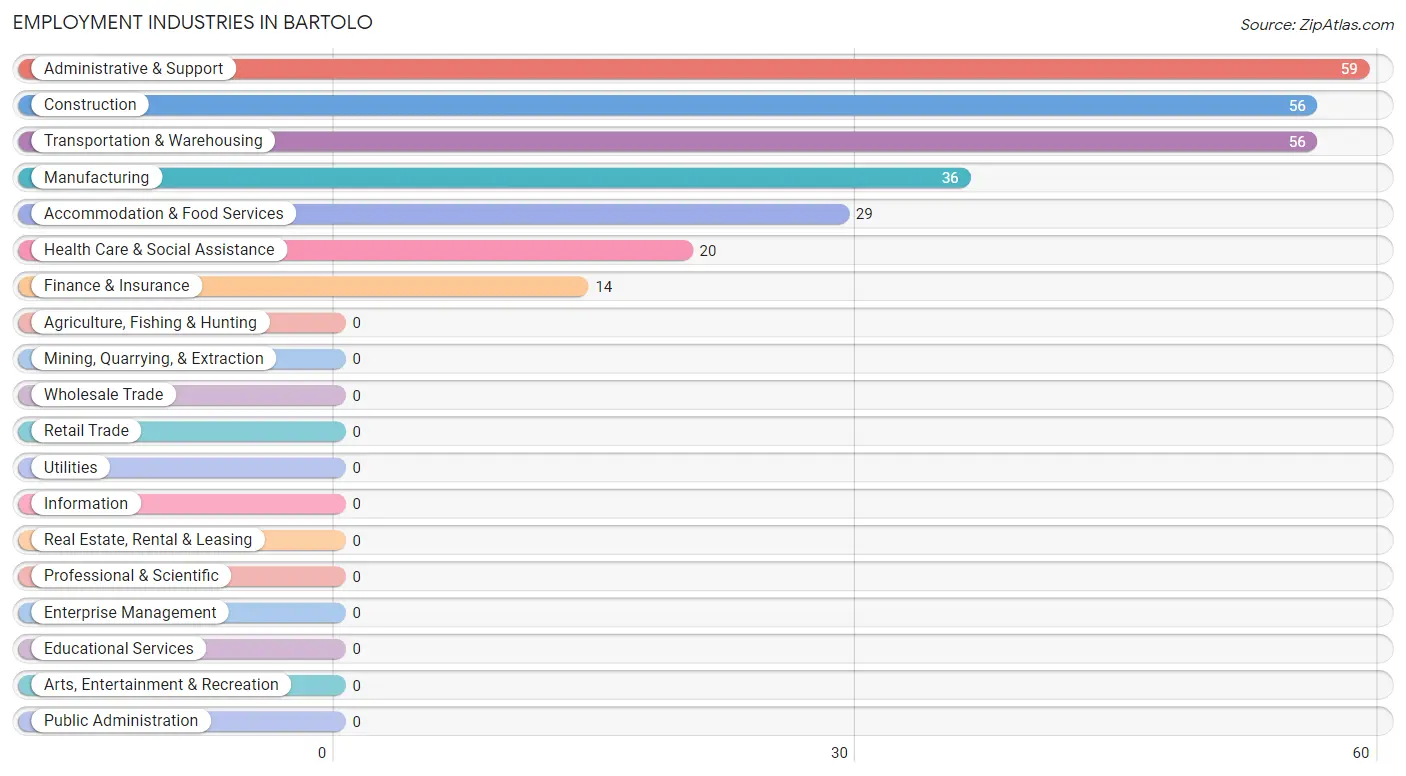
The major employment industries in Bartolo include Administrative & Support (59 | 20.7%), Construction (56 | 19.7%), Transportation & Warehousing (56 | 19.7%), Manufacturing (36 | 12.6%), and Accommodation & Food Services (29 | 10.2%).
Employment Industries by Sex in Bartolo
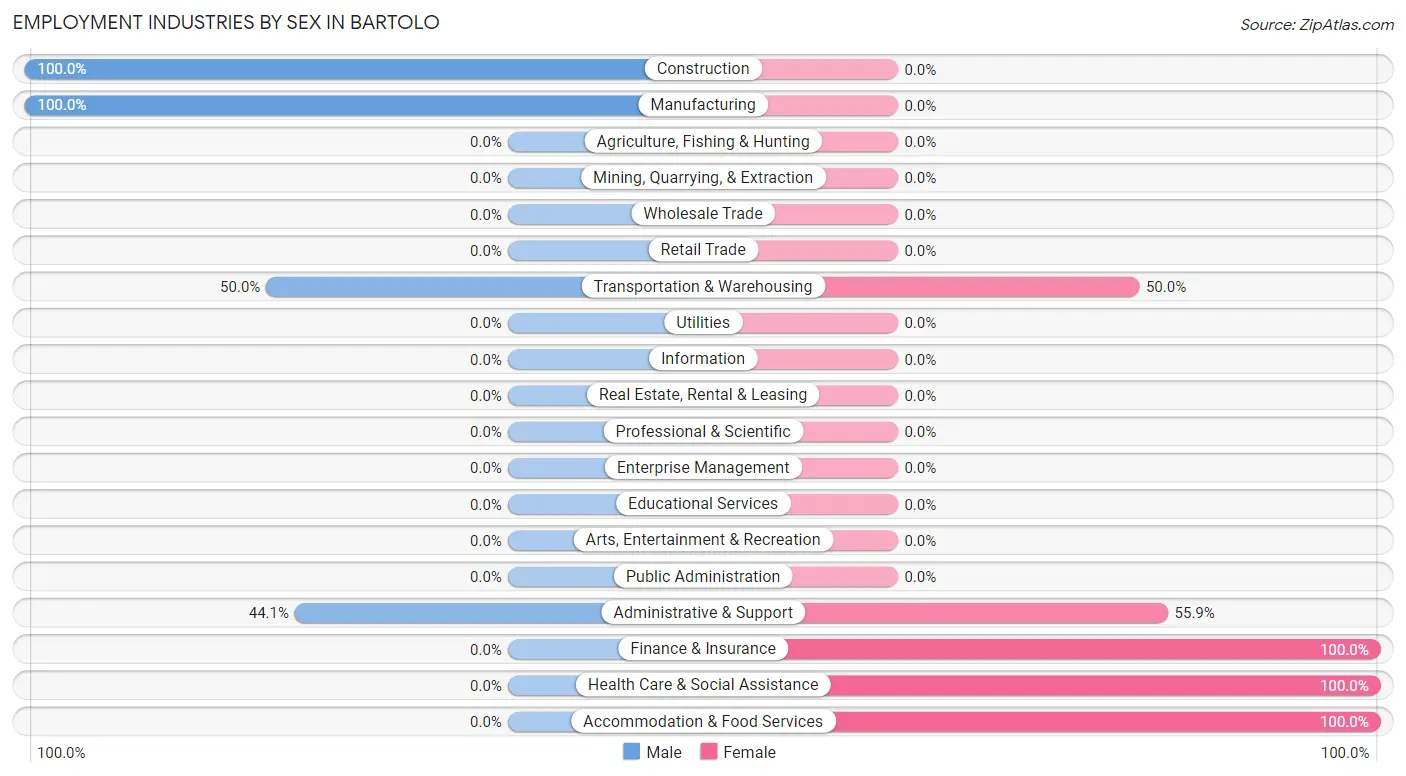
The Bartolo industries that see more men than women are Construction (100.0%), Manufacturing (100.0%), and Transportation & Warehousing (50.0%), whereas the industries that tend to have a higher number of women are Finance & Insurance (100.0%), Health Care & Social Assistance (100.0%), and Accommodation & Food Services (100.0%).
| Industry | Male | Female |
| Agriculture, Fishing & Hunting | 0 (0.0%) | 0 (0.0%) |
| Mining, Quarrying, & Extraction | 0 (0.0%) | 0 (0.0%) |
| Construction | 56 (100.0%) | 0 (0.0%) |
| Manufacturing | 36 (100.0%) | 0 (0.0%) |
| Wholesale Trade | 0 (0.0%) | 0 (0.0%) |
| Retail Trade | 0 (0.0%) | 0 (0.0%) |
| Transportation & Warehousing | 28 (50.0%) | 28 (50.0%) |
| Utilities | 0 (0.0%) | 0 (0.0%) |
| Information | 0 (0.0%) | 0 (0.0%) |
| Finance & Insurance | 0 (0.0%) | 14 (100.0%) |
| Real Estate, Rental & Leasing | 0 (0.0%) | 0 (0.0%) |
| Professional & Scientific | 0 (0.0%) | 0 (0.0%) |
| Enterprise Management | 0 (0.0%) | 0 (0.0%) |
| Administrative & Support | 26 (44.1%) | 33 (55.9%) |
| Educational Services | 0 (0.0%) | 0 (0.0%) |
| Health Care & Social Assistance | 0 (0.0%) | 20 (100.0%) |
| Arts, Entertainment & Recreation | 0 (0.0%) | 0 (0.0%) |
| Accommodation & Food Services | 0 (0.0%) | 29 (100.0%) |
| Public Administration | 0 (0.0%) | 0 (0.0%) |
| Total | 146 (51.2%) | 139 (48.8%) |
Education in Bartolo
School Enrollment in Bartolo
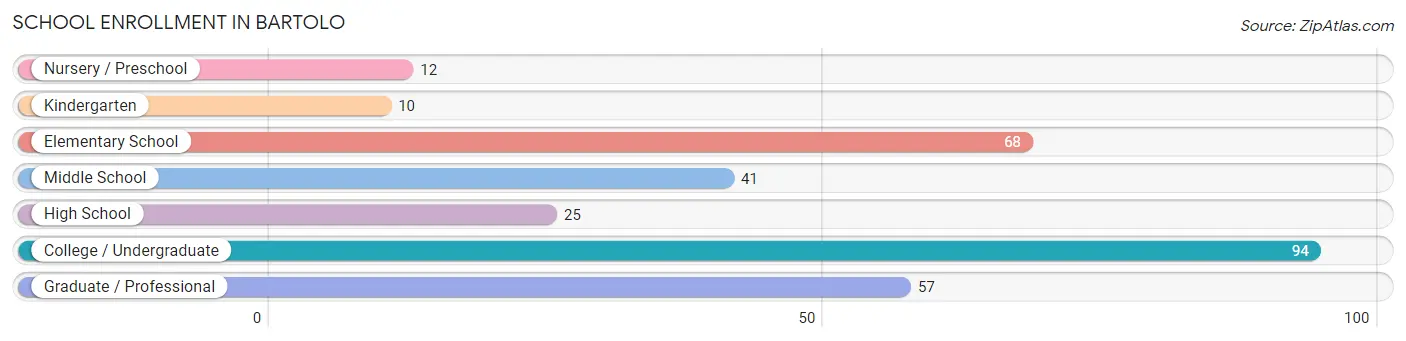
The most common levels of schooling among the 307 students in Bartolo are college / undergraduate (94 | 30.6%), elementary school (68 | 22.2%), and graduate / professional (57 | 18.6%).
| School Level | # Students | % Students |
| Nursery / Preschool | 12 | 3.9% |
| Kindergarten | 10 | 3.3% |
| Elementary School | 68 | 22.2% |
| Middle School | 41 | 13.4% |
| High School | 25 | 8.1% |
| College / Undergraduate | 94 | 30.6% |
| Graduate / Professional | 57 | 18.6% |
| Total | 307 | 100.0% |
School Enrollment by Age by Funding Source in Bartolo
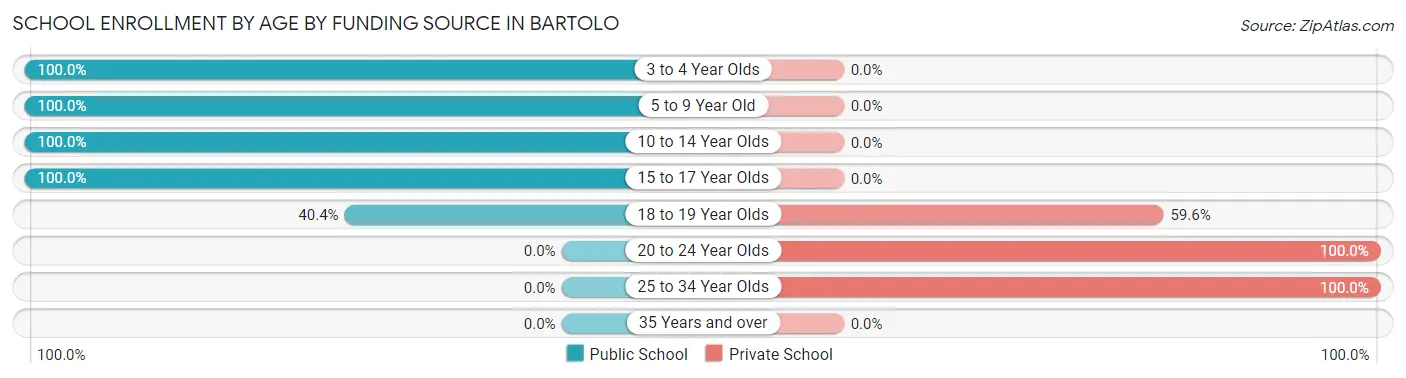
Out of a total of 307 students who are enrolled in schools in Bartolo, 132 (43.0%) attend a private institution, while the remaining 175 (57.0%) are enrolled in public schools. The age group of 20 to 24 year olds has the highest likelihood of being enrolled in private schools, with 47 (100.0% in the age bracket) enrolled. Conversely, the age group of 3 to 4 year olds has the lowest likelihood of being enrolled in a private school, with 22 (100.0% in the age bracket) attending a public institution.
| Age Bracket | Public School | Private School |
| 3 to 4 Year Olds | 22 (100.0%) | 0 (0.0%) |
| 5 to 9 Year Old | 68 (100.0%) | 0 (0.0%) |
| 10 to 14 Year Olds | 41 (100.0%) | 0 (0.0%) |
| 15 to 17 Year Olds | 25 (100.0%) | 0 (0.0%) |
| 18 to 19 Year Olds | 19 (40.4%) | 28 (59.6%) |
| 20 to 24 Year Olds | 0 (0.0%) | 47 (100.0%) |
| 25 to 34 Year Olds | 0 (0.0%) | 57 (100.0%) |
| 35 Years and over | 0 (0.0%) | 0 (0.0%) |
| Total | 175 (57.0%) | 132 (43.0%) |
Educational Attainment by Field of Study in Bartolo
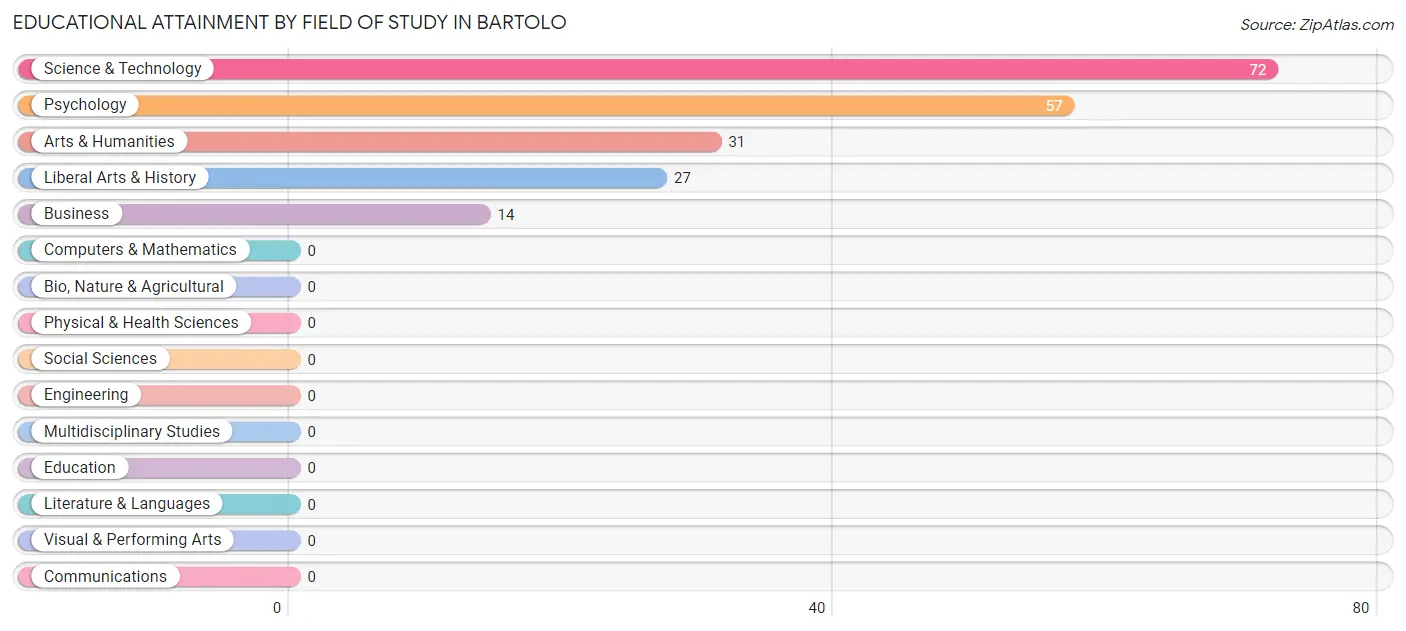
Science & technology (72 | 35.8%), psychology (57 | 28.4%), arts & humanities (31 | 15.4%), liberal arts & history (27 | 13.4%), and business (14 | 7.0%) are the most common fields of study among 201 individuals in Bartolo who have obtained a bachelor's degree or higher.
| Field of Study | # Graduates | % Graduates |
| Computers & Mathematics | 0 | 0.0% |
| Bio, Nature & Agricultural | 0 | 0.0% |
| Physical & Health Sciences | 0 | 0.0% |
| Psychology | 57 | 28.4% |
| Social Sciences | 0 | 0.0% |
| Engineering | 0 | 0.0% |
| Multidisciplinary Studies | 0 | 0.0% |
| Science & Technology | 72 | 35.8% |
| Business | 14 | 7.0% |
| Education | 0 | 0.0% |
| Literature & Languages | 0 | 0.0% |
| Liberal Arts & History | 27 | 13.4% |
| Visual & Performing Arts | 0 | 0.0% |
| Communications | 0 | 0.0% |
| Arts & Humanities | 31 | 15.4% |
| Total | 201 | 100.0% |
Transportation & Commute in Bartolo
Vehicle Availability by Sex in Bartolo
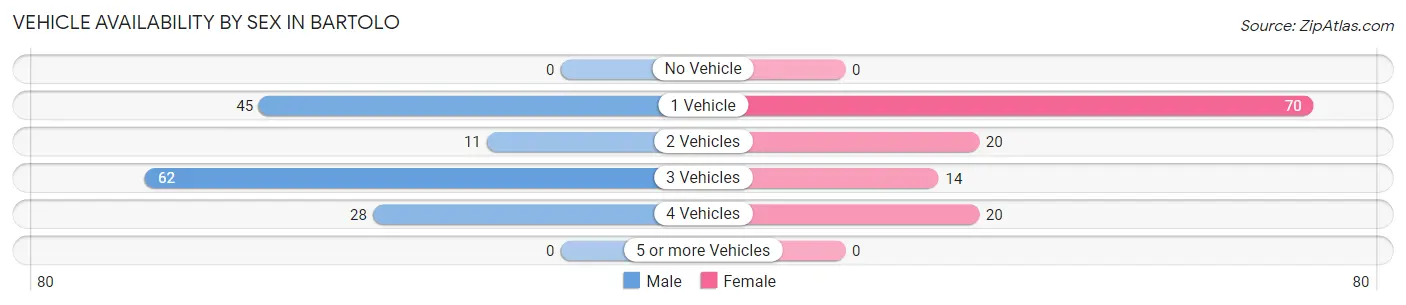
The most prevalent vehicle ownership categories in Bartolo are males with 3 vehicles (62, accounting for 42.5%) and females with 3 vehicles (14, making up 50.0%).
| Vehicles Available | Male | Female |
| No Vehicle | 0 (0.0%) | 0 (0.0%) |
| 1 Vehicle | 45 (30.8%) | 70 (56.5%) |
| 2 Vehicles | 11 (7.5%) | 20 (16.1%) |
| 3 Vehicles | 62 (42.5%) | 14 (11.3%) |
| 4 Vehicles | 28 (19.2%) | 20 (16.1%) |
| 5 or more Vehicles | 0 (0.0%) | 0 (0.0%) |
| Total | 146 (100.0%) | 124 (100.0%) |
Commute Time in Bartolo
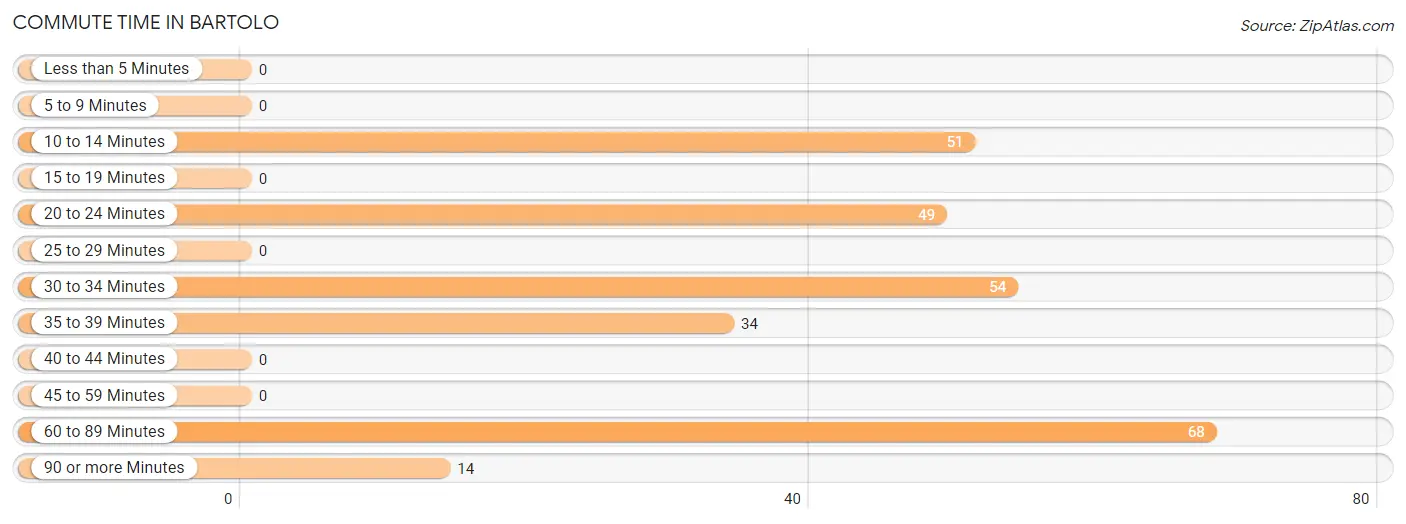
The most frequently occuring commute durations in Bartolo are 60 to 89 minutes (68 commuters, 25.2%), 30 to 34 minutes (54 commuters, 20.0%), and 10 to 14 minutes (51 commuters, 18.9%).
| Commute Time | # Commuters | % Commuters |
| Less than 5 Minutes | 0 | 0.0% |
| 5 to 9 Minutes | 0 | 0.0% |
| 10 to 14 Minutes | 51 | 18.9% |
| 15 to 19 Minutes | 0 | 0.0% |
| 20 to 24 Minutes | 49 | 18.1% |
| 25 to 29 Minutes | 0 | 0.0% |
| 30 to 34 Minutes | 54 | 20.0% |
| 35 to 39 Minutes | 34 | 12.6% |
| 40 to 44 Minutes | 0 | 0.0% |
| 45 to 59 Minutes | 0 | 0.0% |
| 60 to 89 Minutes | 68 | 25.2% |
| 90 or more Minutes | 14 | 5.2% |
Commute Time by Sex in Bartolo
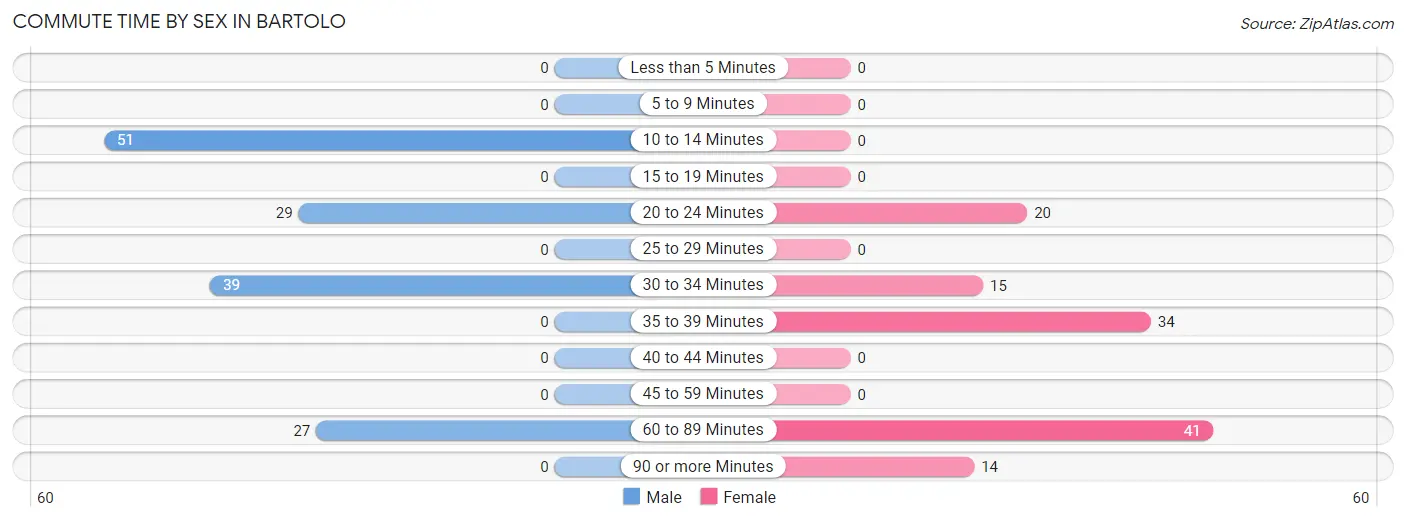
The most common commute times in Bartolo are 10 to 14 minutes (51 commuters, 34.9%) for males and 60 to 89 minutes (41 commuters, 33.1%) for females.
| Commute Time | Male | Female |
| Less than 5 Minutes | 0 (0.0%) | 0 (0.0%) |
| 5 to 9 Minutes | 0 (0.0%) | 0 (0.0%) |
| 10 to 14 Minutes | 51 (34.9%) | 0 (0.0%) |
| 15 to 19 Minutes | 0 (0.0%) | 0 (0.0%) |
| 20 to 24 Minutes | 29 (19.9%) | 20 (16.1%) |
| 25 to 29 Minutes | 0 (0.0%) | 0 (0.0%) |
| 30 to 34 Minutes | 39 (26.7%) | 15 (12.1%) |
| 35 to 39 Minutes | 0 (0.0%) | 34 (27.4%) |
| 40 to 44 Minutes | 0 (0.0%) | 0 (0.0%) |
| 45 to 59 Minutes | 0 (0.0%) | 0 (0.0%) |
| 60 to 89 Minutes | 27 (18.5%) | 41 (33.1%) |
| 90 or more Minutes | 0 (0.0%) | 14 (11.3%) |
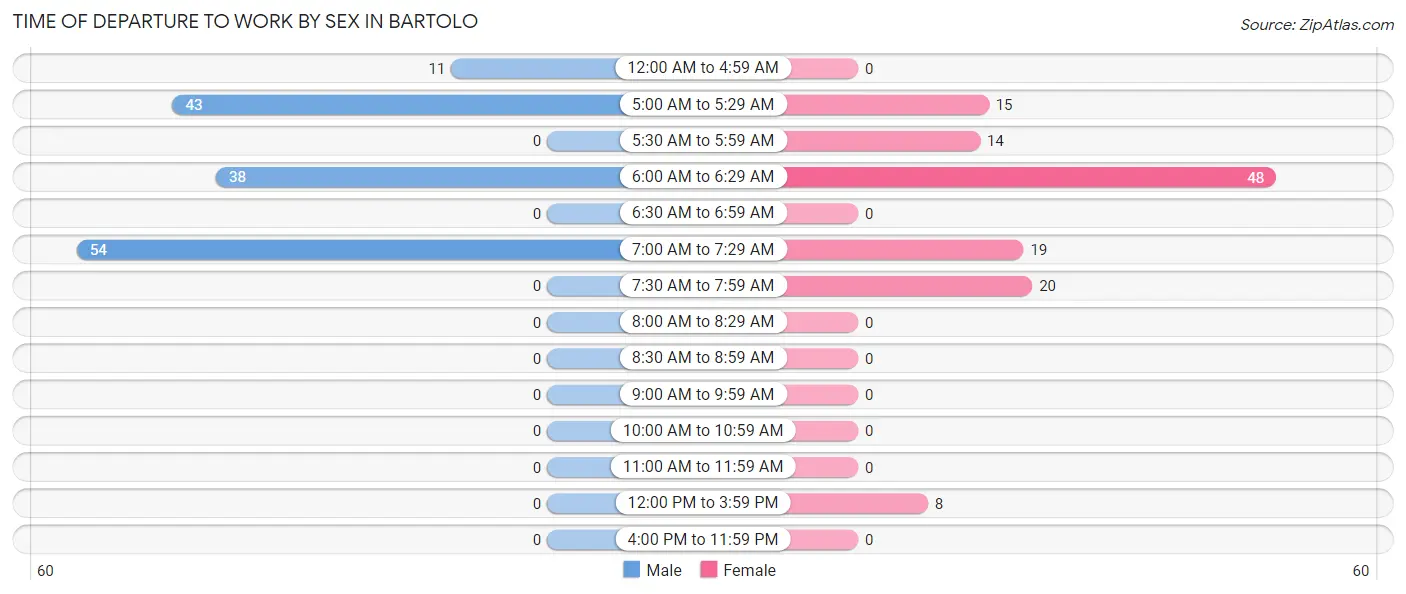
Time of Departure to Work by Sex in Bartolo
The most frequent times of departure to work in Bartolo are 7:00 AM to 7:29 AM (54, 37.0%) for males and 6:00 AM to 6:29 AM (48, 38.7%) for females.
| Time of Departure | Male | Female |
| 12:00 AM to 4:59 AM | 11 (7.5%) | 0 (0.0%) |
| 5:00 AM to 5:29 AM | 43 (29.4%) | 15 (12.1%) |
| 5:30 AM to 5:59 AM | 0 (0.0%) | 14 (11.3%) |
| 6:00 AM to 6:29 AM | 38 (26.0%) | 48 (38.7%) |
| 6:30 AM to 6:59 AM | 0 (0.0%) | 0 (0.0%) |
| 7:00 AM to 7:29 AM | 54 (37.0%) | 19 (15.3%) |
| 7:30 AM to 7:59 AM | 0 (0.0%) | 20 (16.1%) |
| 8:00 AM to 8:29 AM | 0 (0.0%) | 0 (0.0%) |
| 8:30 AM to 8:59 AM | 0 (0.0%) | 0 (0.0%) |
| 9:00 AM to 9:59 AM | 0 (0.0%) | 0 (0.0%) |
| 10:00 AM to 10:59 AM | 0 (0.0%) | 0 (0.0%) |
| 11:00 AM to 11:59 AM | 0 (0.0%) | 0 (0.0%) |
| 12:00 PM to 3:59 PM | 0 (0.0%) | 8 (6.5%) |
| 4:00 PM to 11:59 PM | 0 (0.0%) | 0 (0.0%) |
| Total | 146 (100.0%) | 124 (100.0%) |
Housing Occupancy in Bartolo
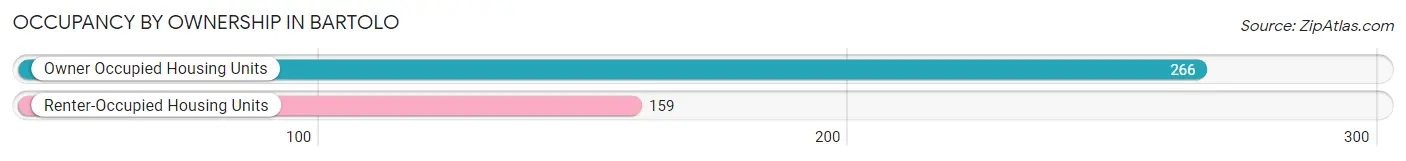
Occupancy by Ownership in Bartolo
Of the total 425 dwellings in Bartolo, owner-occupied units account for 266 (62.6%), while renter-occupied units make up 159 (37.4%).
| Occupancy | # Housing Units | % Housing Units |
| Owner Occupied Housing Units | 266 | 62.6% |
| Renter-Occupied Housing Units | 159 | 37.4% |
| Total Occupied Housing Units | 425 | 100.0% |
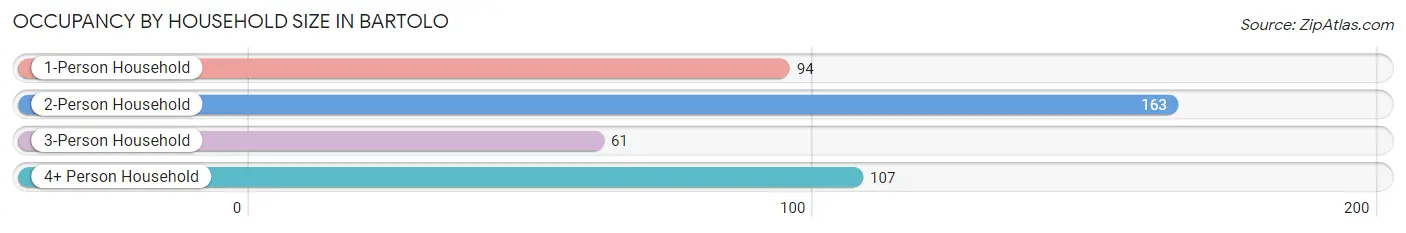
Occupancy by Household Size in Bartolo
| Household Size | # Housing Units | % Housing Units |
| 1-Person Household | 94 | 22.1% |
| 2-Person Household | 163 | 38.4% |
| 3-Person Household | 61 | 14.3% |
| 4+ Person Household | 107 | 25.2% |
| Total Housing Units | 425 | 100.0% |
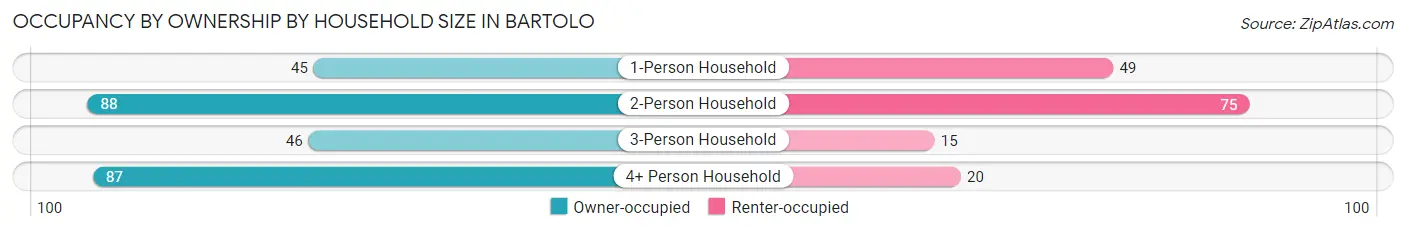
Occupancy by Ownership by Household Size in Bartolo
| Household Size | Owner-occupied | Renter-occupied |
| 1-Person Household | 45 (47.9%) | 49 (52.1%) |
| 2-Person Household | 88 (54.0%) | 75 (46.0%) |
| 3-Person Household | 46 (75.4%) | 15 (24.6%) |
| 4+ Person Household | 87 (81.3%) | 20 (18.7%) |
| Total Housing Units | 266 (62.6%) | 159 (37.4%) |
Occupancy by Educational Attainment in Bartolo
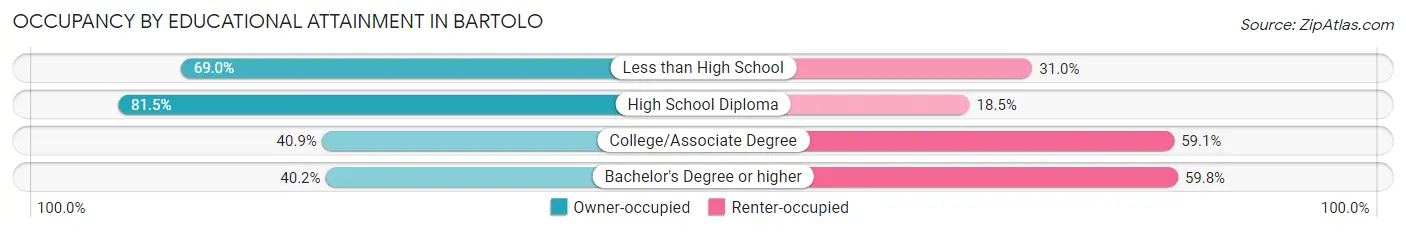
| Household Size | Owner-occupied | Renter-occupied |
| Less than High School | 78 (69.0%) | 35 (31.0%) |
| High School Diploma | 123 (81.5%) | 28 (18.5%) |
| College/Associate Degree | 18 (40.9%) | 26 (59.1%) |
| Bachelor's Degree or higher | 47 (40.2%) | 70 (59.8%) |
Occupancy by Age of Householder in Bartolo
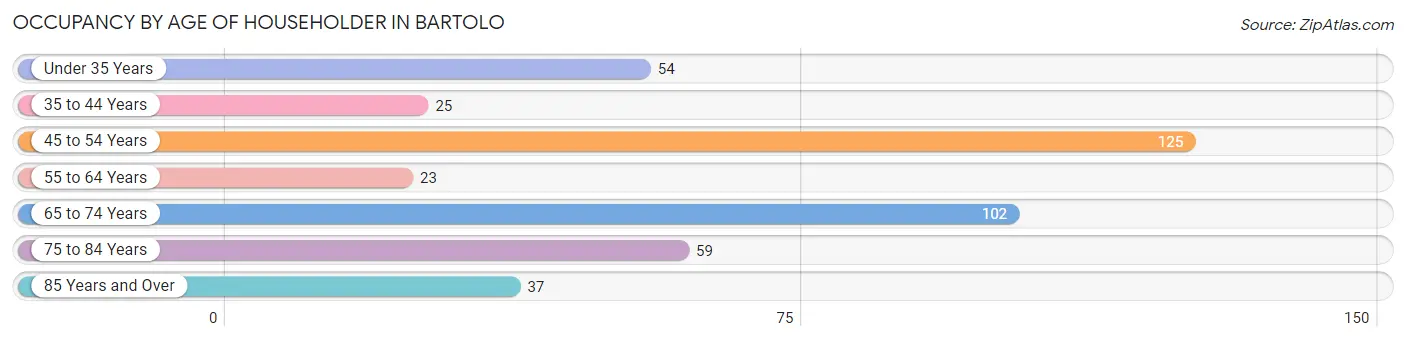
| Age Bracket | # Households | % Households |
| Under 35 Years | 54 | 12.7% |
| 35 to 44 Years | 25 | 5.9% |
| 45 to 54 Years | 125 | 29.4% |
| 55 to 64 Years | 23 | 5.4% |
| 65 to 74 Years | 102 | 24.0% |
| 75 to 84 Years | 59 | 13.9% |
| 85 Years and Over | 37 | 8.7% |
| Total | 425 | 100.0% |
Housing Finances in Bartolo
Median Income by Occupancy in Bartolo
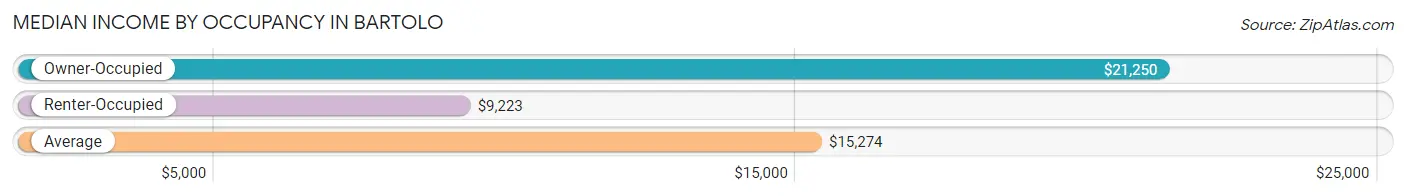
| Occupancy Type | # Households | Median Income |
| Owner-Occupied | 266 (62.6%) | $21,250 |
| Renter-Occupied | 159 (37.4%) | $9,223 |
| Average | 425 (100.0%) | $15,274 |
Occupancy by Householder Income Bracket in Bartolo
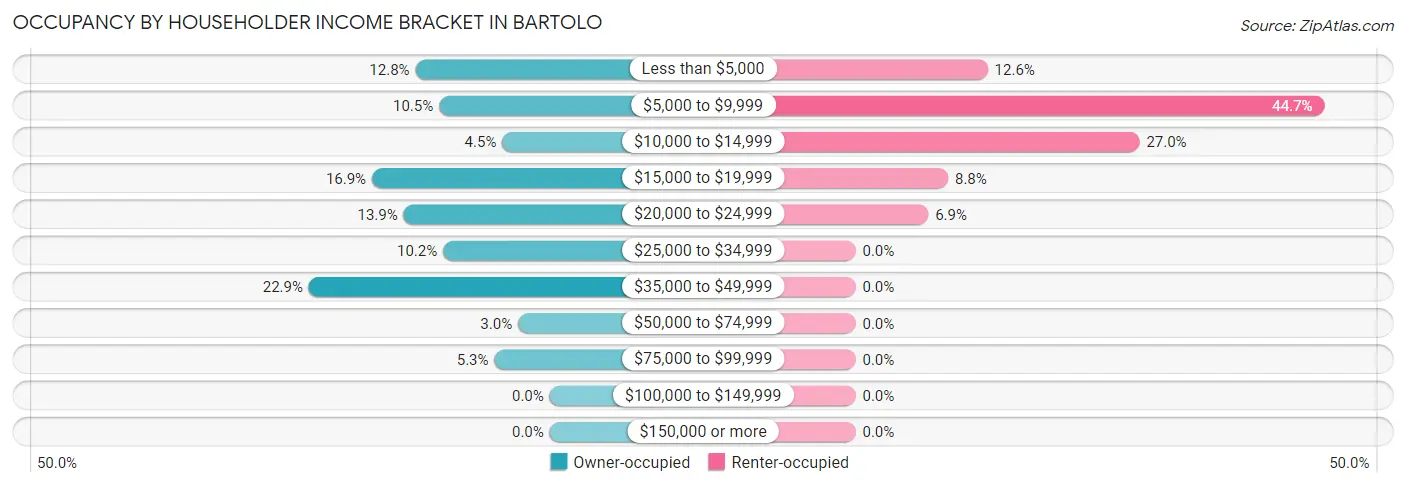
| Income Bracket | Owner-occupied | Renter-occupied |
| Less than $5,000 | 34 (12.8%) | 20 (12.6%) |
| $5,000 to $9,999 | 28 (10.5%) | 71 (44.7%) |
| $10,000 to $14,999 | 12 (4.5%) | 43 (27.0%) |
| $15,000 to $19,999 | 45 (16.9%) | 14 (8.8%) |
| $20,000 to $24,999 | 37 (13.9%) | 11 (6.9%) |
| $25,000 to $34,999 | 27 (10.2%) | 0 (0.0%) |
| $35,000 to $49,999 | 61 (22.9%) | 0 (0.0%) |
| $50,000 to $74,999 | 8 (3.0%) | 0 (0.0%) |
| $75,000 to $99,999 | 14 (5.3%) | 0 (0.0%) |
| $100,000 to $149,999 | 0 (0.0%) | 0 (0.0%) |
| $150,000 or more | 0 (0.0%) | 0 (0.0%) |
| Total | 266 (100.0%) | 159 (100.0%) |
Monthly Housing Cost Tiers in Bartolo
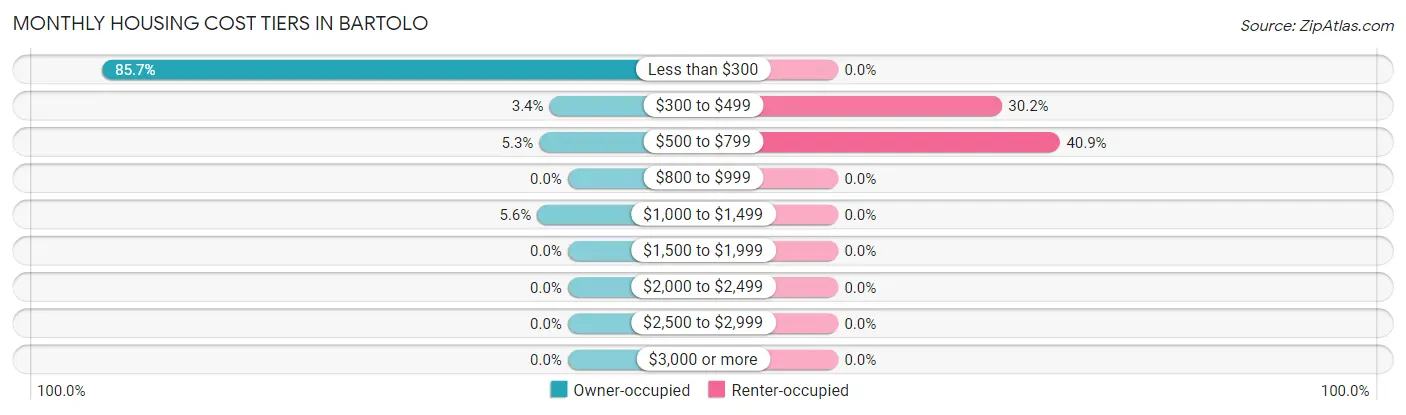
| Monthly Cost | Owner-occupied | Renter-occupied |
| Less than $300 | 228 (85.7%) | 0 (0.0%) |
| $300 to $499 | 9 (3.4%) | 48 (30.2%) |
| $500 to $799 | 14 (5.3%) | 65 (40.9%) |
| $800 to $999 | 0 (0.0%) | 0 (0.0%) |
| $1,000 to $1,499 | 15 (5.6%) | 0 (0.0%) |
| $1,500 to $1,999 | 0 (0.0%) | 0 (0.0%) |
| $2,000 to $2,499 | 0 (0.0%) | 0 (0.0%) |
| $2,500 to $2,999 | 0 (0.0%) | 0 (0.0%) |
| $3,000 or more | 0 (0.0%) | 0 (0.0%) |
| Total | 266 (100.0%) | 159 (100.0%) |
Physical Housing Characteristics in Bartolo
Housing Structures in Bartolo
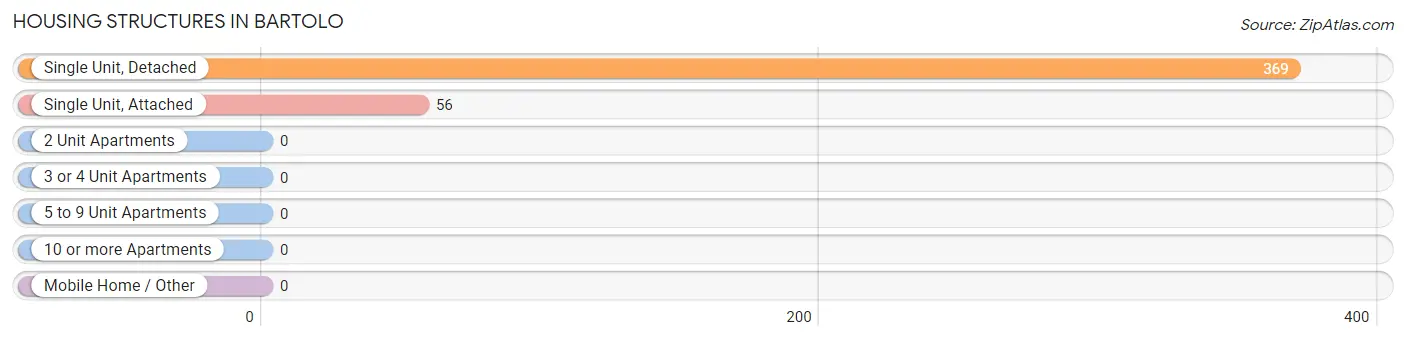
| Structure Type | # Housing Units | % Housing Units |
| Single Unit, Detached | 369 | 86.8% |
| Single Unit, Attached | 56 | 13.2% |
| 2 Unit Apartments | 0 | 0.0% |
| 3 or 4 Unit Apartments | 0 | 0.0% |
| 5 to 9 Unit Apartments | 0 | 0.0% |
| 10 or more Apartments | 0 | 0.0% |
| Mobile Home / Other | 0 | 0.0% |
| Total | 425 | 100.0% |
Housing Structures by Occupancy in Bartolo
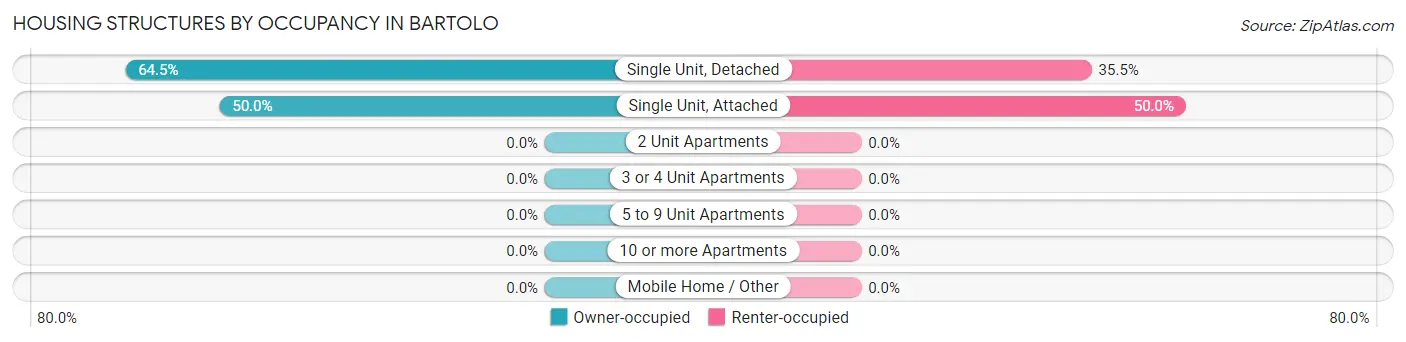
| Structure Type | Owner-occupied | Renter-occupied |
| Single Unit, Detached | 238 (64.5%) | 131 (35.5%) |
| Single Unit, Attached | 28 (50.0%) | 28 (50.0%) |
| 2 Unit Apartments | 0 (0.0%) | 0 (0.0%) |
| 3 or 4 Unit Apartments | 0 (0.0%) | 0 (0.0%) |
| 5 to 9 Unit Apartments | 0 (0.0%) | 0 (0.0%) |
| 10 or more Apartments | 0 (0.0%) | 0 (0.0%) |
| Mobile Home / Other | 0 (0.0%) | 0 (0.0%) |
| Total | 266 (62.6%) | 159 (37.4%) |
Housing Structures by Number of Rooms in Bartolo
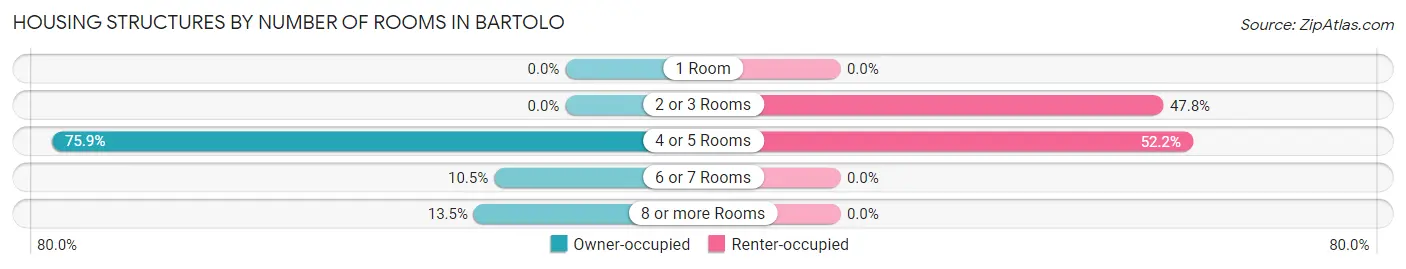
| Number of Rooms | Owner-occupied | Renter-occupied |
| 1 Room | 0 (0.0%) | 0 (0.0%) |
| 2 or 3 Rooms | 0 (0.0%) | 76 (47.8%) |
| 4 or 5 Rooms | 202 (75.9%) | 83 (52.2%) |
| 6 or 7 Rooms | 28 (10.5%) | 0 (0.0%) |
| 8 or more Rooms | 36 (13.5%) | 0 (0.0%) |
| Total | 266 (100.0%) | 159 (100.0%) |
Housing Structure by Heating Type in Bartolo
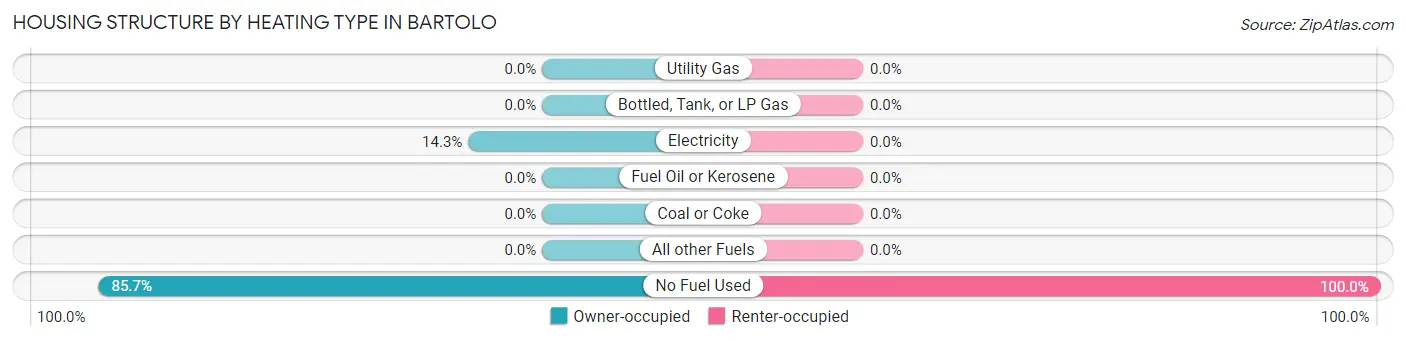
| Heating Type | Owner-occupied | Renter-occupied |
| Utility Gas | 0 (0.0%) | 0 (0.0%) |
| Bottled, Tank, or LP Gas | 0 (0.0%) | 0 (0.0%) |
| Electricity | 38 (14.3%) | 0 (0.0%) |
| Fuel Oil or Kerosene | 0 (0.0%) | 0 (0.0%) |
| Coal or Coke | 0 (0.0%) | 0 (0.0%) |
| All other Fuels | 0 (0.0%) | 0 (0.0%) |
| No Fuel Used | 228 (85.7%) | 159 (100.0%) |
| Total | 266 (100.0%) | 159 (100.0%) |
Household Vehicle Usage in Bartolo
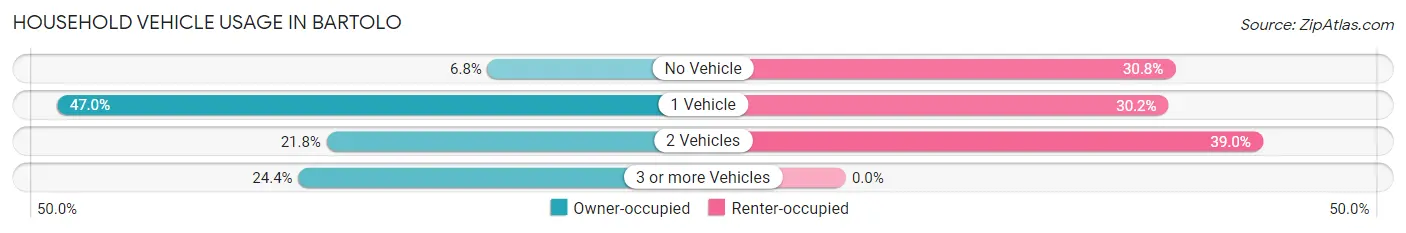
| Vehicles per Household | Owner-occupied | Renter-occupied |
| No Vehicle | 18 (6.8%) | 49 (30.8%) |
| 1 Vehicle | 125 (47.0%) | 48 (30.2%) |
| 2 Vehicles | 58 (21.8%) | 62 (39.0%) |
| 3 or more Vehicles | 65 (24.4%) | 0 (0.0%) |
| Total | 266 (100.0%) | 159 (100.0%) |
Real Estate & Mortgages in Bartolo
Real Estate and Mortgage Overview in Bartolo
| Characteristic | Without Mortgage | With Mortgage |
| Housing Units | 228 | 38 |
| Median Property Value | $121,400 | $92,900 |
| Median Household Income | $21,696 | $0 |
| Monthly Housing Costs | $149 | $0 |
| Real Estate Taxes | - | - |
Property Value by Mortgage Status in Bartolo
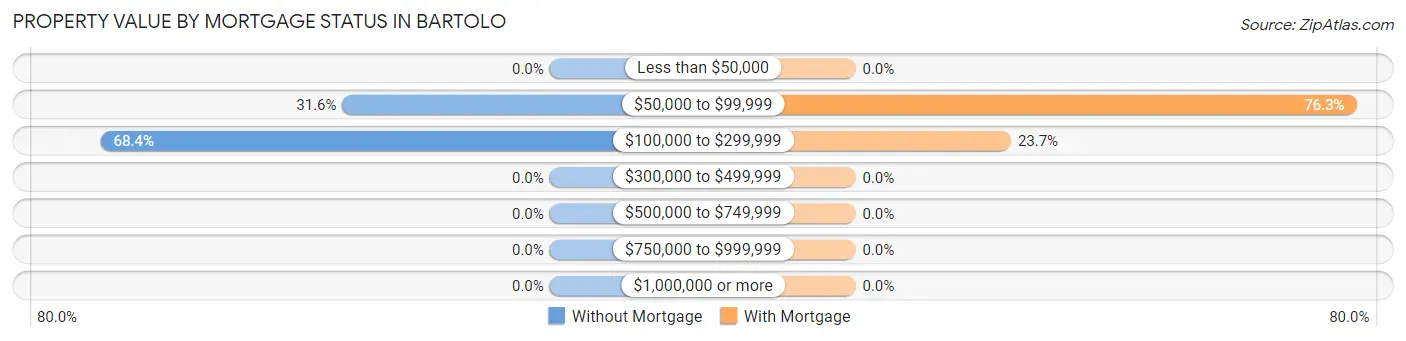
| Property Value | Without Mortgage | With Mortgage |
| Less than $50,000 | 0 (0.0%) | 0 (0.0%) |
| $50,000 to $99,999 | 72 (31.6%) | 29 (76.3%) |
| $100,000 to $299,999 | 156 (68.4%) | 9 (23.7%) |
| $300,000 to $499,999 | 0 (0.0%) | 0 (0.0%) |
| $500,000 to $749,999 | 0 (0.0%) | 0 (0.0%) |
| $750,000 to $999,999 | 0 (0.0%) | 0 (0.0%) |
| $1,000,000 or more | 0 (0.0%) | 0 (0.0%) |
| Total | 228 (100.0%) | 38 (100.0%) |
Household Income by Mortgage Status in Bartolo
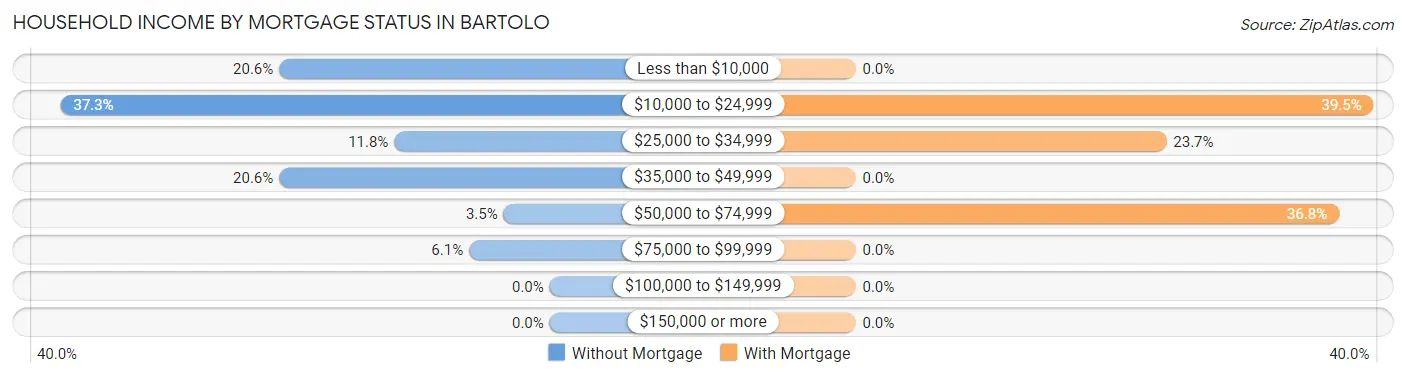
| Household Income | Without Mortgage | With Mortgage |
| Less than $10,000 | 47 (20.6%) | 0 (0.0%) |
| $10,000 to $24,999 | 85 (37.3%) | 15 (39.5%) |
| $25,000 to $34,999 | 27 (11.8%) | 9 (23.7%) |
| $35,000 to $49,999 | 47 (20.6%) | 0 (0.0%) |
| $50,000 to $74,999 | 8 (3.5%) | 14 (36.8%) |
| $75,000 to $99,999 | 14 (6.1%) | 0 (0.0%) |
| $100,000 to $149,999 | 0 (0.0%) | 0 (0.0%) |
| $150,000 or more | 0 (0.0%) | 0 (0.0%) |
| Total | 228 (100.0%) | 38 (100.0%) |
Property Value to Household Income Ratio in Bartolo
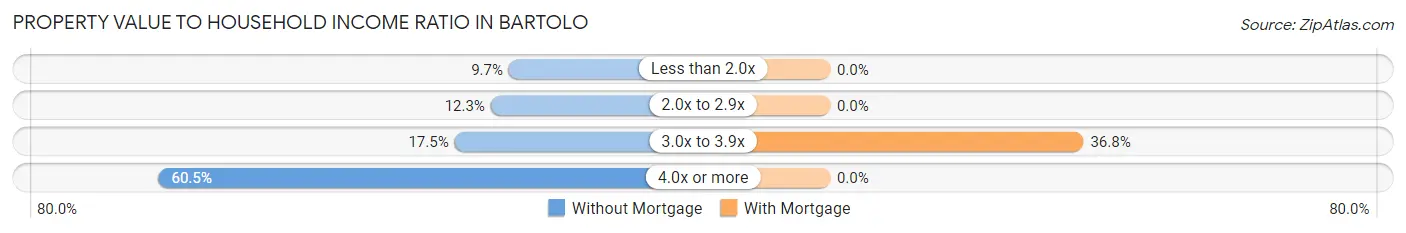
| Value-to-Income Ratio | Without Mortgage | With Mortgage |
| Less than 2.0x | 22 (9.7%) | 0 (0.0%) |
| 2.0x to 2.9x | 28 (12.3%) | 0 (0.0%) |
| 3.0x to 3.9x | 40 (17.5%) | 14 (36.8%) |
| 4.0x or more | 138 (60.5%) | 0 (0.0%) |
| Total | 228 (100.0%) | 38 (100.0%) |
Real Estate Taxes by Mortgage Status in Bartolo
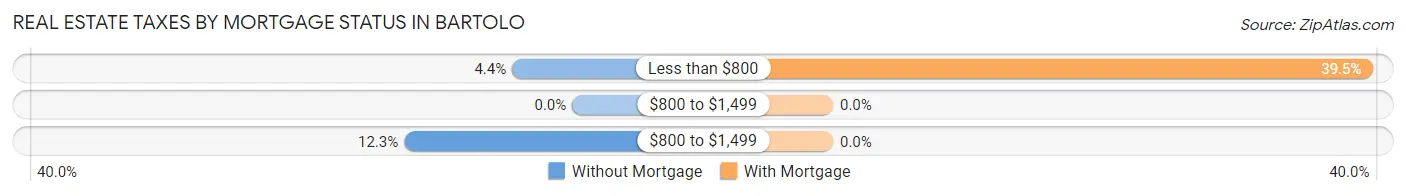
| Property Taxes | Without Mortgage | With Mortgage |
| Less than $800 | 10 (4.4%) | 15 (39.5%) |
| $800 to $1,499 | 0 (0.0%) | 0 (0.0%) |
| $800 to $1,499 | 28 (12.3%) | 0 (0.0%) |
| Total | 228 (100.0%) | 38 (100.0%) |
Health & Disability in Bartolo
Health Insurance Coverage by Age in Bartolo
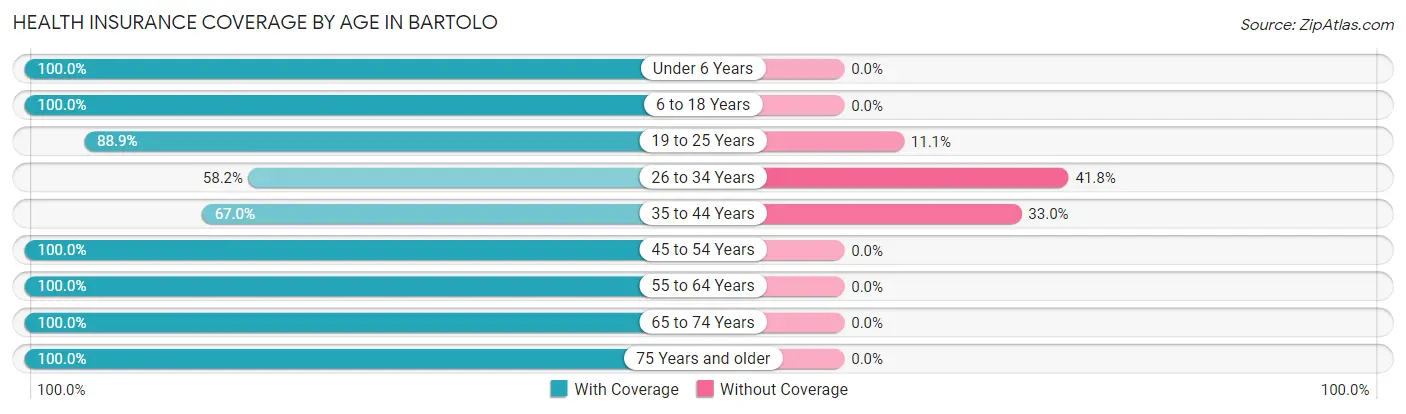
| Age Bracket | With Coverage | Without Coverage |
| Under 6 Years | 58 (100.0%) | 0 (0.0%) |
| 6 to 18 Years | 153 (100.0%) | 0 (0.0%) |
| 19 to 25 Years | 224 (88.9%) | 28 (11.1%) |
| 26 to 34 Years | 64 (58.2%) | 46 (41.8%) |
| 35 to 44 Years | 73 (67.0%) | 36 (33.0%) |
| 45 to 54 Years | 281 (100.0%) | 0 (0.0%) |
| 55 to 64 Years | 65 (100.0%) | 0 (0.0%) |
| 65 to 74 Years | 145 (100.0%) | 0 (0.0%) |
| 75 Years and older | 131 (100.0%) | 0 (0.0%) |
| Total | 1,194 (91.6%) | 110 (8.4%) |
Health Insurance Coverage by Citizenship Status in Bartolo
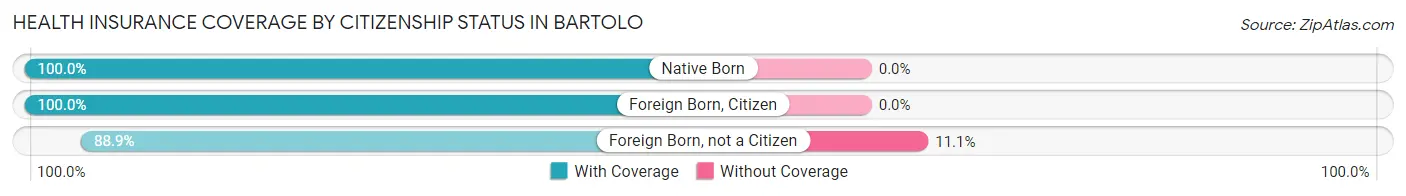
| Citizenship Status | With Coverage | Without Coverage |
| Native Born | 58 (100.0%) | 0 (0.0%) |
| Foreign Born, Citizen | 153 (100.0%) | 0 (0.0%) |
| Foreign Born, not a Citizen | 224 (88.9%) | 28 (11.1%) |
Health Insurance Coverage by Household Income in Bartolo
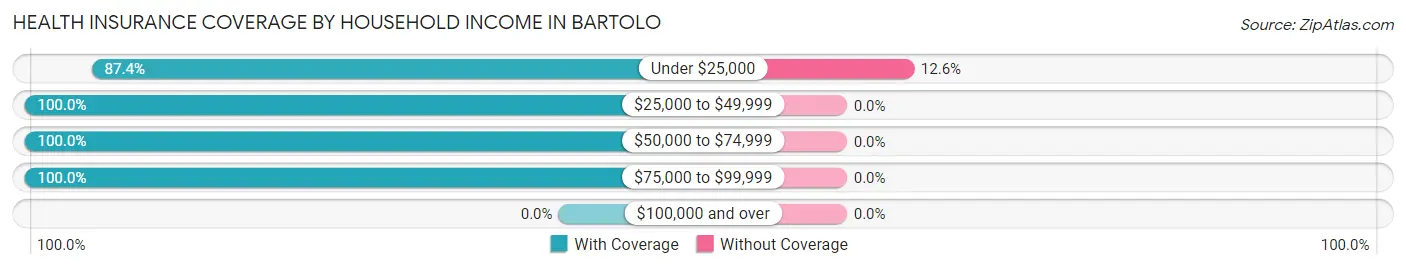
| Household Income | With Coverage | Without Coverage |
| Under $25,000 | 765 (87.4%) | 110 (12.6%) |
| $25,000 to $49,999 | 396 (100.0%) | 0 (0.0%) |
| $50,000 to $74,999 | 8 (100.0%) | 0 (0.0%) |
| $75,000 to $99,999 | 25 (100.0%) | 0 (0.0%) |
| $100,000 and over | 0 (0.0%) | 0 (0.0%) |
Public vs Private Health Insurance Coverage by Age in Bartolo
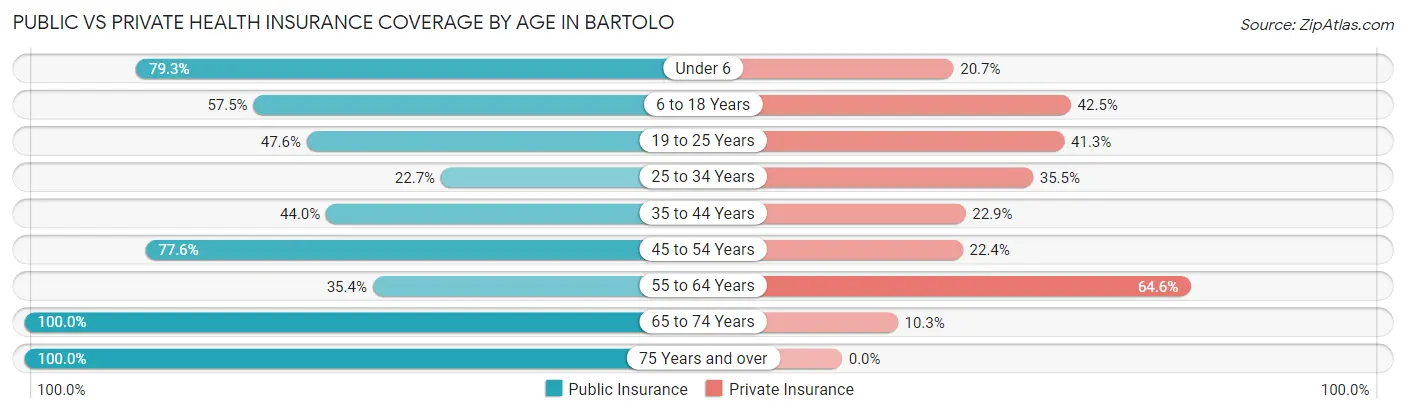
| Age Bracket | Public Insurance | Private Insurance |
| Under 6 | 46 (79.3%) | 12 (20.7%) |
| 6 to 18 Years | 88 (57.5%) | 65 (42.5%) |
| 19 to 25 Years | 120 (47.6%) | 104 (41.3%) |
| 25 to 34 Years | 25 (22.7%) | 39 (35.4%) |
| 35 to 44 Years | 48 (44.0%) | 25 (22.9%) |
| 45 to 54 Years | 218 (77.6%) | 63 (22.4%) |
| 55 to 64 Years | 23 (35.4%) | 42 (64.6%) |
| 65 to 74 Years | 145 (100.0%) | 15 (10.3%) |
| 75 Years and over | 131 (100.0%) | 0 (0.0%) |
| Total | 844 (64.7%) | 365 (28.0%) |
Disability Status by Sex by Age in Bartolo
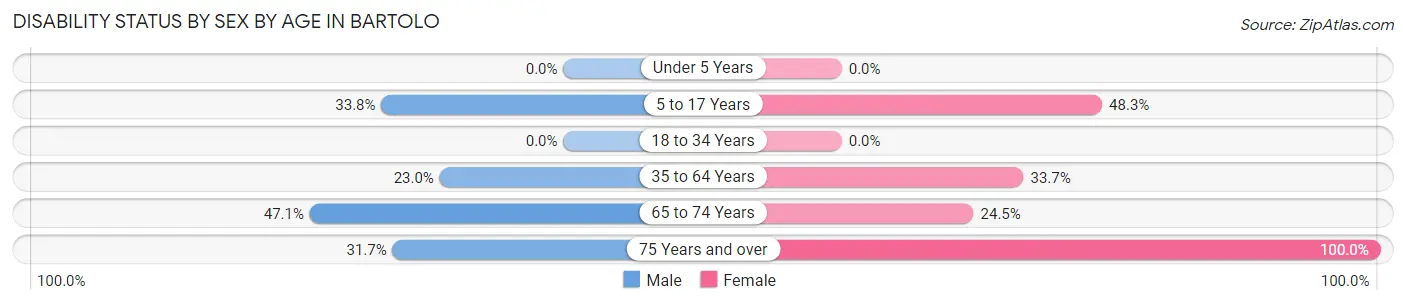
| Age Bracket | Male | Female |
| Under 5 Years | 0 (0.0%) | 0 (0.0%) |
| 5 to 17 Years | 25 (33.8%) | 29 (48.3%) |
| 18 to 34 Years | 0 (0.0%) | 0 (0.0%) |
| 35 to 64 Years | 67 (23.0%) | 55 (33.7%) |
| 65 to 74 Years | 24 (47.1%) | 23 (24.5%) |
| 75 Years and over | 13 (31.7%) | 90 (100.0%) |
Disability Class by Sex by Age in Bartolo
Disability Class: Hearing Difficulty
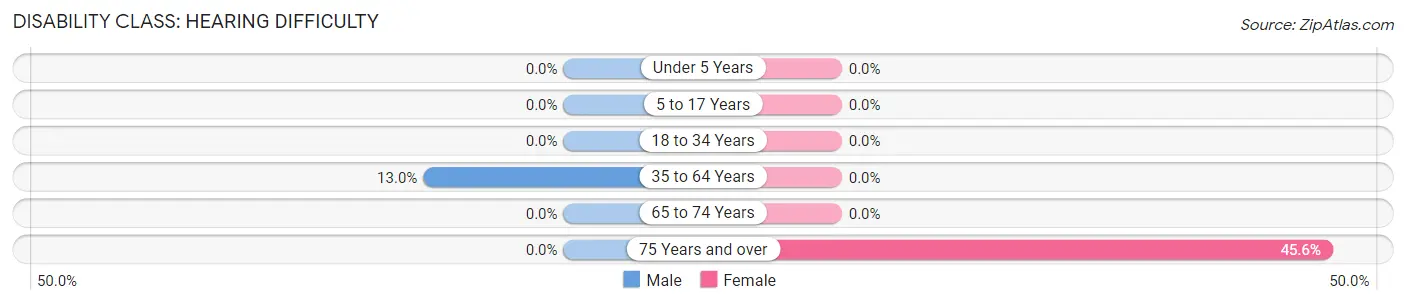
| Age Bracket | Male | Female |
| Under 5 Years | 0 (0.0%) | 0 (0.0%) |
| 5 to 17 Years | 0 (0.0%) | 0 (0.0%) |
| 18 to 34 Years | 0 (0.0%) | 0 (0.0%) |
| 35 to 64 Years | 38 (13.0%) | 0 (0.0%) |
| 65 to 74 Years | 0 (0.0%) | 0 (0.0%) |
| 75 Years and over | 0 (0.0%) | 41 (45.6%) |
Disability Class: Vision Difficulty
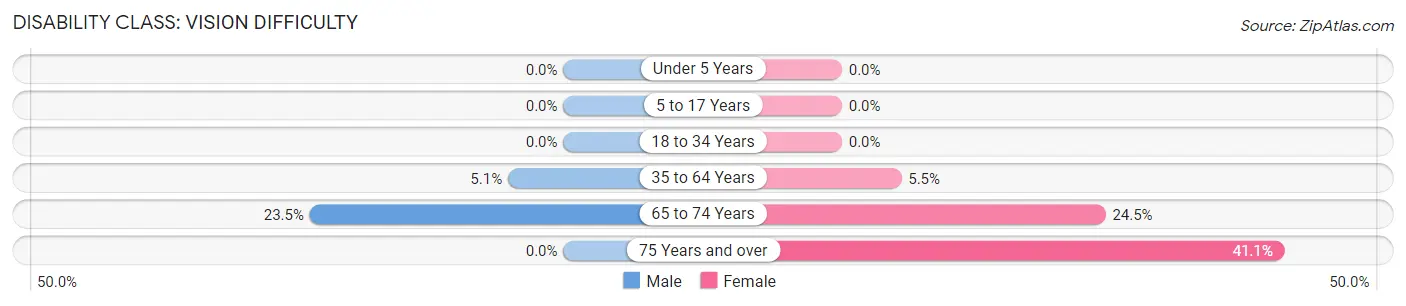
| Age Bracket | Male | Female |
| Under 5 Years | 0 (0.0%) | 0 (0.0%) |
| 5 to 17 Years | 0 (0.0%) | 0 (0.0%) |
| 18 to 34 Years | 0 (0.0%) | 0 (0.0%) |
| 35 to 64 Years | 15 (5.1%) | 9 (5.5%) |
| 65 to 74 Years | 12 (23.5%) | 23 (24.5%) |
| 75 Years and over | 0 (0.0%) | 37 (41.1%) |
Disability Class: Cognitive Difficulty
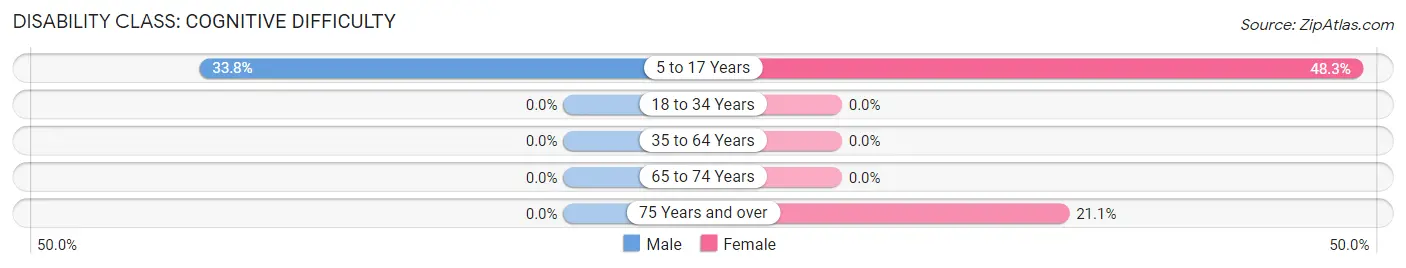
| Age Bracket | Male | Female |
| 5 to 17 Years | 25 (33.8%) | 29 (48.3%) |
| 18 to 34 Years | 0 (0.0%) | 0 (0.0%) |
| 35 to 64 Years | 0 (0.0%) | 0 (0.0%) |
| 65 to 74 Years | 0 (0.0%) | 0 (0.0%) |
| 75 Years and over | 0 (0.0%) | 19 (21.1%) |
Disability Class: Ambulatory Difficulty
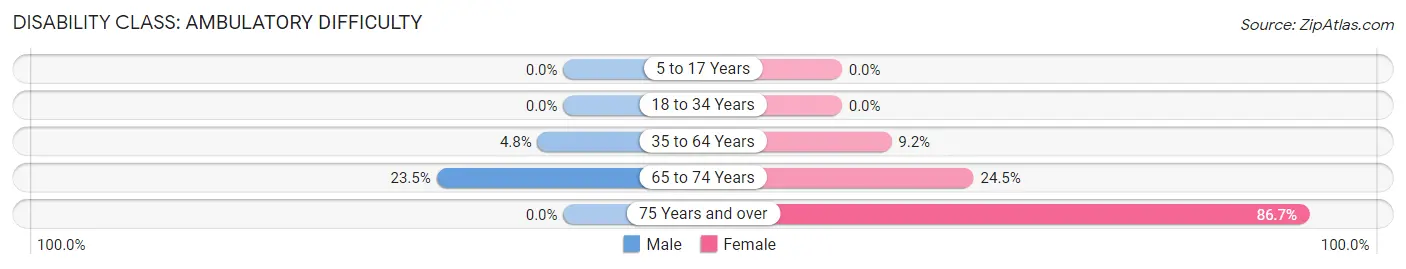
| Age Bracket | Male | Female |
| 5 to 17 Years | 0 (0.0%) | 0 (0.0%) |
| 18 to 34 Years | 0 (0.0%) | 0 (0.0%) |
| 35 to 64 Years | 14 (4.8%) | 15 (9.2%) |
| 65 to 74 Years | 12 (23.5%) | 23 (24.5%) |
| 75 Years and over | 0 (0.0%) | 78 (86.7%) |
Disability Class: Self-Care Difficulty
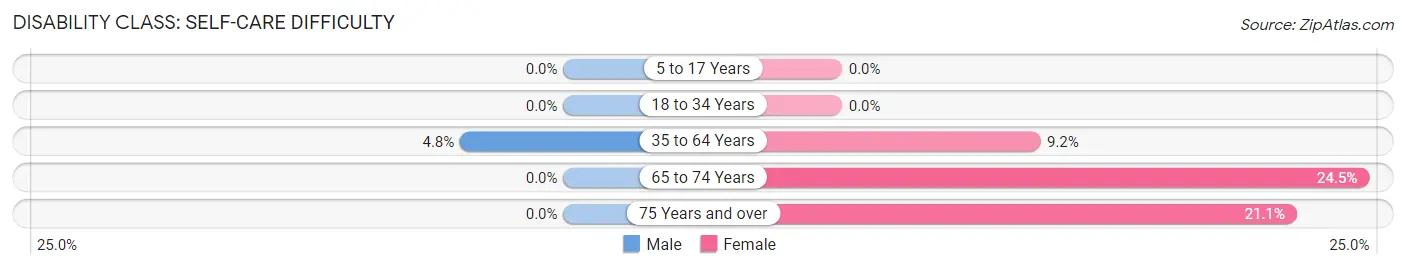
| Age Bracket | Male | Female |
| 5 to 17 Years | 0 (0.0%) | 0 (0.0%) |
| 18 to 34 Years | 0 (0.0%) | 0 (0.0%) |
| 35 to 64 Years | 14 (4.8%) | 15 (9.2%) |
| 65 to 74 Years | 0 (0.0%) | 23 (24.5%) |
| 75 Years and over | 0 (0.0%) | 19 (21.1%) |
Technology Access in Bartolo
Computing Device Access in Bartolo
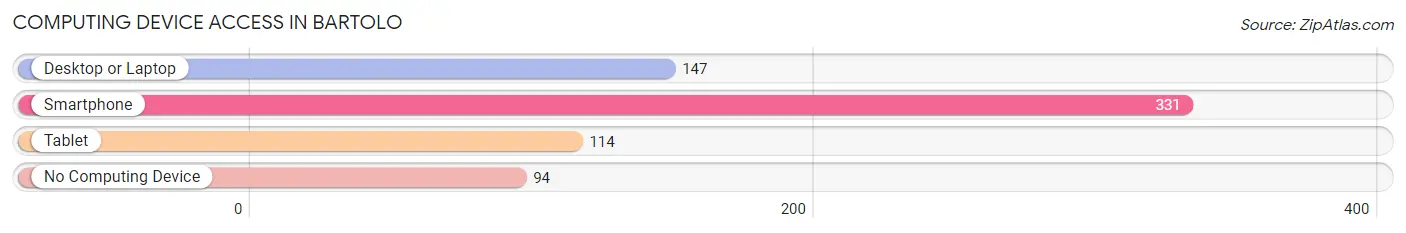
| Device Type | # Households | % Households |
| Desktop or Laptop | 147 | 34.6% |
| Smartphone | 331 | 77.9% |
| Tablet | 114 | 26.8% |
| No Computing Device | 94 | 22.1% |
| Total | 425 | 100.0% |
Internet Access in Bartolo
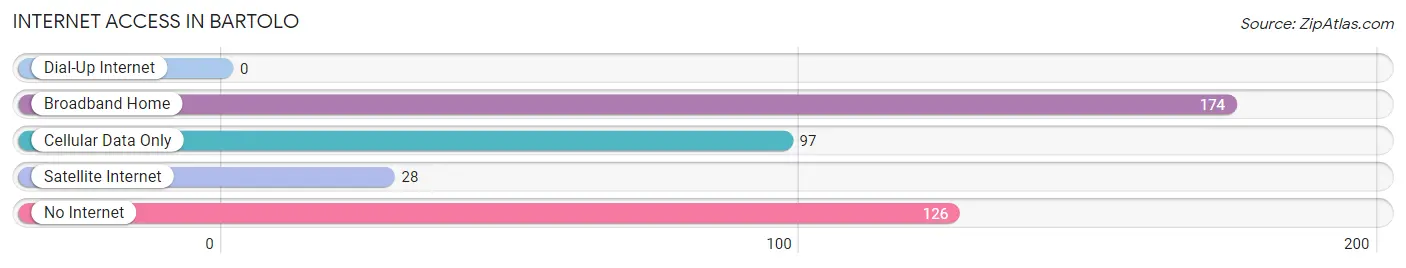
| Internet Type | # Households | % Households |
| Dial-Up Internet | 0 | 0.0% |
| Broadband Home | 174 | 40.9% |
| Cellular Data Only | 97 | 22.8% |
| Satellite Internet | 28 | 6.6% |
| No Internet | 126 | 29.6% |
| Total | 425 | 100.0% |
Bartolo Summary
Puerto Rico is an unincorporated territory of the United States located in the Caribbean Sea. It is the easternmost and smallest of the Greater Antilles, and is composed of the main island of Puerto Rico and several smaller islands. The island has a rich history, diverse geography, vibrant economy, and unique demographics.
History
Puerto Rico has a long and varied history, beginning with its first inhabitants, the Taíno people, who arrived on the island around 1000 AD. The Taíno were a peaceful people who lived in small villages and practiced agriculture. They were eventually conquered by the Spanish in the late 15th century, and the island became a Spanish colony. During the Spanish colonial period, the island was used as a military outpost and trading post.
In 1898, Puerto Rico was ceded to the United States as part of the Treaty of Paris, which ended the Spanish-American War. The island became an unincorporated territory of the United States, and its citizens were granted U.S. citizenship in 1917. In 1952, Puerto Rico became a self-governing commonwealth of the United States.
Geography
Puerto Rico is located in the Caribbean Sea, east of the Dominican Republic and west of the Virgin Islands. The main island of Puerto Rico is approximately 100 miles long and 35 miles wide. It is composed of three distinct regions: the mountainous interior, the coastal plains, and the offshore islands.
The interior of the island is dominated by the Cordillera Central, a mountain range that runs east-west across the island. The highest peak in the range is Cerro de Punta, which rises to 4,390 feet. The coastal plains are located along the northern and southern coasts of the island, and are characterized by flat terrain and sandy beaches. The offshore islands include Vieques, Culebra, and Mona.
Economy
Puerto Rico has a vibrant economy that is largely based on tourism, manufacturing, and services. The island is home to a number of large multinational corporations, including pharmaceutical companies, banks, and technology firms. Tourism is a major source of income for the island, with millions of visitors each year.
The manufacturing sector is also an important part of the economy, with products such as electronics, chemicals, and pharmaceuticals being produced on the island. The services sector is also a major contributor to the economy, with a large number of professional and financial services firms located in Puerto Rico.
Demographics
Puerto Rico has a population of approximately 3.2 million people, making it the most populous of the Caribbean islands. The population is largely of Spanish and African descent, with smaller numbers of people of other ethnic backgrounds. Spanish is the official language of the island, although English is also widely spoken.
The majority of the population is Roman Catholic, although there are also a number of other religious denominations represented on the island. The median age of the population is 38.5 years, and the median household income is $20,000.
Conclusion
Puerto Rico is a unique and vibrant island with a rich history, diverse geography, vibrant economy, and unique demographics. It is an unincorporated territory of the United States, and its citizens are U.S. citizens. The island is home to a diverse population, and its economy is largely based on tourism, manufacturing, and services. Puerto Rico is a vibrant and diverse island with much to offer.
Common Questions
What is Per Capita Income in Bartolo?
Per Capita income in Bartolo is $7,483.
What is the Median Family Income in Bartolo?
Median Family Income in Bartolo is $17,847.
What is the Median Household income in Bartolo?
Median Household Income in Bartolo is $15,274.
What is Income or Wage Gap in Bartolo?
Income or Wage Gap in Bartolo is 30.2%.
Women in Bartolo earn 69.8 cents for every dollar earned by a man.
What is Family Income Deficit in Bartolo?
Family Income Deficit in Bartolo is $14,225.
Families that are below poverty line in Bartolo earn $14,225 less on average than the poverty threshold level.
What is Inequality or Gini Index in Bartolo?
Inequality or Gini Index in Bartolo is 0.46.
What is the Total Population of Bartolo?
Total Population of Bartolo is 1,304.
What is the Total Male Population of Bartolo?
Total Male Population of Bartolo is 605.
What is the Total Female Population of Bartolo?
Total Female Population of Bartolo is 699.
What is the Ratio of Males per 100 Females in Bartolo?
There are 86.55 Males per 100 Females in Bartolo.
What is the Ratio of Females per 100 Males in Bartolo?
There are 115.54 Females per 100 Males in Bartolo.
What is the Median Population Age in Bartolo?
Median Population Age in Bartolo is 42.2 Years.
What is the Average Family Size in Bartolo
Average Family Size in Bartolo is 3.7 People.
What is the Average Household Size in Bartolo
Average Household Size in Bartolo is 3.1 People.
How Large is the Labor Force in Bartolo?
There are 617 People in the Labor Forcein in Bartolo.
What is the Percentage of People in the Labor Force in Bartolo?
54.3% of People are in the Labor Force in Bartolo.
What is the Unemployment Rate in Bartolo?
Unemployment Rate in Bartolo is 53.8%.