Indios, PR Map & Demographics
Indios Map
Indios Overview
$10,753
PER CAPITA INCOME
$21,563
AVG FAMILY INCOME
$20,208
AVG HOUSEHOLD INCOME
37.1%
WAGE / INCOME GAP [ % ]
62.9¢/ $1
WAGE / INCOME GAP [ $ ]
0.42
INEQUALITY / GINI INDEX
1,322
TOTAL POPULATION
571
MALE POPULATION
751
FEMALE POPULATION
76.03
MALES / 100 FEMALES
131.52
FEMALES / 100 MALES
46.9
MEDIAN AGE
3.2
AVG FAMILY SIZE
2.9
AVG HOUSEHOLD SIZE
372
LABOR FORCE [ PEOPLE ]
35.1%
PERCENT IN LABOR FORCE
25.5%
UNEMPLOYMENT RATE
Income in Indios
Income Overview in Indios
Per Capita Income in Indios is $10,753, while median incomes of families and households are $21,563 and $20,208 respectively.
| Characteristic | Number | Measure |
| Per Capita Income | 1,322 | $10,753 |
| Median Family Income | 380 | $21,563 |
| Mean Family Income | 380 | $30,517 |
| Median Household Income | 464 | $20,208 |
| Mean Household Income | 464 | $28,594 |
| Income Deficit | 380 | $0 |
| Wage / Income Gap (%) | 1,322 | 37.06% |
| Wage / Income Gap ($) | 1,322 | 62.94¢ per $1 |
| Gini / Inequality Index | 1,322 | 0.42 |
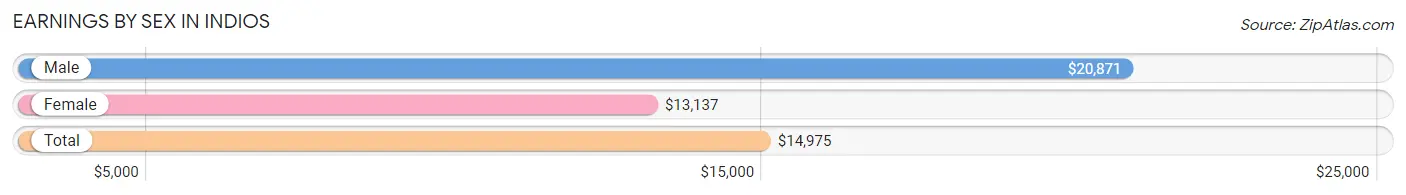
Earnings by Sex in Indios
Average Earnings in Indios are $14,975, $20,871 for men and $13,137 for women, a difference of 37.1%.
| Sex | Number | Average Earnings |
| Male | 155 (45.5%) | $20,871 |
| Female | 186 (54.5%) | $13,137 |
| Total | 341 (100.0%) | $14,975 |
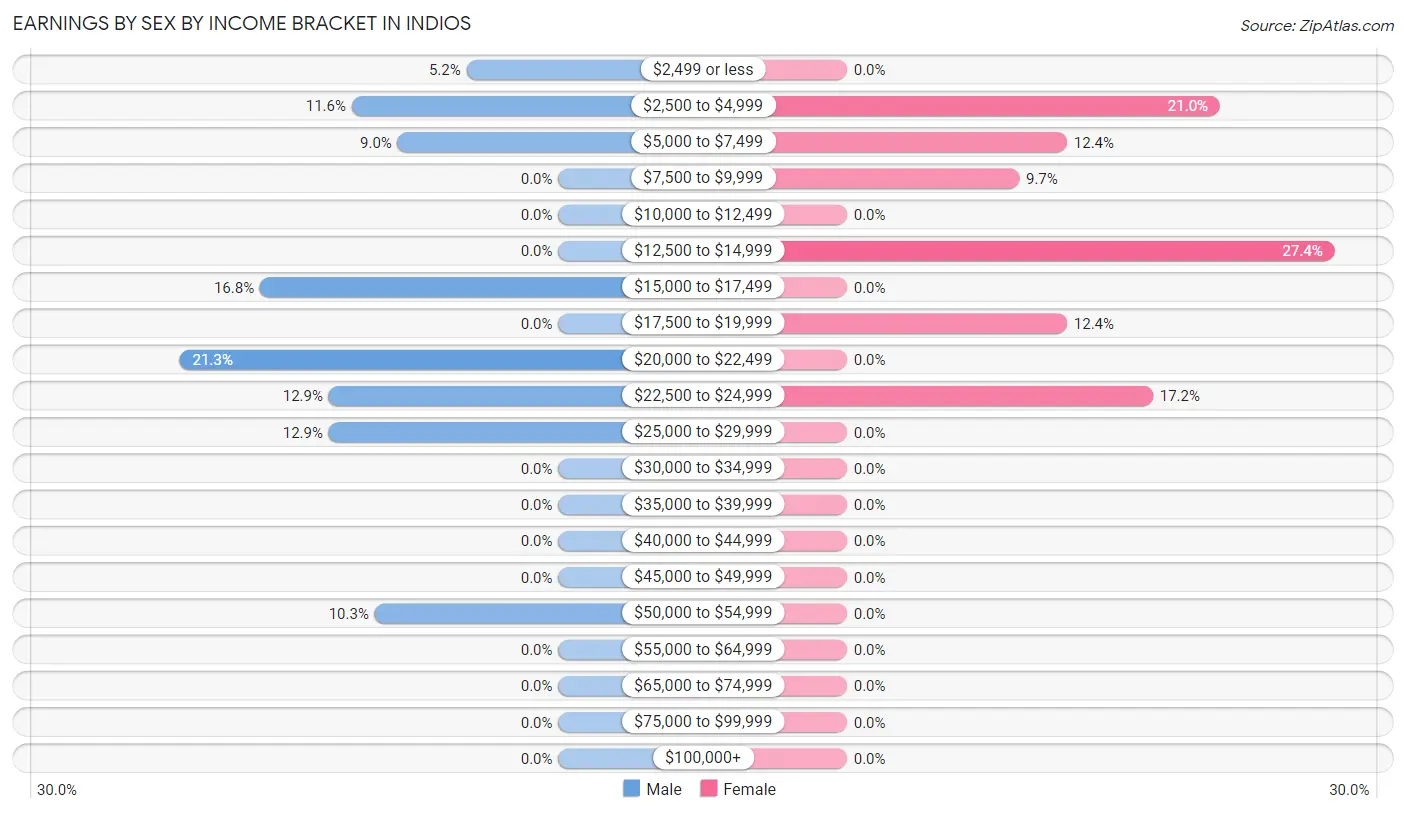
Earnings by Sex by Income Bracket in Indios
The most common earnings brackets in Indios are $20,000 to $22,499 for men (33 | 21.3%) and $12,500 to $14,999 for women (51 | 27.4%).
| Income | Male | Female |
| $2,499 or less | 8 (5.2%) | 0 (0.0%) |
| $2,500 to $4,999 | 18 (11.6%) | 39 (21.0%) |
| $5,000 to $7,499 | 14 (9.0%) | 23 (12.4%) |
| $7,500 to $9,999 | 0 (0.0%) | 18 (9.7%) |
| $10,000 to $12,499 | 0 (0.0%) | 0 (0.0%) |
| $12,500 to $14,999 | 0 (0.0%) | 51 (27.4%) |
| $15,000 to $17,499 | 26 (16.8%) | 0 (0.0%) |
| $17,500 to $19,999 | 0 (0.0%) | 23 (12.4%) |
| $20,000 to $22,499 | 33 (21.3%) | 0 (0.0%) |
| $22,500 to $24,999 | 20 (12.9%) | 32 (17.2%) |
| $25,000 to $29,999 | 20 (12.9%) | 0 (0.0%) |
| $30,000 to $34,999 | 0 (0.0%) | 0 (0.0%) |
| $35,000 to $39,999 | 0 (0.0%) | 0 (0.0%) |
| $40,000 to $44,999 | 0 (0.0%) | 0 (0.0%) |
| $45,000 to $49,999 | 0 (0.0%) | 0 (0.0%) |
| $50,000 to $54,999 | 16 (10.3%) | 0 (0.0%) |
| $55,000 to $64,999 | 0 (0.0%) | 0 (0.0%) |
| $65,000 to $74,999 | 0 (0.0%) | 0 (0.0%) |
| $75,000 to $99,999 | 0 (0.0%) | 0 (0.0%) |
| $100,000+ | 0 (0.0%) | 0 (0.0%) |
| Total | 155 (100.0%) | 186 (100.0%) |
Earnings by Sex by Educational Attainment in Indios
| Educational Attainment | Male Income | Female Income |
| Less than High School | - | - |
| High School Diploma | - | - |
| College or Associate's Degree | - | - |
| Bachelor's Degree | - | - |
| Graduate Degree | - | - |
| Total | $21,856 | $13,578 |
Family Income in Indios
Family Income Brackets in Indios
According to the Indios family income data, there are 122 families falling into the $15,000 to $24,999 income range, which is the most common income bracket and makes up 32.1% of all families.
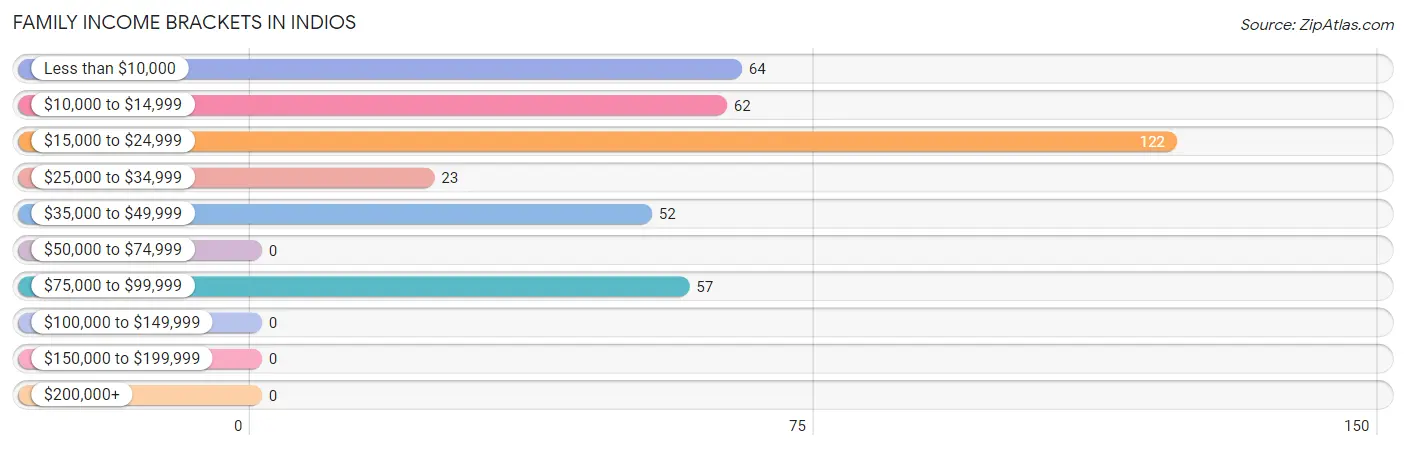
| Income Bracket | # Families | % Families |
| Less than $10,000 | 64 | 16.8% |
| $10,000 to $14,999 | 62 | 16.3% |
| $15,000 to $24,999 | 122 | 32.1% |
| $25,000 to $34,999 | 23 | 6.1% |
| $35,000 to $49,999 | 52 | 13.7% |
| $50,000 to $74,999 | 0 | 0.0% |
| $75,000 to $99,999 | 57 | 15.0% |
| $100,000 to $149,999 | 0 | 0.0% |
| $150,000 to $199,999 | 0 | 0.0% |
| $200,000+ | 0 | 0.0% |
Family Income by Famaliy Size in Indios
3-person families (95 | 25.0%) account for the highest median family income in Indios with $18,693 per family, while 3-person families (95 | 25.0%) have the highest median income of $6,231 per family member.
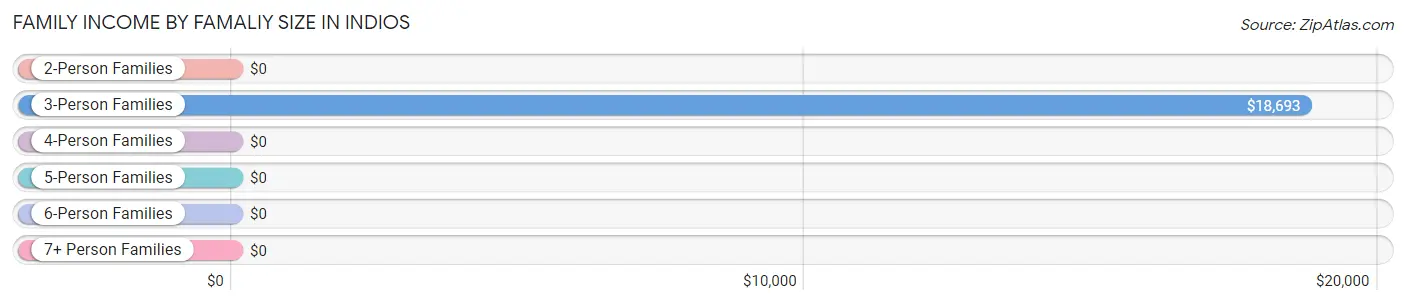
| Income Bracket | # Families | Median Income |
| 2-Person Families | 202 (53.2%) | $0 |
| 3-Person Families | 95 (25.0%) | $18,693 |
| 4-Person Families | 44 (11.6%) | $0 |
| 5-Person Families | 25 (6.6%) | $0 |
| 6-Person Families | 0 (0.0%) | $0 |
| 7+ Person Families | 14 (3.7%) | $0 |
| Total | 380 (100.0%) | $21,563 |
Family Income by Number of Earners in Indios
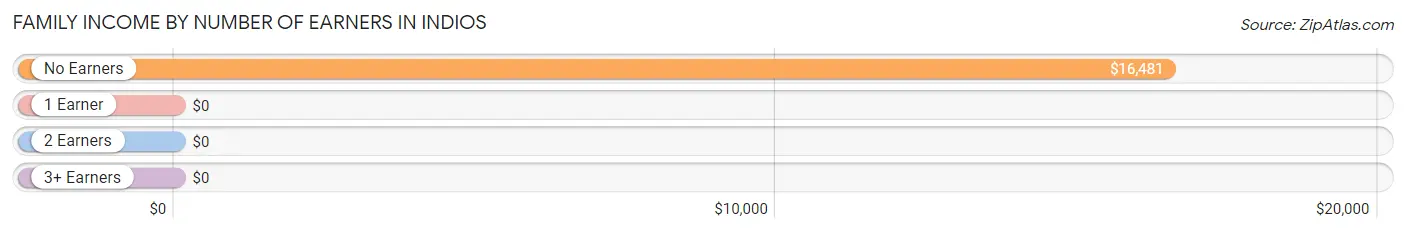
| Number of Earners | # Families | Median Income |
| No Earners | 248 (65.3%) | $16,481 |
| 1 Earner | 18 (4.7%) | $0 |
| 2 Earners | 114 (30.0%) | $0 |
| 3+ Earners | 0 (0.0%) | $0 |
| Total | 380 (100.0%) | $21,563 |
Household Income in Indios
Household Income Brackets in Indios
With 122 households falling in the category, the $15,000 to $24,999 income range is the most frequent in Indios, accounting for 26.3% of all households.
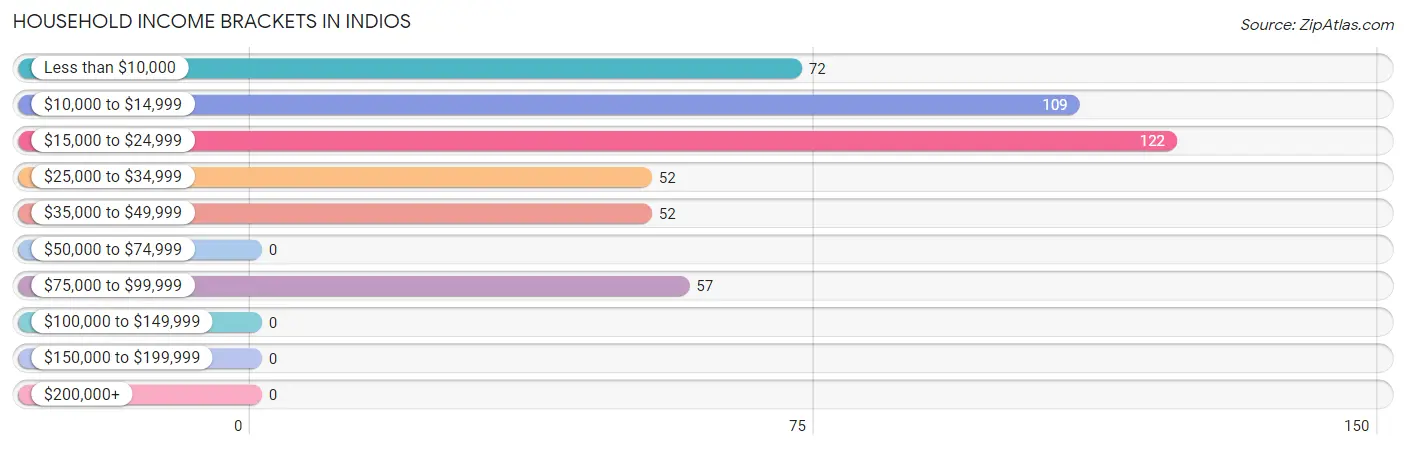
| Income Bracket | # Households | % Households |
| Less than $10,000 | 72 | 15.5% |
| $10,000 to $14,999 | 109 | 23.5% |
| $15,000 to $24,999 | 122 | 26.3% |
| $25,000 to $34,999 | 52 | 11.2% |
| $35,000 to $49,999 | 52 | 11.2% |
| $50,000 to $74,999 | 0 | 0.0% |
| $75,000 to $99,999 | 57 | 12.3% |
| $100,000 to $149,999 | 0 | 0.0% |
| $150,000 to $199,999 | 0 | 0.0% |
| $200,000+ | 0 | 0.0% |
Household Income by Householder Age in Indios
The median household income in Indios is $20,208, with the highest median household income of $28,667 found in the 45 to 64 years age bracket for the primary householder. A total of 174 households (37.5%) fall into this category.
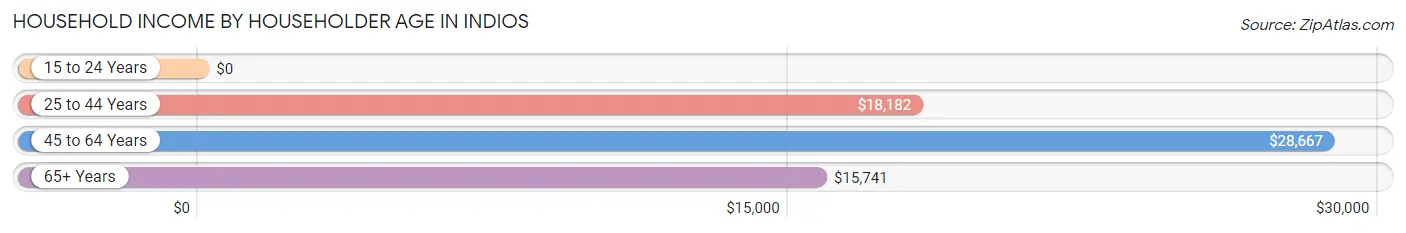
| Income Bracket | # Households | Median Income |
| 15 to 24 Years | 0 (0.0%) | $0 |
| 25 to 44 Years | 76 (16.4%) | $18,182 |
| 45 to 64 Years | 174 (37.5%) | $28,667 |
| 65+ Years | 214 (46.1%) | $15,741 |
| Total | 464 (100.0%) | $20,208 |
Poverty in Indios
Income Below Poverty by Sex and Age in Indios
With 53.2% poverty level for males and 56.6% for females among the residents of Indios, 6 to 11 year old males and under 5 year old females are the most vulnerable to poverty, with 24 males (100.0%) and 45 females (100.0%) in their respective age groups living below the poverty level.
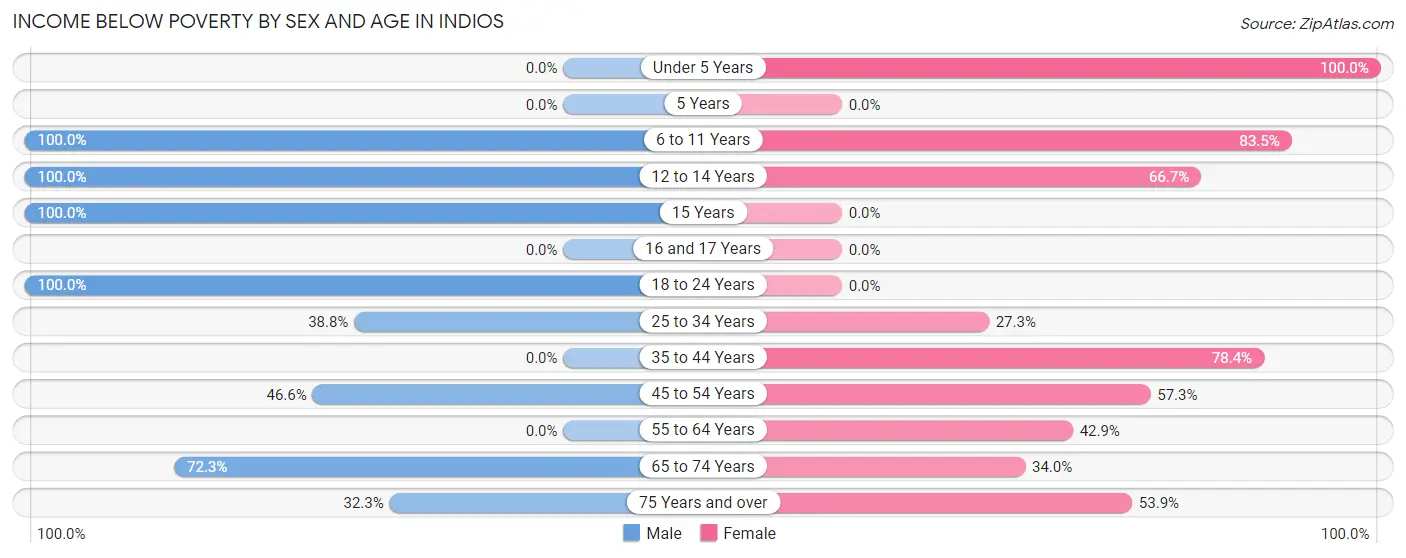
| Age Bracket | Male | Female |
| Under 5 Years | 0 (0.0%) | 45 (100.0%) |
| 5 Years | 0 (0.0%) | 0 (0.0%) |
| 6 to 11 Years | 24 (100.0%) | 91 (83.5%) |
| 12 to 14 Years | 20 (100.0%) | 34 (66.7%) |
| 15 Years | 13 (100.0%) | 0 (0.0%) |
| 16 and 17 Years | 0 (0.0%) | 0 (0.0%) |
| 18 to 24 Years | 35 (100.0%) | 0 (0.0%) |
| 25 to 34 Years | 66 (38.8%) | 12 (27.3%) |
| 35 to 44 Years | 0 (0.0%) | 76 (78.3%) |
| 45 to 54 Years | 27 (46.6%) | 67 (57.3%) |
| 55 to 64 Years | 0 (0.0%) | 36 (42.9%) |
| 65 to 74 Years | 99 (72.3%) | 50 (34.0%) |
| 75 Years and over | 20 (32.3%) | 14 (53.8%) |
| Total | 304 (53.2%) | 425 (56.6%) |
Income Above Poverty by Sex and Age in Indios
According to the poverty statistics in Indios, males aged 55 to 64 years and females aged 16 and 17 years are the age groups that are most secure financially, with 100.0% of males and 100.0% of females in these age groups living above the poverty line.
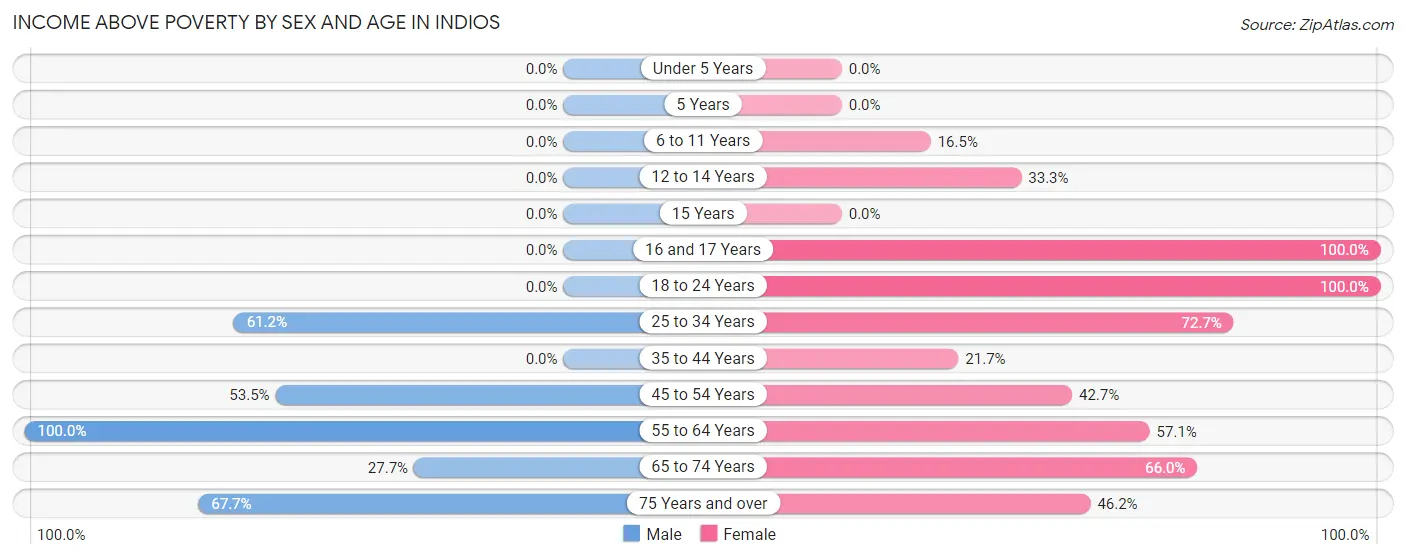
| Age Bracket | Male | Female |
| Under 5 Years | 0 (0.0%) | 0 (0.0%) |
| 5 Years | 0 (0.0%) | 0 (0.0%) |
| 6 to 11 Years | 0 (0.0%) | 18 (16.5%) |
| 12 to 14 Years | 0 (0.0%) | 17 (33.3%) |
| 15 Years | 0 (0.0%) | 0 (0.0%) |
| 16 and 17 Years | 0 (0.0%) | 13 (100.0%) |
| 18 to 24 Years | 0 (0.0%) | 18 (100.0%) |
| 25 to 34 Years | 104 (61.2%) | 32 (72.7%) |
| 35 to 44 Years | 0 (0.0%) | 21 (21.6%) |
| 45 to 54 Years | 31 (53.4%) | 50 (42.7%) |
| 55 to 64 Years | 52 (100.0%) | 48 (57.1%) |
| 65 to 74 Years | 38 (27.7%) | 97 (66.0%) |
| 75 Years and over | 42 (67.7%) | 12 (46.2%) |
| Total | 267 (46.8%) | 326 (43.4%) |
Income Below Poverty Among Married-Couple Families in Indios
The poverty statistics for married-couple families in Indios show that 36.3% or 78 of the total 215 families live below the poverty line. Families with no children have the highest poverty rate of 38.8%, comprising of 78 families. On the other hand, families with 3 or 4 children have the lowest poverty rate of 0.0%, which includes 0 families.
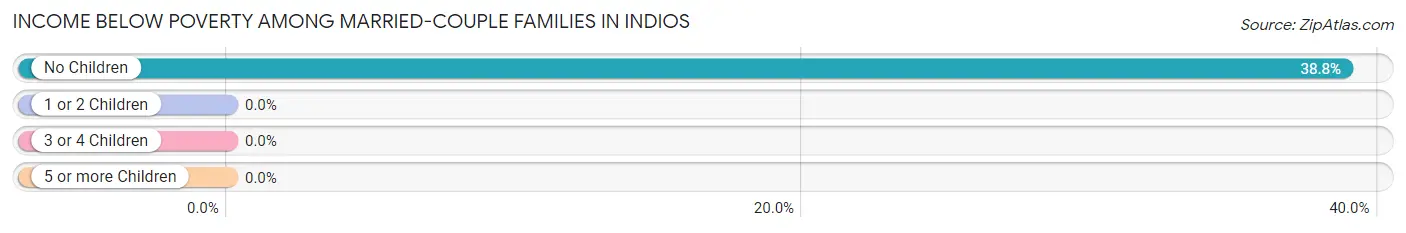
| Children | Above Poverty | Below Poverty |
| No Children | 123 (61.2%) | 78 (38.8%) |
| 1 or 2 Children | 0 (0.0%) | 0 (0.0%) |
| 3 or 4 Children | 14 (100.0%) | 0 (0.0%) |
| 5 or more Children | 0 (0.0%) | 0 (0.0%) |
| Total | 137 (63.7%) | 78 (36.3%) |
Income Below Poverty Among Single-Parent Households in Indios
According to the poverty data in Indios, 48.4% or 15 single-father households and 88.8% or 119 single-mother households are living below the poverty line. Among single-father households, those with no children have the highest poverty rate, with 15 households (48.4%) experiencing poverty. Likewise, among single-mother households, those with 1 or 2 children have the highest poverty rate, with 84 households (100.0%) falling below the poverty line.
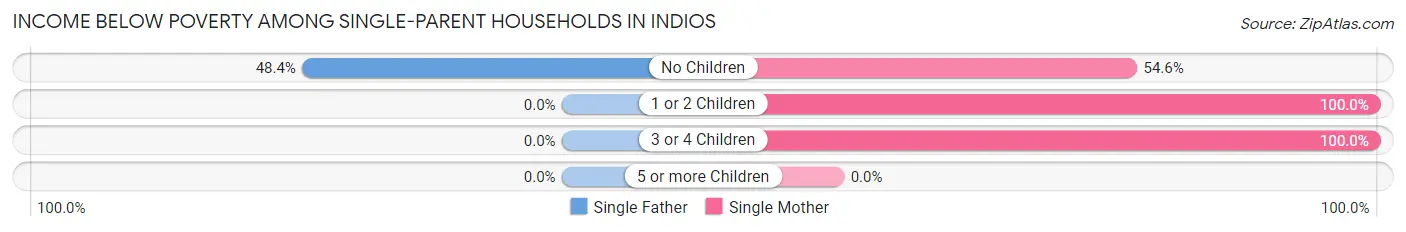
| Children | Single Father | Single Mother |
| No Children | 15 (48.4%) | 18 (54.5%) |
| 1 or 2 Children | 0 (0.0%) | 84 (100.0%) |
| 3 or 4 Children | 0 (0.0%) | 17 (100.0%) |
| 5 or more Children | 0 (0.0%) | 0 (0.0%) |
| Total | 15 (48.4%) | 119 (88.8%) |
Income Below Poverty Among Married-Couple vs Single-Parent Households in Indios
The poverty data for Indios shows that 78 of the married-couple family households (36.3%) and 134 of the single-parent households (81.2%) are living below the poverty level. Within the married-couple family households, those with no children have the highest poverty rate, with 78 households (38.8%) falling below the poverty line. Among the single-parent households, those with 1 or 2 children have the highest poverty rate, with 84 household (100.0%) living below poverty.
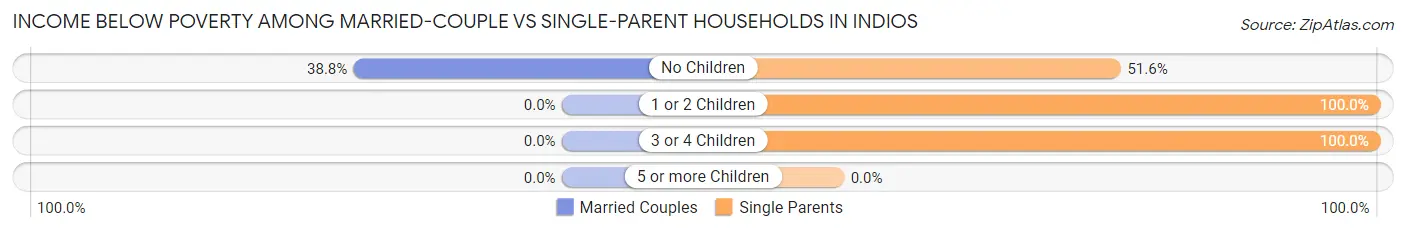
| Children | Married-Couple Families | Single-Parent Households |
| No Children | 78 (38.8%) | 33 (51.6%) |
| 1 or 2 Children | 0 (0.0%) | 84 (100.0%) |
| 3 or 4 Children | 0 (0.0%) | 17 (100.0%) |
| 5 or more Children | 0 (0.0%) | 0 (0.0%) |
| Total | 78 (36.3%) | 134 (81.2%) |
Race in Indios
The most populous races in Indios are Hispanic or Latino (1,322 | 100.0%), White / Caucasian (963 | 72.8%), and Some other Race (250 | 18.9%).
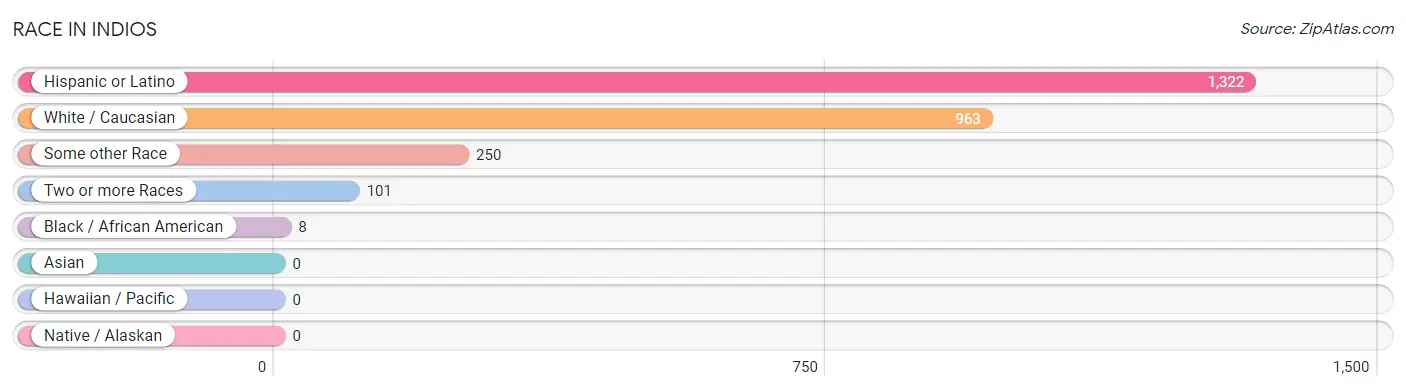
| Race | # Population | % Population |
| Asian | 0 | 0.0% |
| Black / African American | 8 | 0.6% |
| Hawaiian / Pacific | 0 | 0.0% |
| Hispanic or Latino | 1,322 | 100.0% |
| Native / Alaskan | 0 | 0.0% |
| White / Caucasian | 963 | 72.8% |
| Two or more Races | 101 | 7.6% |
| Some other Race | 250 | 18.9% |
| Total | 1,322 | 100.0% |
Ancestry in Indios
The most populous ancestries reported in Indios are , and Puerto Rican (1,322 | 100.0%), together accounting for 100.0% of all Indios residents.

| Ancestry | # Population | % Population |
| Puerto Rican | 1,322 | 100.0% | View All 1 Rows |
Immigrants in Indios

| Immigration Origin | # Population | % Population | View All 0 Rows |
Sex and Age in Indios
Sex and Age in Indios
The most populous age groups in Indios are 25 to 29 Years (94 | 16.5%) for men and 10 to 14 Years (136 | 18.1%) for women.
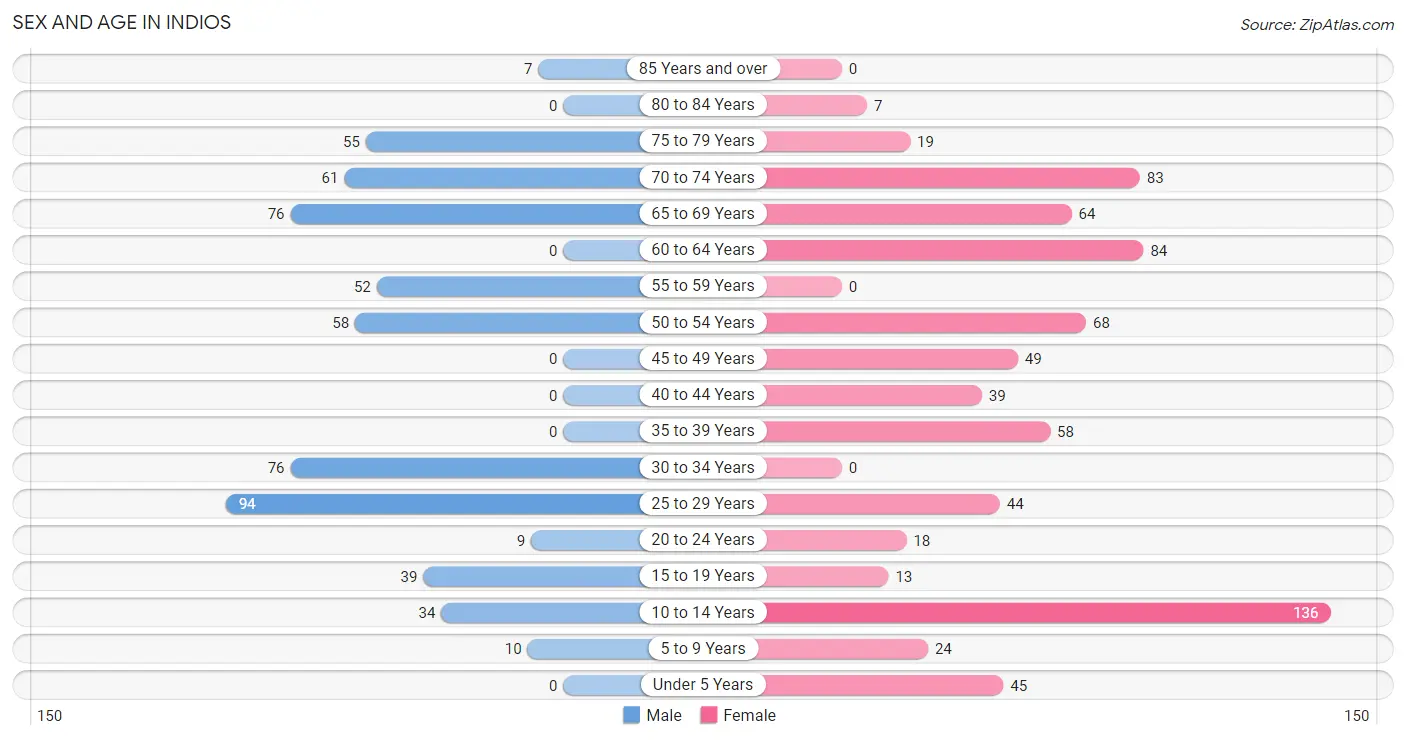
| Age Bracket | Male | Female |
| Under 5 Years | 0 (0.0%) | 45 (6.0%) |
| 5 to 9 Years | 10 (1.8%) | 24 (3.2%) |
| 10 to 14 Years | 34 (5.9%) | 136 (18.1%) |
| 15 to 19 Years | 39 (6.8%) | 13 (1.7%) |
| 20 to 24 Years | 9 (1.6%) | 18 (2.4%) |
| 25 to 29 Years | 94 (16.5%) | 44 (5.9%) |
| 30 to 34 Years | 76 (13.3%) | 0 (0.0%) |
| 35 to 39 Years | 0 (0.0%) | 58 (7.7%) |
| 40 to 44 Years | 0 (0.0%) | 39 (5.2%) |
| 45 to 49 Years | 0 (0.0%) | 49 (6.5%) |
| 50 to 54 Years | 58 (10.2%) | 68 (9.0%) |
| 55 to 59 Years | 52 (9.1%) | 0 (0.0%) |
| 60 to 64 Years | 0 (0.0%) | 84 (11.2%) |
| 65 to 69 Years | 76 (13.3%) | 64 (8.5%) |
| 70 to 74 Years | 61 (10.7%) | 83 (11.1%) |
| 75 to 79 Years | 55 (9.6%) | 19 (2.5%) |
| 80 to 84 Years | 0 (0.0%) | 7 (0.9%) |
| 85 Years and over | 7 (1.2%) | 0 (0.0%) |
| Total | 571 (100.0%) | 751 (100.0%) |
Families and Households in Indios
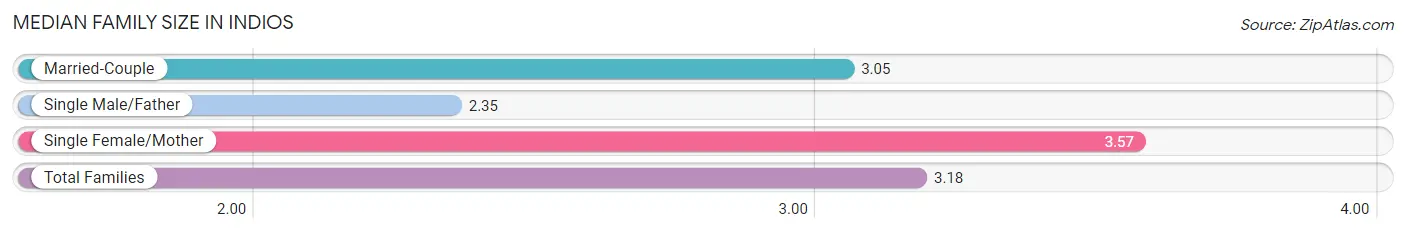
Median Family Size in Indios
The median family size in Indios is 3.18 persons per family, with single female/mother families (134 | 35.3%) accounting for the largest median family size of 3.57 persons per family. On the other hand, single male/father families (31 | 8.2%) represent the smallest median family size with 2.35 persons per family.
| Family Type | # Families | Family Size |
| Married-Couple | 215 (56.6%) | 3.05 |
| Single Male/Father | 31 (8.2%) | 2.35 |
| Single Female/Mother | 134 (35.3%) | 3.57 |
| Total Families | 380 (100.0%) | 3.18 |
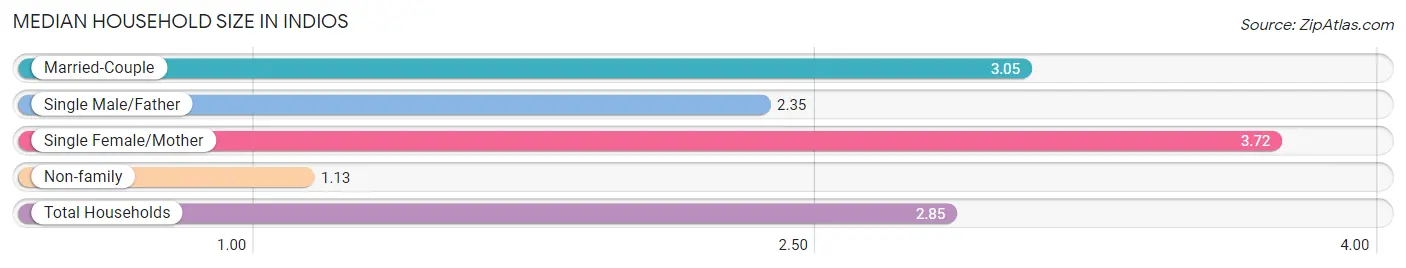
Median Household Size in Indios
The median household size in Indios is 2.85 persons per household, with single female/mother households (134 | 28.9%) accounting for the largest median household size of 3.72 persons per household. non-family households (84 | 18.1%) represent the smallest median household size with 1.13 persons per household.
| Household Type | # Households | Household Size |
| Married-Couple | 215 (46.3%) | 3.05 |
| Single Male/Father | 31 (6.7%) | 2.35 |
| Single Female/Mother | 134 (28.9%) | 3.72 |
| Non-family | 84 (18.1%) | 1.13 |
| Total Households | 464 (100.0%) | 2.85 |
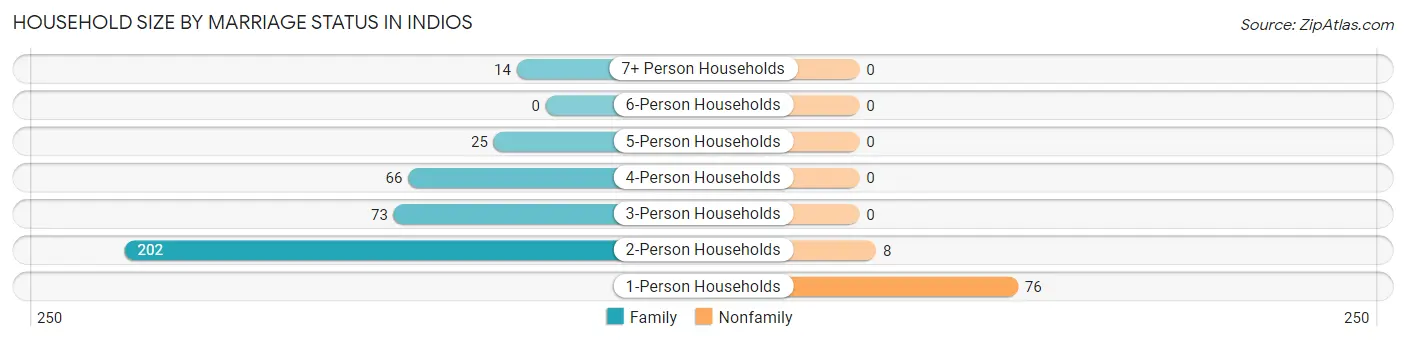
Household Size by Marriage Status in Indios
Out of a total of 464 households in Indios, 380 (81.9%) are family households, while 84 (18.1%) are nonfamily households. The most numerous type of family households are 2-person households, comprising 202, and the most common type of nonfamily households are 1-person households, comprising 76.
| Household Size | Family Households | Nonfamily Households |
| 1-Person Households | - | 76 (16.4%) |
| 2-Person Households | 202 (43.5%) | 8 (1.7%) |
| 3-Person Households | 73 (15.7%) | 0 (0.0%) |
| 4-Person Households | 66 (14.2%) | 0 (0.0%) |
| 5-Person Households | 25 (5.4%) | 0 (0.0%) |
| 6-Person Households | 0 (0.0%) | 0 (0.0%) |
| 7+ Person Households | 14 (3.0%) | 0 (0.0%) |
| Total | 380 (81.9%) | 84 (18.1%) |
Female Fertility in Indios
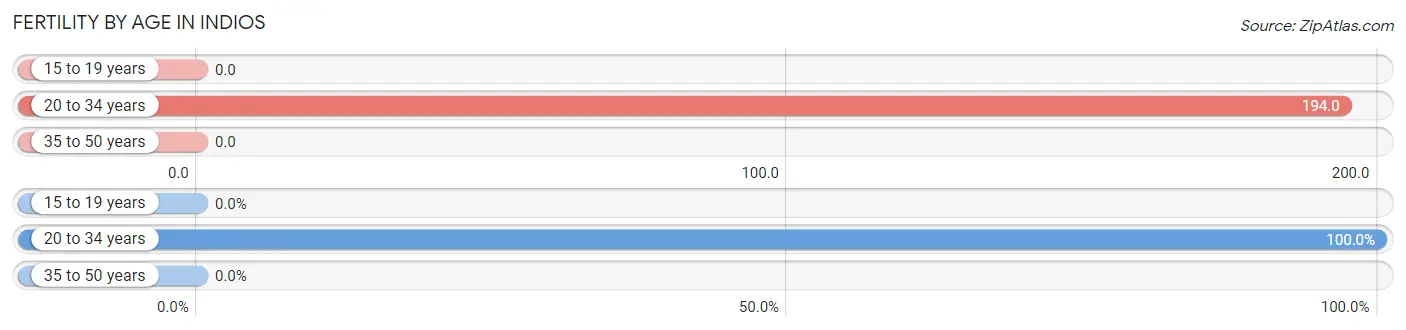
Fertility by Age in Indios
Average fertility rate in Indios is 54.0 births per 1,000 women. Women in the age bracket of 20 to 34 years have the highest fertility rate with 194.0 births per 1,000 women. Women in the age bracket of 20 to 34 years acount for 100.0% of all women with births.
| Age Bracket | Women with Births | Births / 1,000 Women |
| 15 to 19 years | 0 (0.0%) | 0.0 |
| 20 to 34 years | 12 (100.0%) | 194.0 |
| 35 to 50 years | 0 (0.0%) | 0.0 |
| Total | 12 (100.0%) | 54.0 |
Fertility by Age by Marriage Status in Indios
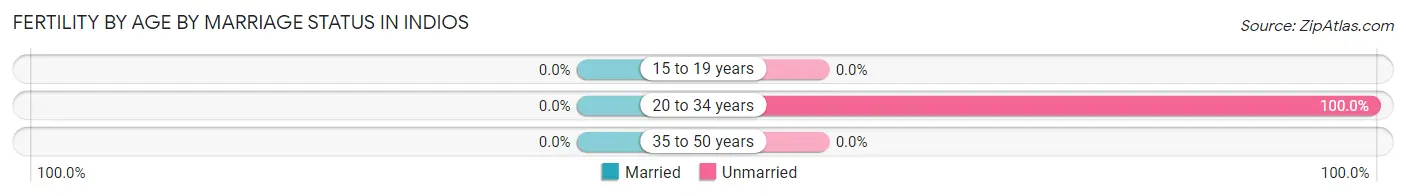
| Age Bracket | Married | Unmarried |
| 15 to 19 years | 0 (0.0%) | 0 (0.0%) |
| 20 to 34 years | 0 (0.0%) | 12 (100.0%) |
| 35 to 50 years | 0 (0.0%) | 0 (0.0%) |
| Total | 0 (0.0%) | 12 (100.0%) |
Fertility by Education in Indios
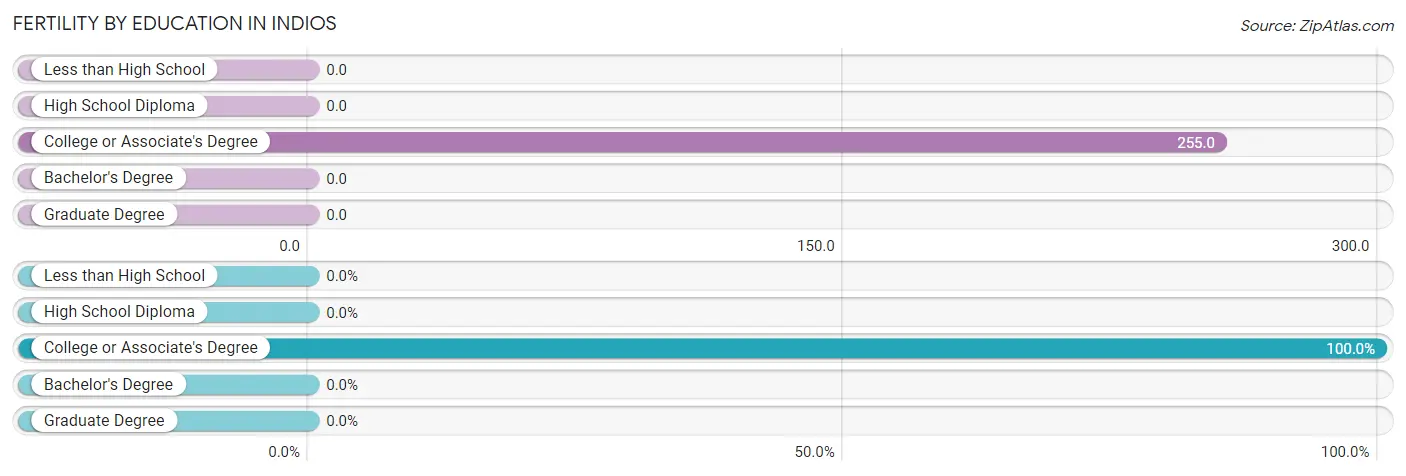
| Educational Attainment | Women with Births | Births / 1,000 Women |
| Less than High School | 0 (0.0%) | 0.0 |
| High School Diploma | 0 (0.0%) | 0.0 |
| College or Associate's Degree | 12 (100.0%) | 255.0 |
| Bachelor's Degree | 0 (0.0%) | 0.0 |
| Graduate Degree | 0 (0.0%) | 0.0 |
| Total | 12 (100.0%) | 54.0 |
Fertility by Education by Marriage Status in Indios
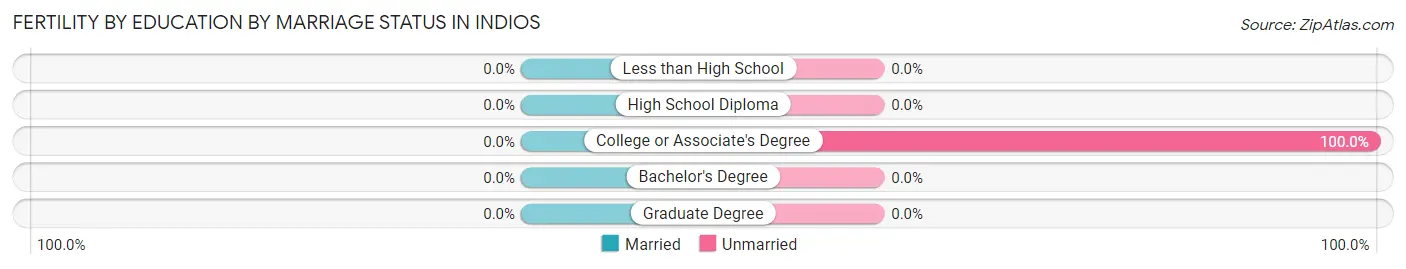
| Educational Attainment | Married | Unmarried |
| Less than High School | 0 (0.0%) | 0 (0.0%) |
| High School Diploma | 0 (0.0%) | 0 (0.0%) |
| College or Associate's Degree | 0 (0.0%) | 12 (100.0%) |
| Bachelor's Degree | 0 (0.0%) | 0 (0.0%) |
| Graduate Degree | 0 (0.0%) | 0 (0.0%) |
| Total | 0 (0.0%) | 12 (100.0%) |
Employment Characteristics in Indios
Employment by Class of Employer in Indios
Among the 277 employed individuals in Indios, private company employees (161 | 58.1%), local government employees (53 | 19.1%), and self-employed (not incorporated) (42 | 15.2%) make up the most common classes of employment.
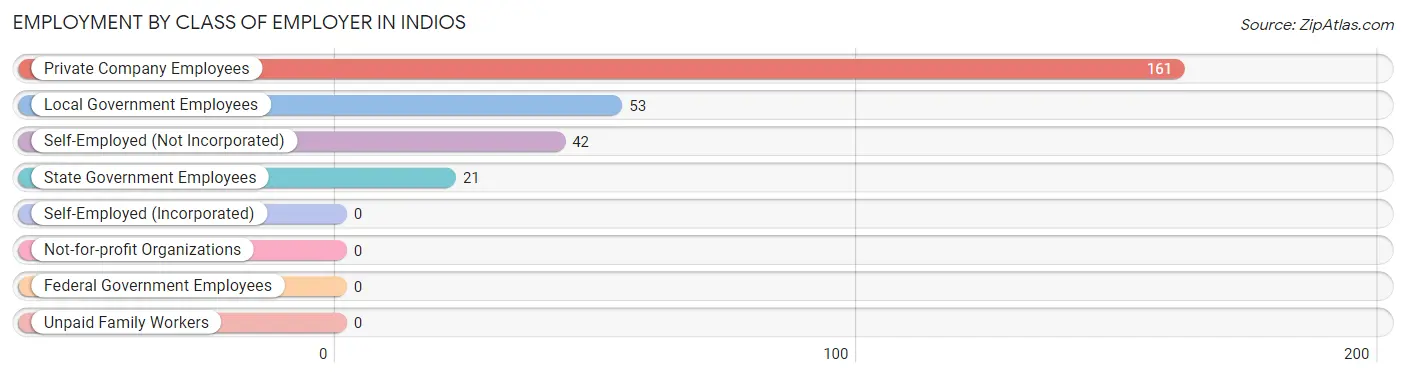
| Employer Class | # Employees | % Employees |
| Private Company Employees | 161 | 58.1% |
| Self-Employed (Incorporated) | 0 | 0.0% |
| Self-Employed (Not Incorporated) | 42 | 15.2% |
| Not-for-profit Organizations | 0 | 0.0% |
| Local Government Employees | 53 | 19.1% |
| State Government Employees | 21 | 7.6% |
| Federal Government Employees | 0 | 0.0% |
| Unpaid Family Workers | 0 | 0.0% |
| Total | 277 | 100.0% |
Employment Status by Age in Indios
According to the labor force statistics for Indios, out of the total population over 16 years of age (1,060), 35.1% or 372 individuals are in the labor force, with 25.5% or 95 of them unemployed. The age group with the highest labor force participation rate is 25 to 29 years, with 81.2% or 112 individuals in the labor force. Within the labor force, the 35 to 44 years age range has the highest percentage of unemployed individuals, with 100.0% or 21 of them being unemployed.
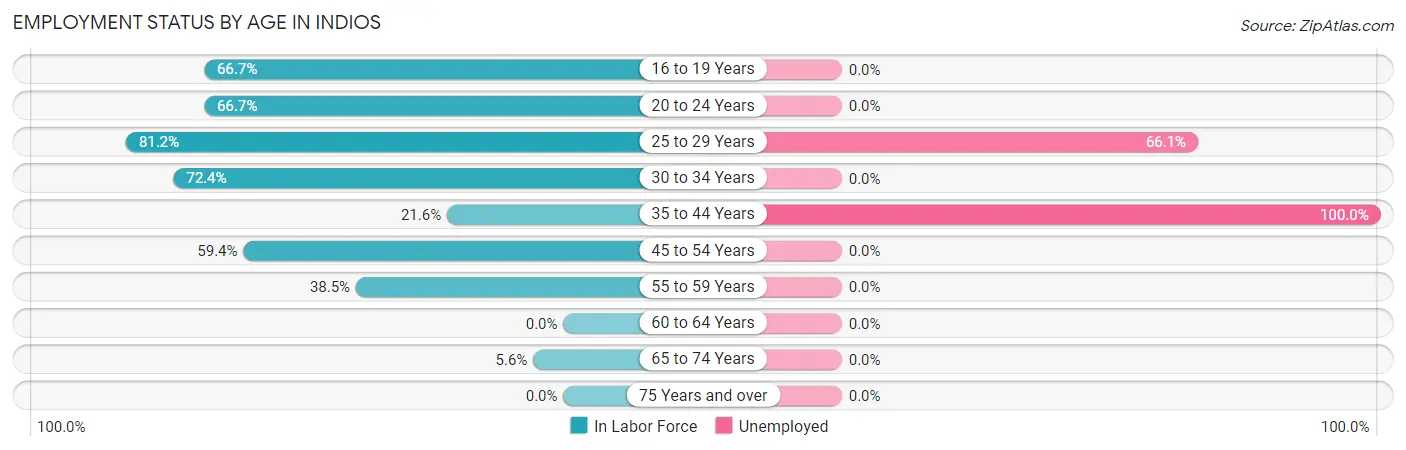
| Age Bracket | In Labor Force | Unemployed |
| 16 to 19 Years | 26 (66.7%) | 0 (0.0%) |
| 20 to 24 Years | 18 (66.7%) | 0 (0.0%) |
| 25 to 29 Years | 112 (81.2%) | 74 (66.1%) |
| 30 to 34 Years | 55 (72.4%) | 0 (0.0%) |
| 35 to 44 Years | 21 (21.6%) | 21 (100.0%) |
| 45 to 54 Years | 104 (59.4%) | 0 (0.0%) |
| 55 to 59 Years | 20 (38.5%) | 0 (0.0%) |
| 60 to 64 Years | 0 (0.0%) | 0 (0.0%) |
| 65 to 74 Years | 16 (5.6%) | 0 (0.0%) |
| 75 Years and over | 0 (0.0%) | 0 (0.0%) |
| Total | 372 (35.1%) | 95 (25.5%) |
Employment Status by Educational Attainment in Indios
According to labor force statistics for Indios, 50.2% of individuals (312) out of the total population between 25 and 64 years of age (622) are in the labor force, with 30.4% or 95 of them being unemployed. The group with the highest labor force participation rate are those with the educational attainment of bachelor's degree or higher, with 72.4% or 142 individuals in the labor force. Within the labor force, individuals with bachelor's degree or higher education have the highest percentage of unemployment, with 66.9% or 95 of them being unemployed.
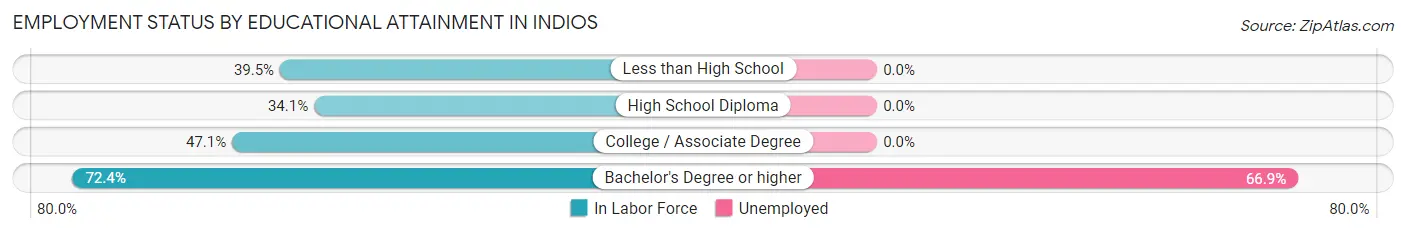
| Educational Attainment | In Labor Force | Unemployed |
| Less than High School | 34 (39.5%) | 0 (0.0%) |
| High School Diploma | 63 (34.1%) | 0 (0.0%) |
| College / Associate Degree | 73 (47.1%) | 0 (0.0%) |
| Bachelor's Degree or higher | 142 (72.4%) | 131 (66.9%) |
| Total | 312 (50.2%) | 189 (30.4%) |
Employment Occupations by Sex in Indios
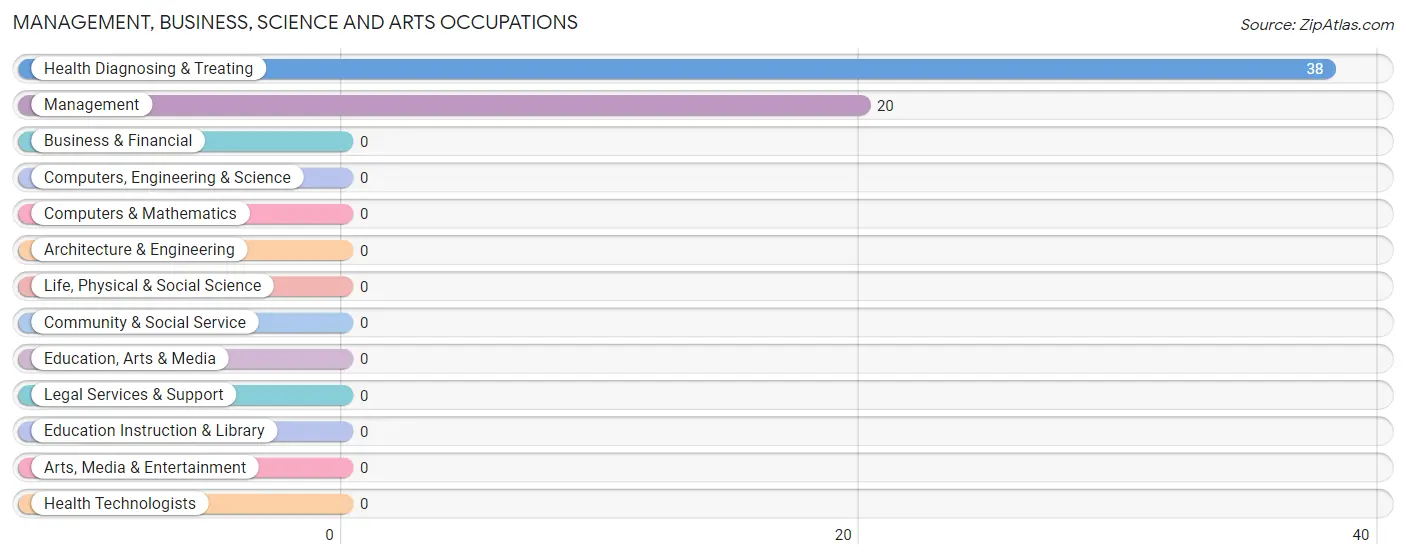
Management, Business, Science and Arts Occupations
The most common Management, Business, Science and Arts occupations in Indios are Health Diagnosing & Treating (38 | 13.7%), and Management (20 | 7.2%).
Management, Business, Science and Arts Occupations by Sex
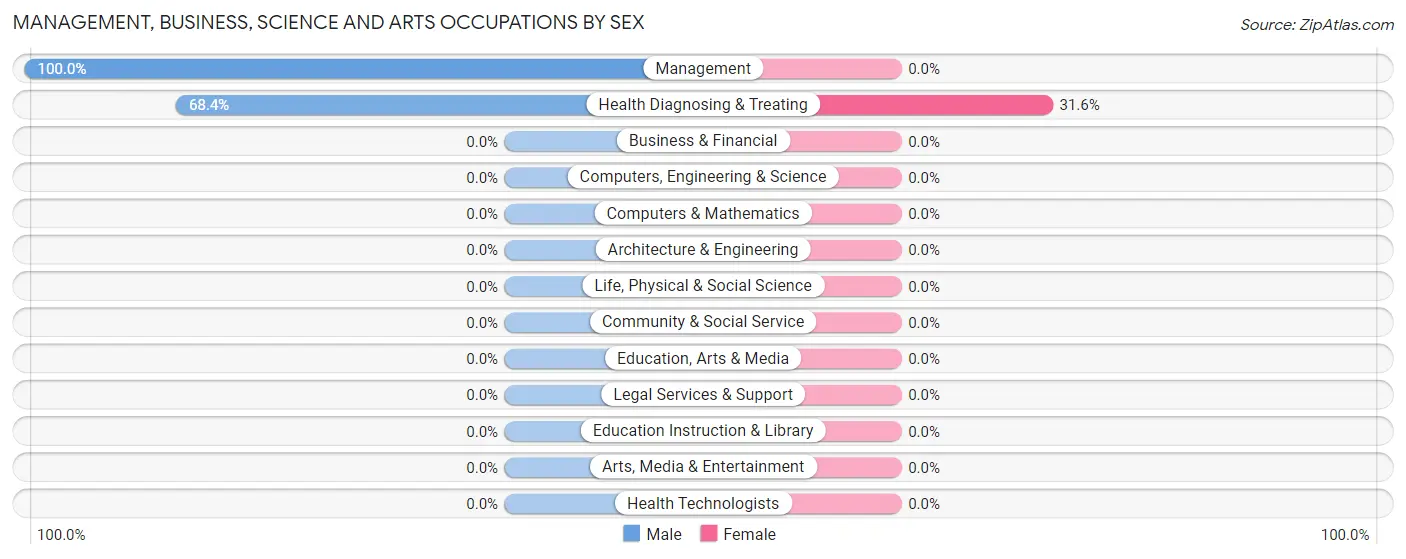
| Occupation | Male | Female |
| Management | 20 (100.0%) | 0 (0.0%) |
| Business & Financial | 0 (0.0%) | 0 (0.0%) |
| Computers, Engineering & Science | 0 (0.0%) | 0 (0.0%) |
| Computers & Mathematics | 0 (0.0%) | 0 (0.0%) |
| Architecture & Engineering | 0 (0.0%) | 0 (0.0%) |
| Life, Physical & Social Science | 0 (0.0%) | 0 (0.0%) |
| Community & Social Service | 0 (0.0%) | 0 (0.0%) |
| Education, Arts & Media | 0 (0.0%) | 0 (0.0%) |
| Legal Services & Support | 0 (0.0%) | 0 (0.0%) |
| Education Instruction & Library | 0 (0.0%) | 0 (0.0%) |
| Arts, Media & Entertainment | 0 (0.0%) | 0 (0.0%) |
| Health Diagnosing & Treating | 26 (68.4%) | 12 (31.6%) |
| Health Technologists | 0 (0.0%) | 0 (0.0%) |
| Total (Category) | 46 (79.3%) | 12 (20.7%) |
| Total (Overall) | 155 (56.0%) | 122 (44.0%) |
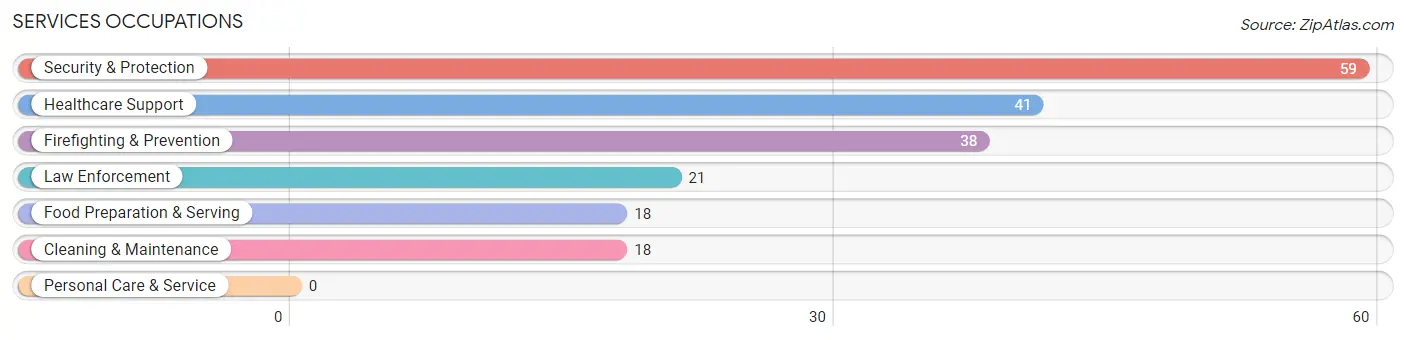
Services Occupations
The most common Services occupations in Indios are Security & Protection (59 | 21.3%), Healthcare Support (41 | 14.8%), Firefighting & Prevention (38 | 13.7%), Law Enforcement (21 | 7.6%), and Food Preparation & Serving (18 | 6.5%).
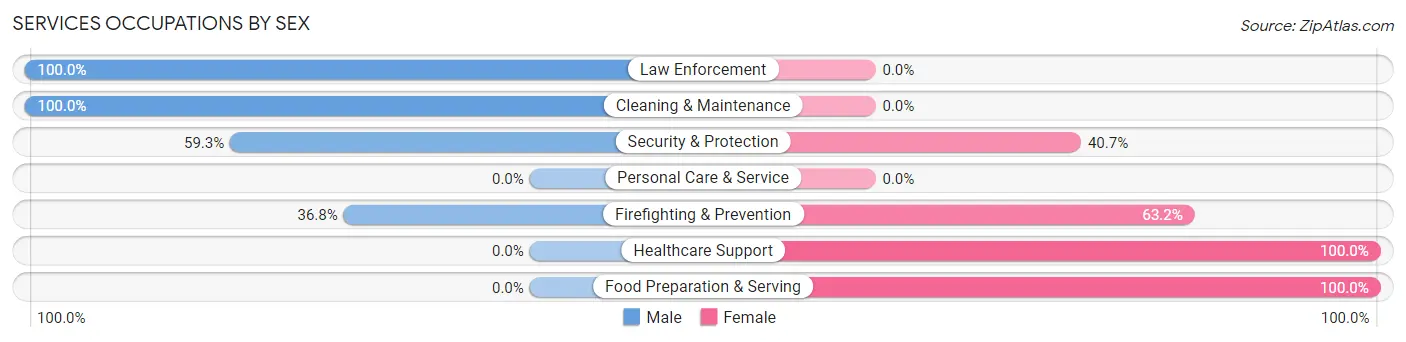
Services Occupations by Sex
Within the Services occupations in Indios, the most male-oriented occupations are Law Enforcement (100.0%), Cleaning & Maintenance (100.0%), and Security & Protection (59.3%), while the most female-oriented occupations are Healthcare Support (100.0%), Food Preparation & Serving (100.0%), and Firefighting & Prevention (63.2%).
| Occupation | Male | Female |
| Healthcare Support | 0 (0.0%) | 41 (100.0%) |
| Security & Protection | 35 (59.3%) | 24 (40.7%) |
| Firefighting & Prevention | 14 (36.8%) | 24 (63.2%) |
| Law Enforcement | 21 (100.0%) | 0 (0.0%) |
| Food Preparation & Serving | 0 (0.0%) | 18 (100.0%) |
| Cleaning & Maintenance | 18 (100.0%) | 0 (0.0%) |
| Personal Care & Service | 0 (0.0%) | 0 (0.0%) |
| Total (Category) | 53 (39.0%) | 83 (61.0%) |
| Total (Overall) | 155 (56.0%) | 122 (44.0%) |
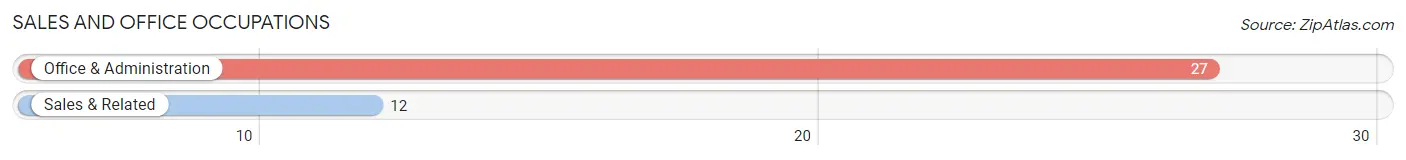
Sales and Office Occupations
The most common Sales and Office occupations in Indios are Office & Administration (27 | 9.8%), and Sales & Related (12 | 4.3%).
Sales and Office Occupations by Sex
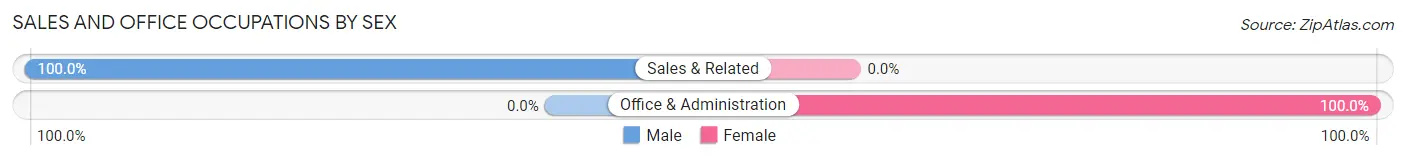
| Occupation | Male | Female |
| Sales & Related | 12 (100.0%) | 0 (0.0%) |
| Office & Administration | 0 (0.0%) | 27 (100.0%) |
| Total (Category) | 12 (30.8%) | 27 (69.2%) |
| Total (Overall) | 155 (56.0%) | 122 (44.0%) |
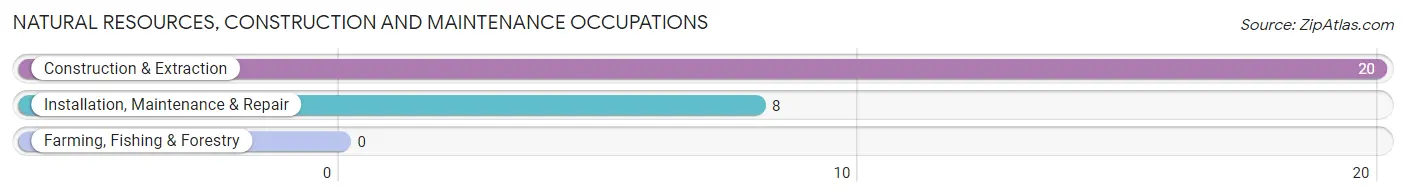
Natural Resources, Construction and Maintenance Occupations
The most common Natural Resources, Construction and Maintenance occupations in Indios are Construction & Extraction (20 | 7.2%), and Installation, Maintenance & Repair (8 | 2.9%).
Natural Resources, Construction and Maintenance Occupations by Sex
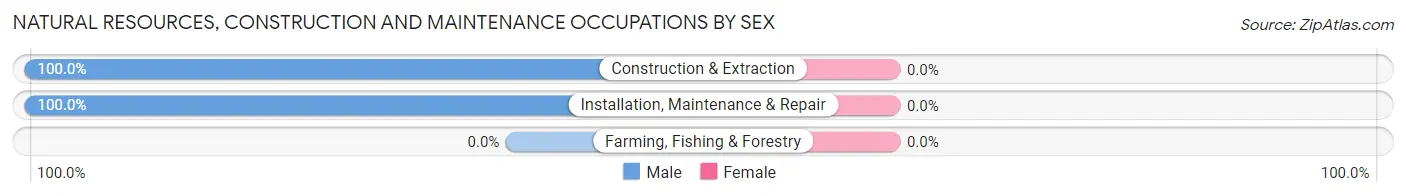
| Occupation | Male | Female |
| Farming, Fishing & Forestry | 0 (0.0%) | 0 (0.0%) |
| Construction & Extraction | 20 (100.0%) | 0 (0.0%) |
| Installation, Maintenance & Repair | 8 (100.0%) | 0 (0.0%) |
| Total (Category) | 28 (100.0%) | 0 (0.0%) |
| Total (Overall) | 155 (56.0%) | 122 (44.0%) |
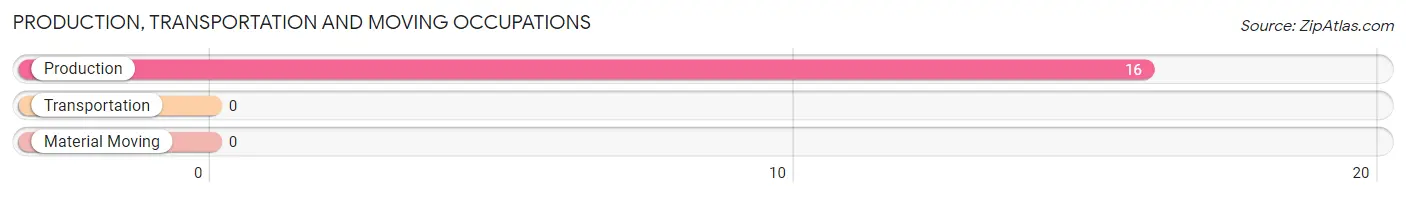
Production, Transportation and Moving Occupations
The most common Production, Transportation and Moving occupations in Indios are , and Production (16 | 5.8%).
Production, Transportation and Moving Occupations by Sex
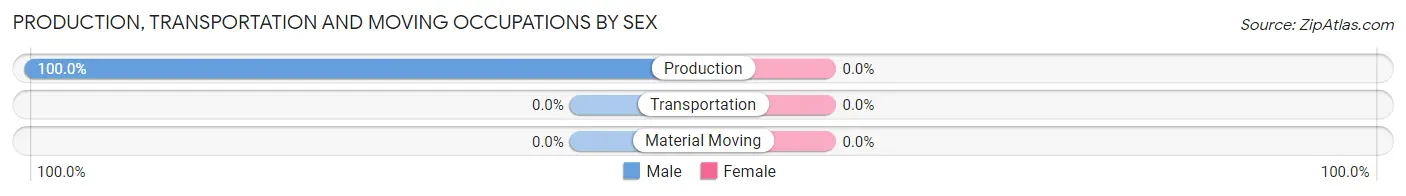
| Occupation | Male | Female |
| Production | 16 (100.0%) | 0 (0.0%) |
| Transportation | 0 (0.0%) | 0 (0.0%) |
| Material Moving | 0 (0.0%) | 0 (0.0%) |
| Total (Category) | 16 (100.0%) | 0 (0.0%) |
| Total (Overall) | 155 (56.0%) | 122 (44.0%) |
Employment Industries by Sex in Indios
Employment Industries in Indios
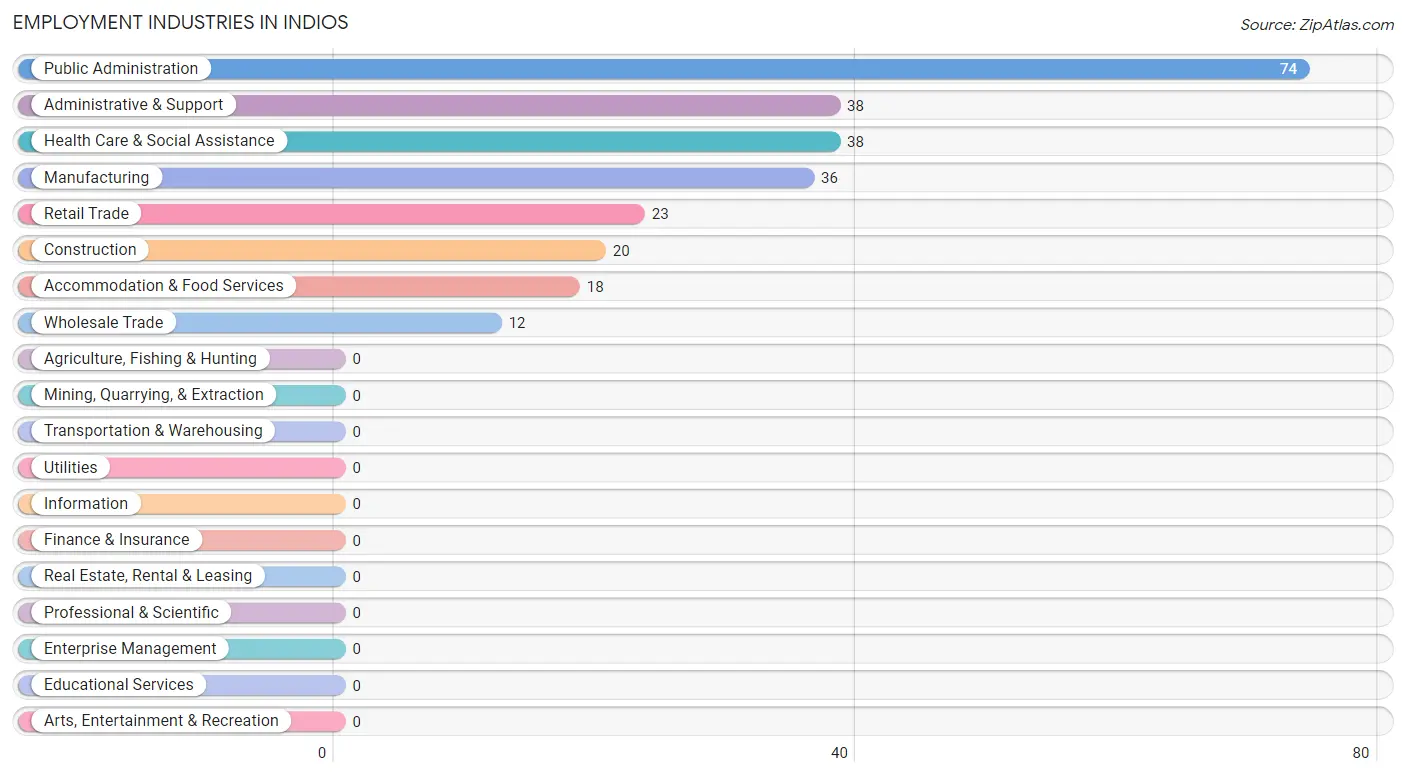
The major employment industries in Indios include Public Administration (74 | 26.7%), Administrative & Support (38 | 13.7%), Health Care & Social Assistance (38 | 13.7%), Manufacturing (36 | 13.0%), and Retail Trade (23 | 8.3%).
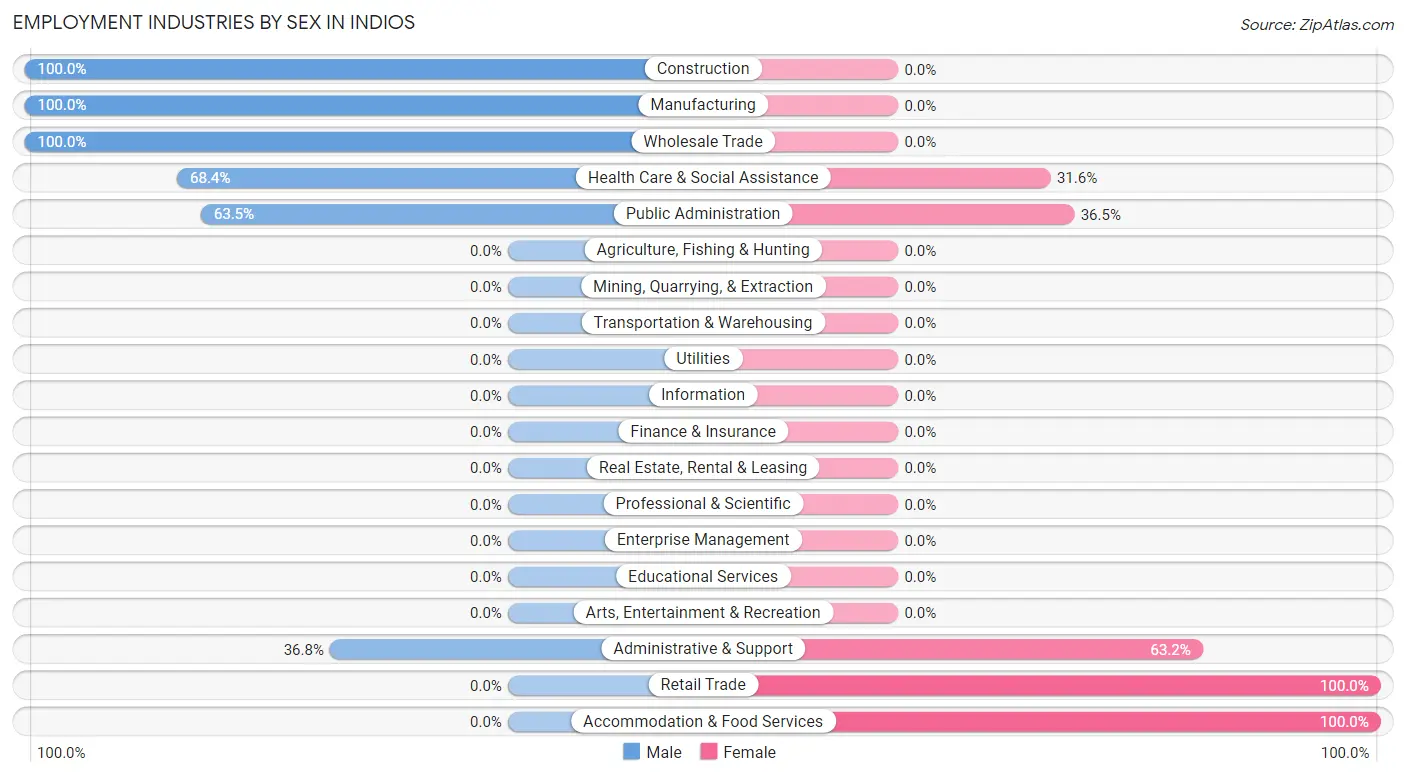
Employment Industries by Sex in Indios
The Indios industries that see more men than women are Construction (100.0%), Manufacturing (100.0%), and Wholesale Trade (100.0%), whereas the industries that tend to have a higher number of women are Retail Trade (100.0%), Accommodation & Food Services (100.0%), and Administrative & Support (63.2%).
| Industry | Male | Female |
| Agriculture, Fishing & Hunting | 0 (0.0%) | 0 (0.0%) |
| Mining, Quarrying, & Extraction | 0 (0.0%) | 0 (0.0%) |
| Construction | 20 (100.0%) | 0 (0.0%) |
| Manufacturing | 36 (100.0%) | 0 (0.0%) |
| Wholesale Trade | 12 (100.0%) | 0 (0.0%) |
| Retail Trade | 0 (0.0%) | 23 (100.0%) |
| Transportation & Warehousing | 0 (0.0%) | 0 (0.0%) |
| Utilities | 0 (0.0%) | 0 (0.0%) |
| Information | 0 (0.0%) | 0 (0.0%) |
| Finance & Insurance | 0 (0.0%) | 0 (0.0%) |
| Real Estate, Rental & Leasing | 0 (0.0%) | 0 (0.0%) |
| Professional & Scientific | 0 (0.0%) | 0 (0.0%) |
| Enterprise Management | 0 (0.0%) | 0 (0.0%) |
| Administrative & Support | 14 (36.8%) | 24 (63.2%) |
| Educational Services | 0 (0.0%) | 0 (0.0%) |
| Health Care & Social Assistance | 26 (68.4%) | 12 (31.6%) |
| Arts, Entertainment & Recreation | 0 (0.0%) | 0 (0.0%) |
| Accommodation & Food Services | 0 (0.0%) | 18 (100.0%) |
| Public Administration | 47 (63.5%) | 27 (36.5%) |
| Total | 155 (56.0%) | 122 (44.0%) |
Education in Indios
School Enrollment in Indios
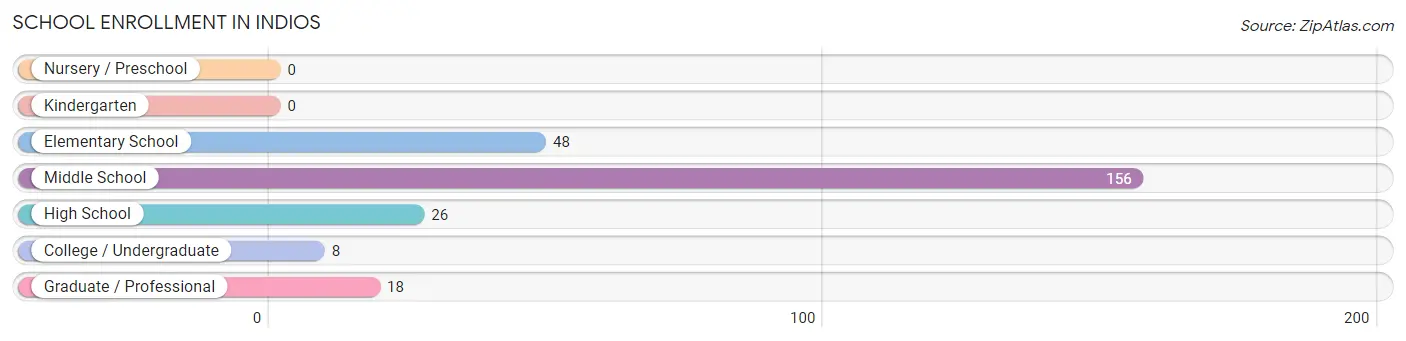
The most common levels of schooling among the 256 students in Indios are middle school (156 | 60.9%), elementary school (48 | 18.8%), and high school (26 | 10.2%).
| School Level | # Students | % Students |
| Nursery / Preschool | 0 | 0.0% |
| Kindergarten | 0 | 0.0% |
| Elementary School | 48 | 18.8% |
| Middle School | 156 | 60.9% |
| High School | 26 | 10.2% |
| College / Undergraduate | 8 | 3.1% |
| Graduate / Professional | 18 | 7.0% |
| Total | 256 | 100.0% |
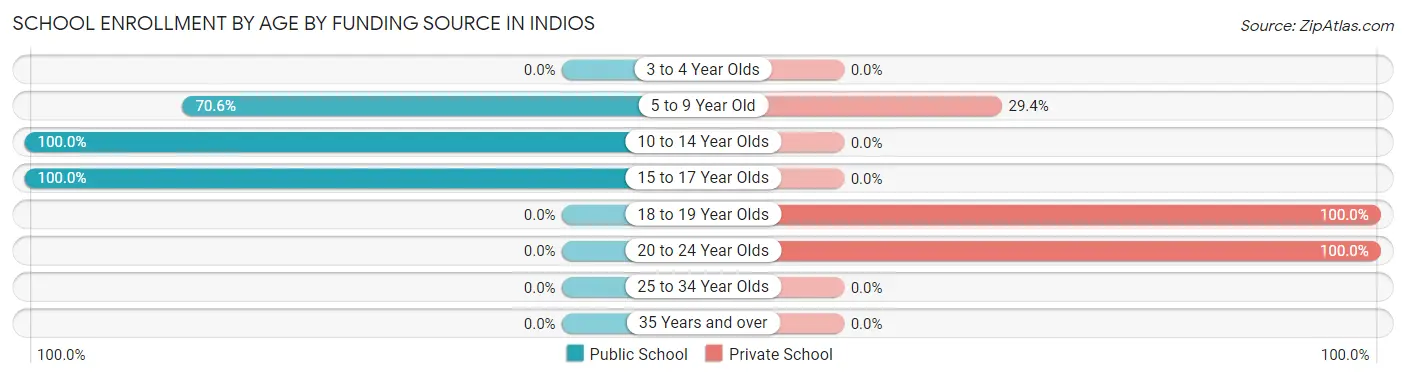
School Enrollment by Age by Funding Source in Indios
Out of a total of 256 students who are enrolled in schools in Indios, 36 (14.1%) attend a private institution, while the remaining 220 (85.9%) are enrolled in public schools. The age group of 18 to 19 year olds has the highest likelihood of being enrolled in private schools, with 8 (100.0% in the age bracket) enrolled. Conversely, the age group of 10 to 14 year olds has the lowest likelihood of being enrolled in a private school, with 170 (100.0% in the age bracket) attending a public institution.
| Age Bracket | Public School | Private School |
| 3 to 4 Year Olds | 0 (0.0%) | 0 (0.0%) |
| 5 to 9 Year Old | 24 (70.6%) | 10 (29.4%) |
| 10 to 14 Year Olds | 170 (100.0%) | 0 (0.0%) |
| 15 to 17 Year Olds | 26 (100.0%) | 0 (0.0%) |
| 18 to 19 Year Olds | 0 (0.0%) | 8 (100.0%) |
| 20 to 24 Year Olds | 0 (0.0%) | 18 (100.0%) |
| 25 to 34 Year Olds | 0 (0.0%) | 0 (0.0%) |
| 35 Years and over | 0 (0.0%) | 0 (0.0%) |
| Total | 220 (85.9%) | 36 (14.1%) |
Educational Attainment by Field of Study in Indios
Education (83 | 31.8%), science & technology (74 | 28.3%), arts & humanities (57 | 21.8%), business (27 | 10.3%), and physical & health sciences (20 | 7.7%) are the most common fields of study among 261 individuals in Indios who have obtained a bachelor's degree or higher.
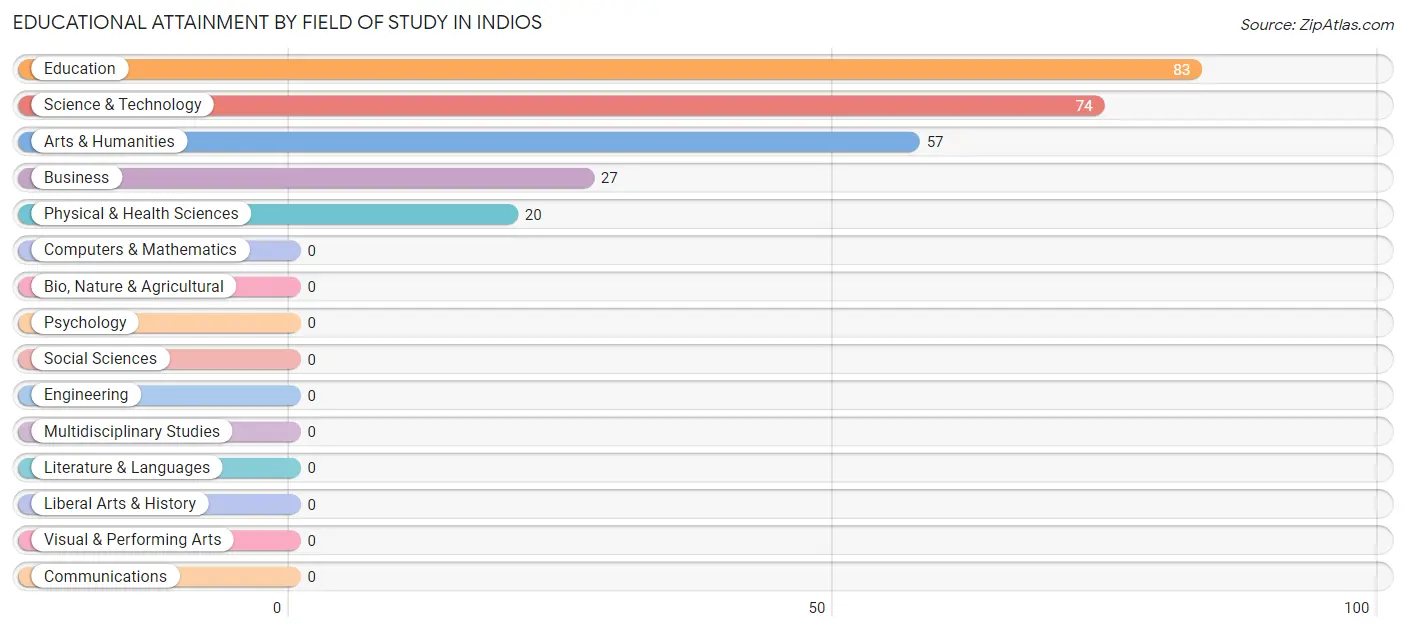
| Field of Study | # Graduates | % Graduates |
| Computers & Mathematics | 0 | 0.0% |
| Bio, Nature & Agricultural | 0 | 0.0% |
| Physical & Health Sciences | 20 | 7.7% |
| Psychology | 0 | 0.0% |
| Social Sciences | 0 | 0.0% |
| Engineering | 0 | 0.0% |
| Multidisciplinary Studies | 0 | 0.0% |
| Science & Technology | 74 | 28.3% |
| Business | 27 | 10.3% |
| Education | 83 | 31.8% |
| Literature & Languages | 0 | 0.0% |
| Liberal Arts & History | 0 | 0.0% |
| Visual & Performing Arts | 0 | 0.0% |
| Communications | 0 | 0.0% |
| Arts & Humanities | 57 | 21.8% |
| Total | 261 | 100.0% |
Transportation & Commute in Indios
Vehicle Availability by Sex in Indios
The most prevalent vehicle ownership categories in Indios are males with 3 vehicles (67, accounting for 43.2%) and females with 3 vehicles (18, making up 54.9%).
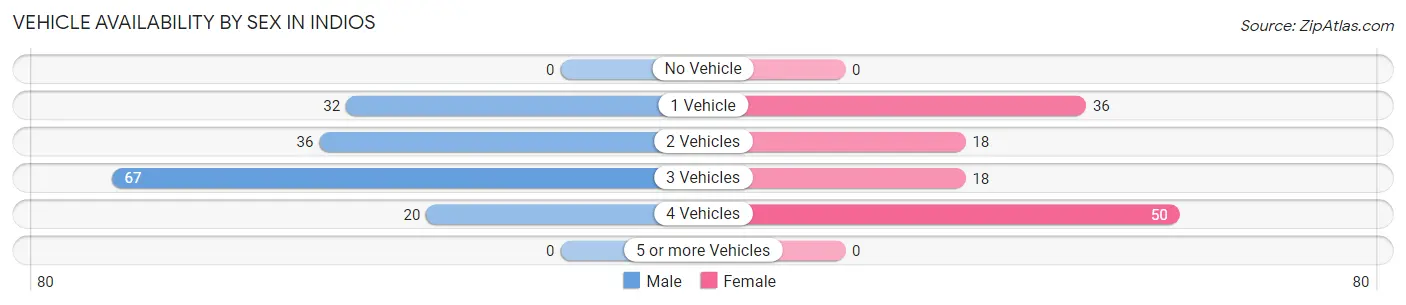
| Vehicles Available | Male | Female |
| No Vehicle | 0 (0.0%) | 0 (0.0%) |
| 1 Vehicle | 32 (20.6%) | 36 (29.5%) |
| 2 Vehicles | 36 (23.2%) | 18 (14.7%) |
| 3 Vehicles | 67 (43.2%) | 18 (14.7%) |
| 4 Vehicles | 20 (12.9%) | 50 (41.0%) |
| 5 or more Vehicles | 0 (0.0%) | 0 (0.0%) |
| Total | 155 (100.0%) | 122 (100.0%) |
Commute Time in Indios
The most frequently occuring commute durations in Indios are 15 to 19 minutes (99 commuters, 35.7%), 25 to 29 minutes (44 commuters, 15.9%), and 5 to 9 minutes (38 commuters, 13.7%).
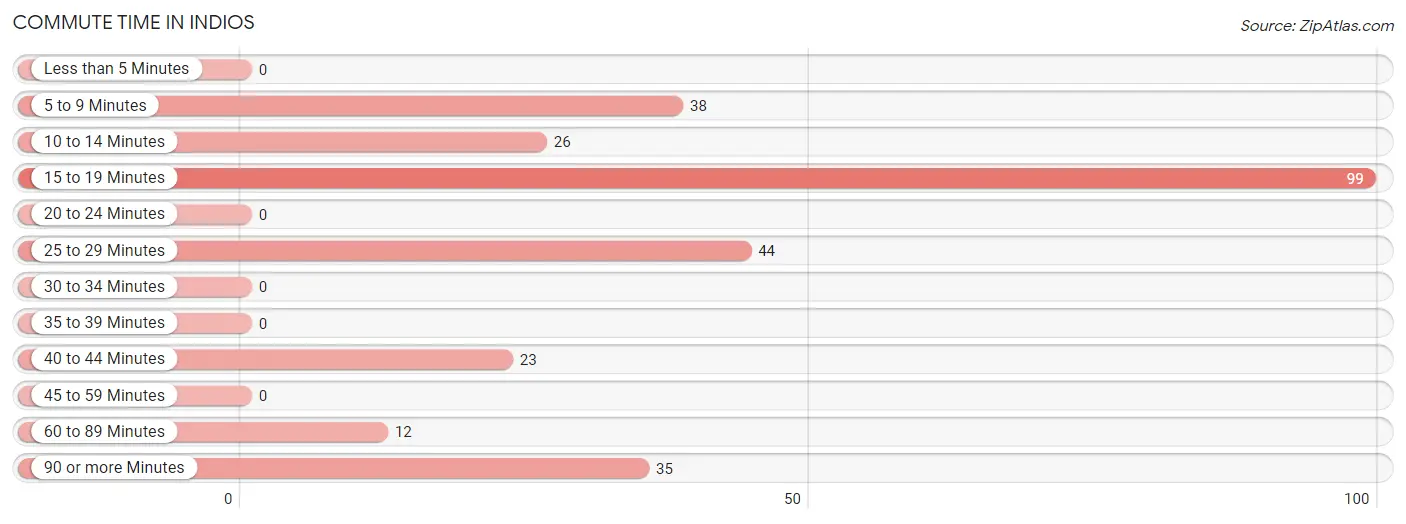
| Commute Time | # Commuters | % Commuters |
| Less than 5 Minutes | 0 | 0.0% |
| 5 to 9 Minutes | 38 | 13.7% |
| 10 to 14 Minutes | 26 | 9.4% |
| 15 to 19 Minutes | 99 | 35.7% |
| 20 to 24 Minutes | 0 | 0.0% |
| 25 to 29 Minutes | 44 | 15.9% |
| 30 to 34 Minutes | 0 | 0.0% |
| 35 to 39 Minutes | 0 | 0.0% |
| 40 to 44 Minutes | 23 | 8.3% |
| 45 to 59 Minutes | 0 | 0.0% |
| 60 to 89 Minutes | 12 | 4.3% |
| 90 or more Minutes | 35 | 12.6% |
Commute Time by Sex in Indios
The most common commute times in Indios are 15 to 19 minutes (36 commuters, 23.2%) for males and 15 to 19 minutes (63 commuters, 51.6%) for females.
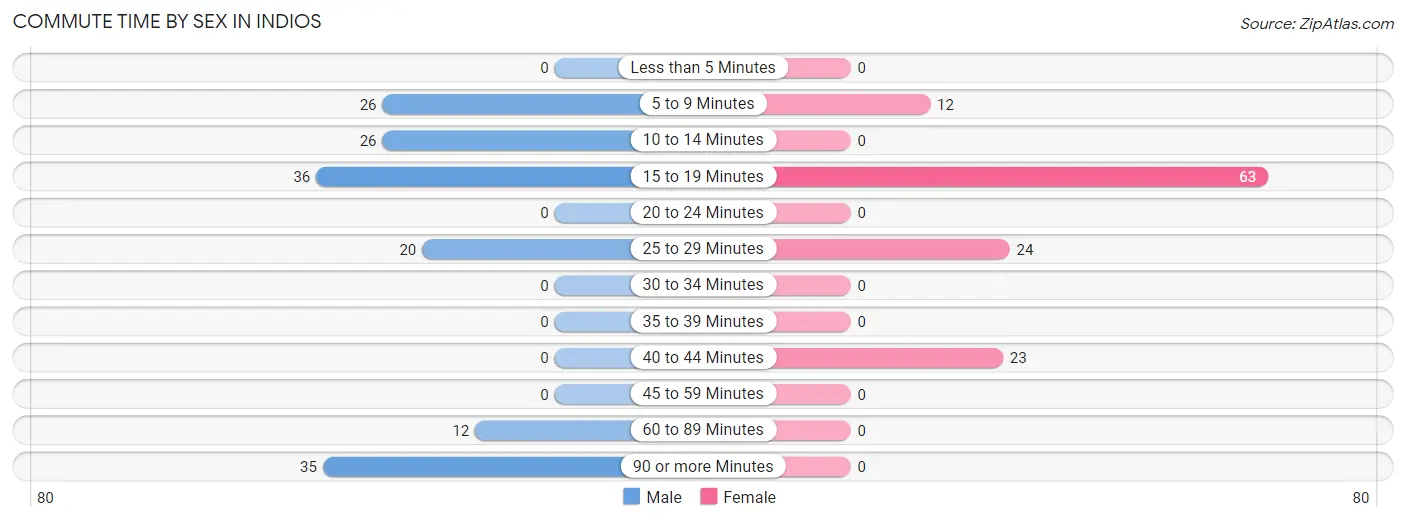
| Commute Time | Male | Female |
| Less than 5 Minutes | 0 (0.0%) | 0 (0.0%) |
| 5 to 9 Minutes | 26 (16.8%) | 12 (9.8%) |
| 10 to 14 Minutes | 26 (16.8%) | 0 (0.0%) |
| 15 to 19 Minutes | 36 (23.2%) | 63 (51.6%) |
| 20 to 24 Minutes | 0 (0.0%) | 0 (0.0%) |
| 25 to 29 Minutes | 20 (12.9%) | 24 (19.7%) |
| 30 to 34 Minutes | 0 (0.0%) | 0 (0.0%) |
| 35 to 39 Minutes | 0 (0.0%) | 0 (0.0%) |
| 40 to 44 Minutes | 0 (0.0%) | 23 (18.9%) |
| 45 to 59 Minutes | 0 (0.0%) | 0 (0.0%) |
| 60 to 89 Minutes | 12 (7.7%) | 0 (0.0%) |
| 90 or more Minutes | 35 (22.6%) | 0 (0.0%) |
Time of Departure to Work by Sex in Indios
The most frequent times of departure to work in Indios are 7:30 AM to 7:59 AM (62, 40.0%) for males and 7:30 AM to 7:59 AM (45, 36.9%) for females.
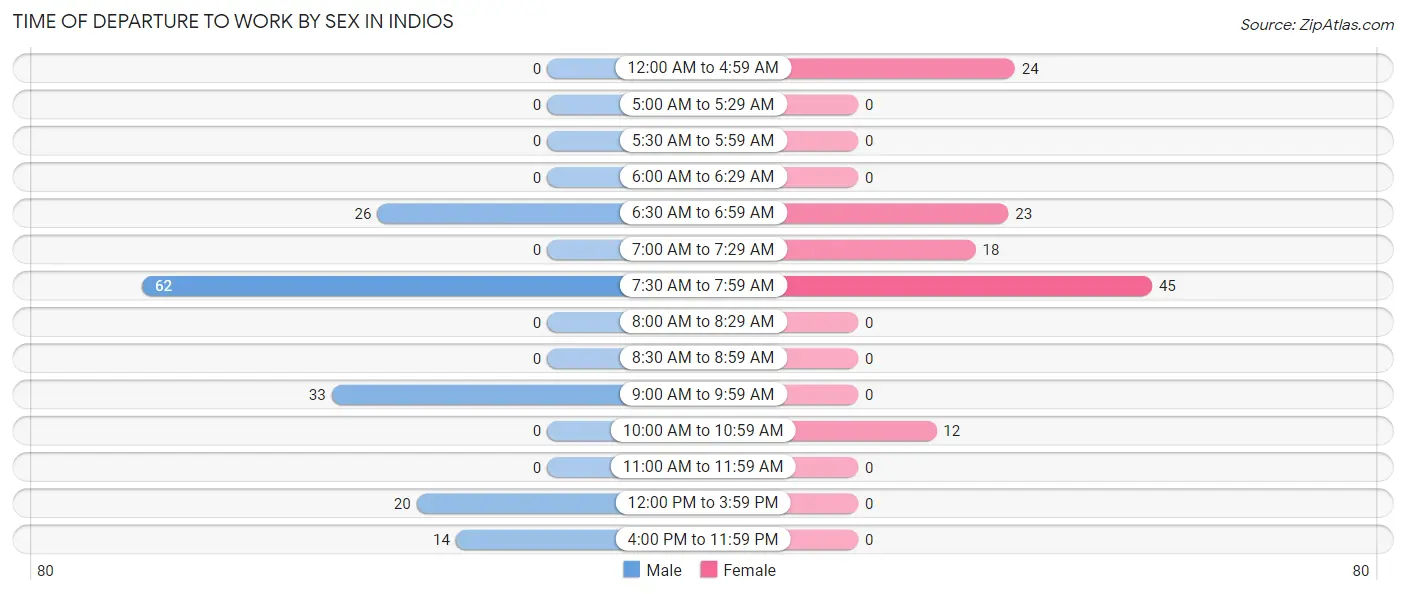
| Time of Departure | Male | Female |
| 12:00 AM to 4:59 AM | 0 (0.0%) | 24 (19.7%) |
| 5:00 AM to 5:29 AM | 0 (0.0%) | 0 (0.0%) |
| 5:30 AM to 5:59 AM | 0 (0.0%) | 0 (0.0%) |
| 6:00 AM to 6:29 AM | 0 (0.0%) | 0 (0.0%) |
| 6:30 AM to 6:59 AM | 26 (16.8%) | 23 (18.9%) |
| 7:00 AM to 7:29 AM | 0 (0.0%) | 18 (14.7%) |
| 7:30 AM to 7:59 AM | 62 (40.0%) | 45 (36.9%) |
| 8:00 AM to 8:29 AM | 0 (0.0%) | 0 (0.0%) |
| 8:30 AM to 8:59 AM | 0 (0.0%) | 0 (0.0%) |
| 9:00 AM to 9:59 AM | 33 (21.3%) | 0 (0.0%) |
| 10:00 AM to 10:59 AM | 0 (0.0%) | 12 (9.8%) |
| 11:00 AM to 11:59 AM | 0 (0.0%) | 0 (0.0%) |
| 12:00 PM to 3:59 PM | 20 (12.9%) | 0 (0.0%) |
| 4:00 PM to 11:59 PM | 14 (9.0%) | 0 (0.0%) |
| Total | 155 (100.0%) | 122 (100.0%) |
Housing Occupancy in Indios
Occupancy by Ownership in Indios
Of the total 464 dwellings in Indios, owner-occupied units account for 328 (70.7%), while renter-occupied units make up 136 (29.3%).
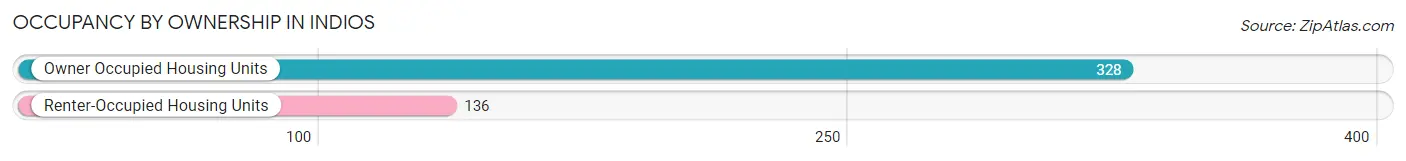
| Occupancy | # Housing Units | % Housing Units |
| Owner Occupied Housing Units | 328 | 70.7% |
| Renter-Occupied Housing Units | 136 | 29.3% |
| Total Occupied Housing Units | 464 | 100.0% |
Occupancy by Household Size in Indios
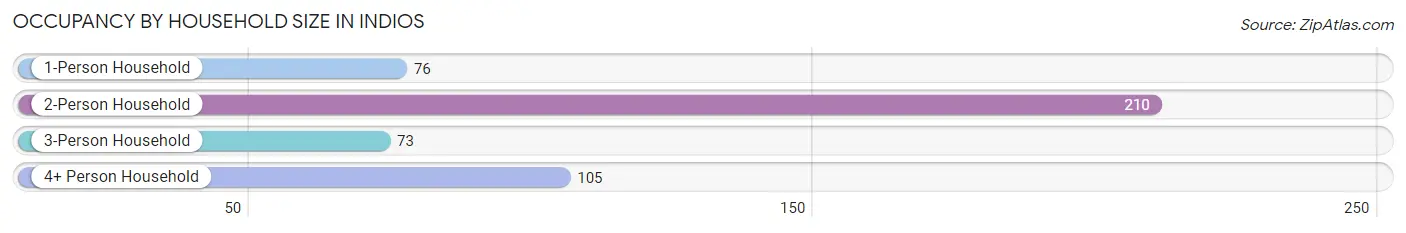
| Household Size | # Housing Units | % Housing Units |
| 1-Person Household | 76 | 16.4% |
| 2-Person Household | 210 | 45.3% |
| 3-Person Household | 73 | 15.7% |
| 4+ Person Household | 105 | 22.6% |
| Total Housing Units | 464 | 100.0% |
Occupancy by Ownership by Household Size in Indios
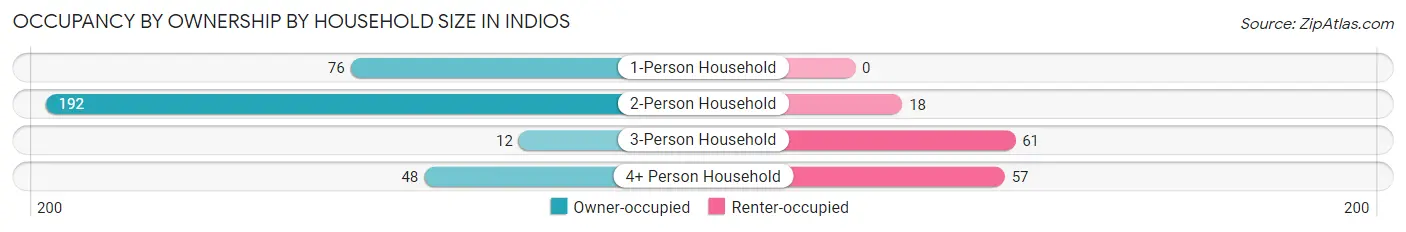
| Household Size | Owner-occupied | Renter-occupied |
| 1-Person Household | 76 (100.0%) | 0 (0.0%) |
| 2-Person Household | 192 (91.4%) | 18 (8.6%) |
| 3-Person Household | 12 (16.4%) | 61 (83.6%) |
| 4+ Person Household | 48 (45.7%) | 57 (54.3%) |
| Total Housing Units | 328 (70.7%) | 136 (29.3%) |
Occupancy by Educational Attainment in Indios
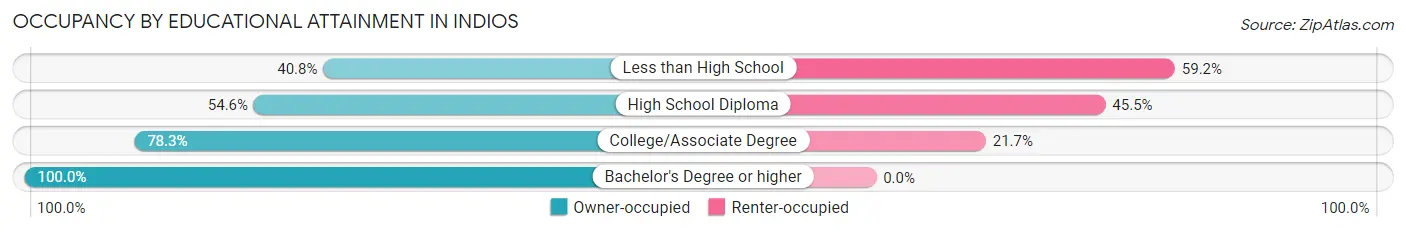
| Household Size | Owner-occupied | Renter-occupied |
| Less than High School | 42 (40.8%) | 61 (59.2%) |
| High School Diploma | 48 (54.5%) | 40 (45.5%) |
| College/Associate Degree | 126 (78.3%) | 35 (21.7%) |
| Bachelor's Degree or higher | 112 (100.0%) | 0 (0.0%) |
Occupancy by Age of Householder in Indios
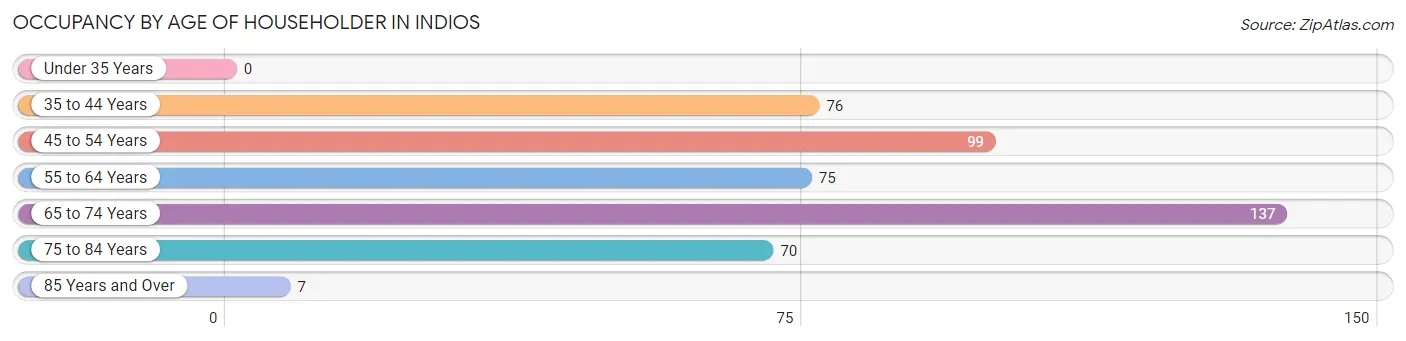
| Age Bracket | # Households | % Households |
| Under 35 Years | 0 | 0.0% |
| 35 to 44 Years | 76 | 16.4% |
| 45 to 54 Years | 99 | 21.3% |
| 55 to 64 Years | 75 | 16.2% |
| 65 to 74 Years | 137 | 29.5% |
| 75 to 84 Years | 70 | 15.1% |
| 85 Years and Over | 7 | 1.5% |
| Total | 464 | 100.0% |
Housing Finances in Indios
Median Income by Occupancy in Indios
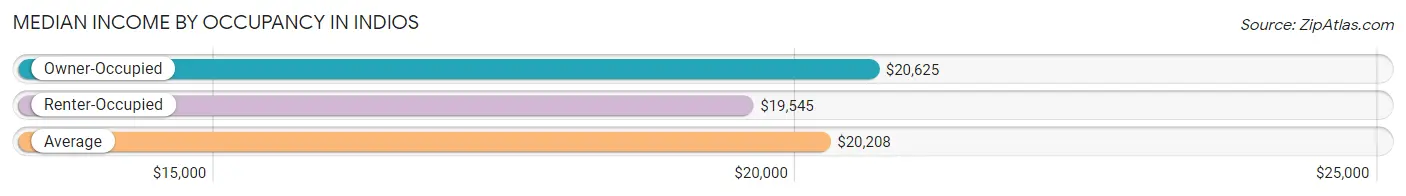
| Occupancy Type | # Households | Median Income |
| Owner-Occupied | 328 (70.7%) | $20,625 |
| Renter-Occupied | 136 (29.3%) | $19,545 |
| Average | 464 (100.0%) | $20,208 |
Occupancy by Householder Income Bracket in Indios
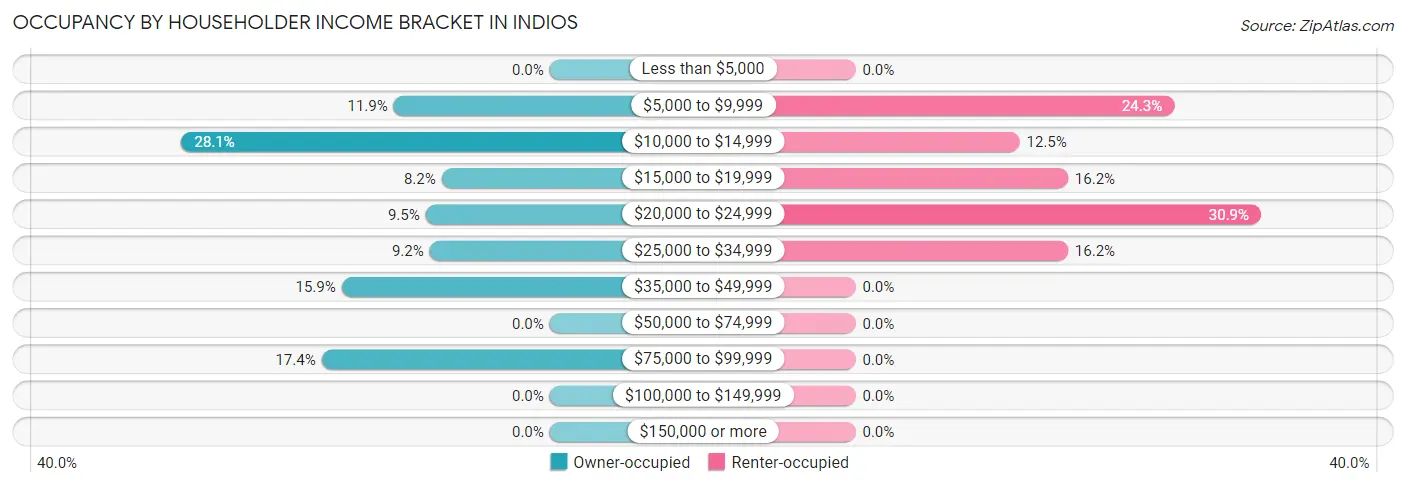
| Income Bracket | Owner-occupied | Renter-occupied |
| Less than $5,000 | 0 (0.0%) | 0 (0.0%) |
| $5,000 to $9,999 | 39 (11.9%) | 33 (24.3%) |
| $10,000 to $14,999 | 92 (28.1%) | 17 (12.5%) |
| $15,000 to $19,999 | 27 (8.2%) | 22 (16.2%) |
| $20,000 to $24,999 | 31 (9.5%) | 42 (30.9%) |
| $25,000 to $34,999 | 30 (9.1%) | 22 (16.2%) |
| $35,000 to $49,999 | 52 (15.9%) | 0 (0.0%) |
| $50,000 to $74,999 | 0 (0.0%) | 0 (0.0%) |
| $75,000 to $99,999 | 57 (17.4%) | 0 (0.0%) |
| $100,000 to $149,999 | 0 (0.0%) | 0 (0.0%) |
| $150,000 or more | 0 (0.0%) | 0 (0.0%) |
| Total | 328 (100.0%) | 136 (100.0%) |
Monthly Housing Cost Tiers in Indios
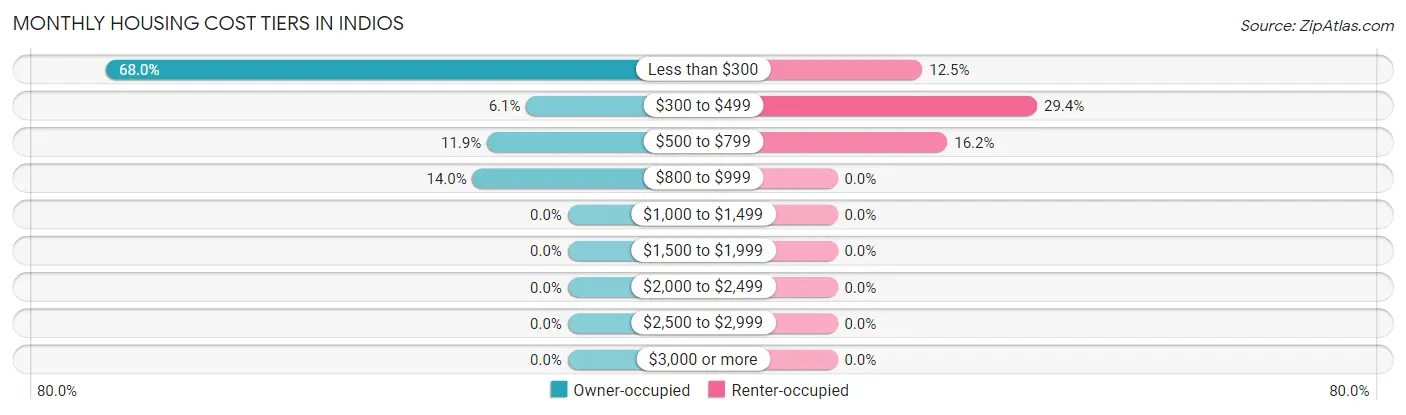
| Monthly Cost | Owner-occupied | Renter-occupied |
| Less than $300 | 223 (68.0%) | 17 (12.5%) |
| $300 to $499 | 20 (6.1%) | 40 (29.4%) |
| $500 to $799 | 39 (11.9%) | 22 (16.2%) |
| $800 to $999 | 46 (14.0%) | 0 (0.0%) |
| $1,000 to $1,499 | 0 (0.0%) | 0 (0.0%) |
| $1,500 to $1,999 | 0 (0.0%) | 0 (0.0%) |
| $2,000 to $2,499 | 0 (0.0%) | 0 (0.0%) |
| $2,500 to $2,999 | 0 (0.0%) | 0 (0.0%) |
| $3,000 or more | 0 (0.0%) | 0 (0.0%) |
| Total | 328 (100.0%) | 136 (100.0%) |
Physical Housing Characteristics in Indios
Housing Structures in Indios
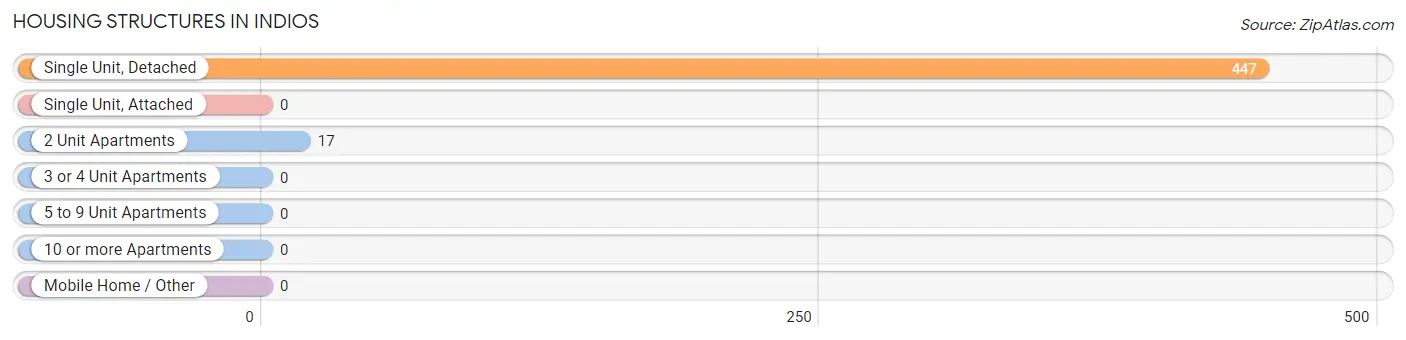
| Structure Type | # Housing Units | % Housing Units |
| Single Unit, Detached | 447 | 96.3% |
| Single Unit, Attached | 0 | 0.0% |
| 2 Unit Apartments | 17 | 3.7% |
| 3 or 4 Unit Apartments | 0 | 0.0% |
| 5 to 9 Unit Apartments | 0 | 0.0% |
| 10 or more Apartments | 0 | 0.0% |
| Mobile Home / Other | 0 | 0.0% |
| Total | 464 | 100.0% |
Housing Structures by Occupancy in Indios
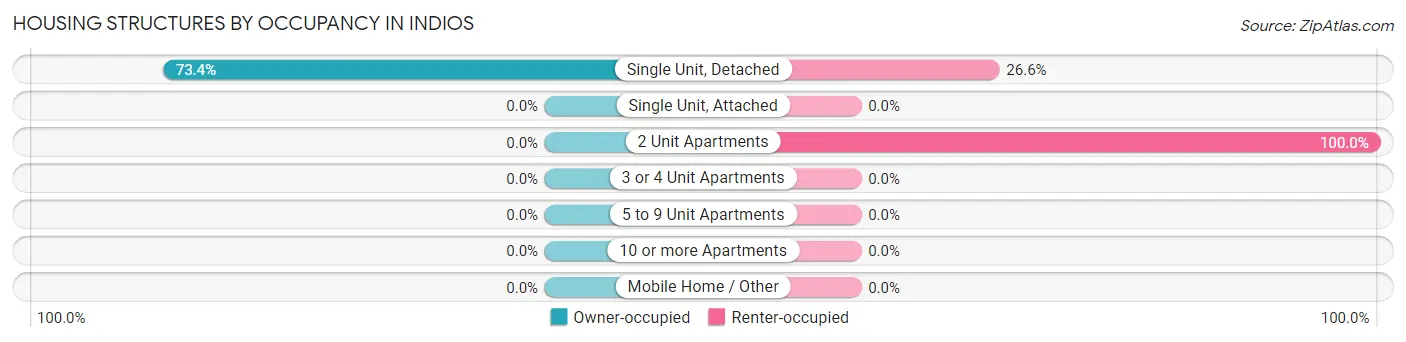
| Structure Type | Owner-occupied | Renter-occupied |
| Single Unit, Detached | 328 (73.4%) | 119 (26.6%) |
| Single Unit, Attached | 0 (0.0%) | 0 (0.0%) |
| 2 Unit Apartments | 0 (0.0%) | 17 (100.0%) |
| 3 or 4 Unit Apartments | 0 (0.0%) | 0 (0.0%) |
| 5 to 9 Unit Apartments | 0 (0.0%) | 0 (0.0%) |
| 10 or more Apartments | 0 (0.0%) | 0 (0.0%) |
| Mobile Home / Other | 0 (0.0%) | 0 (0.0%) |
| Total | 328 (70.7%) | 136 (29.3%) |
Housing Structures by Number of Rooms in Indios
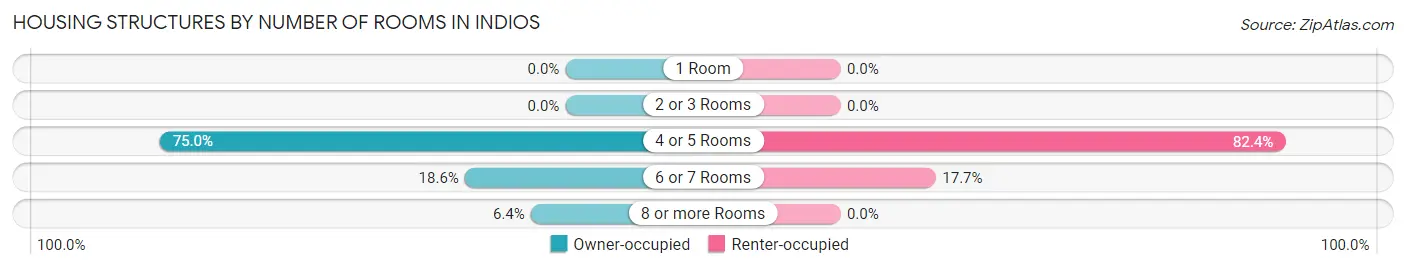
| Number of Rooms | Owner-occupied | Renter-occupied |
| 1 Room | 0 (0.0%) | 0 (0.0%) |
| 2 or 3 Rooms | 0 (0.0%) | 0 (0.0%) |
| 4 or 5 Rooms | 246 (75.0%) | 112 (82.4%) |
| 6 or 7 Rooms | 61 (18.6%) | 24 (17.6%) |
| 8 or more Rooms | 21 (6.4%) | 0 (0.0%) |
| Total | 328 (100.0%) | 136 (100.0%) |
Housing Structure by Heating Type in Indios
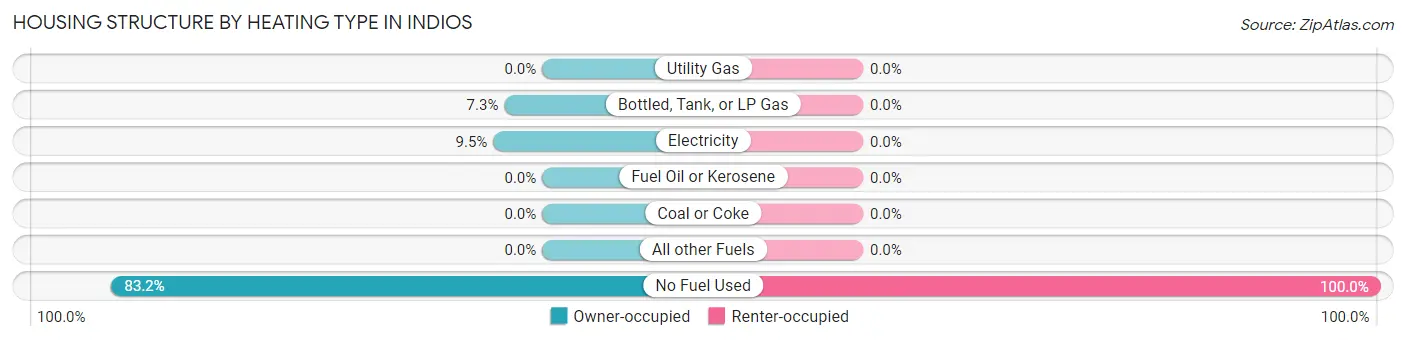
| Heating Type | Owner-occupied | Renter-occupied |
| Utility Gas | 0 (0.0%) | 0 (0.0%) |
| Bottled, Tank, or LP Gas | 24 (7.3%) | 0 (0.0%) |
| Electricity | 31 (9.5%) | 0 (0.0%) |
| Fuel Oil or Kerosene | 0 (0.0%) | 0 (0.0%) |
| Coal or Coke | 0 (0.0%) | 0 (0.0%) |
| All other Fuels | 0 (0.0%) | 0 (0.0%) |
| No Fuel Used | 273 (83.2%) | 136 (100.0%) |
| Total | 328 (100.0%) | 136 (100.0%) |
Household Vehicle Usage in Indios
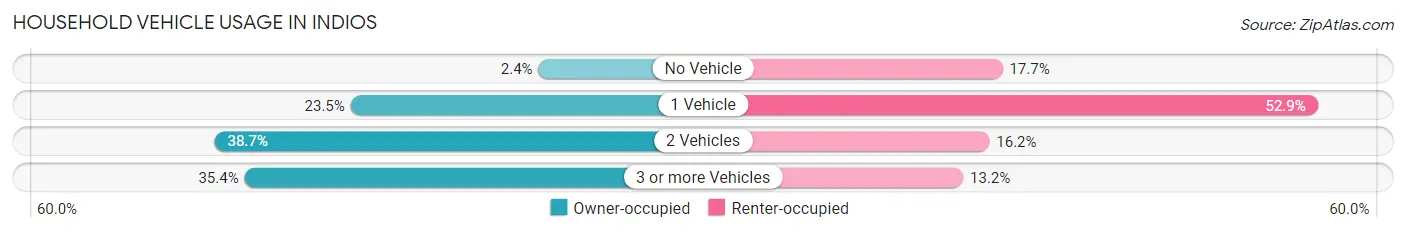
| Vehicles per Household | Owner-occupied | Renter-occupied |
| No Vehicle | 8 (2.4%) | 24 (17.6%) |
| 1 Vehicle | 77 (23.5%) | 72 (52.9%) |
| 2 Vehicles | 127 (38.7%) | 22 (16.2%) |
| 3 or more Vehicles | 116 (35.4%) | 18 (13.2%) |
| Total | 328 (100.0%) | 136 (100.0%) |
Real Estate & Mortgages in Indios
Real Estate and Mortgage Overview in Indios
| Characteristic | Without Mortgage | With Mortgage |
| Housing Units | 269 | 59 |
| Median Property Value | $76,400 | $0 |
| Median Household Income | $15,324 | $0 |
| Monthly Housing Costs | $162 | $0 |
| Real Estate Taxes | - | - |
Property Value by Mortgage Status in Indios
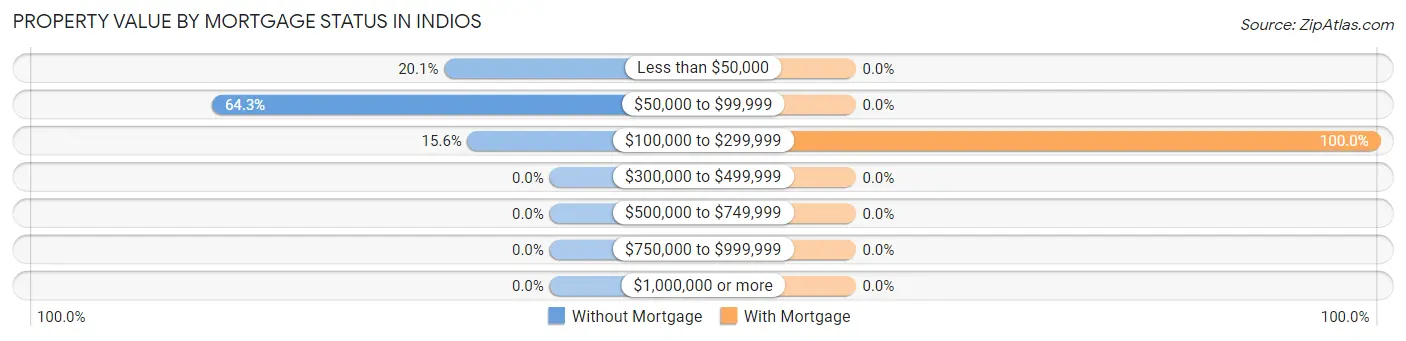
| Property Value | Without Mortgage | With Mortgage |
| Less than $50,000 | 54 (20.1%) | 0 (0.0%) |
| $50,000 to $99,999 | 173 (64.3%) | 0 (0.0%) |
| $100,000 to $299,999 | 42 (15.6%) | 59 (100.0%) |
| $300,000 to $499,999 | 0 (0.0%) | 0 (0.0%) |
| $500,000 to $749,999 | 0 (0.0%) | 0 (0.0%) |
| $750,000 to $999,999 | 0 (0.0%) | 0 (0.0%) |
| $1,000,000 or more | 0 (0.0%) | 0 (0.0%) |
| Total | 269 (100.0%) | 59 (100.0%) |
Household Income by Mortgage Status in Indios
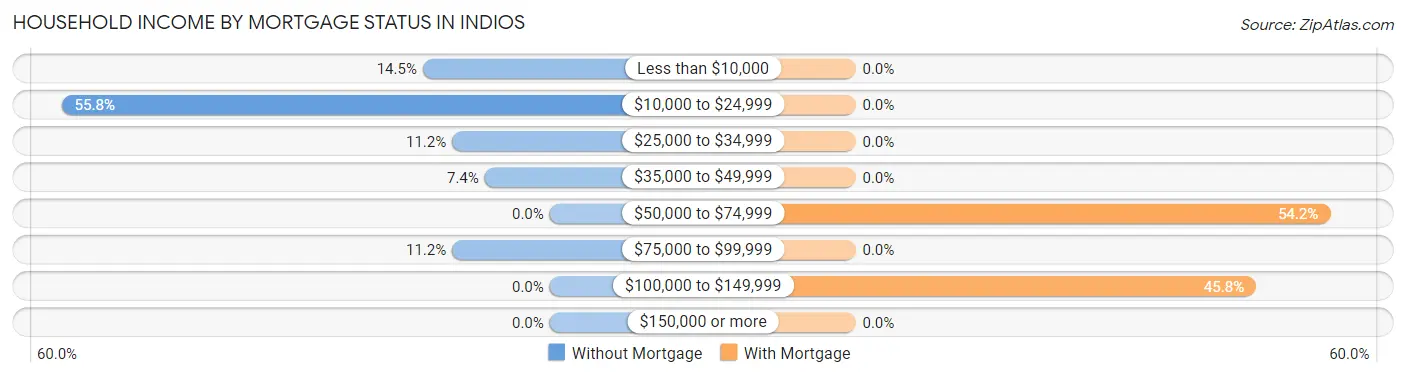
| Household Income | Without Mortgage | With Mortgage |
| Less than $10,000 | 39 (14.5%) | 0 (0.0%) |
| $10,000 to $24,999 | 150 (55.8%) | 0 (0.0%) |
| $25,000 to $34,999 | 30 (11.2%) | 0 (0.0%) |
| $35,000 to $49,999 | 20 (7.4%) | 0 (0.0%) |
| $50,000 to $74,999 | 0 (0.0%) | 32 (54.2%) |
| $75,000 to $99,999 | 30 (11.2%) | 0 (0.0%) |
| $100,000 to $149,999 | 0 (0.0%) | 27 (45.8%) |
| $150,000 or more | 0 (0.0%) | 0 (0.0%) |
| Total | 269 (100.0%) | 59 (100.0%) |
Property Value to Household Income Ratio in Indios
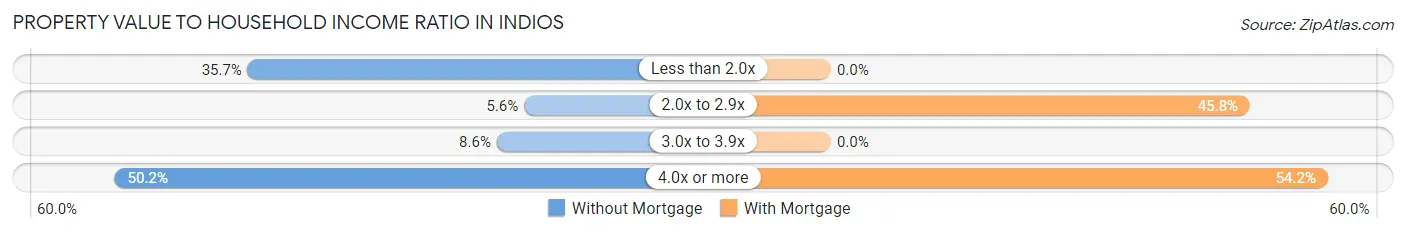
| Value-to-Income Ratio | Without Mortgage | With Mortgage |
| Less than 2.0x | 96 (35.7%) | 0 (0.0%) |
| 2.0x to 2.9x | 15 (5.6%) | 27 (45.8%) |
| 3.0x to 3.9x | 23 (8.6%) | 0 (0.0%) |
| 4.0x or more | 135 (50.2%) | 32 (54.2%) |
| Total | 269 (100.0%) | 59 (100.0%) |
Real Estate Taxes by Mortgage Status in Indios
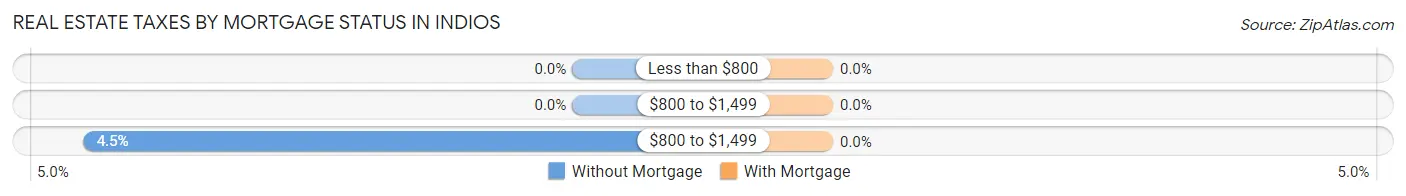
| Property Taxes | Without Mortgage | With Mortgage |
| Less than $800 | 0 (0.0%) | 0 (0.0%) |
| $800 to $1,499 | 0 (0.0%) | 0 (0.0%) |
| $800 to $1,499 | 12 (4.5%) | 0 (0.0%) |
| Total | 269 (100.0%) | 59 (100.0%) |
Health & Disability in Indios
Health Insurance Coverage by Age in Indios
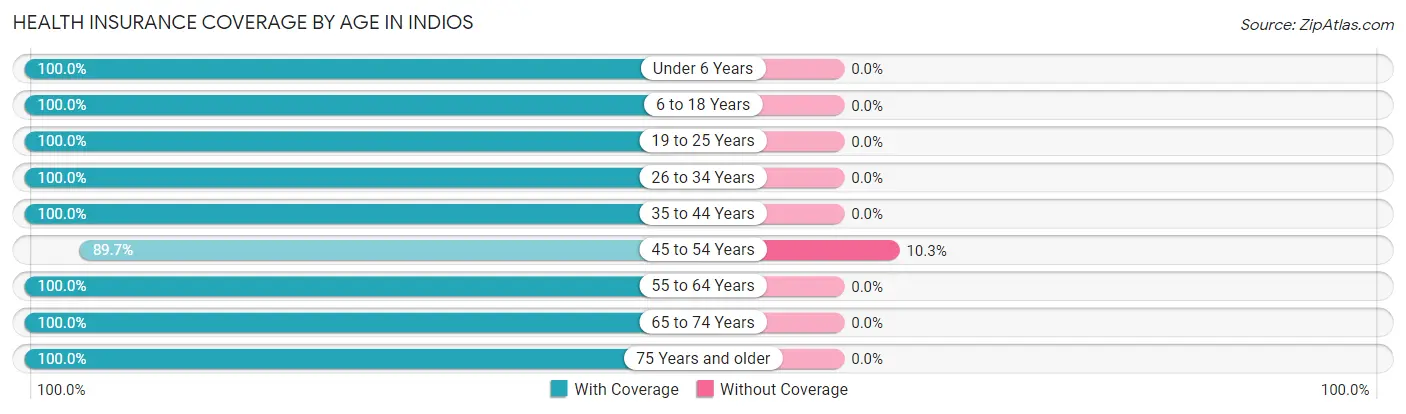
| Age Bracket | With Coverage | Without Coverage |
| Under 6 Years | 45 (100.0%) | 0 (0.0%) |
| 6 to 18 Years | 230 (100.0%) | 0 (0.0%) |
| 19 to 25 Years | 85 (100.0%) | 0 (0.0%) |
| 26 to 34 Years | 182 (100.0%) | 0 (0.0%) |
| 35 to 44 Years | 97 (100.0%) | 0 (0.0%) |
| 45 to 54 Years | 157 (89.7%) | 18 (10.3%) |
| 55 to 64 Years | 136 (100.0%) | 0 (0.0%) |
| 65 to 74 Years | 284 (100.0%) | 0 (0.0%) |
| 75 Years and older | 88 (100.0%) | 0 (0.0%) |
| Total | 1,304 (98.6%) | 18 (1.4%) |
Health Insurance Coverage by Citizenship Status in Indios
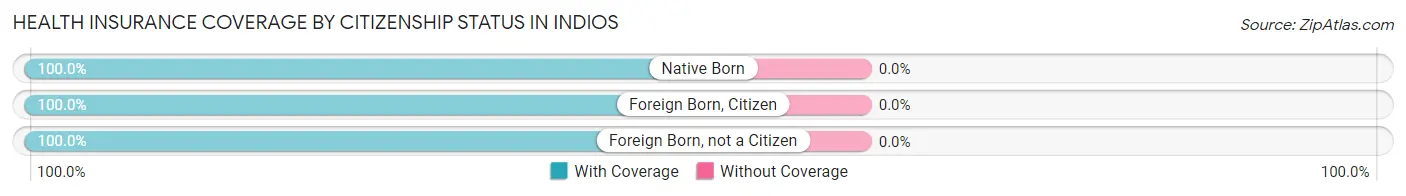
| Citizenship Status | With Coverage | Without Coverage |
| Native Born | 45 (100.0%) | 0 (0.0%) |
| Foreign Born, Citizen | 230 (100.0%) | 0 (0.0%) |
| Foreign Born, not a Citizen | 85 (100.0%) | 0 (0.0%) |
Health Insurance Coverage by Household Income in Indios
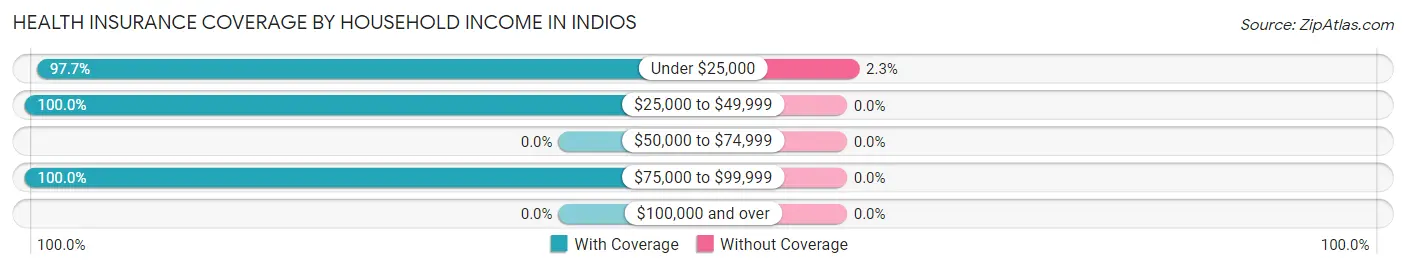
| Household Income | With Coverage | Without Coverage |
| Under $25,000 | 764 (97.7%) | 18 (2.3%) |
| $25,000 to $49,999 | 257 (100.0%) | 0 (0.0%) |
| $50,000 to $74,999 | 0 (0.0%) | 0 (0.0%) |
| $75,000 to $99,999 | 283 (100.0%) | 0 (0.0%) |
| $100,000 and over | 0 (0.0%) | 0 (0.0%) |
Public vs Private Health Insurance Coverage by Age in Indios
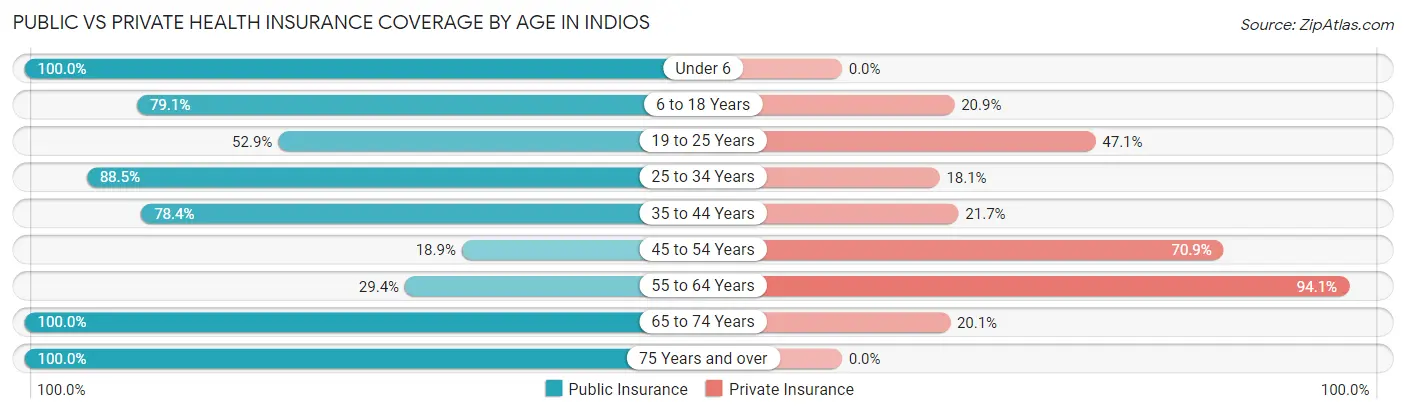
| Age Bracket | Public Insurance | Private Insurance |
| Under 6 | 45 (100.0%) | 0 (0.0%) |
| 6 to 18 Years | 182 (79.1%) | 48 (20.9%) |
| 19 to 25 Years | 45 (52.9%) | 40 (47.1%) |
| 25 to 34 Years | 161 (88.5%) | 33 (18.1%) |
| 35 to 44 Years | 76 (78.3%) | 21 (21.6%) |
| 45 to 54 Years | 33 (18.9%) | 124 (70.9%) |
| 55 to 64 Years | 40 (29.4%) | 128 (94.1%) |
| 65 to 74 Years | 284 (100.0%) | 57 (20.1%) |
| 75 Years and over | 88 (100.0%) | 0 (0.0%) |
| Total | 954 (72.2%) | 451 (34.1%) |
Disability Status by Sex by Age in Indios
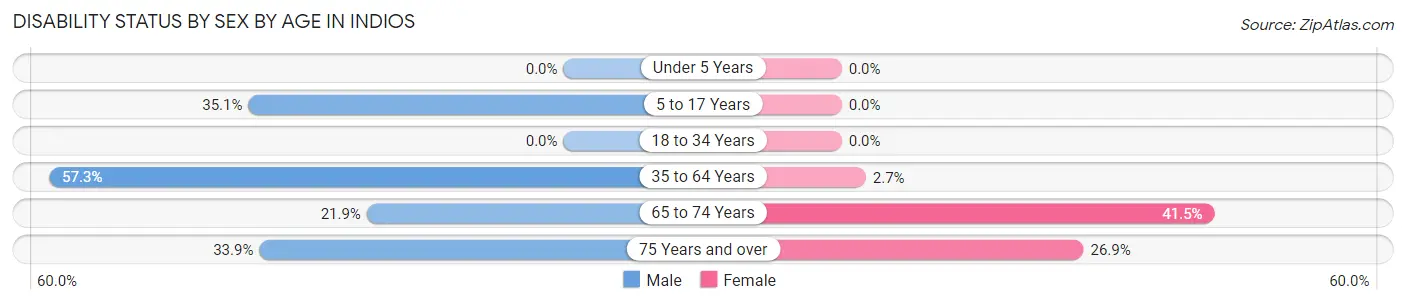
| Age Bracket | Male | Female |
| Under 5 Years | 0 (0.0%) | 0 (0.0%) |
| 5 to 17 Years | 20 (35.1%) | 0 (0.0%) |
| 18 to 34 Years | 0 (0.0%) | 0 (0.0%) |
| 35 to 64 Years | 63 (57.3%) | 8 (2.7%) |
| 65 to 74 Years | 30 (21.9%) | 61 (41.5%) |
| 75 Years and over | 21 (33.9%) | 7 (26.9%) |
Disability Class by Sex by Age in Indios
Disability Class: Hearing Difficulty
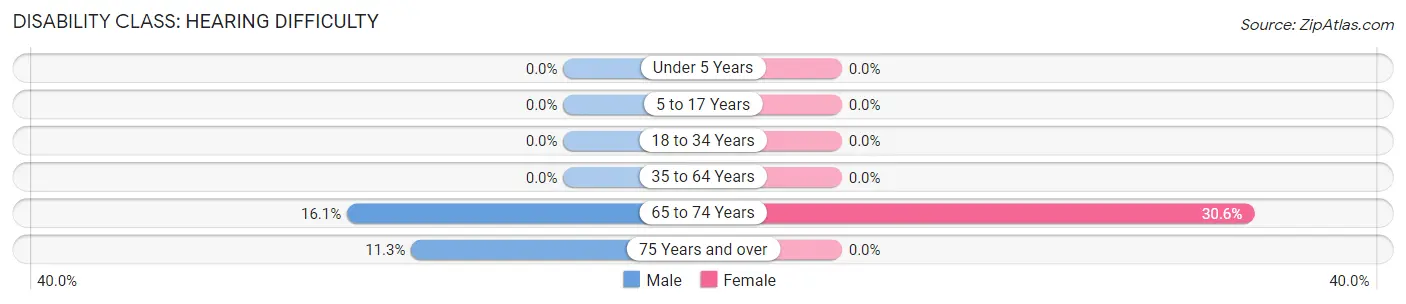
| Age Bracket | Male | Female |
| Under 5 Years | 0 (0.0%) | 0 (0.0%) |
| 5 to 17 Years | 0 (0.0%) | 0 (0.0%) |
| 18 to 34 Years | 0 (0.0%) | 0 (0.0%) |
| 35 to 64 Years | 0 (0.0%) | 0 (0.0%) |
| 65 to 74 Years | 22 (16.1%) | 45 (30.6%) |
| 75 Years and over | 7 (11.3%) | 0 (0.0%) |
Disability Class: Vision Difficulty
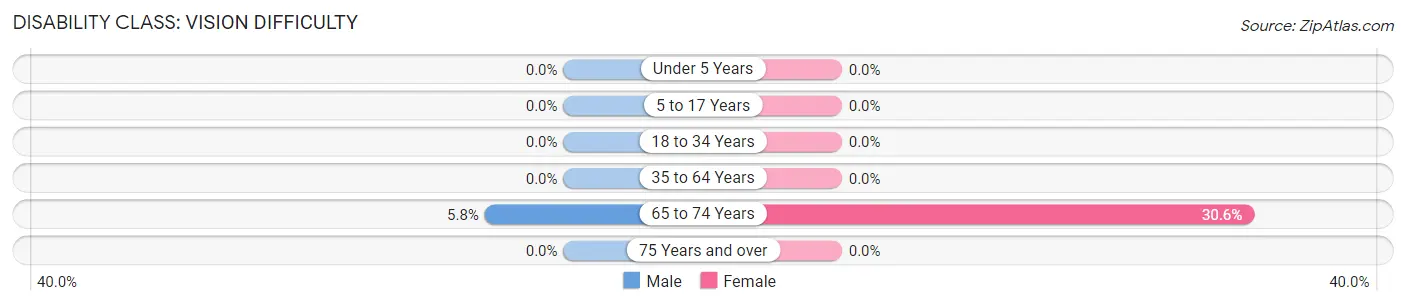
| Age Bracket | Male | Female |
| Under 5 Years | 0 (0.0%) | 0 (0.0%) |
| 5 to 17 Years | 0 (0.0%) | 0 (0.0%) |
| 18 to 34 Years | 0 (0.0%) | 0 (0.0%) |
| 35 to 64 Years | 0 (0.0%) | 0 (0.0%) |
| 65 to 74 Years | 8 (5.8%) | 45 (30.6%) |
| 75 Years and over | 0 (0.0%) | 0 (0.0%) |
Disability Class: Cognitive Difficulty
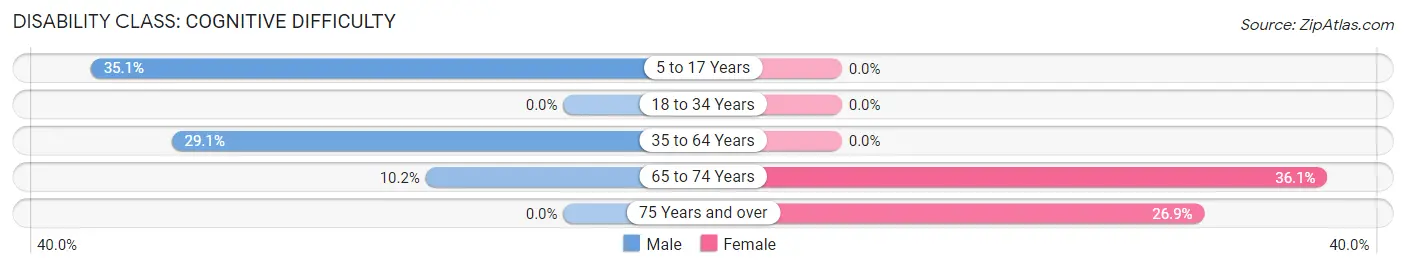
| Age Bracket | Male | Female |
| 5 to 17 Years | 20 (35.1%) | 0 (0.0%) |
| 18 to 34 Years | 0 (0.0%) | 0 (0.0%) |
| 35 to 64 Years | 32 (29.1%) | 0 (0.0%) |
| 65 to 74 Years | 14 (10.2%) | 53 (36.0%) |
| 75 Years and over | 0 (0.0%) | 7 (26.9%) |
Disability Class: Ambulatory Difficulty
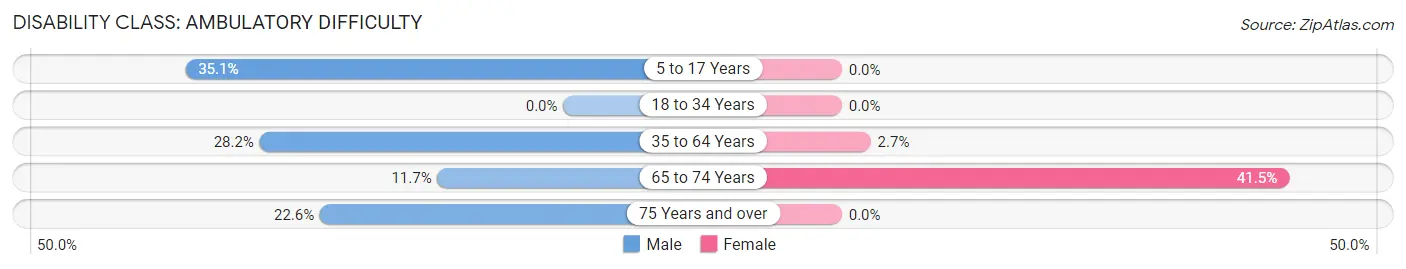
| Age Bracket | Male | Female |
| 5 to 17 Years | 20 (35.1%) | 0 (0.0%) |
| 18 to 34 Years | 0 (0.0%) | 0 (0.0%) |
| 35 to 64 Years | 31 (28.2%) | 8 (2.7%) |
| 65 to 74 Years | 16 (11.7%) | 61 (41.5%) |
| 75 Years and over | 14 (22.6%) | 0 (0.0%) |
Disability Class: Self-Care Difficulty
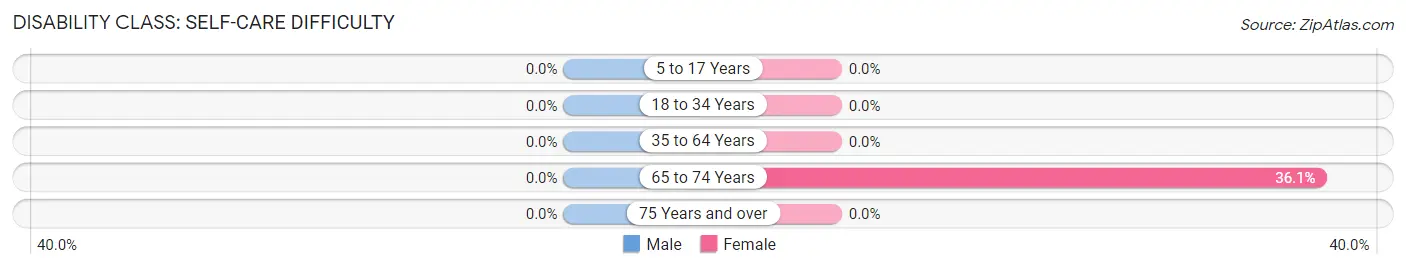
| Age Bracket | Male | Female |
| 5 to 17 Years | 0 (0.0%) | 0 (0.0%) |
| 18 to 34 Years | 0 (0.0%) | 0 (0.0%) |
| 35 to 64 Years | 0 (0.0%) | 0 (0.0%) |
| 65 to 74 Years | 0 (0.0%) | 53 (36.0%) |
| 75 Years and over | 0 (0.0%) | 0 (0.0%) |
Technology Access in Indios
Computing Device Access in Indios
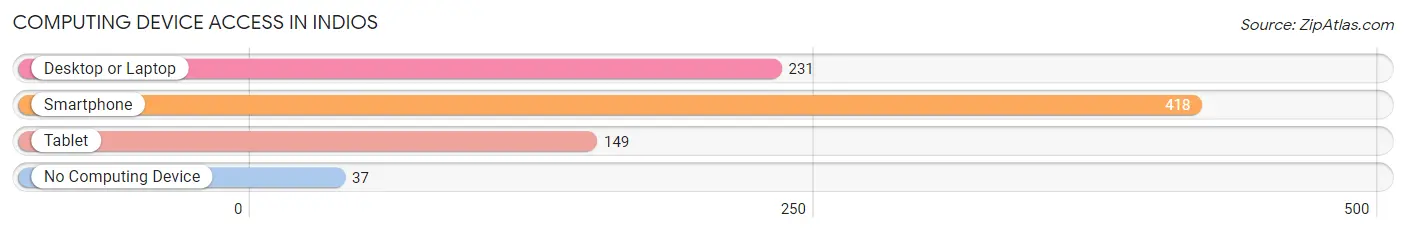
| Device Type | # Households | % Households |
| Desktop or Laptop | 231 | 49.8% |
| Smartphone | 418 | 90.1% |
| Tablet | 149 | 32.1% |
| No Computing Device | 37 | 8.0% |
| Total | 464 | 100.0% |
Internet Access in Indios
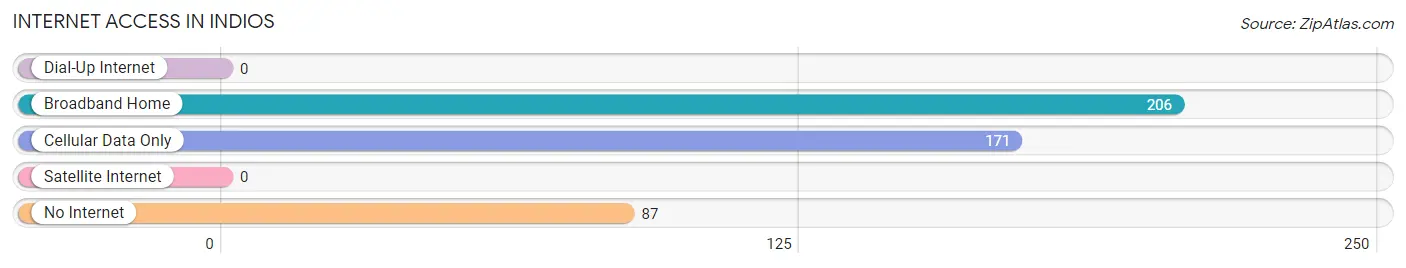
| Internet Type | # Households | % Households |
| Dial-Up Internet | 0 | 0.0% |
| Broadband Home | 206 | 44.4% |
| Cellular Data Only | 171 | 36.8% |
| Satellite Internet | 0 | 0.0% |
| No Internet | 87 | 18.8% |
| Total | 464 | 100.0% |
Indios Summary
Indios is a municipality located in the eastern part of Puerto Rico, in the region known as the Eastern Coastal Valley. It is bordered by the municipalities of Loíza, Canóvanas, and Río Grande. The municipality of Indios is part of the metropolitan area of San Juan-Caguas-Guaynabo.
History
Indios was founded in 1815 by the Spanish government. The name of the town is derived from the indigenous people who inhabited the area before the arrival of the Spanish. The town was originally part of the municipality of Loíza, but it was separated in 1815 and became an independent municipality.
The town was originally a small agricultural community, but it has grown significantly in recent years. The population of Indios has grown from 4,000 in 2000 to over 8,000 in 2020.
Geography
Indios is located in the eastern part of Puerto Rico, in the region known as the Eastern Coastal Valley. It is bordered by the municipalities of Loíza, Canóvanas, and Río Grande. The municipality of Indios is part of the metropolitan area of San Juan-Caguas-Guaynabo.
The terrain of Indios is mostly flat, with some hills in the northern part of the municipality. The climate is tropical, with temperatures ranging from 75 to 90 degrees Fahrenheit.
Economy
The economy of Indios is mainly based on agriculture and tourism. The main crops grown in the area are sugarcane, bananas, and plantains. The town also has a few small manufacturing plants.
Tourism is an important part of the economy of Indios. The town is home to several beaches, including Playa de los Indios, Playa de los Cocos, and Playa de los Corales. The town also has several restaurants, bars, and hotels.
Demographics
As of the 2010 census, the population of Indios was 8,093. The population is mostly of Puerto Rican descent, with a small percentage of African and other ethnicities. The median age of the population is 33.5 years.
The majority of the population (90%) is Roman Catholic. The town also has a small Protestant population.
Conclusion
Indios is a municipality located in the eastern part of Puerto Rico, in the region known as the Eastern Coastal Valley. It is bordered by the municipalities of Loíza, Canóvanas, and Río Grande. The town was founded in 1815 and has grown significantly in recent years. The economy of Indios is mainly based on agriculture and tourism, and the population is mostly of Puerto Rican descent. Indios is a vibrant town with a rich history and culture, and it is an important part of the metropolitan area of San Juan-Caguas-Guaynabo.
Common Questions
What is Per Capita Income in Indios?
Per Capita income in Indios is $10,753.
What is the Median Family Income in Indios?
Median Family Income in Indios is $21,563.
What is the Median Household income in Indios?
Median Household Income in Indios is $20,208.
What is Income or Wage Gap in Indios?
Income or Wage Gap in Indios is 37.1%.
Women in Indios earn 62.9 cents for every dollar earned by a man.
What is Inequality or Gini Index in Indios?
Inequality or Gini Index in Indios is 0.42.
What is the Total Population of Indios?
Total Population of Indios is 1,322.
What is the Total Male Population of Indios?
Total Male Population of Indios is 571.
What is the Total Female Population of Indios?
Total Female Population of Indios is 751.
What is the Ratio of Males per 100 Females in Indios?
There are 76.03 Males per 100 Females in Indios.
What is the Ratio of Females per 100 Males in Indios?
There are 131.52 Females per 100 Males in Indios.
What is the Median Population Age in Indios?
Median Population Age in Indios is 46.9 Years.
What is the Average Family Size in Indios
Average Family Size in Indios is 3.2 People.
What is the Average Household Size in Indios
Average Household Size in Indios is 2.9 People.
How Large is the Labor Force in Indios?
There are 372 People in the Labor Forcein in Indios.
What is the Percentage of People in the Labor Force in Indios?
35.1% of People are in the Labor Force in Indios.
What is the Unemployment Rate in Indios?
Unemployment Rate in Indios is 25.5%.