La Fermina, PR Map & Demographics
La Fermina Map
La Fermina Overview
$8,704
PER CAPITA INCOME
$23,255
AVG FAMILY INCOME
$17,353
AVG HOUSEHOLD INCOME
71.0%
WAGE / INCOME GAP [ % ]
29.0¢/ $1
WAGE / INCOME GAP [ $ ]
0.48
INEQUALITY / GINI INDEX
2,336
TOTAL POPULATION
1,217
MALE POPULATION
1,119
FEMALE POPULATION
108.76
MALES / 100 FEMALES
91.95
FEMALES / 100 MALES
37.6
MEDIAN AGE
3.4
AVG FAMILY SIZE
3.1
AVG HOUSEHOLD SIZE
857
LABOR FORCE [ PEOPLE ]
40.2%
PERCENT IN LABOR FORCE
16.6%
UNEMPLOYMENT RATE
Income in La Fermina
Income Overview in La Fermina
Per Capita Income in La Fermina is $8,704, while median incomes of families and households are $23,255 and $17,353 respectively.
| Characteristic | Number | Measure |
| Per Capita Income | 2,336 | $8,704 |
| Median Family Income | 616 | $23,255 |
| Mean Family Income | 616 | $25,405 |
| Median Household Income | 758 | $17,353 |
| Mean Household Income | 758 | $22,993 |
| Income Deficit | 616 | $0 |
| Wage / Income Gap (%) | 2,336 | 71.03% |
| Wage / Income Gap ($) | 2,336 | 28.97¢ per $1 |
| Gini / Inequality Index | 2,336 | 0.48 |
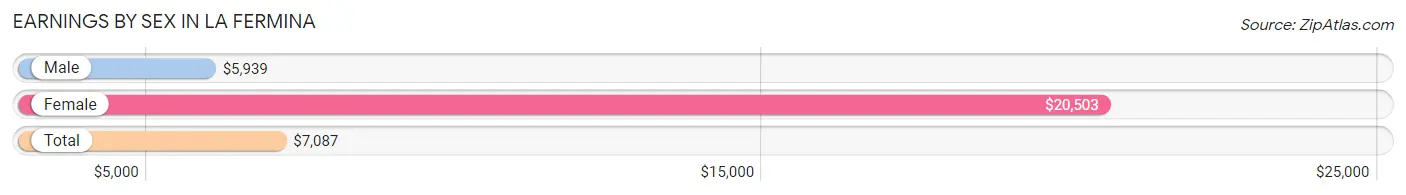
Earnings by Sex in La Fermina
Average Earnings in La Fermina are $7,087, $5,939 for men and $20,503 for women, a difference of 71.0%.
| Sex | Number | Average Earnings |
| Male | 562 (71.4%) | $5,939 |
| Female | 225 (28.6%) | $20,503 |
| Total | 787 (100.0%) | $7,087 |
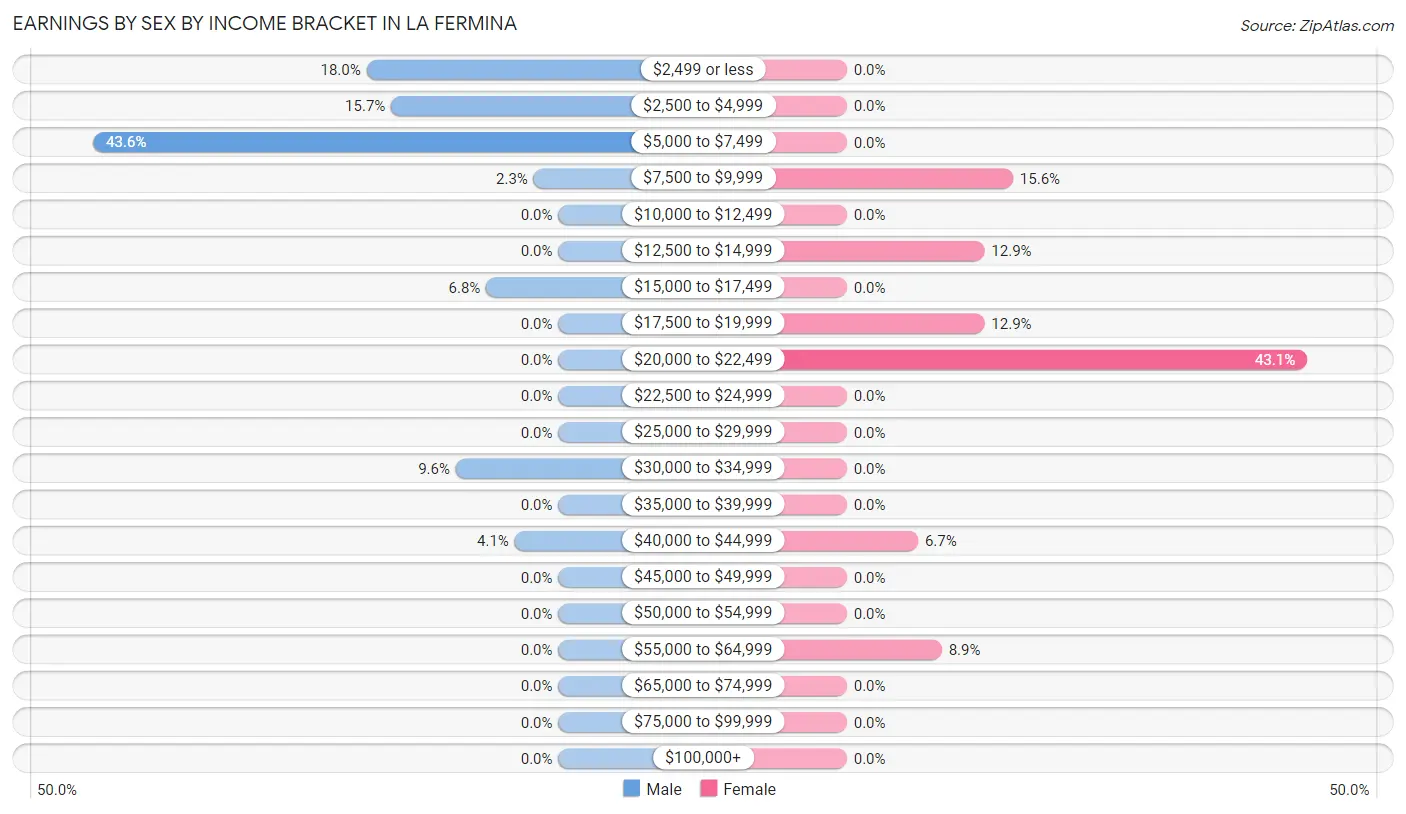
Earnings by Sex by Income Bracket in La Fermina
The most common earnings brackets in La Fermina are $5,000 to $7,499 for men (245 | 43.6%) and $20,000 to $22,499 for women (97 | 43.1%).
| Income | Male | Female |
| $2,499 or less | 101 (18.0%) | 0 (0.0%) |
| $2,500 to $4,999 | 88 (15.7%) | 0 (0.0%) |
| $5,000 to $7,499 | 245 (43.6%) | 0 (0.0%) |
| $7,500 to $9,999 | 13 (2.3%) | 35 (15.6%) |
| $10,000 to $12,499 | 0 (0.0%) | 0 (0.0%) |
| $12,500 to $14,999 | 0 (0.0%) | 29 (12.9%) |
| $15,000 to $17,499 | 38 (6.8%) | 0 (0.0%) |
| $17,500 to $19,999 | 0 (0.0%) | 29 (12.9%) |
| $20,000 to $22,499 | 0 (0.0%) | 97 (43.1%) |
| $22,500 to $24,999 | 0 (0.0%) | 0 (0.0%) |
| $25,000 to $29,999 | 0 (0.0%) | 0 (0.0%) |
| $30,000 to $34,999 | 54 (9.6%) | 0 (0.0%) |
| $35,000 to $39,999 | 0 (0.0%) | 0 (0.0%) |
| $40,000 to $44,999 | 23 (4.1%) | 15 (6.7%) |
| $45,000 to $49,999 | 0 (0.0%) | 0 (0.0%) |
| $50,000 to $54,999 | 0 (0.0%) | 0 (0.0%) |
| $55,000 to $64,999 | 0 (0.0%) | 20 (8.9%) |
| $65,000 to $74,999 | 0 (0.0%) | 0 (0.0%) |
| $75,000 to $99,999 | 0 (0.0%) | 0 (0.0%) |
| $100,000+ | 0 (0.0%) | 0 (0.0%) |
| Total | 562 (100.0%) | 225 (100.0%) |
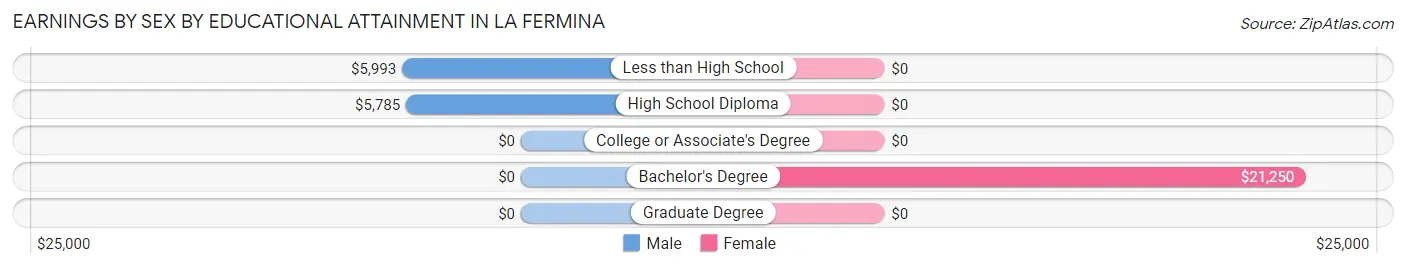
Earnings by Sex by Educational Attainment in La Fermina
Average earnings in La Fermina are $5,805 for men and $20,503 for women, a difference of 71.7%. Men with an educational attainment of less than high school enjoy the highest average annual earnings of $5,993, while those with high school diploma education earn the least with $5,785. Women with an educational attainment of bachelor's degree earn the most with the average annual earnings of $21,250, while those with bachelor's degree education have the smallest earnings of $21,250.
| Educational Attainment | Male Income | Female Income |
| Less than High School | $5,993 | $0 |
| High School Diploma | $5,785 | $0 |
| College or Associate's Degree | - | - |
| Bachelor's Degree | - | - |
| Graduate Degree | - | - |
| Total | $5,805 | $20,503 |
Family Income in La Fermina
Family Income Brackets in La Fermina
According to the La Fermina family income data, there are 186 families falling into the less than $10,000 income range, which is the most common income bracket and makes up 30.2% of all families.
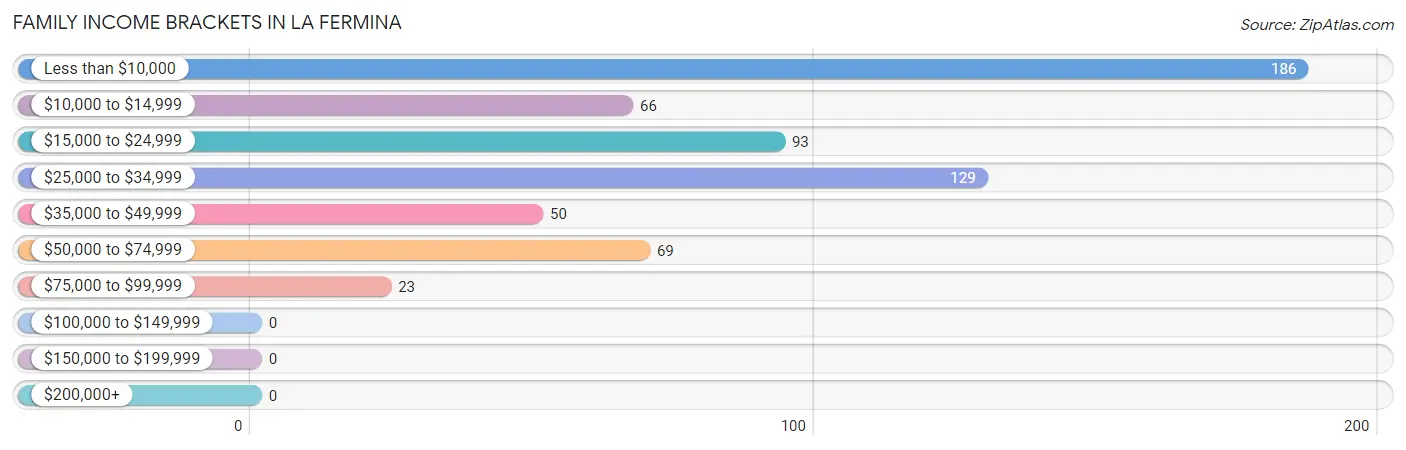
| Income Bracket | # Families | % Families |
| Less than $10,000 | 186 | 30.2% |
| $10,000 to $14,999 | 66 | 10.7% |
| $15,000 to $24,999 | 93 | 15.1% |
| $25,000 to $34,999 | 129 | 20.9% |
| $35,000 to $49,999 | 50 | 8.1% |
| $50,000 to $74,999 | 69 | 11.2% |
| $75,000 to $99,999 | 23 | 3.7% |
| $100,000 to $149,999 | 0 | 0.0% |
| $150,000 to $199,999 | 0 | 0.0% |
| $200,000+ | 0 | 0.0% |
Family Income by Famaliy Size in La Fermina
3-person families (93 | 15.1%) account for the highest median family income in La Fermina with $29,250 per family, while 3-person families (93 | 15.1%) have the highest median income of $9,750 per family member.
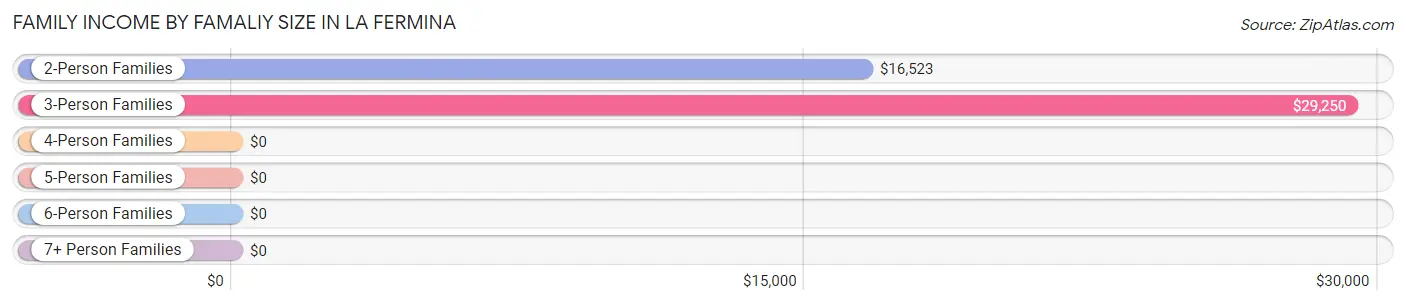
| Income Bracket | # Families | Median Income |
| 2-Person Families | 327 (53.1%) | $16,523 |
| 3-Person Families | 93 (15.1%) | $29,250 |
| 4-Person Families | 164 (26.6%) | $0 |
| 5-Person Families | 32 (5.2%) | $0 |
| 6-Person Families | 0 (0.0%) | $0 |
| 7+ Person Families | 0 (0.0%) | $0 |
| Total | 616 (100.0%) | $23,255 |
Family Income by Number of Earners in La Fermina
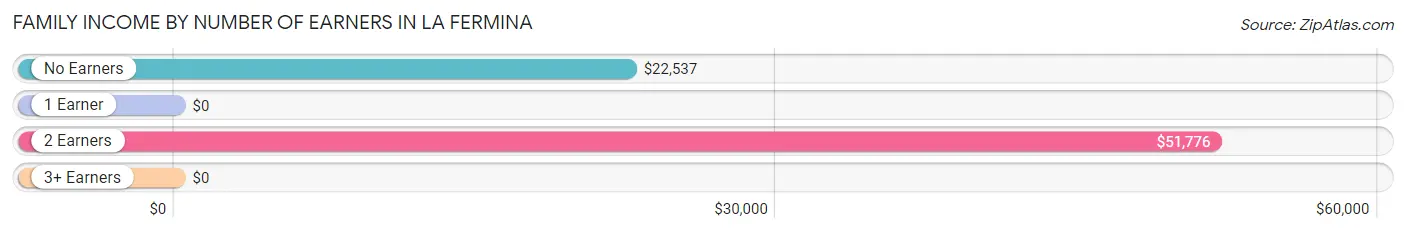
| Number of Earners | # Families | Median Income |
| No Earners | 299 (48.5%) | $22,537 |
| 1 Earner | 224 (36.4%) | $0 |
| 2 Earners | 51 (8.3%) | $51,776 |
| 3+ Earners | 42 (6.8%) | $0 |
| Total | 616 (100.0%) | $23,255 |
Household Income in La Fermina
Household Income Brackets in La Fermina
With 294 households falling in the category, the less than $10,000 income range is the most frequent in La Fermina, accounting for 38.8% of all households.
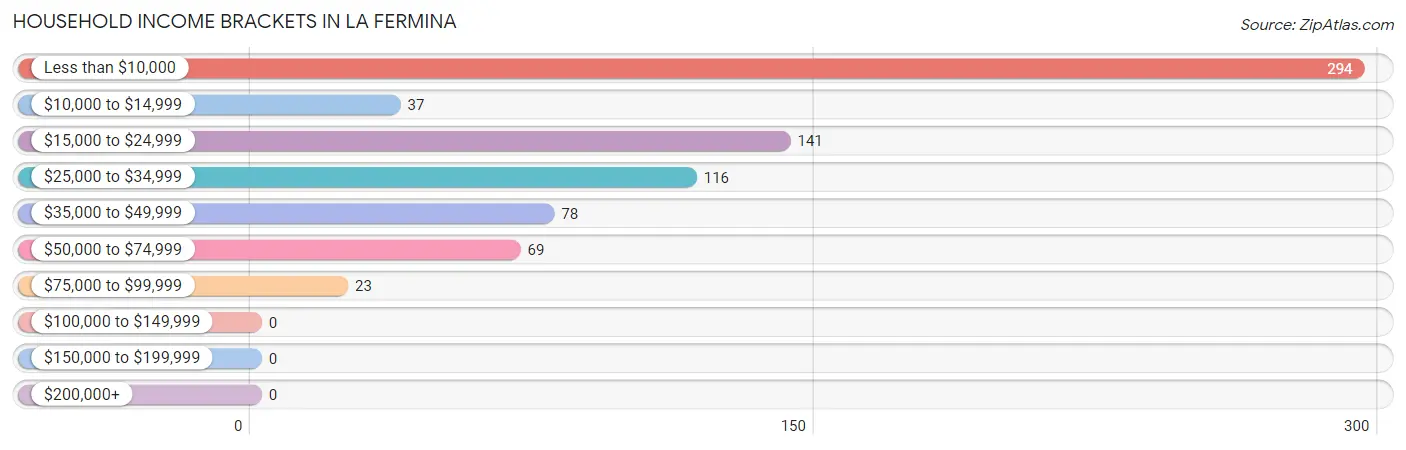
| Income Bracket | # Households | % Households |
| Less than $10,000 | 294 | 38.8% |
| $10,000 to $14,999 | 37 | 4.9% |
| $15,000 to $24,999 | 141 | 18.6% |
| $25,000 to $34,999 | 116 | 15.3% |
| $35,000 to $49,999 | 78 | 10.3% |
| $50,000 to $74,999 | 69 | 9.1% |
| $75,000 to $99,999 | 23 | 3.0% |
| $100,000 to $149,999 | 0 | 0.0% |
| $150,000 to $199,999 | 0 | 0.0% |
| $200,000+ | 0 | 0.0% |
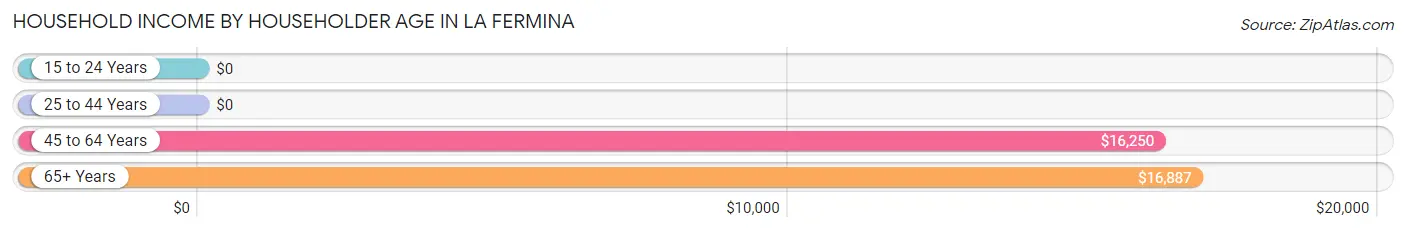
Household Income by Householder Age in La Fermina
The median household income in La Fermina is $17,353, with the highest median household income of $16,887 found in the 65+ years age bracket for the primary householder. A total of 305 households (40.2%) fall into this category. Meanwhile, the 15 to 24 years age bracket for the primary householder has the lowest median household income of $0, with 8 households (1.1%) in this group.
| Income Bracket | # Households | Median Income |
| 15 to 24 Years | 8 (1.1%) | $0 |
| 25 to 44 Years | 165 (21.8%) | $0 |
| 45 to 64 Years | 280 (36.9%) | $16,250 |
| 65+ Years | 305 (40.2%) | $16,887 |
| Total | 758 (100.0%) | $17,353 |
Poverty in La Fermina
Income Below Poverty by Sex and Age in La Fermina
With 56.5% poverty level for males and 52.5% for females among the residents of La Fermina, 12 to 14 year old males and 6 to 11 year old females are the most vulnerable to poverty, with 25 males (100.0%) and 120 females (87.6%) in their respective age groups living below the poverty level.
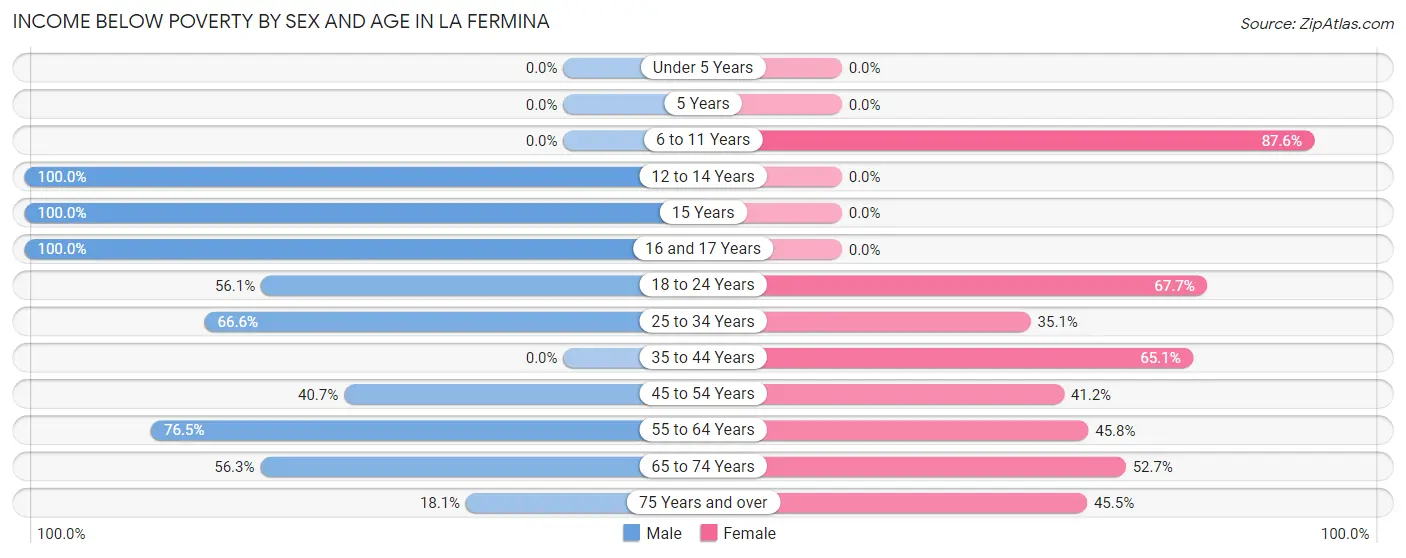
| Age Bracket | Male | Female |
| Under 5 Years | 0 (0.0%) | 0 (0.0%) |
| 5 Years | 0 (0.0%) | 0 (0.0%) |
| 6 to 11 Years | 0 (0.0%) | 120 (87.6%) |
| 12 to 14 Years | 25 (100.0%) | 0 (0.0%) |
| 15 Years | 27 (100.0%) | 0 (0.0%) |
| 16 and 17 Years | 63 (100.0%) | 0 (0.0%) |
| 18 to 24 Years | 110 (56.1%) | 65 (67.7%) |
| 25 to 34 Years | 235 (66.6%) | 54 (35.1%) |
| 35 to 44 Years | 0 (0.0%) | 110 (65.1%) |
| 45 to 54 Years | 35 (40.7%) | 47 (41.2%) |
| 55 to 64 Years | 88 (76.5%) | 81 (45.8%) |
| 65 to 74 Years | 72 (56.2%) | 39 (52.7%) |
| 75 Years and over | 32 (18.1%) | 71 (45.5%) |
| Total | 687 (56.5%) | 587 (52.5%) |
Income Above Poverty by Sex and Age in La Fermina
According to the poverty statistics in La Fermina, males aged 6 to 11 years and females aged 16 and 17 years are the age groups that are most secure financially, with 100.0% of males and 100.0% of females in these age groups living above the poverty line.
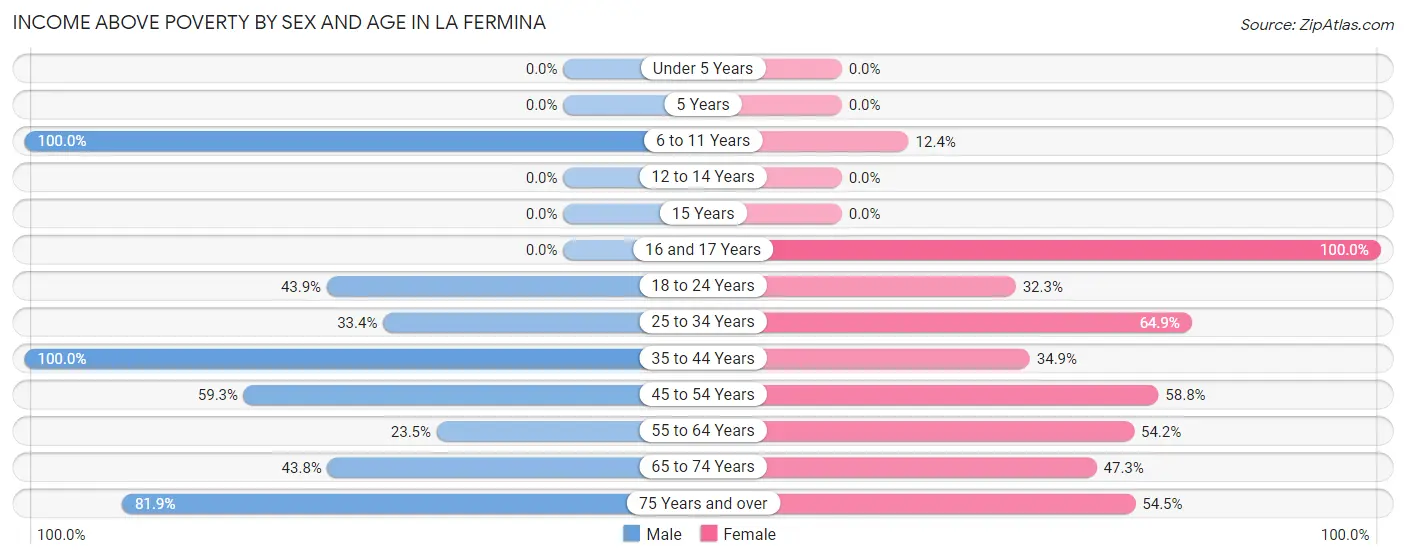
| Age Bracket | Male | Female |
| Under 5 Years | 0 (0.0%) | 0 (0.0%) |
| 5 Years | 0 (0.0%) | 0 (0.0%) |
| 6 to 11 Years | 15 (100.0%) | 17 (12.4%) |
| 12 to 14 Years | 0 (0.0%) | 0 (0.0%) |
| 15 Years | 0 (0.0%) | 0 (0.0%) |
| 16 and 17 Years | 0 (0.0%) | 40 (100.0%) |
| 18 to 24 Years | 86 (43.9%) | 31 (32.3%) |
| 25 to 34 Years | 118 (33.4%) | 100 (64.9%) |
| 35 to 44 Years | 32 (100.0%) | 59 (34.9%) |
| 45 to 54 Years | 51 (59.3%) | 67 (58.8%) |
| 55 to 64 Years | 27 (23.5%) | 96 (54.2%) |
| 65 to 74 Years | 56 (43.8%) | 35 (47.3%) |
| 75 Years and over | 145 (81.9%) | 85 (54.5%) |
| Total | 530 (43.5%) | 530 (47.4%) |
Income Below Poverty Among Married-Couple Families in La Fermina
The poverty statistics for married-couple families in La Fermina show that 50.0% or 206 of the total 412 families live below the poverty line. Families with 1 or 2 children have the highest poverty rate of 60.2%, comprising of 71 families. On the other hand, families with no children have the lowest poverty rate of 45.9%, which includes 135 families.
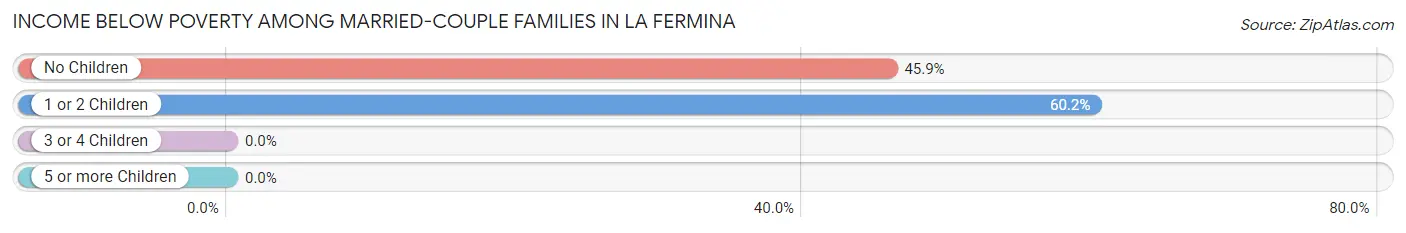
| Children | Above Poverty | Below Poverty |
| No Children | 159 (54.1%) | 135 (45.9%) |
| 1 or 2 Children | 47 (39.8%) | 71 (60.2%) |
| 3 or 4 Children | 0 (0.0%) | 0 (0.0%) |
| 5 or more Children | 0 (0.0%) | 0 (0.0%) |
| Total | 206 (50.0%) | 206 (50.0%) |
Income Below Poverty Among Single-Parent Households in La Fermina
According to the poverty data in La Fermina, 24.5% or 12 single-father households and 71.0% or 110 single-mother households are living below the poverty line. Among single-father households, those with no children have the highest poverty rate, with 12 households (33.3%) experiencing poverty. Likewise, among single-mother households, those with 1 or 2 children have the highest poverty rate, with 69 households (100.0%) falling below the poverty line.
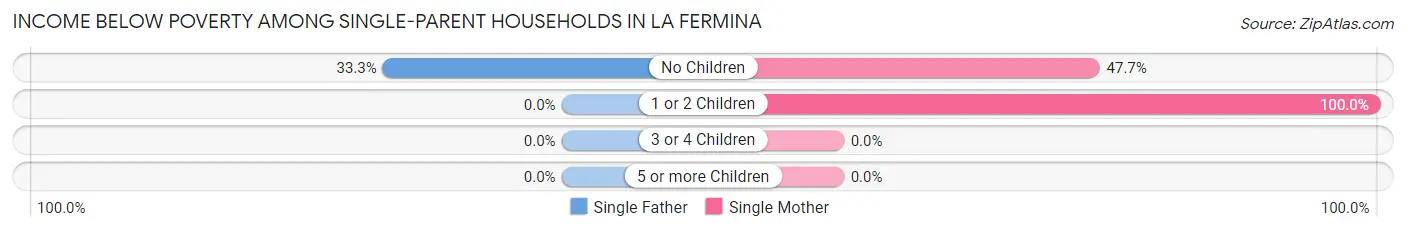
| Children | Single Father | Single Mother |
| No Children | 12 (33.3%) | 41 (47.7%) |
| 1 or 2 Children | 0 (0.0%) | 69 (100.0%) |
| 3 or 4 Children | 0 (0.0%) | 0 (0.0%) |
| 5 or more Children | 0 (0.0%) | 0 (0.0%) |
| Total | 12 (24.5%) | 110 (71.0%) |
Income Below Poverty Among Married-Couple vs Single-Parent Households in La Fermina
The poverty data for La Fermina shows that 206 of the married-couple family households (50.0%) and 122 of the single-parent households (59.8%) are living below the poverty level. Within the married-couple family households, those with 1 or 2 children have the highest poverty rate, with 71 households (60.2%) falling below the poverty line. Among the single-parent households, those with 1 or 2 children have the highest poverty rate, with 69 household (84.2%) living below poverty.
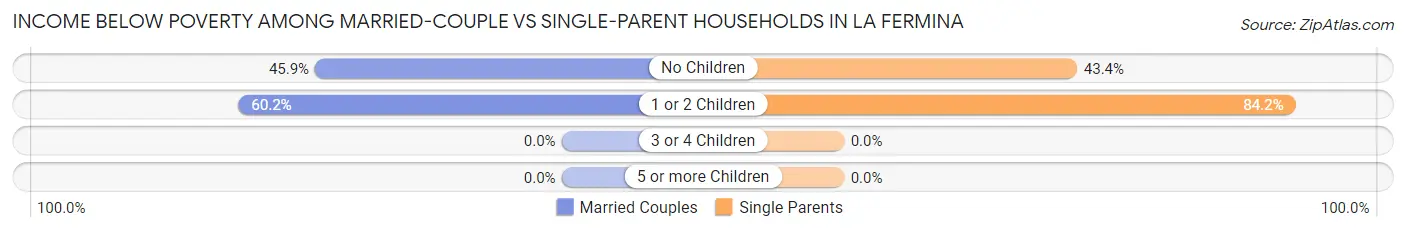
| Children | Married-Couple Families | Single-Parent Households |
| No Children | 135 (45.9%) | 53 (43.4%) |
| 1 or 2 Children | 71 (60.2%) | 69 (84.2%) |
| 3 or 4 Children | 0 (0.0%) | 0 (0.0%) |
| 5 or more Children | 0 (0.0%) | 0 (0.0%) |
| Total | 206 (50.0%) | 122 (59.8%) |
Race in La Fermina
The most populous races in La Fermina are Hispanic or Latino (2,336 | 100.0%), Some other Race (1,521 | 65.1%), and Black / African American (621 | 26.6%).
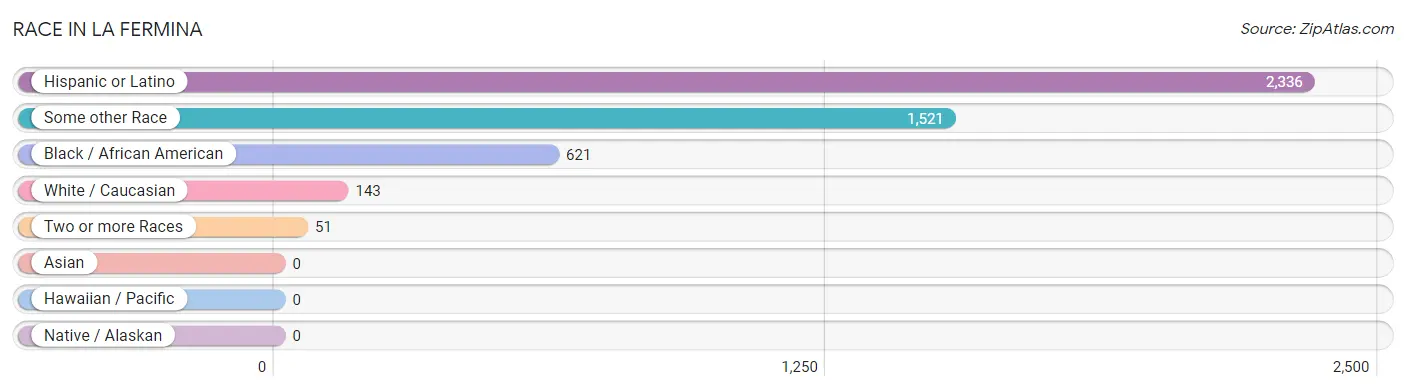
| Race | # Population | % Population |
| Asian | 0 | 0.0% |
| Black / African American | 621 | 26.6% |
| Hawaiian / Pacific | 0 | 0.0% |
| Hispanic or Latino | 2,336 | 100.0% |
| Native / Alaskan | 0 | 0.0% |
| White / Caucasian | 143 | 6.1% |
| Two or more Races | 51 | 2.2% |
| Some other Race | 1,521 | 65.1% |
| Total | 2,336 | 100.0% |
Ancestry in La Fermina
The most populous ancestries reported in La Fermina are , and Puerto Rican (2,336 | 100.0%), together accounting for 100.0% of all La Fermina residents.

| Ancestry | # Population | % Population |
| Puerto Rican | 2,336 | 100.0% | View All 1 Rows |
Immigrants in La Fermina

| Immigration Origin | # Population | % Population | View All 0 Rows |
Sex and Age in La Fermina
Sex and Age in La Fermina
The most populous age groups in La Fermina are 25 to 29 Years (229 | 18.8%) for men and 75 to 79 Years (141 | 12.6%) for women.
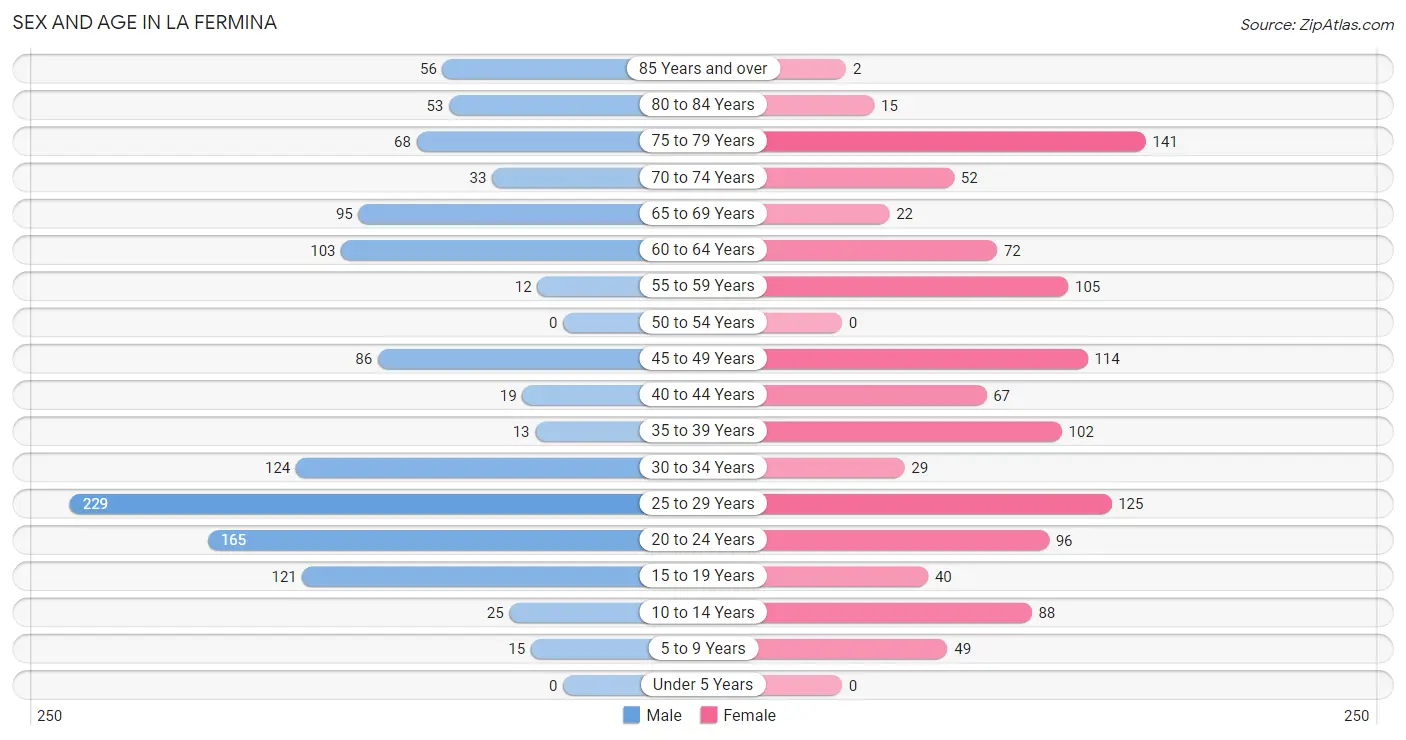
| Age Bracket | Male | Female |
| Under 5 Years | 0 (0.0%) | 0 (0.0%) |
| 5 to 9 Years | 15 (1.2%) | 49 (4.4%) |
| 10 to 14 Years | 25 (2.1%) | 88 (7.9%) |
| 15 to 19 Years | 121 (9.9%) | 40 (3.6%) |
| 20 to 24 Years | 165 (13.6%) | 96 (8.6%) |
| 25 to 29 Years | 229 (18.8%) | 125 (11.2%) |
| 30 to 34 Years | 124 (10.2%) | 29 (2.6%) |
| 35 to 39 Years | 13 (1.1%) | 102 (9.1%) |
| 40 to 44 Years | 19 (1.6%) | 67 (6.0%) |
| 45 to 49 Years | 86 (7.1%) | 114 (10.2%) |
| 50 to 54 Years | 0 (0.0%) | 0 (0.0%) |
| 55 to 59 Years | 12 (1.0%) | 105 (9.4%) |
| 60 to 64 Years | 103 (8.5%) | 72 (6.4%) |
| 65 to 69 Years | 95 (7.8%) | 22 (2.0%) |
| 70 to 74 Years | 33 (2.7%) | 52 (4.6%) |
| 75 to 79 Years | 68 (5.6%) | 141 (12.6%) |
| 80 to 84 Years | 53 (4.3%) | 15 (1.3%) |
| 85 Years and over | 56 (4.6%) | 2 (0.2%) |
| Total | 1,217 (100.0%) | 1,119 (100.0%) |
Families and Households in La Fermina
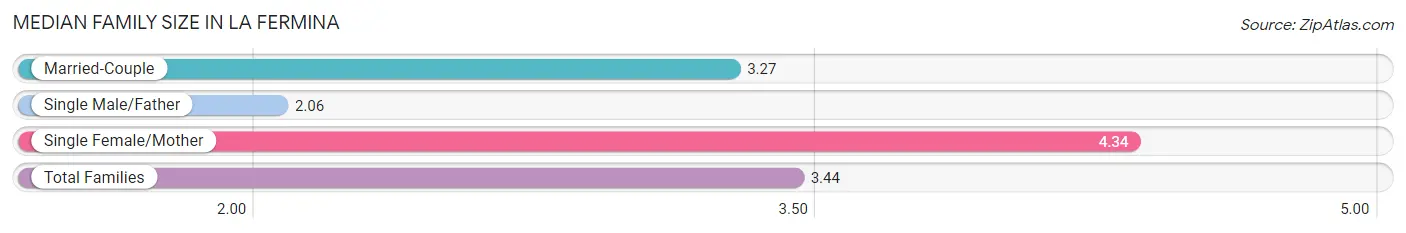
Median Family Size in La Fermina
The median family size in La Fermina is 3.44 persons per family, with single female/mother families (155 | 25.2%) accounting for the largest median family size of 4.34 persons per family. On the other hand, single male/father families (49 | 8.0%) represent the smallest median family size with 2.06 persons per family.
| Family Type | # Families | Family Size |
| Married-Couple | 412 (66.9%) | 3.27 |
| Single Male/Father | 49 (8.0%) | 2.06 |
| Single Female/Mother | 155 (25.2%) | 4.34 |
| Total Families | 616 (100.0%) | 3.44 |
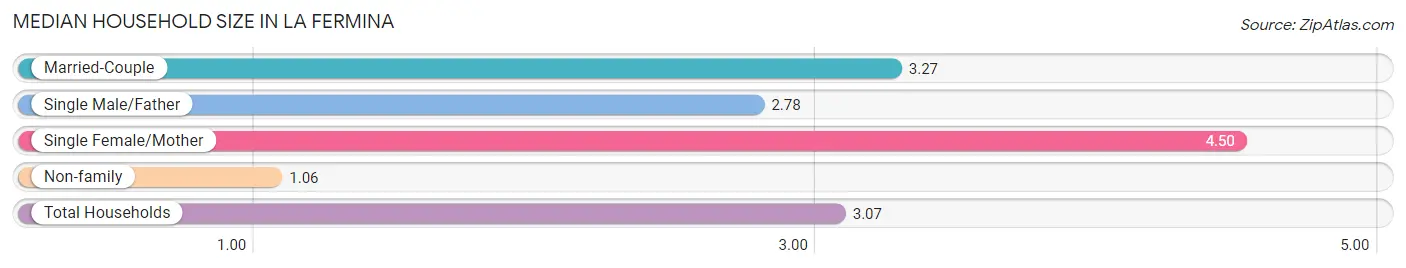
Median Household Size in La Fermina
The median household size in La Fermina is 3.07 persons per household, with single female/mother households (155 | 20.4%) accounting for the largest median household size of 4.5 persons per household. non-family households (142 | 18.7%) represent the smallest median household size with 1.06 persons per household.
| Household Type | # Households | Household Size |
| Married-Couple | 412 (54.3%) | 3.27 |
| Single Male/Father | 49 (6.5%) | 2.78 |
| Single Female/Mother | 155 (20.4%) | 4.50 |
| Non-family | 142 (18.7%) | 1.06 |
| Total Households | 758 (100.0%) | 3.07 |
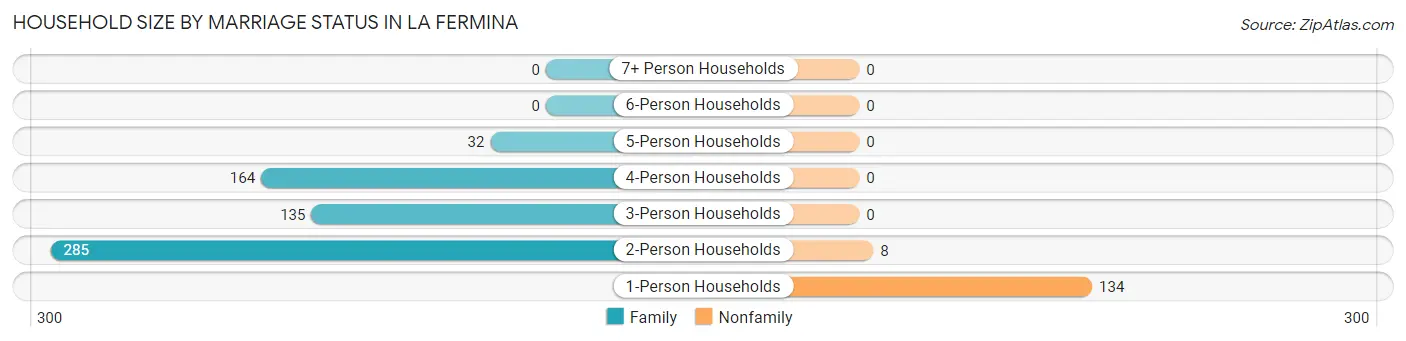
Household Size by Marriage Status in La Fermina
Out of a total of 758 households in La Fermina, 616 (81.3%) are family households, while 142 (18.7%) are nonfamily households. The most numerous type of family households are 2-person households, comprising 285, and the most common type of nonfamily households are 1-person households, comprising 134.
| Household Size | Family Households | Nonfamily Households |
| 1-Person Households | - | 134 (17.7%) |
| 2-Person Households | 285 (37.6%) | 8 (1.1%) |
| 3-Person Households | 135 (17.8%) | 0 (0.0%) |
| 4-Person Households | 164 (21.6%) | 0 (0.0%) |
| 5-Person Households | 32 (4.2%) | 0 (0.0%) |
| 6-Person Households | 0 (0.0%) | 0 (0.0%) |
| 7+ Person Households | 0 (0.0%) | 0 (0.0%) |
| Total | 616 (81.3%) | 142 (18.7%) |
Female Fertility in La Fermina
Fertility by Age in La Fermina
| Age Bracket | Women with Births | Births / 1,000 Women |
| 15 to 19 years | 0 (0.0%) | 0.0 |
| 20 to 34 years | 0 (0.0%) | 0.0 |
| 35 to 50 years | 0 (0.0%) | 0.0 |
| Total | 0 (0.0%) | 0.0 |
Fertility by Age by Marriage Status in La Fermina
| Age Bracket | Married | Unmarried |
| 15 to 19 years | 0 (0.0%) | 0 (0.0%) |
| 20 to 34 years | 0 (0.0%) | 0 (0.0%) |
| 35 to 50 years | 0 (0.0%) | 0 (0.0%) |
| Total | 0 (0.0%) | 0 (0.0%) |
Fertility by Education in La Fermina
| Educational Attainment | Women with Births | Births / 1,000 Women |
| Less than High School | 0 (0.0%) | 0.0 |
| High School Diploma | 0 (0.0%) | 0.0 |
| College or Associate's Degree | 0 (0.0%) | 0.0 |
| Bachelor's Degree | 0 (0.0%) | 0.0 |
| Graduate Degree | 0 (0.0%) | 0.0 |
| Total | 0 (0.0%) | 0.0 |
Fertility by Education by Marriage Status in La Fermina
| Educational Attainment | Married | Unmarried |
| Less than High School | 0 (0.0%) | 0 (0.0%) |
| High School Diploma | 0 (0.0%) | 0 (0.0%) |
| College or Associate's Degree | 0 (0.0%) | 0 (0.0%) |
| Bachelor's Degree | 0 (0.0%) | 0 (0.0%) |
| Graduate Degree | 0 (0.0%) | 0 (0.0%) |
| Total | 0 (0.0%) | 0 (0.0%) |
Employment Characteristics in La Fermina
Employment by Class of Employer in La Fermina
Among the 714 employed individuals in La Fermina, self-employed (not incorporated) (305 | 42.7%), private company employees (225 | 31.5%), and state government employees (110 | 15.4%) make up the most common classes of employment.
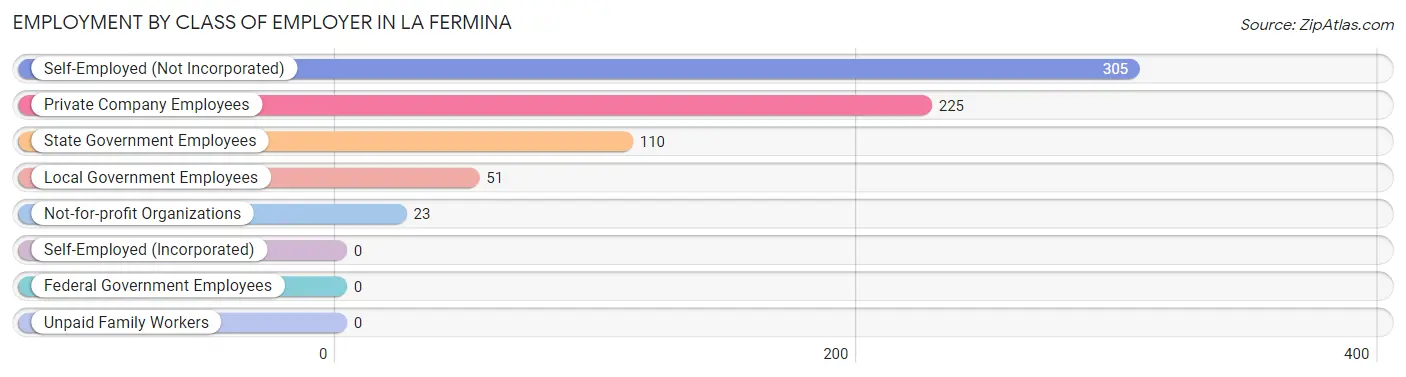
| Employer Class | # Employees | % Employees |
| Private Company Employees | 225 | 31.5% |
| Self-Employed (Incorporated) | 0 | 0.0% |
| Self-Employed (Not Incorporated) | 305 | 42.7% |
| Not-for-profit Organizations | 23 | 3.2% |
| Local Government Employees | 51 | 7.1% |
| State Government Employees | 110 | 15.4% |
| Federal Government Employees | 0 | 0.0% |
| Unpaid Family Workers | 0 | 0.0% |
| Total | 714 | 100.0% |
Employment Status by Age in La Fermina
According to the labor force statistics for La Fermina, out of the total population over 16 years of age (2,132), 40.2% or 857 individuals are in the labor force, with 16.6% or 142 of them unemployed. The age group with the highest labor force participation rate is 25 to 29 years, with 88.4% or 313 individuals in the labor force. Within the labor force, the 25 to 29 years age range has the highest percentage of unemployed individuals, with 24.0% or 75 of them being unemployed.
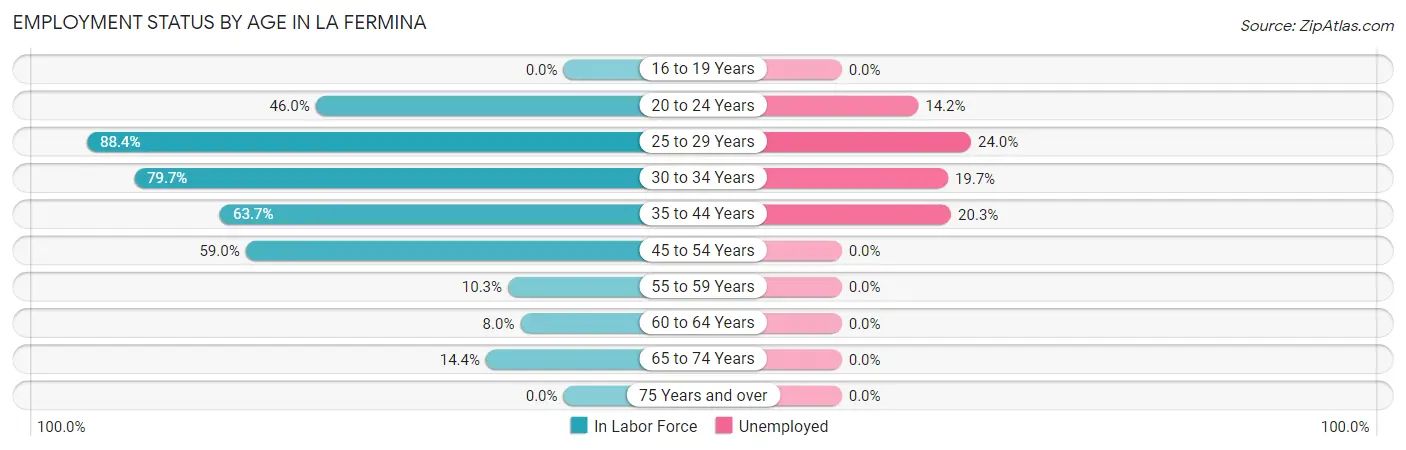
| Age Bracket | In Labor Force | Unemployed |
| 16 to 19 Years | 0 (0.0%) | 0 (0.0%) |
| 20 to 24 Years | 120 (46.0%) | 17 (14.2%) |
| 25 to 29 Years | 313 (88.4%) | 75 (24.0%) |
| 30 to 34 Years | 122 (79.7%) | 24 (19.7%) |
| 35 to 44 Years | 128 (63.7%) | 26 (20.3%) |
| 45 to 54 Years | 118 (59.0%) | 0 (0.0%) |
| 55 to 59 Years | 12 (10.3%) | 0 (0.0%) |
| 60 to 64 Years | 14 (8.0%) | 0 (0.0%) |
| 65 to 74 Years | 29 (14.4%) | 0 (0.0%) |
| 75 Years and over | 0 (0.0%) | 0 (0.0%) |
| Total | 857 (40.2%) | 142 (16.6%) |
Employment Status by Educational Attainment in La Fermina
According to labor force statistics for La Fermina, 58.9% of individuals (707) out of the total population between 25 and 64 years of age (1,200) are in the labor force, with 17.7% or 125 of them being unemployed. The group with the highest labor force participation rate are those with the educational attainment of bachelor's degree or higher, with 80.0% or 212 individuals in the labor force. Within the labor force, individuals with bachelor's degree or higher education have the highest percentage of unemployment, with 23.1% or 49 of them being unemployed.
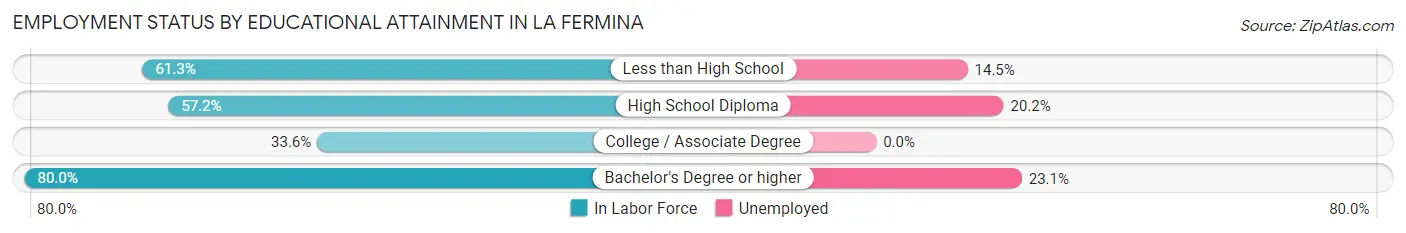
| Educational Attainment | In Labor Force | Unemployed |
| Less than High School | 165 (61.3%) | 39 (14.5%) |
| High School Diploma | 257 (57.2%) | 91 (20.2%) |
| College / Associate Degree | 73 (33.6%) | 0 (0.0%) |
| Bachelor's Degree or higher | 212 (80.0%) | 61 (23.1%) |
| Total | 707 (58.9%) | 212 (17.7%) |
Employment Occupations by Sex in La Fermina
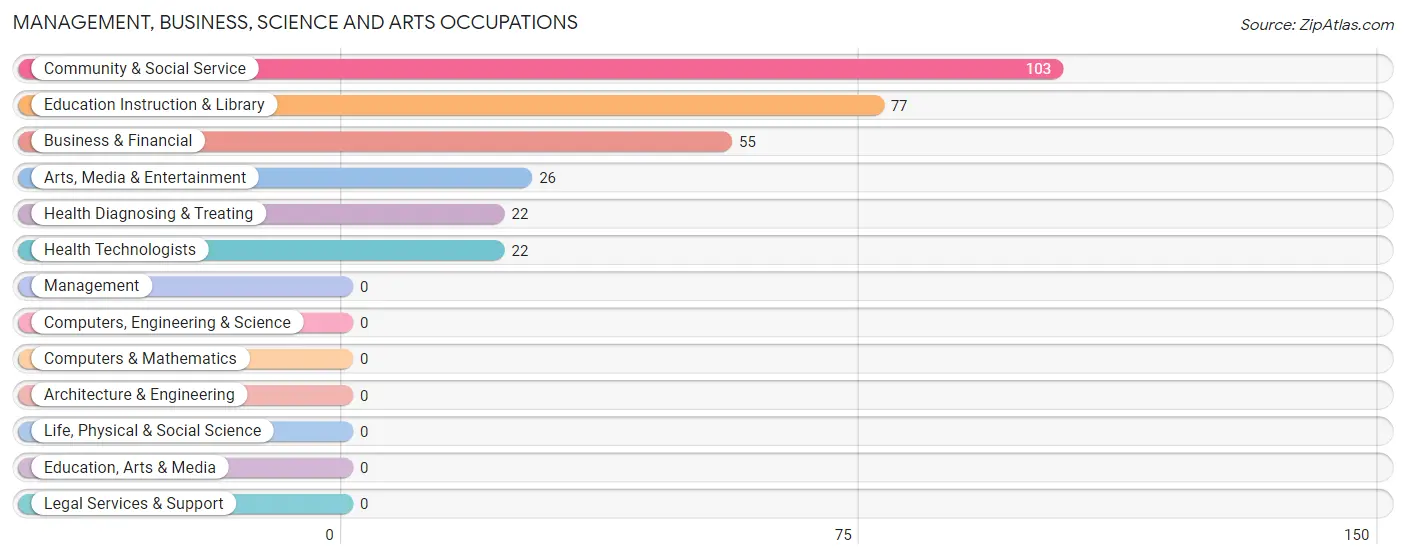
Management, Business, Science and Arts Occupations
The most common Management, Business, Science and Arts occupations in La Fermina are Community & Social Service (103 | 14.4%), Education Instruction & Library (77 | 10.8%), Business & Financial (55 | 7.7%), Arts, Media & Entertainment (26 | 3.6%), and Health Diagnosing & Treating (22 | 3.1%).
Management, Business, Science and Arts Occupations by Sex
Within the Management, Business, Science and Arts occupations in La Fermina, the most male-oriented occupations are Arts, Media & Entertainment (100.0%), Health Diagnosing & Treating (100.0%), and Health Technologists (100.0%), while the most female-oriented occupations are Business & Financial (100.0%), Education Instruction & Library (100.0%), and Community & Social Service (74.8%).
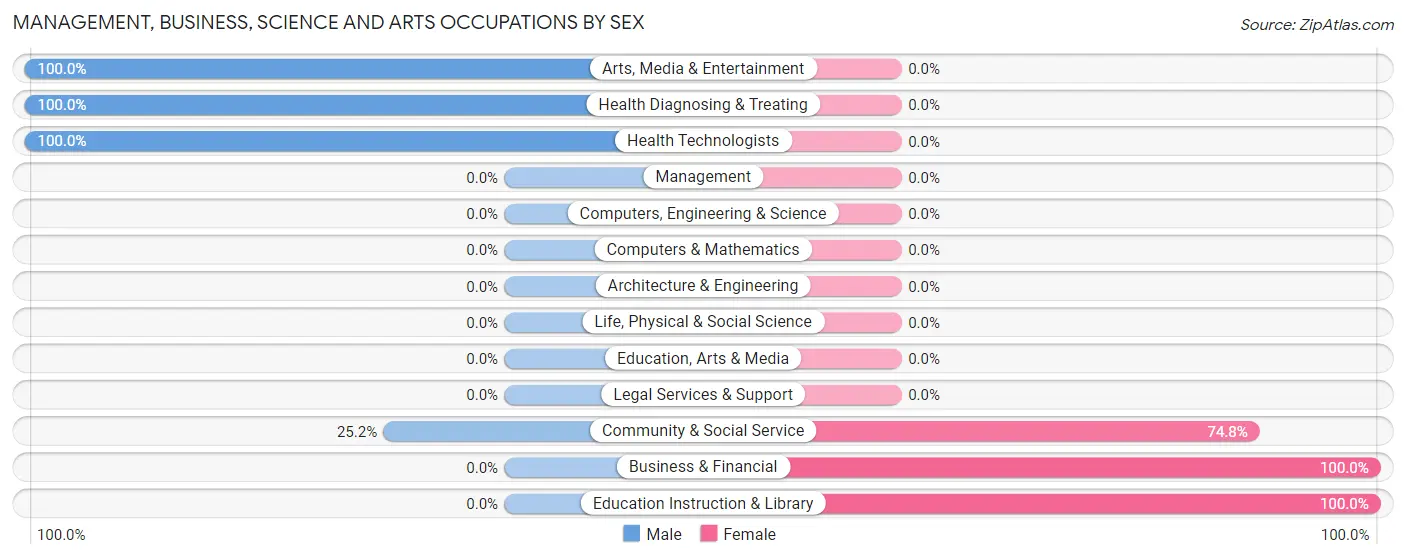
| Occupation | Male | Female |
| Management | 0 (0.0%) | 0 (0.0%) |
| Business & Financial | 0 (0.0%) | 55 (100.0%) |
| Computers, Engineering & Science | 0 (0.0%) | 0 (0.0%) |
| Computers & Mathematics | 0 (0.0%) | 0 (0.0%) |
| Architecture & Engineering | 0 (0.0%) | 0 (0.0%) |
| Life, Physical & Social Science | 0 (0.0%) | 0 (0.0%) |
| Community & Social Service | 26 (25.2%) | 77 (74.8%) |
| Education, Arts & Media | 0 (0.0%) | 0 (0.0%) |
| Legal Services & Support | 0 (0.0%) | 0 (0.0%) |
| Education Instruction & Library | 0 (0.0%) | 77 (100.0%) |
| Arts, Media & Entertainment | 26 (100.0%) | 0 (0.0%) |
| Health Diagnosing & Treating | 22 (100.0%) | 0 (0.0%) |
| Health Technologists | 22 (100.0%) | 0 (0.0%) |
| Total (Category) | 48 (26.7%) | 132 (73.3%) |
| Total (Overall) | 489 (68.5%) | 225 (31.5%) |
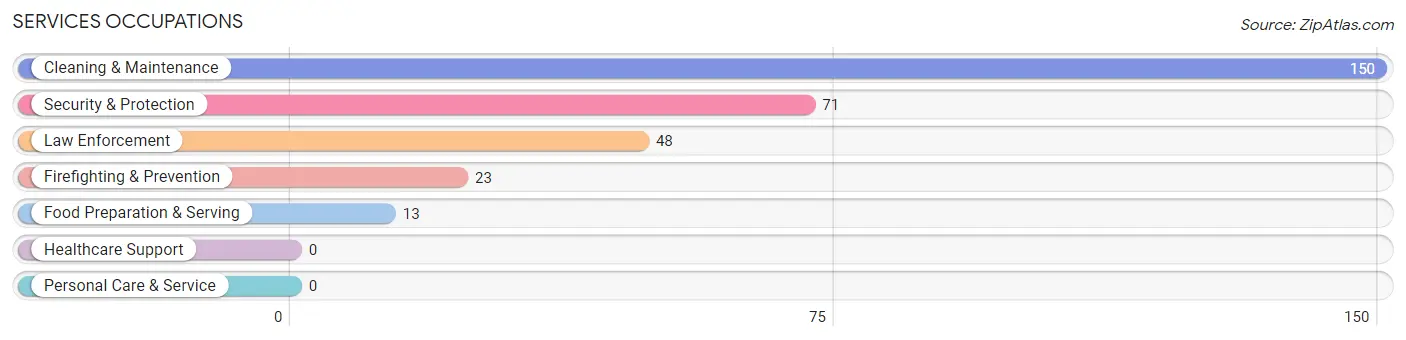
Services Occupations
The most common Services occupations in La Fermina are Cleaning & Maintenance (150 | 21.0%), Security & Protection (71 | 9.9%), Law Enforcement (48 | 6.7%), Firefighting & Prevention (23 | 3.2%), and Food Preparation & Serving (13 | 1.8%).
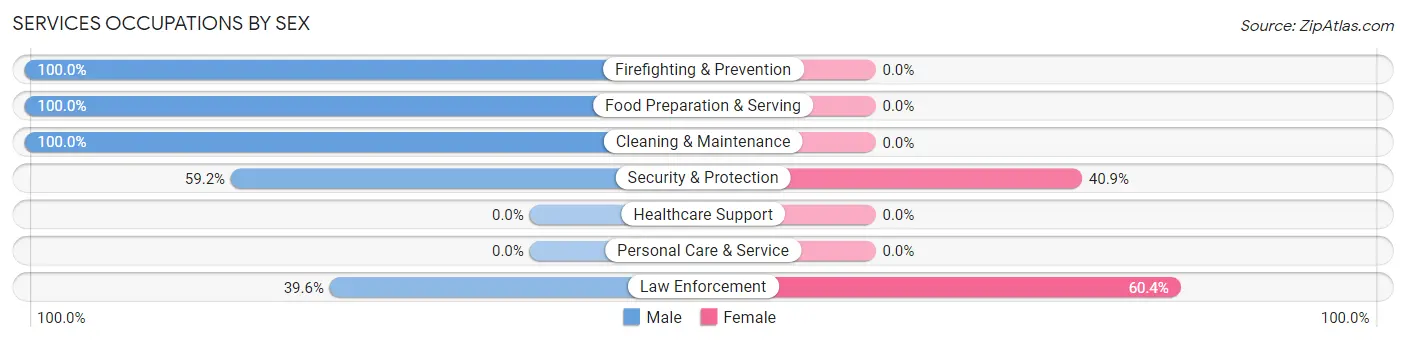
Services Occupations by Sex
Within the Services occupations in La Fermina, the most male-oriented occupations are Firefighting & Prevention (100.0%), Food Preparation & Serving (100.0%), and Cleaning & Maintenance (100.0%), while the most female-oriented occupations are Law Enforcement (60.4%), and Security & Protection (40.8%).
| Occupation | Male | Female |
| Healthcare Support | 0 (0.0%) | 0 (0.0%) |
| Security & Protection | 42 (59.2%) | 29 (40.8%) |
| Firefighting & Prevention | 23 (100.0%) | 0 (0.0%) |
| Law Enforcement | 19 (39.6%) | 29 (60.4%) |
| Food Preparation & Serving | 13 (100.0%) | 0 (0.0%) |
| Cleaning & Maintenance | 150 (100.0%) | 0 (0.0%) |
| Personal Care & Service | 0 (0.0%) | 0 (0.0%) |
| Total (Category) | 205 (87.6%) | 29 (12.4%) |
| Total (Overall) | 489 (68.5%) | 225 (31.5%) |
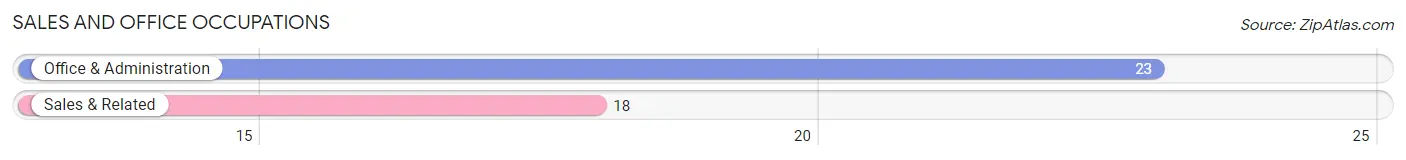
Sales and Office Occupations
The most common Sales and Office occupations in La Fermina are Office & Administration (23 | 3.2%), and Sales & Related (18 | 2.5%).
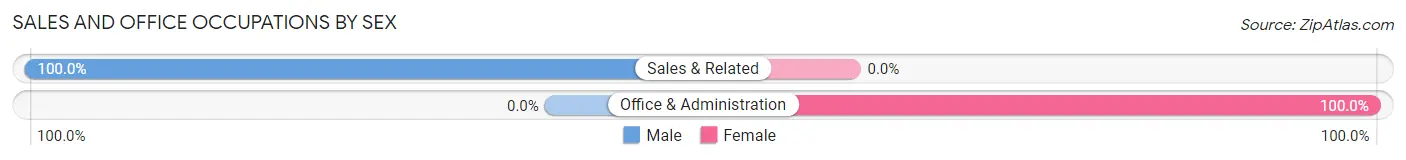
Sales and Office Occupations by Sex
| Occupation | Male | Female |
| Sales & Related | 18 (100.0%) | 0 (0.0%) |
| Office & Administration | 0 (0.0%) | 23 (100.0%) |
| Total (Category) | 18 (43.9%) | 23 (56.1%) |
| Total (Overall) | 489 (68.5%) | 225 (31.5%) |
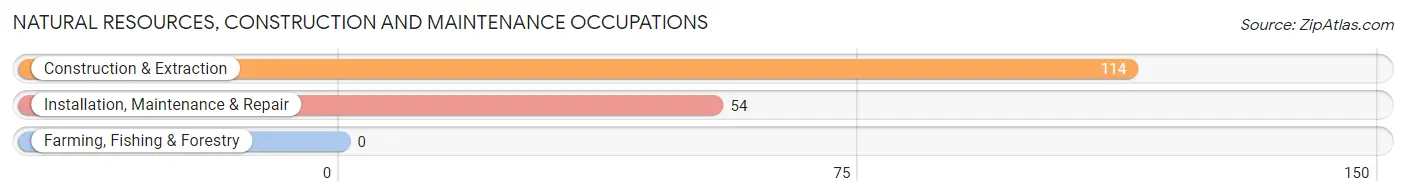
Natural Resources, Construction and Maintenance Occupations
The most common Natural Resources, Construction and Maintenance occupations in La Fermina are Construction & Extraction (114 | 16.0%), and Installation, Maintenance & Repair (54 | 7.6%).
Natural Resources, Construction and Maintenance Occupations by Sex
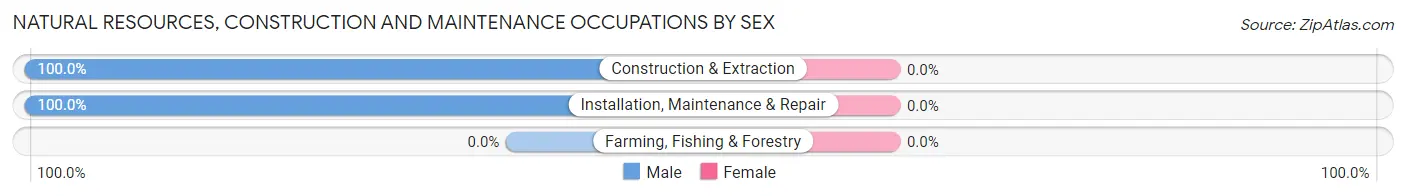
| Occupation | Male | Female |
| Farming, Fishing & Forestry | 0 (0.0%) | 0 (0.0%) |
| Construction & Extraction | 114 (100.0%) | 0 (0.0%) |
| Installation, Maintenance & Repair | 54 (100.0%) | 0 (0.0%) |
| Total (Category) | 168 (100.0%) | 0 (0.0%) |
| Total (Overall) | 489 (68.5%) | 225 (31.5%) |
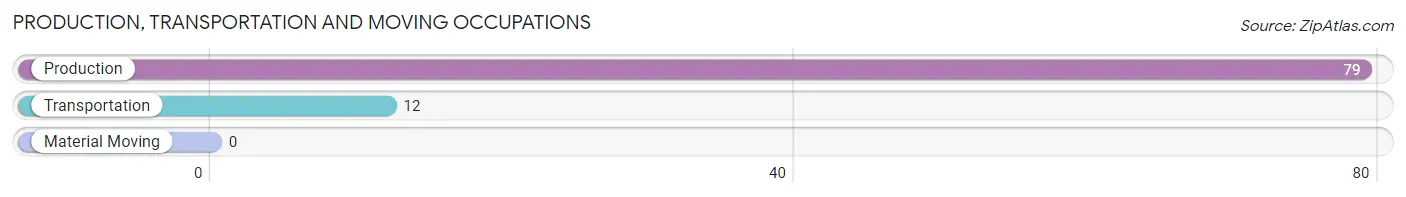
Production, Transportation and Moving Occupations
The most common Production, Transportation and Moving occupations in La Fermina are Production (79 | 11.1%), and Transportation (12 | 1.7%).
Production, Transportation and Moving Occupations by Sex
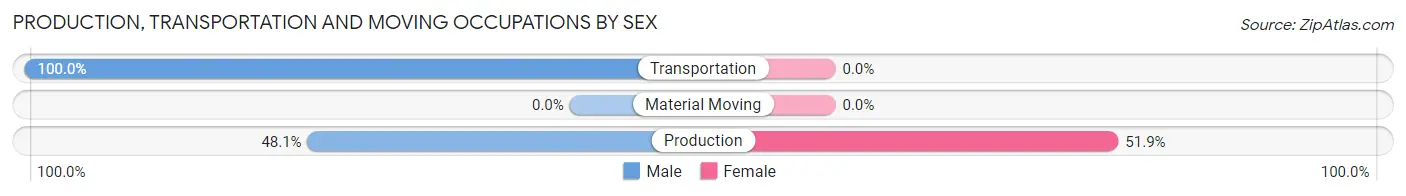
| Occupation | Male | Female |
| Production | 38 (48.1%) | 41 (51.9%) |
| Transportation | 12 (100.0%) | 0 (0.0%) |
| Material Moving | 0 (0.0%) | 0 (0.0%) |
| Total (Category) | 50 (54.9%) | 41 (45.1%) |
| Total (Overall) | 489 (68.5%) | 225 (31.5%) |
Employment Industries by Sex in La Fermina
Employment Industries in La Fermina
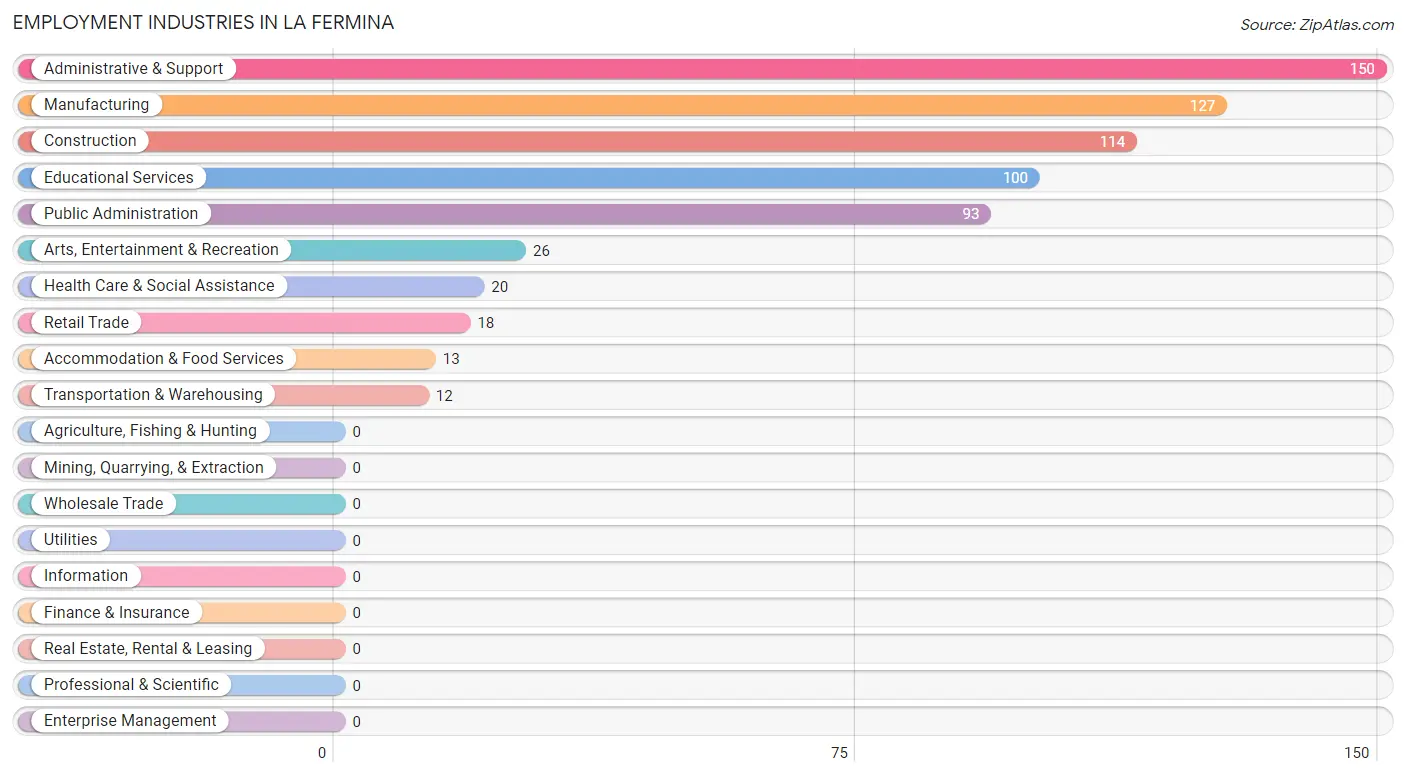
The major employment industries in La Fermina include Administrative & Support (150 | 21.0%), Manufacturing (127 | 17.8%), Construction (114 | 16.0%), Educational Services (100 | 14.0%), and Public Administration (93 | 13.0%).
Employment Industries by Sex in La Fermina
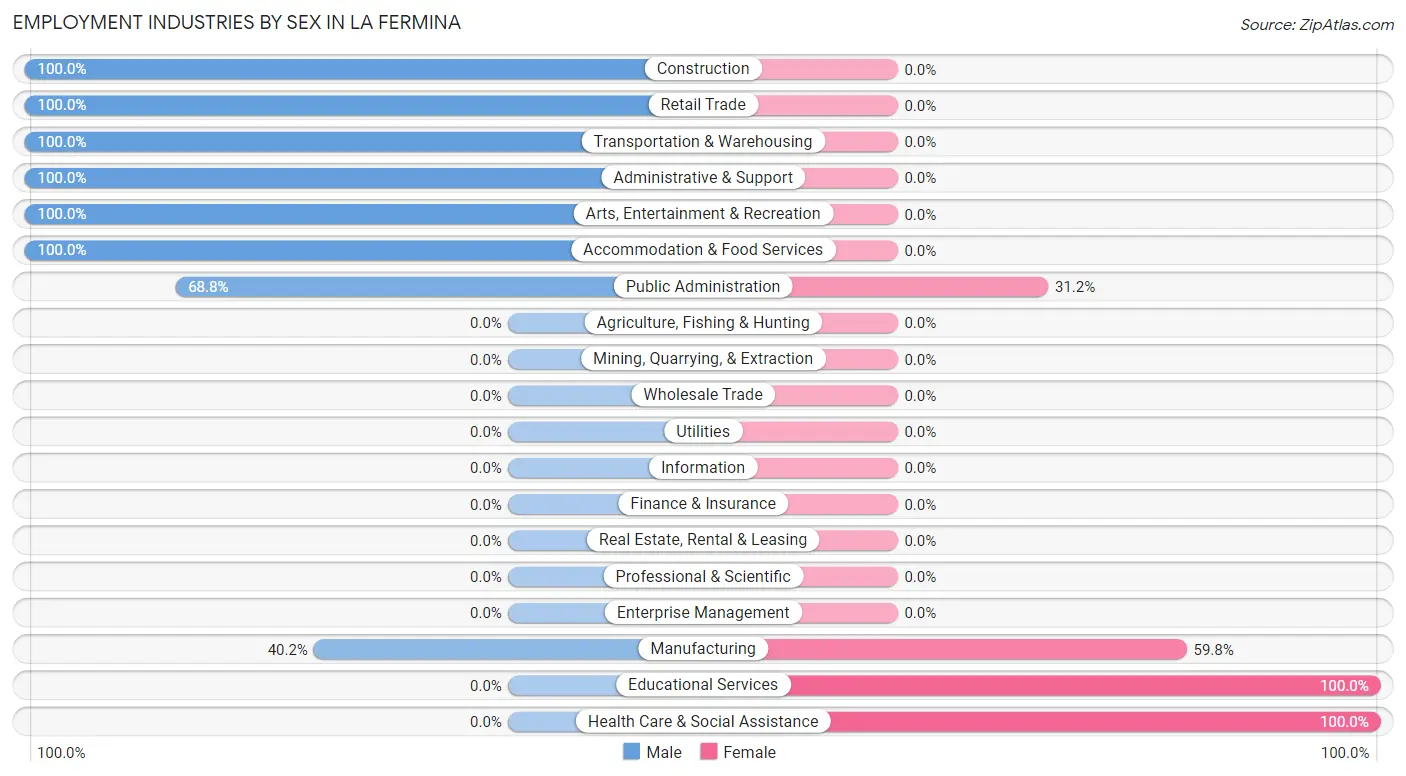
The La Fermina industries that see more men than women are Construction (100.0%), Retail Trade (100.0%), and Transportation & Warehousing (100.0%), whereas the industries that tend to have a higher number of women are Educational Services (100.0%), Health Care & Social Assistance (100.0%), and Manufacturing (59.8%).
| Industry | Male | Female |
| Agriculture, Fishing & Hunting | 0 (0.0%) | 0 (0.0%) |
| Mining, Quarrying, & Extraction | 0 (0.0%) | 0 (0.0%) |
| Construction | 114 (100.0%) | 0 (0.0%) |
| Manufacturing | 51 (40.2%) | 76 (59.8%) |
| Wholesale Trade | 0 (0.0%) | 0 (0.0%) |
| Retail Trade | 18 (100.0%) | 0 (0.0%) |
| Transportation & Warehousing | 12 (100.0%) | 0 (0.0%) |
| Utilities | 0 (0.0%) | 0 (0.0%) |
| Information | 0 (0.0%) | 0 (0.0%) |
| Finance & Insurance | 0 (0.0%) | 0 (0.0%) |
| Real Estate, Rental & Leasing | 0 (0.0%) | 0 (0.0%) |
| Professional & Scientific | 0 (0.0%) | 0 (0.0%) |
| Enterprise Management | 0 (0.0%) | 0 (0.0%) |
| Administrative & Support | 150 (100.0%) | 0 (0.0%) |
| Educational Services | 0 (0.0%) | 100 (100.0%) |
| Health Care & Social Assistance | 0 (0.0%) | 20 (100.0%) |
| Arts, Entertainment & Recreation | 26 (100.0%) | 0 (0.0%) |
| Accommodation & Food Services | 13 (100.0%) | 0 (0.0%) |
| Public Administration | 64 (68.8%) | 29 (31.2%) |
| Total | 489 (68.5%) | 225 (31.5%) |
Education in La Fermina
School Enrollment in La Fermina
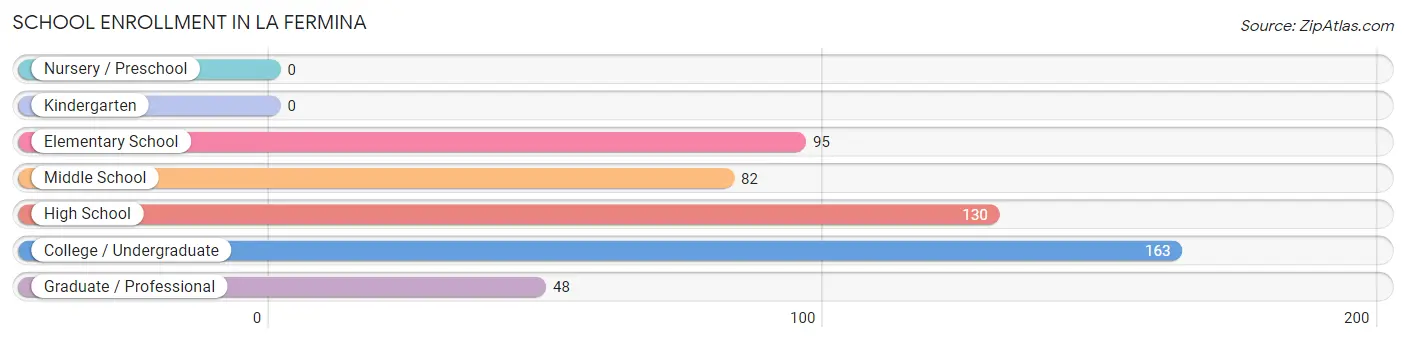
The most common levels of schooling among the 518 students in La Fermina are college / undergraduate (163 | 31.5%), high school (130 | 25.1%), and elementary school (95 | 18.3%).
| School Level | # Students | % Students |
| Nursery / Preschool | 0 | 0.0% |
| Kindergarten | 0 | 0.0% |
| Elementary School | 95 | 18.3% |
| Middle School | 82 | 15.8% |
| High School | 130 | 25.1% |
| College / Undergraduate | 163 | 31.5% |
| Graduate / Professional | 48 | 9.3% |
| Total | 518 | 100.0% |
School Enrollment by Age by Funding Source in La Fermina
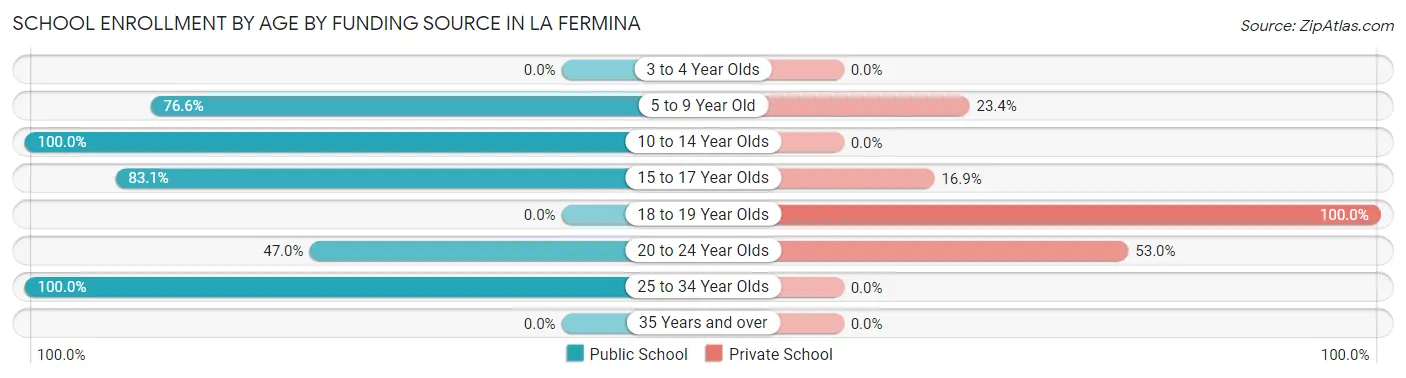
Out of a total of 518 students who are enrolled in schools in La Fermina, 138 (26.6%) attend a private institution, while the remaining 380 (73.4%) are enrolled in public schools. The age group of 18 to 19 year olds has the highest likelihood of being enrolled in private schools, with 31 (100.0% in the age bracket) enrolled. Conversely, the age group of 10 to 14 year olds has the lowest likelihood of being enrolled in a private school, with 113 (100.0% in the age bracket) attending a public institution.
| Age Bracket | Public School | Private School |
| 3 to 4 Year Olds | 0 (0.0%) | 0 (0.0%) |
| 5 to 9 Year Old | 49 (76.6%) | 15 (23.4%) |
| 10 to 14 Year Olds | 113 (100.0%) | 0 (0.0%) |
| 15 to 17 Year Olds | 108 (83.1%) | 22 (16.9%) |
| 18 to 19 Year Olds | 0 (0.0%) | 31 (100.0%) |
| 20 to 24 Year Olds | 62 (47.0%) | 70 (53.0%) |
| 25 to 34 Year Olds | 48 (100.0%) | 0 (0.0%) |
| 35 Years and over | 0 (0.0%) | 0 (0.0%) |
| Total | 380 (73.4%) | 138 (26.6%) |
Educational Attainment by Field of Study in La Fermina
Education (92 | 34.2%), science & technology (76 | 28.2%), arts & humanities (39 | 14.5%), visual & performing arts (24 | 8.9%), and business (23 | 8.6%) are the most common fields of study among 269 individuals in La Fermina who have obtained a bachelor's degree or higher.
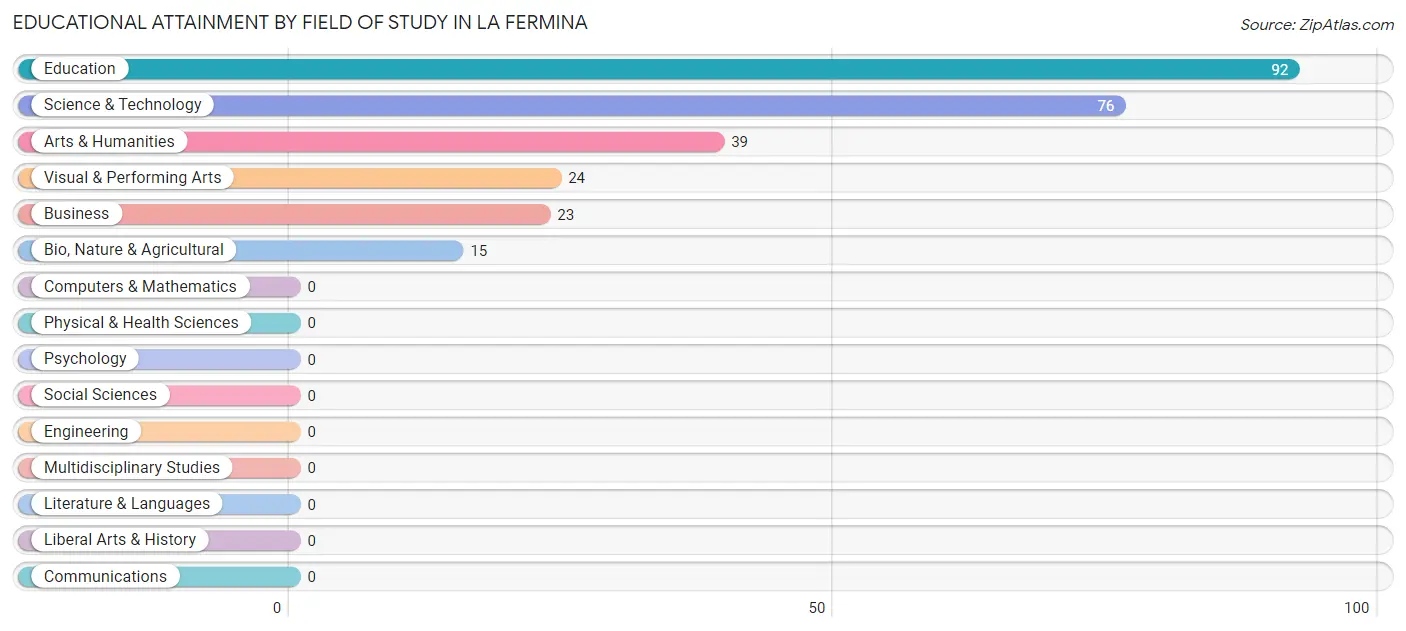
| Field of Study | # Graduates | % Graduates |
| Computers & Mathematics | 0 | 0.0% |
| Bio, Nature & Agricultural | 15 | 5.6% |
| Physical & Health Sciences | 0 | 0.0% |
| Psychology | 0 | 0.0% |
| Social Sciences | 0 | 0.0% |
| Engineering | 0 | 0.0% |
| Multidisciplinary Studies | 0 | 0.0% |
| Science & Technology | 76 | 28.2% |
| Business | 23 | 8.6% |
| Education | 92 | 34.2% |
| Literature & Languages | 0 | 0.0% |
| Liberal Arts & History | 0 | 0.0% |
| Visual & Performing Arts | 24 | 8.9% |
| Communications | 0 | 0.0% |
| Arts & Humanities | 39 | 14.5% |
| Total | 269 | 100.0% |
Transportation & Commute in La Fermina
Vehicle Availability by Sex in La Fermina
The most prevalent vehicle ownership categories in La Fermina are males with 3 vehicles (260, accounting for 53.2%) and females with 3 vehicles (29, making up 115.6%).
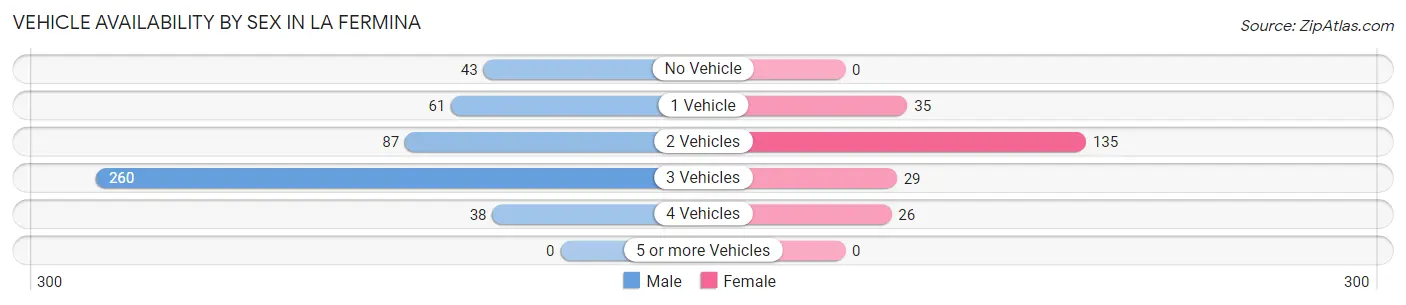
| Vehicles Available | Male | Female |
| No Vehicle | 43 (8.8%) | 0 (0.0%) |
| 1 Vehicle | 61 (12.5%) | 35 (15.6%) |
| 2 Vehicles | 87 (17.8%) | 135 (60.0%) |
| 3 Vehicles | 260 (53.2%) | 29 (12.9%) |
| 4 Vehicles | 38 (7.8%) | 26 (11.6%) |
| 5 or more Vehicles | 0 (0.0%) | 0 (0.0%) |
| Total | 489 (100.0%) | 225 (100.0%) |
Commute Time in La Fermina
The most frequently occuring commute durations in La Fermina are 15 to 19 minutes (259 commuters, 36.3%), 60 to 89 minutes (125 commuters, 17.5%), and 45 to 59 minutes (90 commuters, 12.6%).
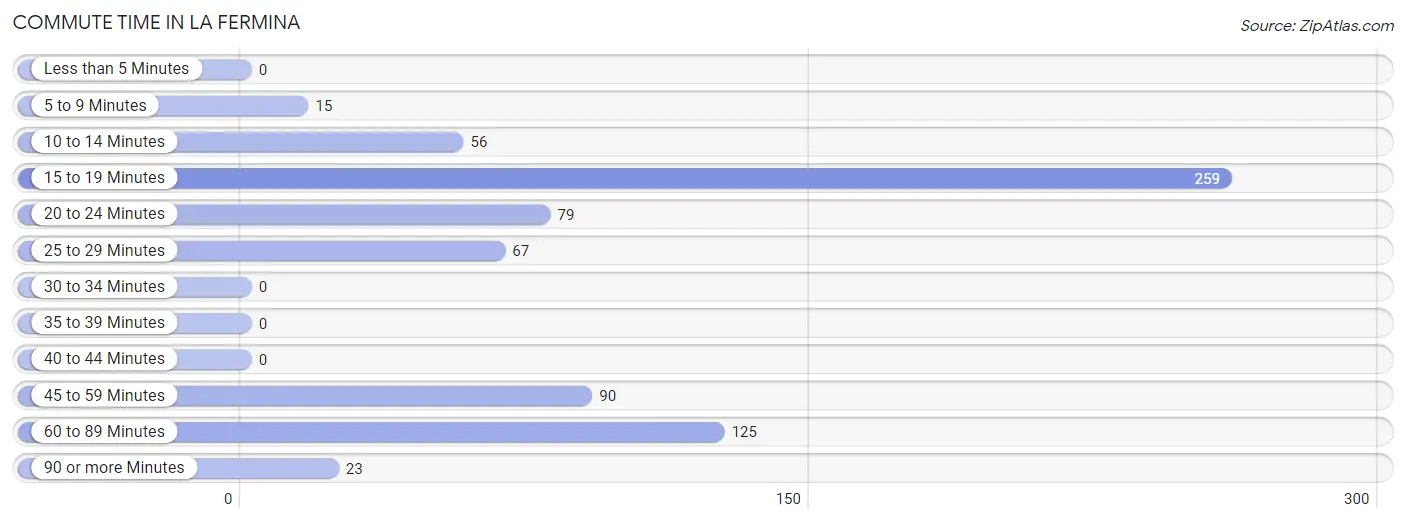
| Commute Time | # Commuters | % Commuters |
| Less than 5 Minutes | 0 | 0.0% |
| 5 to 9 Minutes | 15 | 2.1% |
| 10 to 14 Minutes | 56 | 7.8% |
| 15 to 19 Minutes | 259 | 36.3% |
| 20 to 24 Minutes | 79 | 11.1% |
| 25 to 29 Minutes | 67 | 9.4% |
| 30 to 34 Minutes | 0 | 0.0% |
| 35 to 39 Minutes | 0 | 0.0% |
| 40 to 44 Minutes | 0 | 0.0% |
| 45 to 59 Minutes | 90 | 12.6% |
| 60 to 89 Minutes | 125 | 17.5% |
| 90 or more Minutes | 23 | 3.2% |
Commute Time by Sex in La Fermina
The most common commute times in La Fermina are 15 to 19 minutes (210 commuters, 42.9%) for males and 20 to 24 minutes (79 commuters, 35.1%) for females.
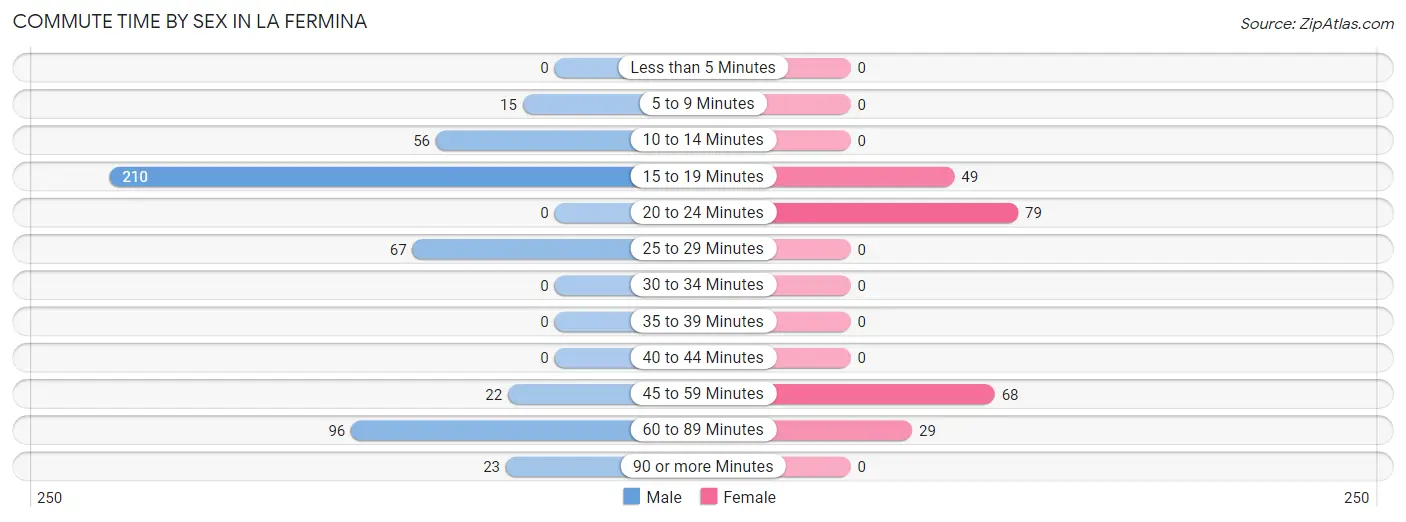
| Commute Time | Male | Female |
| Less than 5 Minutes | 0 (0.0%) | 0 (0.0%) |
| 5 to 9 Minutes | 15 (3.1%) | 0 (0.0%) |
| 10 to 14 Minutes | 56 (11.5%) | 0 (0.0%) |
| 15 to 19 Minutes | 210 (42.9%) | 49 (21.8%) |
| 20 to 24 Minutes | 0 (0.0%) | 79 (35.1%) |
| 25 to 29 Minutes | 67 (13.7%) | 0 (0.0%) |
| 30 to 34 Minutes | 0 (0.0%) | 0 (0.0%) |
| 35 to 39 Minutes | 0 (0.0%) | 0 (0.0%) |
| 40 to 44 Minutes | 0 (0.0%) | 0 (0.0%) |
| 45 to 59 Minutes | 22 (4.5%) | 68 (30.2%) |
| 60 to 89 Minutes | 96 (19.6%) | 29 (12.9%) |
| 90 or more Minutes | 23 (4.7%) | 0 (0.0%) |
Time of Departure to Work by Sex in La Fermina
The most frequent times of departure to work in La Fermina are 8:00 AM to 8:29 AM (140, 28.6%) for males and 6:00 AM to 6:29 AM (48, 21.3%) for females.
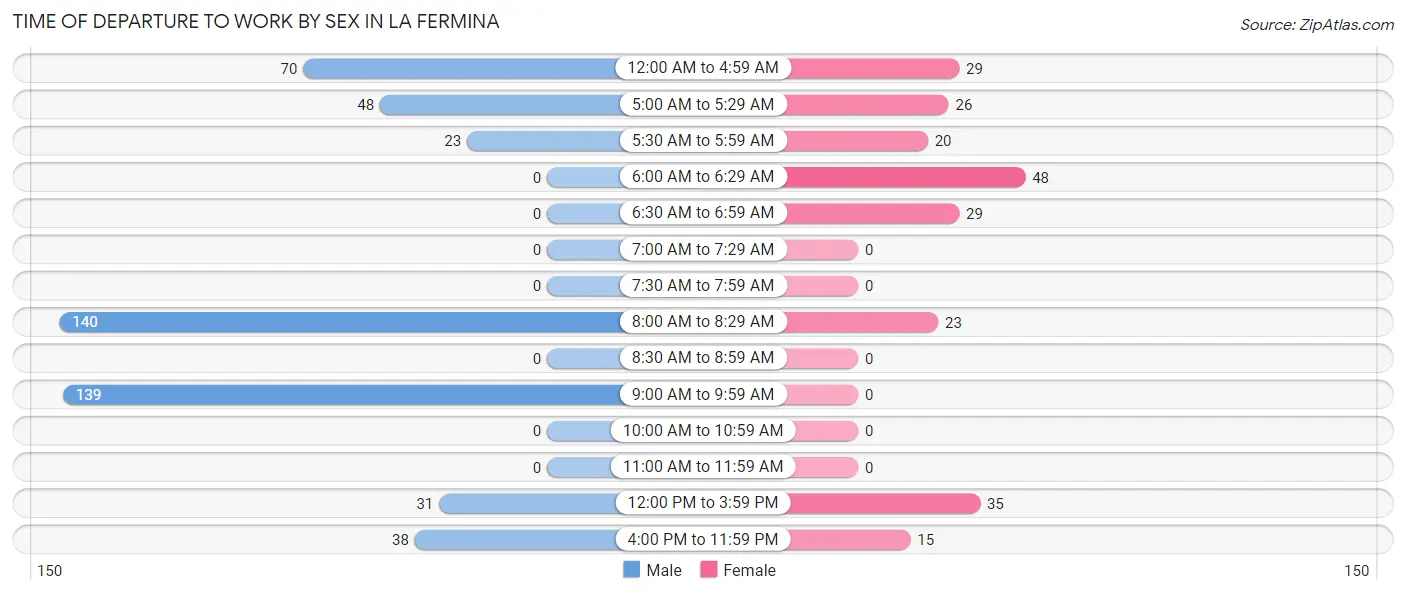
| Time of Departure | Male | Female |
| 12:00 AM to 4:59 AM | 70 (14.3%) | 29 (12.9%) |
| 5:00 AM to 5:29 AM | 48 (9.8%) | 26 (11.6%) |
| 5:30 AM to 5:59 AM | 23 (4.7%) | 20 (8.9%) |
| 6:00 AM to 6:29 AM | 0 (0.0%) | 48 (21.3%) |
| 6:30 AM to 6:59 AM | 0 (0.0%) | 29 (12.9%) |
| 7:00 AM to 7:29 AM | 0 (0.0%) | 0 (0.0%) |
| 7:30 AM to 7:59 AM | 0 (0.0%) | 0 (0.0%) |
| 8:00 AM to 8:29 AM | 140 (28.6%) | 23 (10.2%) |
| 8:30 AM to 8:59 AM | 0 (0.0%) | 0 (0.0%) |
| 9:00 AM to 9:59 AM | 139 (28.4%) | 0 (0.0%) |
| 10:00 AM to 10:59 AM | 0 (0.0%) | 0 (0.0%) |
| 11:00 AM to 11:59 AM | 0 (0.0%) | 0 (0.0%) |
| 12:00 PM to 3:59 PM | 31 (6.3%) | 35 (15.6%) |
| 4:00 PM to 11:59 PM | 38 (7.8%) | 15 (6.7%) |
| Total | 489 (100.0%) | 225 (100.0%) |
Housing Occupancy in La Fermina
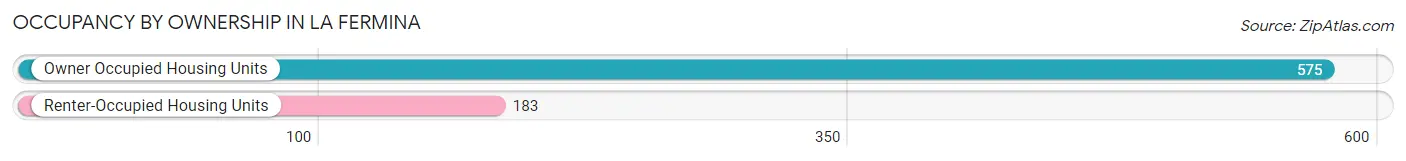
Occupancy by Ownership in La Fermina
Of the total 758 dwellings in La Fermina, owner-occupied units account for 575 (75.9%), while renter-occupied units make up 183 (24.1%).
| Occupancy | # Housing Units | % Housing Units |
| Owner Occupied Housing Units | 575 | 75.9% |
| Renter-Occupied Housing Units | 183 | 24.1% |
| Total Occupied Housing Units | 758 | 100.0% |
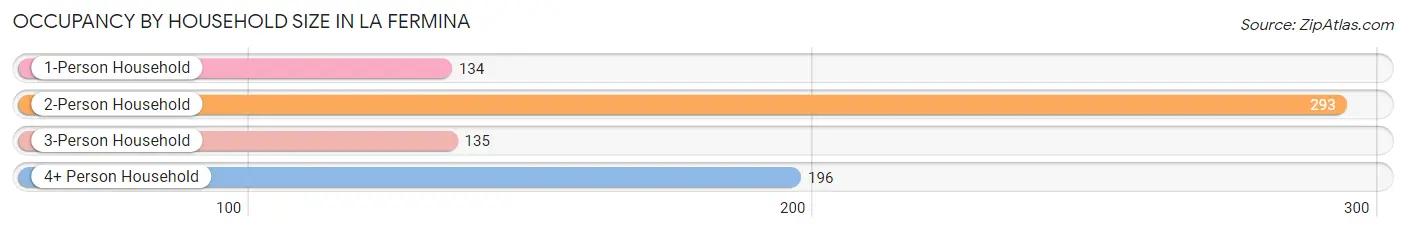
Occupancy by Household Size in La Fermina
| Household Size | # Housing Units | % Housing Units |
| 1-Person Household | 134 | 17.7% |
| 2-Person Household | 293 | 38.7% |
| 3-Person Household | 135 | 17.8% |
| 4+ Person Household | 196 | 25.9% |
| Total Housing Units | 758 | 100.0% |
Occupancy by Ownership by Household Size in La Fermina
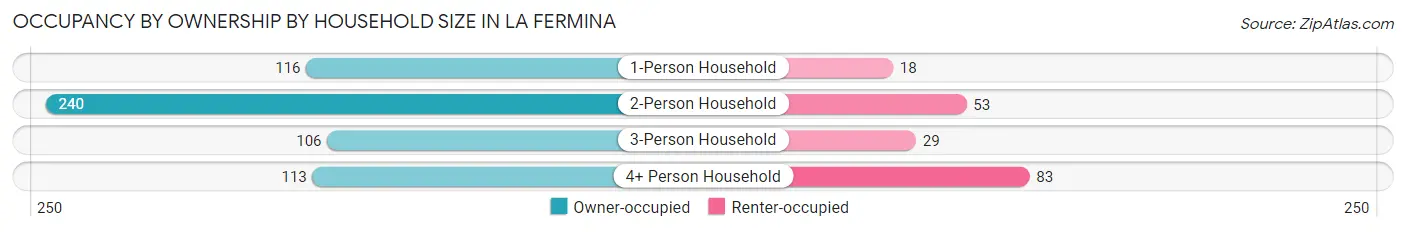
| Household Size | Owner-occupied | Renter-occupied |
| 1-Person Household | 116 (86.6%) | 18 (13.4%) |
| 2-Person Household | 240 (81.9%) | 53 (18.1%) |
| 3-Person Household | 106 (78.5%) | 29 (21.5%) |
| 4+ Person Household | 113 (57.7%) | 83 (42.3%) |
| Total Housing Units | 575 (75.9%) | 183 (24.1%) |
Occupancy by Educational Attainment in La Fermina
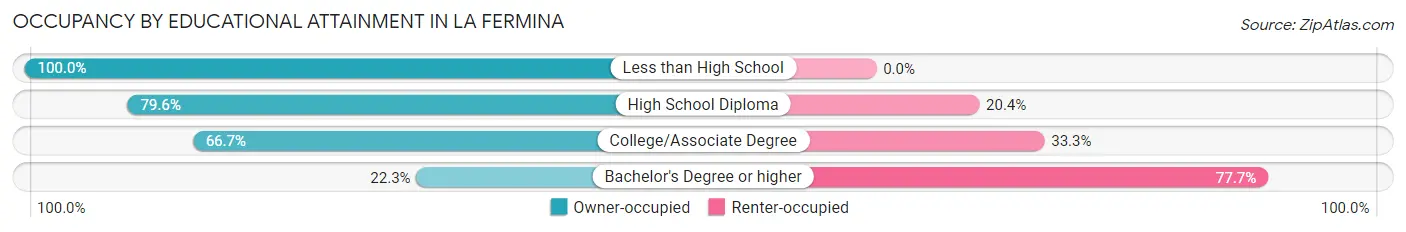
| Household Size | Owner-occupied | Renter-occupied |
| Less than High School | 225 (100.0%) | 0 (0.0%) |
| High School Diploma | 273 (79.6%) | 70 (20.4%) |
| College/Associate Degree | 52 (66.7%) | 26 (33.3%) |
| Bachelor's Degree or higher | 25 (22.3%) | 87 (77.7%) |
Occupancy by Age of Householder in La Fermina
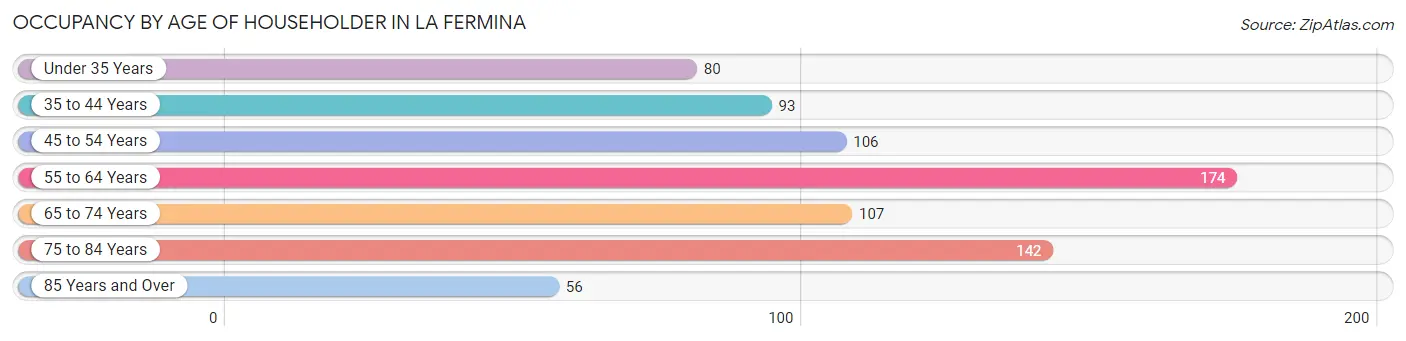
| Age Bracket | # Households | % Households |
| Under 35 Years | 80 | 10.5% |
| 35 to 44 Years | 93 | 12.3% |
| 45 to 54 Years | 106 | 14.0% |
| 55 to 64 Years | 174 | 23.0% |
| 65 to 74 Years | 107 | 14.1% |
| 75 to 84 Years | 142 | 18.7% |
| 85 Years and Over | 56 | 7.4% |
| Total | 758 | 100.0% |
Housing Finances in La Fermina
Median Income by Occupancy in La Fermina
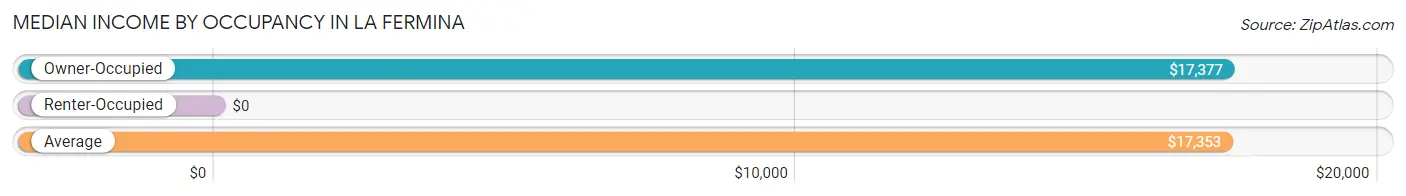
| Occupancy Type | # Households | Median Income |
| Owner-Occupied | 575 (75.9%) | $17,377 |
| Renter-Occupied | 183 (24.1%) | $0 |
| Average | 758 (100.0%) | $17,353 |
Occupancy by Householder Income Bracket in La Fermina
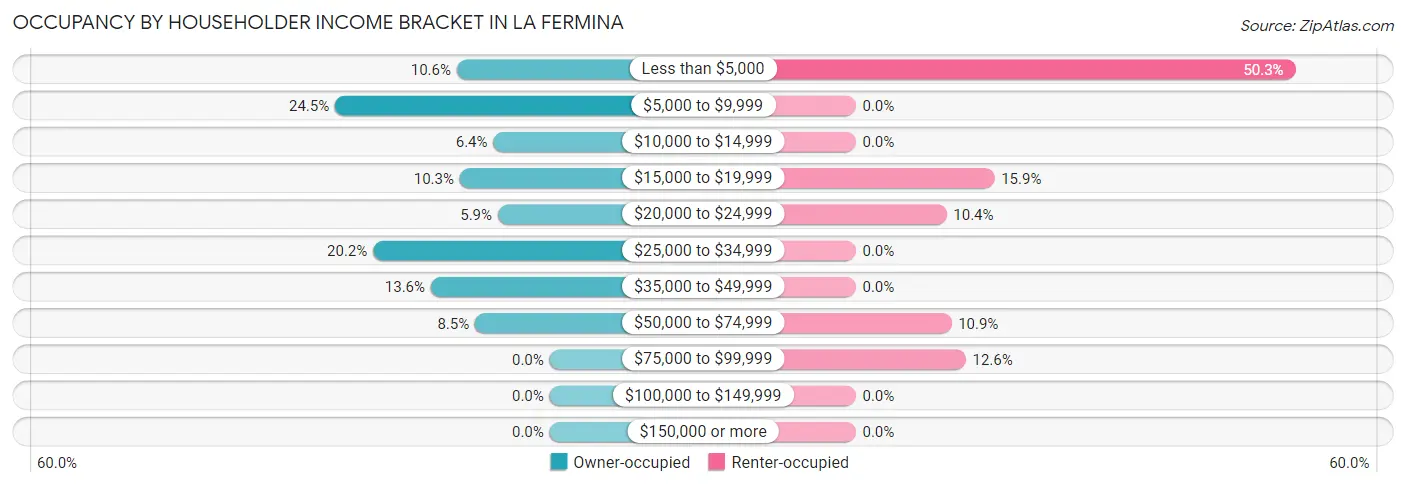
| Income Bracket | Owner-occupied | Renter-occupied |
| Less than $5,000 | 61 (10.6%) | 92 (50.3%) |
| $5,000 to $9,999 | 141 (24.5%) | 0 (0.0%) |
| $10,000 to $14,999 | 37 (6.4%) | 0 (0.0%) |
| $15,000 to $19,999 | 59 (10.3%) | 29 (15.9%) |
| $20,000 to $24,999 | 34 (5.9%) | 19 (10.4%) |
| $25,000 to $34,999 | 116 (20.2%) | 0 (0.0%) |
| $35,000 to $49,999 | 78 (13.6%) | 0 (0.0%) |
| $50,000 to $74,999 | 49 (8.5%) | 20 (10.9%) |
| $75,000 to $99,999 | 0 (0.0%) | 23 (12.6%) |
| $100,000 to $149,999 | 0 (0.0%) | 0 (0.0%) |
| $150,000 or more | 0 (0.0%) | 0 (0.0%) |
| Total | 575 (100.0%) | 183 (100.0%) |
Monthly Housing Cost Tiers in La Fermina
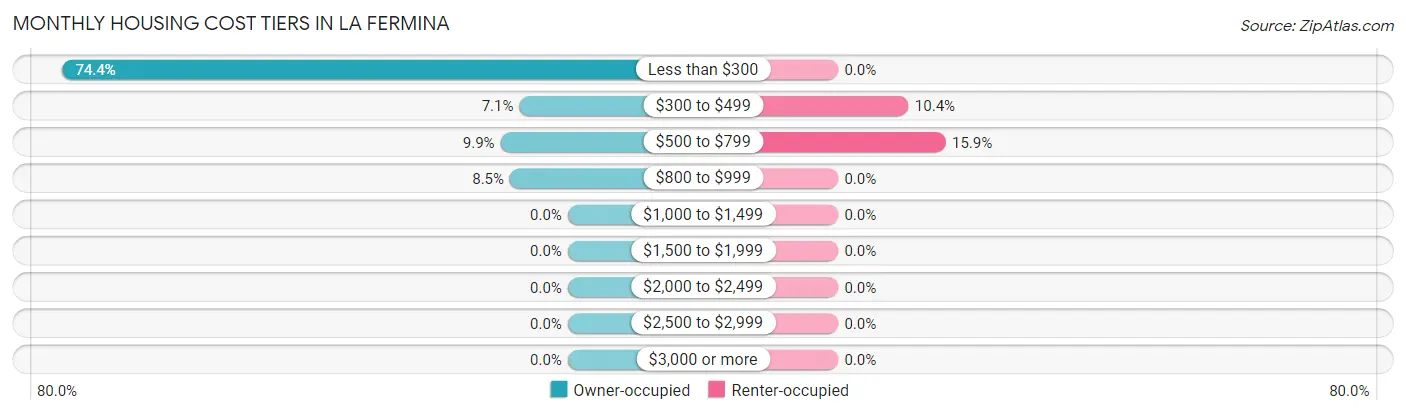
| Monthly Cost | Owner-occupied | Renter-occupied |
| Less than $300 | 428 (74.4%) | 0 (0.0%) |
| $300 to $499 | 41 (7.1%) | 19 (10.4%) |
| $500 to $799 | 57 (9.9%) | 29 (15.9%) |
| $800 to $999 | 49 (8.5%) | 0 (0.0%) |
| $1,000 to $1,499 | 0 (0.0%) | 0 (0.0%) |
| $1,500 to $1,999 | 0 (0.0%) | 0 (0.0%) |
| $2,000 to $2,499 | 0 (0.0%) | 0 (0.0%) |
| $2,500 to $2,999 | 0 (0.0%) | 0 (0.0%) |
| $3,000 or more | 0 (0.0%) | 0 (0.0%) |
| Total | 575 (100.0%) | 183 (100.0%) |
Physical Housing Characteristics in La Fermina
Housing Structures in La Fermina
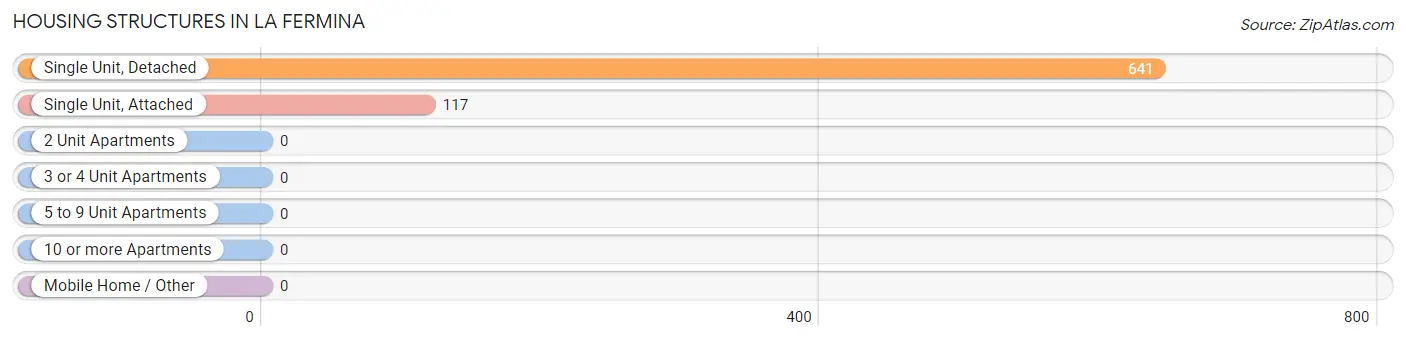
| Structure Type | # Housing Units | % Housing Units |
| Single Unit, Detached | 641 | 84.6% |
| Single Unit, Attached | 117 | 15.4% |
| 2 Unit Apartments | 0 | 0.0% |
| 3 or 4 Unit Apartments | 0 | 0.0% |
| 5 to 9 Unit Apartments | 0 | 0.0% |
| 10 or more Apartments | 0 | 0.0% |
| Mobile Home / Other | 0 | 0.0% |
| Total | 758 | 100.0% |
Housing Structures by Occupancy in La Fermina
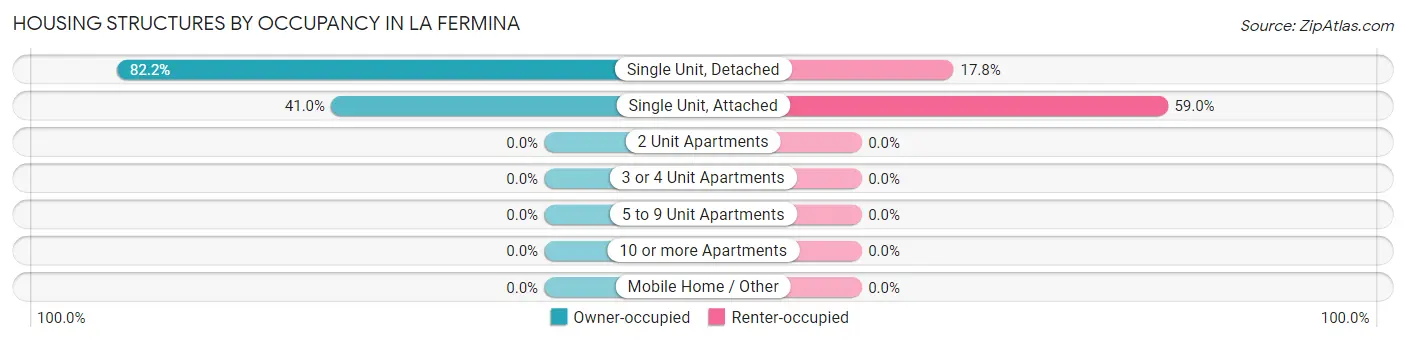
| Structure Type | Owner-occupied | Renter-occupied |
| Single Unit, Detached | 527 (82.2%) | 114 (17.8%) |
| Single Unit, Attached | 48 (41.0%) | 69 (59.0%) |
| 2 Unit Apartments | 0 (0.0%) | 0 (0.0%) |
| 3 or 4 Unit Apartments | 0 (0.0%) | 0 (0.0%) |
| 5 to 9 Unit Apartments | 0 (0.0%) | 0 (0.0%) |
| 10 or more Apartments | 0 (0.0%) | 0 (0.0%) |
| Mobile Home / Other | 0 (0.0%) | 0 (0.0%) |
| Total | 575 (75.9%) | 183 (24.1%) |
Housing Structures by Number of Rooms in La Fermina
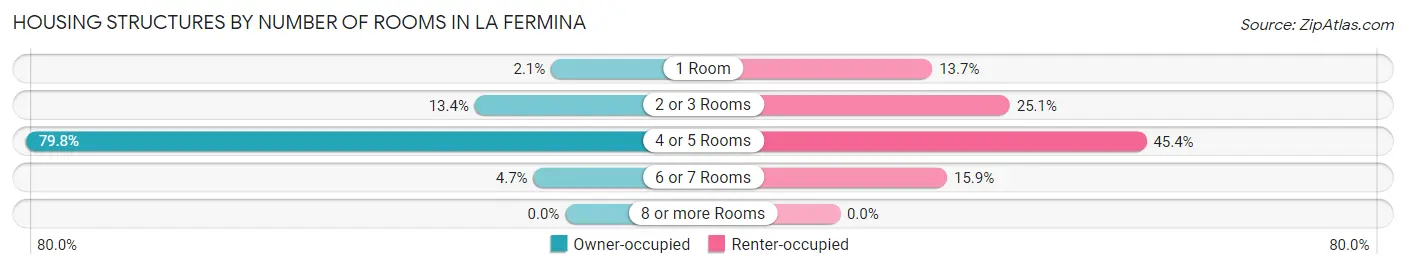
| Number of Rooms | Owner-occupied | Renter-occupied |
| 1 Room | 12 (2.1%) | 25 (13.7%) |
| 2 or 3 Rooms | 77 (13.4%) | 46 (25.1%) |
| 4 or 5 Rooms | 459 (79.8%) | 83 (45.4%) |
| 6 or 7 Rooms | 27 (4.7%) | 29 (15.9%) |
| 8 or more Rooms | 0 (0.0%) | 0 (0.0%) |
| Total | 575 (100.0%) | 183 (100.0%) |
Housing Structure by Heating Type in La Fermina
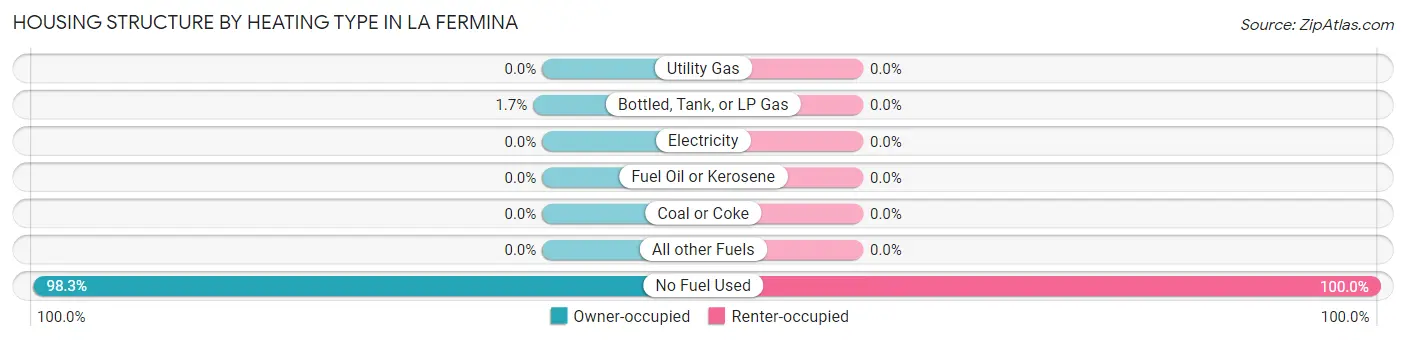
| Heating Type | Owner-occupied | Renter-occupied |
| Utility Gas | 0 (0.0%) | 0 (0.0%) |
| Bottled, Tank, or LP Gas | 10 (1.7%) | 0 (0.0%) |
| Electricity | 0 (0.0%) | 0 (0.0%) |
| Fuel Oil or Kerosene | 0 (0.0%) | 0 (0.0%) |
| Coal or Coke | 0 (0.0%) | 0 (0.0%) |
| All other Fuels | 0 (0.0%) | 0 (0.0%) |
| No Fuel Used | 565 (98.3%) | 183 (100.0%) |
| Total | 575 (100.0%) | 183 (100.0%) |
Household Vehicle Usage in La Fermina
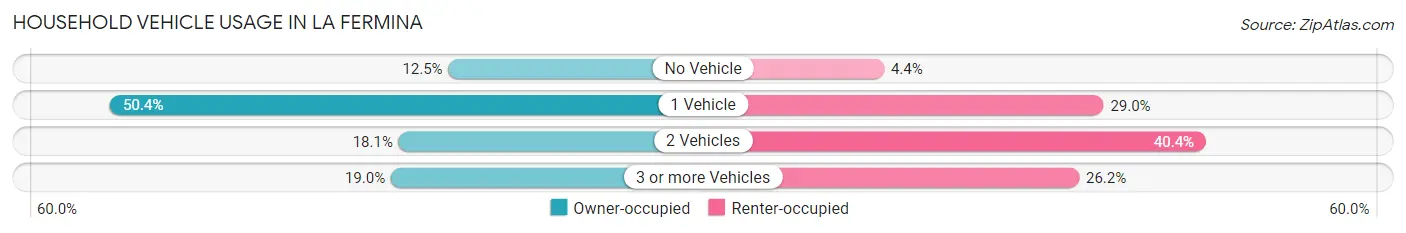
| Vehicles per Household | Owner-occupied | Renter-occupied |
| No Vehicle | 72 (12.5%) | 8 (4.4%) |
| 1 Vehicle | 290 (50.4%) | 53 (29.0%) |
| 2 Vehicles | 104 (18.1%) | 74 (40.4%) |
| 3 or more Vehicles | 109 (19.0%) | 48 (26.2%) |
| Total | 575 (100.0%) | 183 (100.0%) |
Real Estate & Mortgages in La Fermina
Real Estate and Mortgage Overview in La Fermina
| Characteristic | Without Mortgage | With Mortgage |
| Housing Units | 447 | 128 |
| Median Property Value | $94,200 | $107,700 |
| Median Household Income | $16,005 | $0 |
| Monthly Housing Costs | $166 | $0 |
| Real Estate Taxes | - | - |
Property Value by Mortgage Status in La Fermina
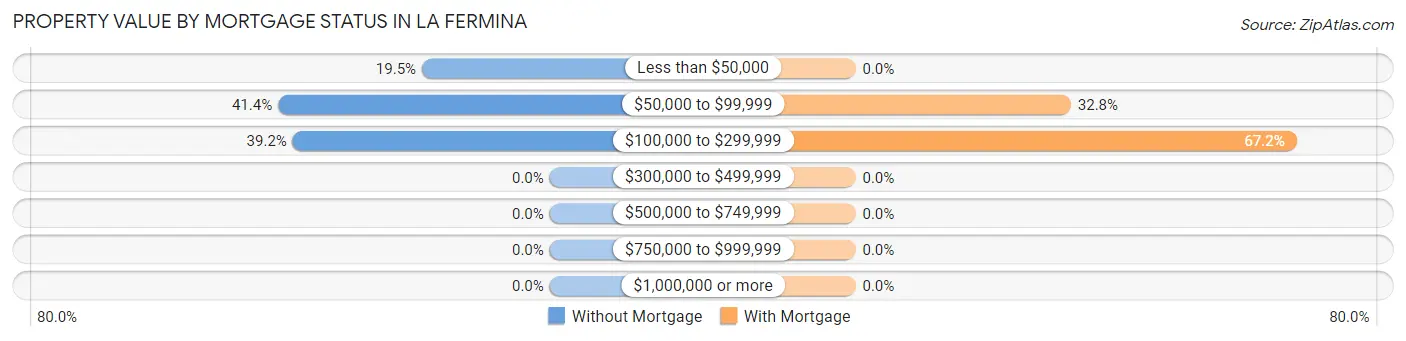
| Property Value | Without Mortgage | With Mortgage |
| Less than $50,000 | 87 (19.5%) | 0 (0.0%) |
| $50,000 to $99,999 | 185 (41.4%) | 42 (32.8%) |
| $100,000 to $299,999 | 175 (39.2%) | 86 (67.2%) |
| $300,000 to $499,999 | 0 (0.0%) | 0 (0.0%) |
| $500,000 to $749,999 | 0 (0.0%) | 0 (0.0%) |
| $750,000 to $999,999 | 0 (0.0%) | 0 (0.0%) |
| $1,000,000 or more | 0 (0.0%) | 0 (0.0%) |
| Total | 447 (100.0%) | 128 (100.0%) |
Household Income by Mortgage Status in La Fermina
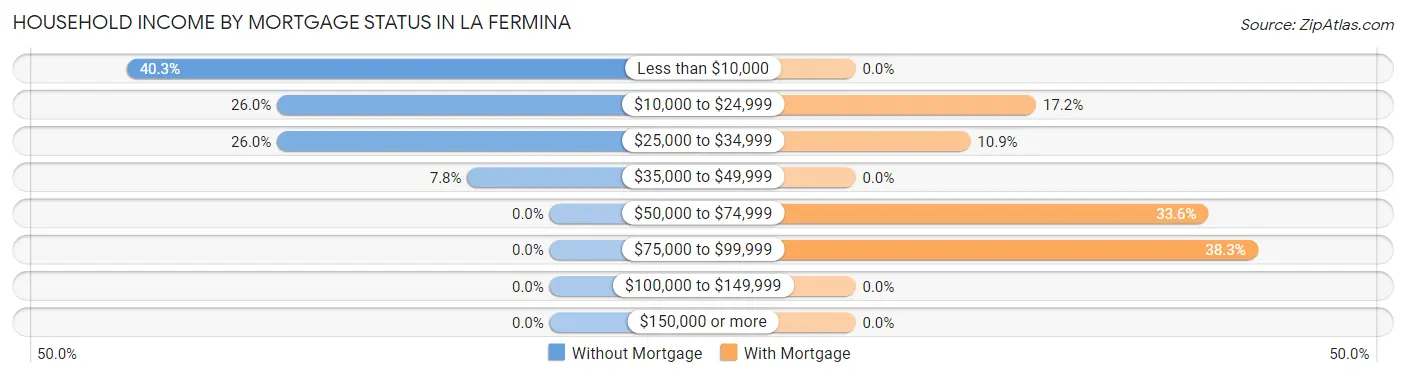
| Household Income | Without Mortgage | With Mortgage |
| Less than $10,000 | 180 (40.3%) | 0 (0.0%) |
| $10,000 to $24,999 | 116 (26.0%) | 22 (17.2%) |
| $25,000 to $34,999 | 116 (26.0%) | 14 (10.9%) |
| $35,000 to $49,999 | 35 (7.8%) | 0 (0.0%) |
| $50,000 to $74,999 | 0 (0.0%) | 43 (33.6%) |
| $75,000 to $99,999 | 0 (0.0%) | 49 (38.3%) |
| $100,000 to $149,999 | 0 (0.0%) | 0 (0.0%) |
| $150,000 or more | 0 (0.0%) | 0 (0.0%) |
| Total | 447 (100.0%) | 128 (100.0%) |
Property Value to Household Income Ratio in La Fermina
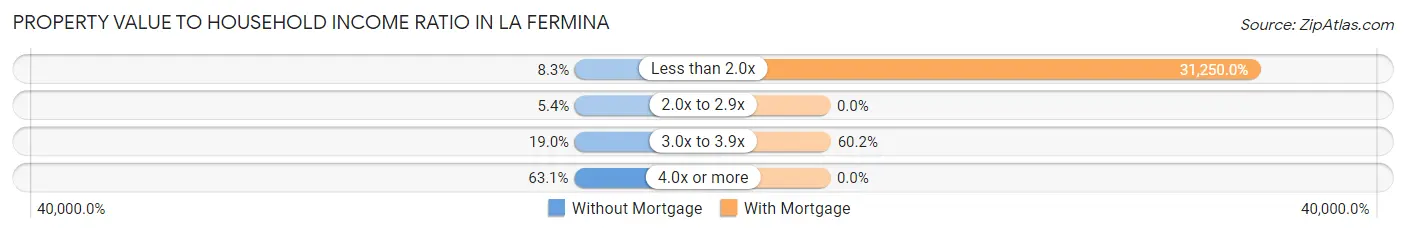
| Value-to-Income Ratio | Without Mortgage | With Mortgage |
| Less than 2.0x | 37 (8.3%) | 40,000 (31,250.0%) |
| 2.0x to 2.9x | 24 (5.4%) | 0 (0.0%) |
| 3.0x to 3.9x | 85 (19.0%) | 77 (60.2%) |
| 4.0x or more | 282 (63.1%) | 0 (0.0%) |
| Total | 447 (100.0%) | 128 (100.0%) |
Real Estate Taxes by Mortgage Status in La Fermina
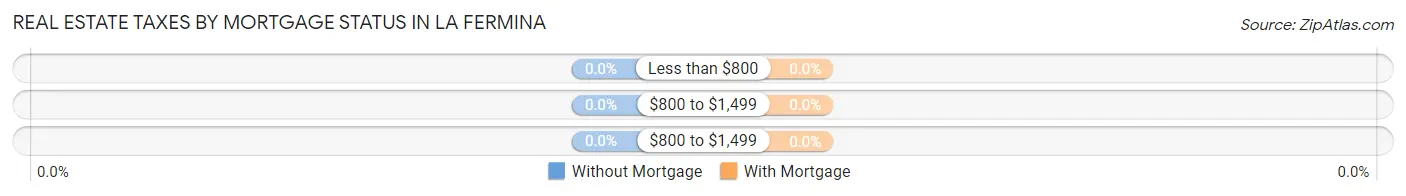
| Property Taxes | Without Mortgage | With Mortgage |
| Less than $800 | 0 (0.0%) | 0 (0.0%) |
| $800 to $1,499 | 0 (0.0%) | 0 (0.0%) |
| $800 to $1,499 | 0 (0.0%) | 0 (0.0%) |
| Total | 447 (100.0%) | 128 (100.0%) |
Health & Disability in La Fermina
Health Insurance Coverage by Age in La Fermina
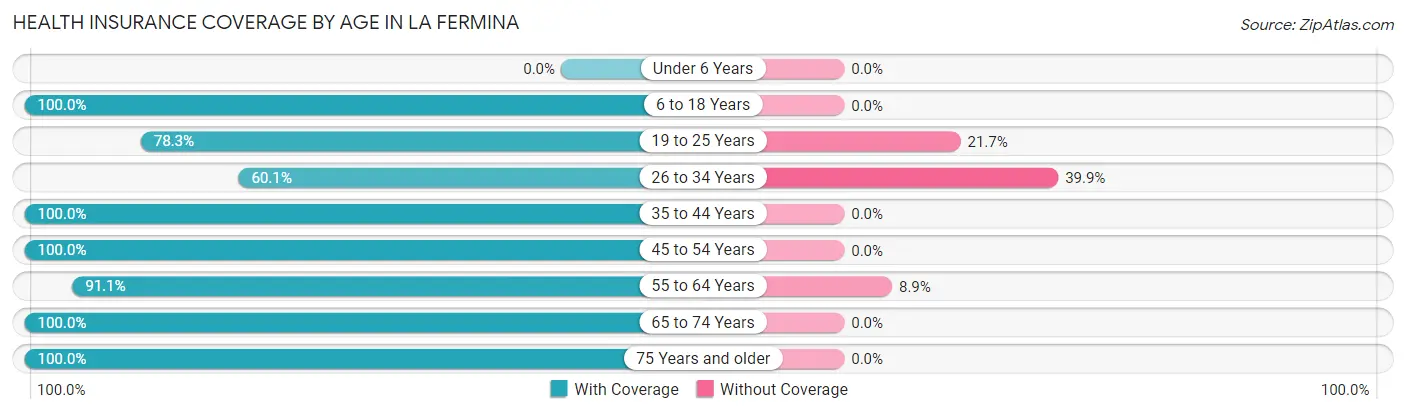
| Age Bracket | With Coverage | Without Coverage |
| Under 6 Years | 0 (0.0%) | 0 (0.0%) |
| 6 to 18 Years | 338 (100.0%) | 0 (0.0%) |
| 19 to 25 Years | 307 (78.3%) | 85 (21.7%) |
| 26 to 34 Years | 226 (60.1%) | 150 (39.9%) |
| 35 to 44 Years | 201 (100.0%) | 0 (0.0%) |
| 45 to 54 Years | 200 (100.0%) | 0 (0.0%) |
| 55 to 64 Years | 266 (91.1%) | 26 (8.9%) |
| 65 to 74 Years | 202 (100.0%) | 0 (0.0%) |
| 75 Years and older | 333 (100.0%) | 0 (0.0%) |
| Total | 2,073 (88.8%) | 261 (11.2%) |
Health Insurance Coverage by Citizenship Status in La Fermina
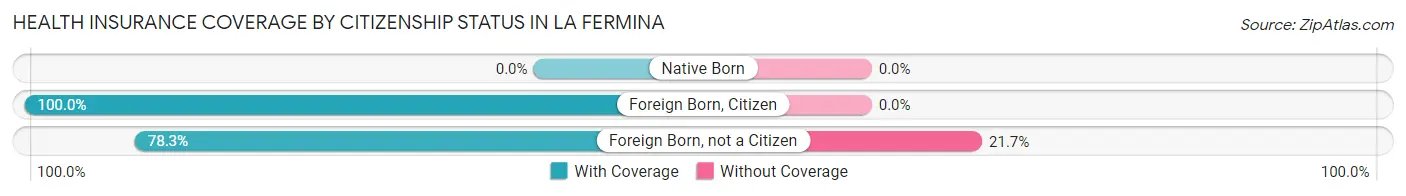
| Citizenship Status | With Coverage | Without Coverage |
| Native Born | 0 (0.0%) | 0 (0.0%) |
| Foreign Born, Citizen | 338 (100.0%) | 0 (0.0%) |
| Foreign Born, not a Citizen | 307 (78.3%) | 85 (21.7%) |
Health Insurance Coverage by Household Income in La Fermina
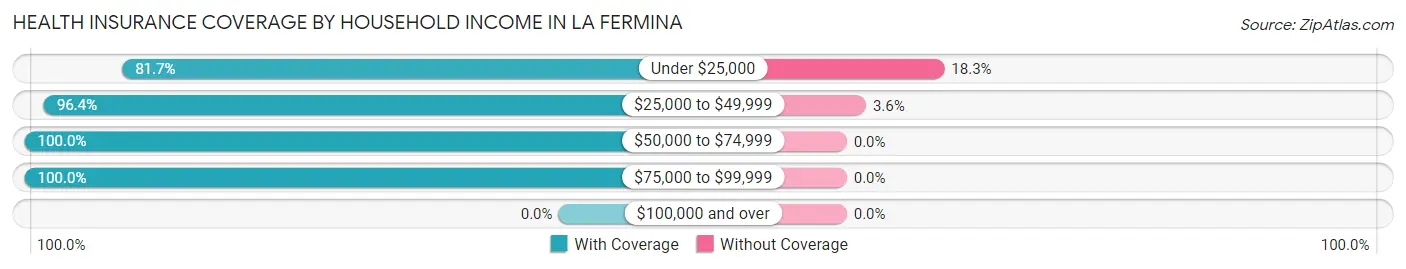
| Household Income | With Coverage | Without Coverage |
| Under $25,000 | 1,059 (81.7%) | 237 (18.3%) |
| $25,000 to $49,999 | 642 (96.4%) | 24 (3.6%) |
| $50,000 to $74,999 | 243 (100.0%) | 0 (0.0%) |
| $75,000 to $99,999 | 125 (100.0%) | 0 (0.0%) |
| $100,000 and over | 0 (0.0%) | 0 (0.0%) |
Public vs Private Health Insurance Coverage by Age in La Fermina
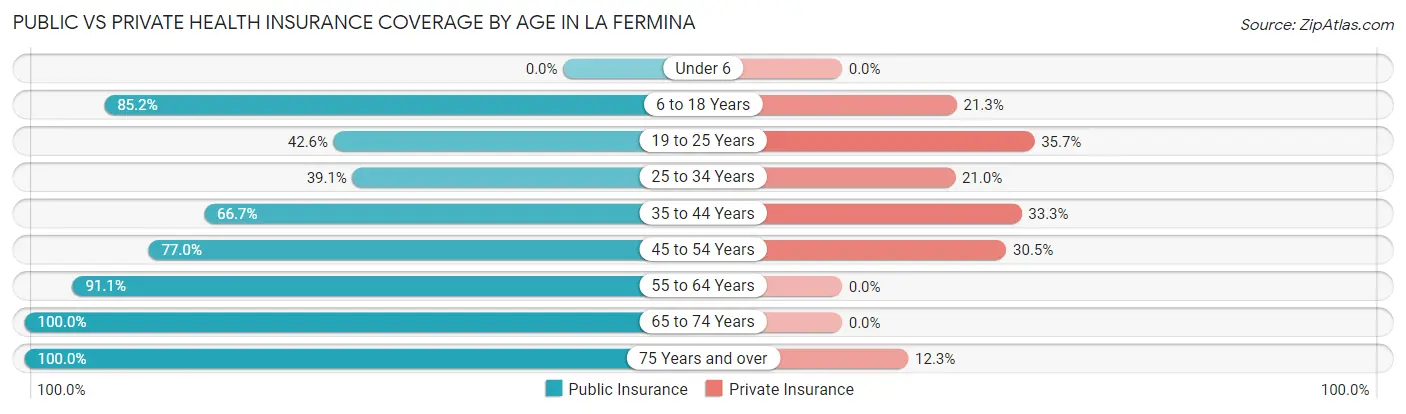
| Age Bracket | Public Insurance | Private Insurance |
| Under 6 | 0 (0.0%) | 0 (0.0%) |
| 6 to 18 Years | 288 (85.2%) | 72 (21.3%) |
| 19 to 25 Years | 167 (42.6%) | 140 (35.7%) |
| 25 to 34 Years | 147 (39.1%) | 79 (21.0%) |
| 35 to 44 Years | 134 (66.7%) | 67 (33.3%) |
| 45 to 54 Years | 154 (77.0%) | 61 (30.5%) |
| 55 to 64 Years | 266 (91.1%) | 0 (0.0%) |
| 65 to 74 Years | 202 (100.0%) | 0 (0.0%) |
| 75 Years and over | 333 (100.0%) | 41 (12.3%) |
| Total | 1,691 (72.5%) | 460 (19.7%) |
Disability Status by Sex by Age in La Fermina
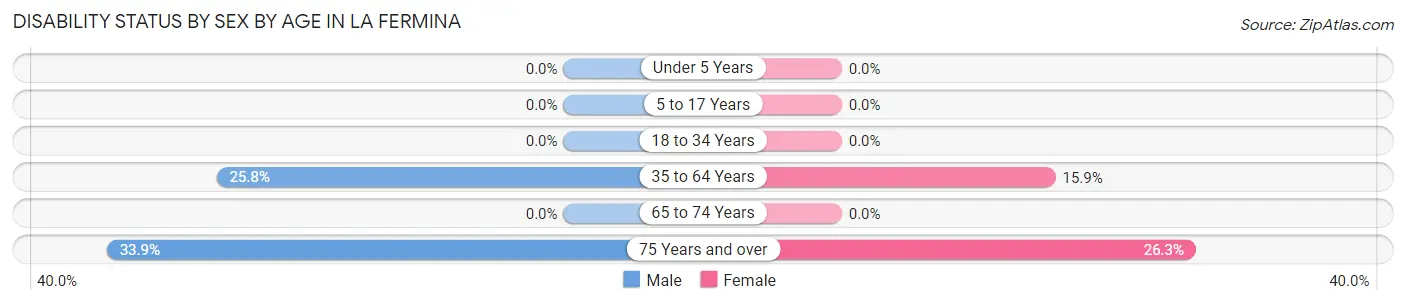
| Age Bracket | Male | Female |
| Under 5 Years | 0 (0.0%) | 0 (0.0%) |
| 5 to 17 Years | 0 (0.0%) | 0 (0.0%) |
| 18 to 34 Years | 0 (0.0%) | 0 (0.0%) |
| 35 to 64 Years | 60 (25.8%) | 73 (15.9%) |
| 65 to 74 Years | 0 (0.0%) | 0 (0.0%) |
| 75 Years and over | 60 (33.9%) | 41 (26.3%) |
Disability Class by Sex by Age in La Fermina
Disability Class: Hearing Difficulty
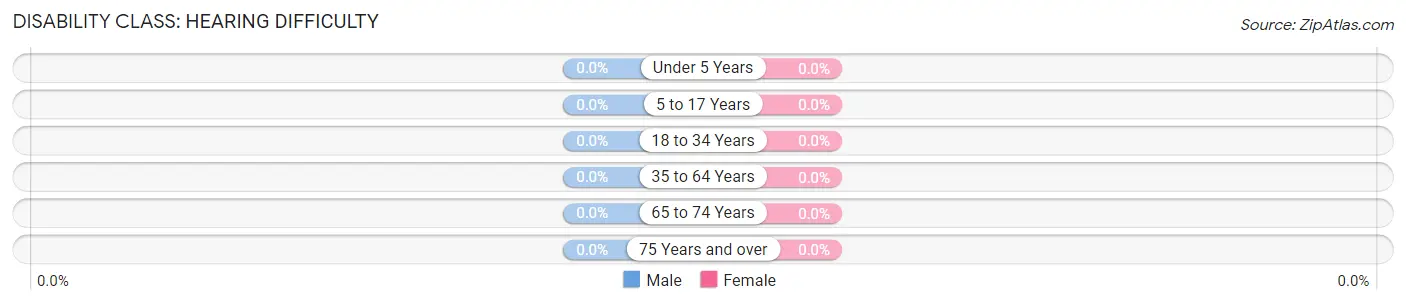
| Age Bracket | Male | Female |
| Under 5 Years | 0 (0.0%) | 0 (0.0%) |
| 5 to 17 Years | 0 (0.0%) | 0 (0.0%) |
| 18 to 34 Years | 0 (0.0%) | 0 (0.0%) |
| 35 to 64 Years | 0 (0.0%) | 0 (0.0%) |
| 65 to 74 Years | 0 (0.0%) | 0 (0.0%) |
| 75 Years and over | 0 (0.0%) | 0 (0.0%) |
Disability Class: Vision Difficulty
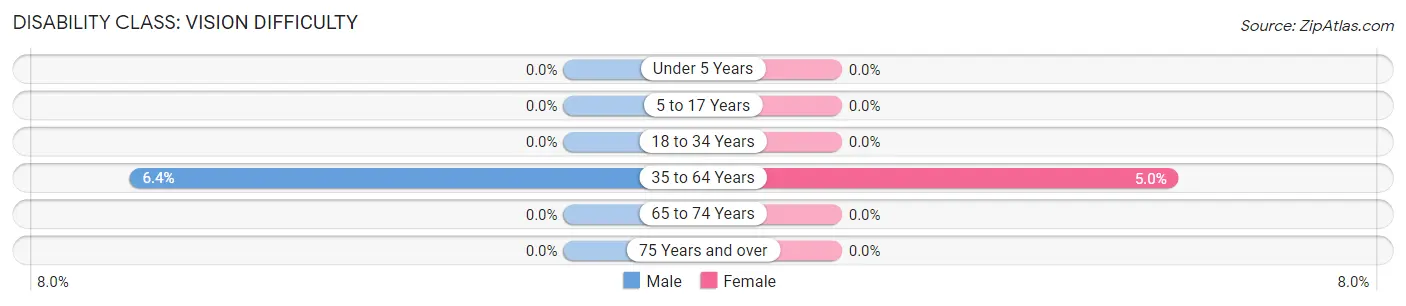
| Age Bracket | Male | Female |
| Under 5 Years | 0 (0.0%) | 0 (0.0%) |
| 5 to 17 Years | 0 (0.0%) | 0 (0.0%) |
| 18 to 34 Years | 0 (0.0%) | 0 (0.0%) |
| 35 to 64 Years | 15 (6.4%) | 23 (5.0%) |
| 65 to 74 Years | 0 (0.0%) | 0 (0.0%) |
| 75 Years and over | 0 (0.0%) | 0 (0.0%) |
Disability Class: Cognitive Difficulty
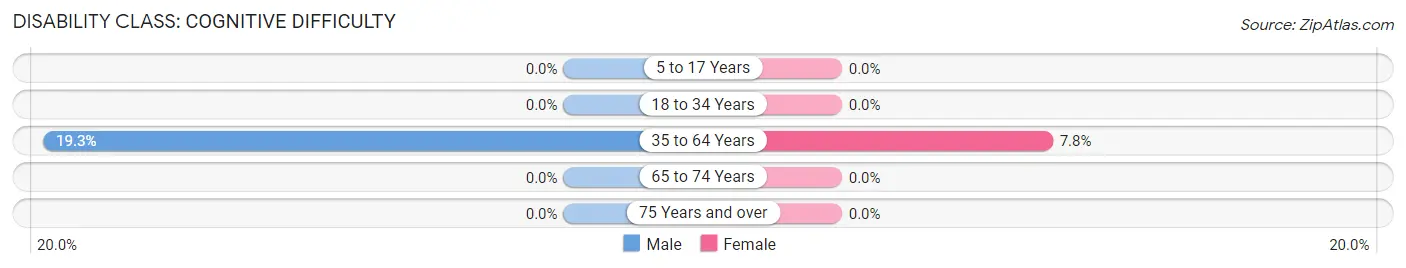
| Age Bracket | Male | Female |
| 5 to 17 Years | 0 (0.0%) | 0 (0.0%) |
| 18 to 34 Years | 0 (0.0%) | 0 (0.0%) |
| 35 to 64 Years | 45 (19.3%) | 36 (7.8%) |
| 65 to 74 Years | 0 (0.0%) | 0 (0.0%) |
| 75 Years and over | 0 (0.0%) | 0 (0.0%) |
Disability Class: Ambulatory Difficulty
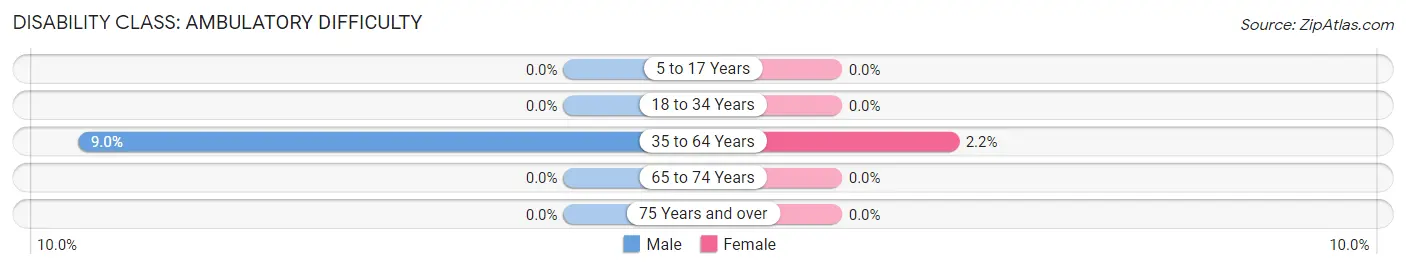
| Age Bracket | Male | Female |
| 5 to 17 Years | 0 (0.0%) | 0 (0.0%) |
| 18 to 34 Years | 0 (0.0%) | 0 (0.0%) |
| 35 to 64 Years | 21 (9.0%) | 10 (2.2%) |
| 65 to 74 Years | 0 (0.0%) | 0 (0.0%) |
| 75 Years and over | 0 (0.0%) | 0 (0.0%) |
Disability Class: Self-Care Difficulty
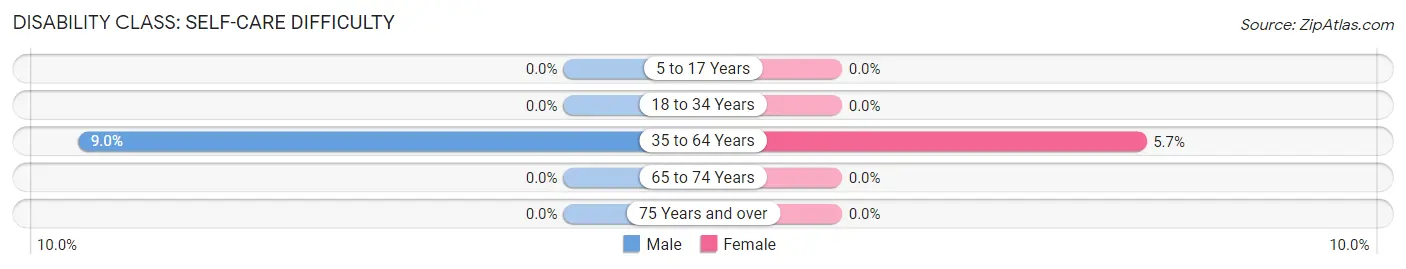
| Age Bracket | Male | Female |
| 5 to 17 Years | 0 (0.0%) | 0 (0.0%) |
| 18 to 34 Years | 0 (0.0%) | 0 (0.0%) |
| 35 to 64 Years | 21 (9.0%) | 26 (5.7%) |
| 65 to 74 Years | 0 (0.0%) | 0 (0.0%) |
| 75 Years and over | 0 (0.0%) | 0 (0.0%) |
Technology Access in La Fermina
Computing Device Access in La Fermina
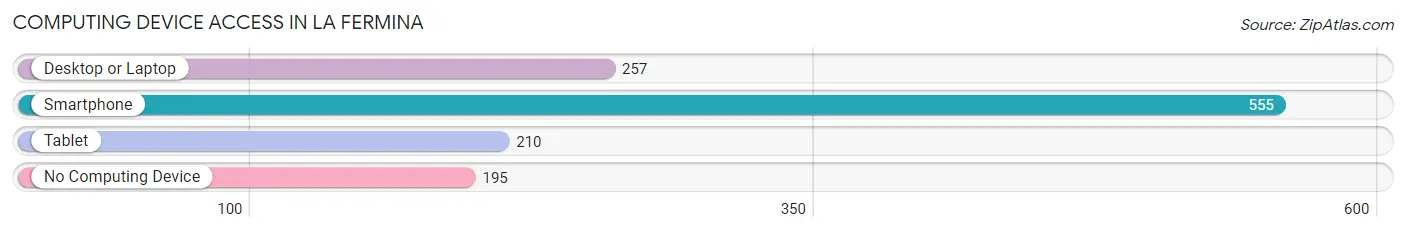
| Device Type | # Households | % Households |
| Desktop or Laptop | 257 | 33.9% |
| Smartphone | 555 | 73.2% |
| Tablet | 210 | 27.7% |
| No Computing Device | 195 | 25.7% |
| Total | 758 | 100.0% |
Internet Access in La Fermina
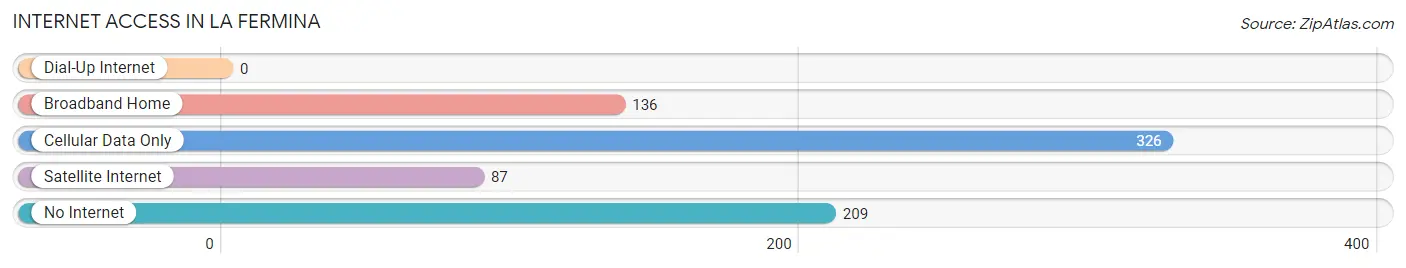
| Internet Type | # Households | % Households |
| Dial-Up Internet | 0 | 0.0% |
| Broadband Home | 136 | 17.9% |
| Cellular Data Only | 326 | 43.0% |
| Satellite Internet | 87 | 11.5% |
| No Internet | 209 | 27.6% |
| Total | 758 | 100.0% |
La Fermina Summary
Fermina is a small municipality located in the northern region of Puerto Rico. It is part of the San Juan-Caguas-Guaynabo Metropolitan Statistical Area. The municipality is located in the northern part of the island, in the foothills of the Cordillera Central mountain range. It is bordered by the municipalities of San Sebastián, Las Marías, and Lares.
History
Fermina was founded in 1820 by Don Fermín de la Cruz, a Spanish soldier who was stationed in the area. The town was named after him. The town was originally part of the municipality of San Sebastián, but it was separated in 1845 and became an independent municipality.
Geography
Fermina is located in the northern region of Puerto Rico, in the foothills of the Cordillera Central mountain range. It is bordered by the municipalities of San Sebastián, Las Marías, and Lares. The municipality has a total area of 11.3 square miles (29.3 km2). The terrain is mostly mountainous, with some flat areas in the lower elevations. The highest point in the municipality is Cerro de la Cruz, which has an elevation of 1,845 feet (562 m).
Economy
The economy of Fermina is largely based on agriculture. The main crops grown in the area are coffee, plantains, bananas, and sugarcane. Livestock farming is also an important part of the economy, with cattle, pigs, and goats being raised in the area.
The municipality also has some light industry, including a few small factories that produce clothing and furniture. Tourism is also an important part of the economy, with many visitors coming to the area to enjoy the natural beauty of the mountains and the nearby beaches.
Demographics
As of the 2010 census, Fermina had a population of 8,845. The population is mostly of mixed European and African descent. The median household income in the municipality is $14,845, and the median age is 37.5 years.
The majority of the population is Roman Catholic (90.3%), with a small percentage of other religions, including Protestantism (4.2%), Jehovah's Witnesses (2.2%), and other religions (3.3%). Spanish is the primary language spoken in the municipality, with English being the second most common language.
Conclusion
Fermina is a small municipality located in the northern region of Puerto Rico. It is part of the San Juan-Caguas-Guaynabo Metropolitan Statistical Area. The municipality is mostly mountainous, with some flat areas in the lower elevations. The economy is largely based on agriculture, with some light industry and tourism. The population is mostly of mixed European and African descent, and the majority of the population is Roman Catholic.
Common Questions
What is Per Capita Income in La Fermina?
Per Capita income in La Fermina is $8,704.
What is the Median Family Income in La Fermina?
Median Family Income in La Fermina is $23,255.
What is the Median Household income in La Fermina?
Median Household Income in La Fermina is $17,353.
What is Income or Wage Gap in La Fermina?
Income or Wage Gap in La Fermina is 71.0%.
Women in La Fermina earn 29.0 cents for every dollar earned by a man.
What is Inequality or Gini Index in La Fermina?
Inequality or Gini Index in La Fermina is 0.48.
What is the Total Population of La Fermina?
Total Population of La Fermina is 2,336.
What is the Total Male Population of La Fermina?
Total Male Population of La Fermina is 1,217.
What is the Total Female Population of La Fermina?
Total Female Population of La Fermina is 1,119.
What is the Ratio of Males per 100 Females in La Fermina?
There are 108.76 Males per 100 Females in La Fermina.
What is the Ratio of Females per 100 Males in La Fermina?
There are 91.95 Females per 100 Males in La Fermina.
What is the Median Population Age in La Fermina?
Median Population Age in La Fermina is 37.6 Years.
What is the Average Family Size in La Fermina
Average Family Size in La Fermina is 3.4 People.
What is the Average Household Size in La Fermina
Average Household Size in La Fermina is 3.1 People.
How Large is the Labor Force in La Fermina?
There are 857 People in the Labor Forcein in La Fermina.
What is the Percentage of People in the Labor Force in La Fermina?
40.2% of People are in the Labor Force in La Fermina.
What is the Unemployment Rate in La Fermina?
Unemployment Rate in La Fermina is 16.6%.