Los Llanos, PR Map & Demographics
Los Llanos Map
Los Llanos Overview
$9,467
PER CAPITA INCOME
$22,981
AVG FAMILY INCOME
$13,811
AVG HOUSEHOLD INCOME
59.2%
WAGE / INCOME GAP [ % ]
40.8¢/ $1
WAGE / INCOME GAP [ $ ]
0.47
INEQUALITY / GINI INDEX
1,916
TOTAL POPULATION
869
MALE POPULATION
1,047
FEMALE POPULATION
83.00
MALES / 100 FEMALES
120.48
FEMALES / 100 MALES
50.2
MEDIAN AGE
3.5
AVG FAMILY SIZE
2.8
AVG HOUSEHOLD SIZE
480
LABOR FORCE [ PEOPLE ]
29.3%
PERCENT IN LABOR FORCE
Income in Los Llanos
Income Overview in Los Llanos
Per Capita Income in Los Llanos is $9,467, while median incomes of families and households are $22,981 and $13,811 respectively.
| Characteristic | Number | Measure |
| Per Capita Income | 1,916 | $9,467 |
| Median Family Income | 433 | $22,981 |
| Mean Family Income | 433 | $30,975 |
| Median Household Income | 685 | $13,811 |
| Mean Household Income | 685 | $24,793 |
| Income Deficit | 433 | $0 |
| Wage / Income Gap (%) | 1,916 | 59.19% |
| Wage / Income Gap ($) | 1,916 | 40.81¢ per $1 |
| Gini / Inequality Index | 1,916 | 0.47 |
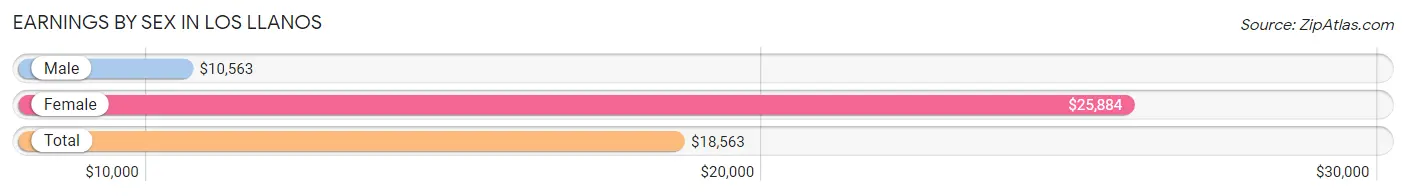
Earnings by Sex in Los Llanos
Average Earnings in Los Llanos are $18,563, $10,563 for men and $25,884 for women, a difference of 59.2%.
| Sex | Number | Average Earnings |
| Male | 278 (58.0%) | $10,563 |
| Female | 201 (42.0%) | $25,884 |
| Total | 479 (100.0%) | $18,563 |
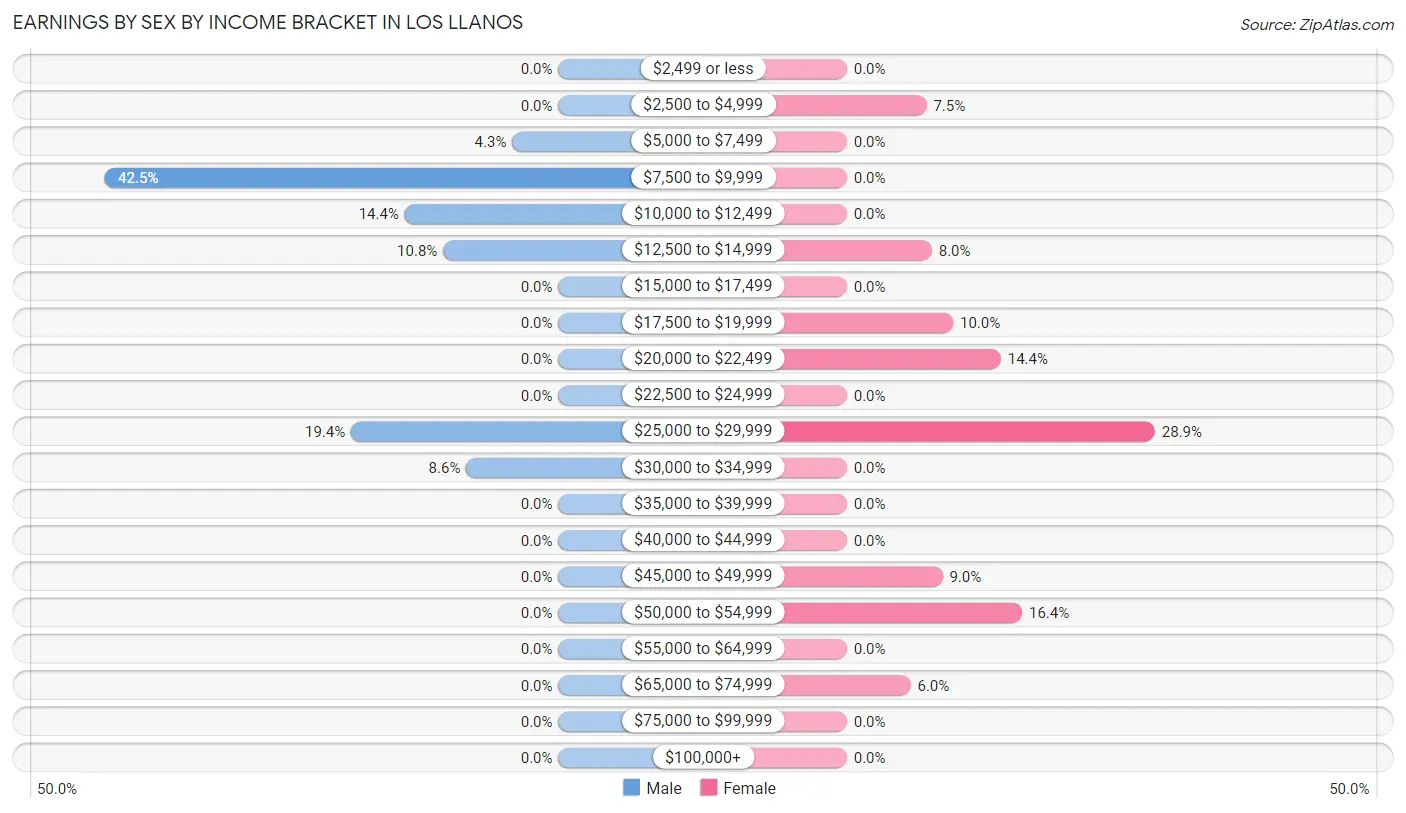
Earnings by Sex by Income Bracket in Los Llanos
The most common earnings brackets in Los Llanos are $7,500 to $9,999 for men (118 | 42.4%) and $25,000 to $29,999 for women (58 | 28.9%).
| Income | Male | Female |
| $2,499 or less | 0 (0.0%) | 0 (0.0%) |
| $2,500 to $4,999 | 0 (0.0%) | 15 (7.5%) |
| $5,000 to $7,499 | 12 (4.3%) | 0 (0.0%) |
| $7,500 to $9,999 | 118 (42.4%) | 0 (0.0%) |
| $10,000 to $12,499 | 40 (14.4%) | 0 (0.0%) |
| $12,500 to $14,999 | 30 (10.8%) | 16 (8.0%) |
| $15,000 to $17,499 | 0 (0.0%) | 0 (0.0%) |
| $17,500 to $19,999 | 0 (0.0%) | 20 (10.0%) |
| $20,000 to $22,499 | 0 (0.0%) | 29 (14.4%) |
| $22,500 to $24,999 | 0 (0.0%) | 0 (0.0%) |
| $25,000 to $29,999 | 54 (19.4%) | 58 (28.9%) |
| $30,000 to $34,999 | 24 (8.6%) | 0 (0.0%) |
| $35,000 to $39,999 | 0 (0.0%) | 0 (0.0%) |
| $40,000 to $44,999 | 0 (0.0%) | 0 (0.0%) |
| $45,000 to $49,999 | 0 (0.0%) | 18 (9.0%) |
| $50,000 to $54,999 | 0 (0.0%) | 33 (16.4%) |
| $55,000 to $64,999 | 0 (0.0%) | 0 (0.0%) |
| $65,000 to $74,999 | 0 (0.0%) | 12 (6.0%) |
| $75,000 to $99,999 | 0 (0.0%) | 0 (0.0%) |
| $100,000+ | 0 (0.0%) | 0 (0.0%) |
| Total | 278 (100.0%) | 201 (100.0%) |
Earnings by Sex by Educational Attainment in Los Llanos
| Educational Attainment | Male Income | Female Income |
| Less than High School | - | - |
| High School Diploma | - | - |
| College or Associate's Degree | - | - |
| Bachelor's Degree | - | - |
| Graduate Degree | - | - |
| Total | $10,938 | $26,207 |
Family Income in Los Llanos
Family Income Brackets in Los Llanos
According to the Los Llanos family income data, there are 88 families falling into the $15,000 to $24,999 income range, which is the most common income bracket and makes up 20.3% of all families.
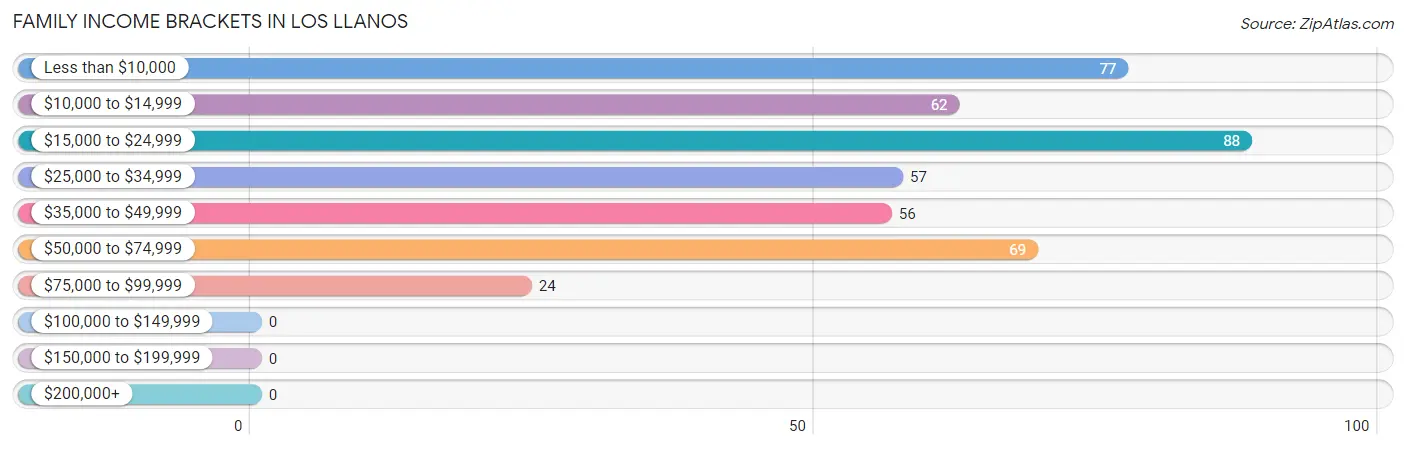
| Income Bracket | # Families | % Families |
| Less than $10,000 | 77 | 17.8% |
| $10,000 to $14,999 | 62 | 14.3% |
| $15,000 to $24,999 | 88 | 20.3% |
| $25,000 to $34,999 | 57 | 13.2% |
| $35,000 to $49,999 | 56 | 12.9% |
| $50,000 to $74,999 | 69 | 15.9% |
| $75,000 to $99,999 | 24 | 5.5% |
| $100,000 to $149,999 | 0 | 0.0% |
| $150,000 to $199,999 | 0 | 0.0% |
| $200,000+ | 0 | 0.0% |
Family Income by Famaliy Size in Los Llanos
2-person families (198 | 45.7%) account for the highest median family income in Los Llanos with $33,110 per family, while 2-person families (198 | 45.7%) have the highest median income of $16,555 per family member.
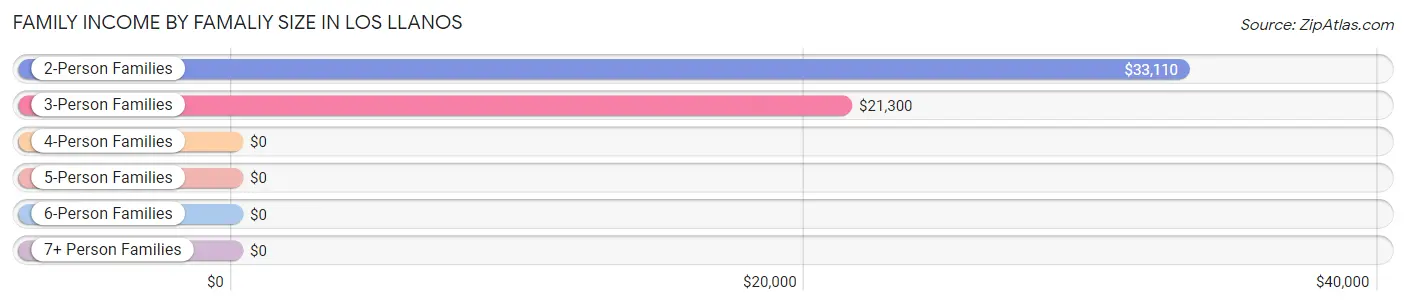
| Income Bracket | # Families | Median Income |
| 2-Person Families | 198 (45.7%) | $33,110 |
| 3-Person Families | 176 (40.6%) | $21,300 |
| 4-Person Families | 33 (7.6%) | $0 |
| 5-Person Families | 0 (0.0%) | $0 |
| 6-Person Families | 26 (6.0%) | $0 |
| 7+ Person Families | 0 (0.0%) | $0 |
| Total | 433 (100.0%) | $22,981 |
Family Income by Number of Earners in Los Llanos
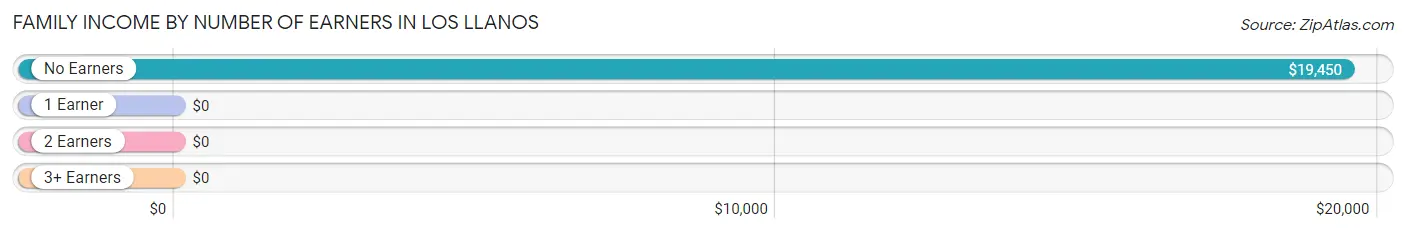
| Number of Earners | # Families | Median Income |
| No Earners | 197 (45.5%) | $19,450 |
| 1 Earner | 170 (39.3%) | $0 |
| 2 Earners | 66 (15.2%) | $0 |
| 3+ Earners | 0 (0.0%) | $0 |
| Total | 433 (100.0%) | $22,981 |
Household Income in Los Llanos
Household Income Brackets in Los Llanos
With 182 households falling in the category, the $10,000 to $14,999 income range is the most frequent in Los Llanos, accounting for 26.6% of all households.
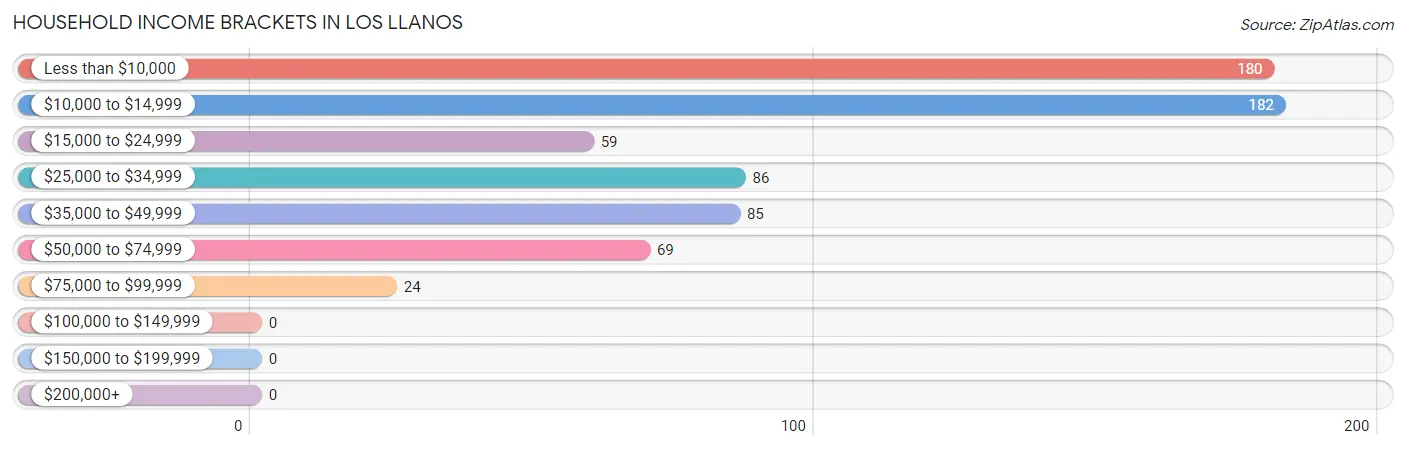
| Income Bracket | # Households | % Households |
| Less than $10,000 | 180 | 26.3% |
| $10,000 to $14,999 | 182 | 26.6% |
| $15,000 to $24,999 | 59 | 8.6% |
| $25,000 to $34,999 | 86 | 12.6% |
| $35,000 to $49,999 | 85 | 12.4% |
| $50,000 to $74,999 | 69 | 10.1% |
| $75,000 to $99,999 | 24 | 3.5% |
| $100,000 to $149,999 | 0 | 0.0% |
| $150,000 to $199,999 | 0 | 0.0% |
| $200,000+ | 0 | 0.0% |
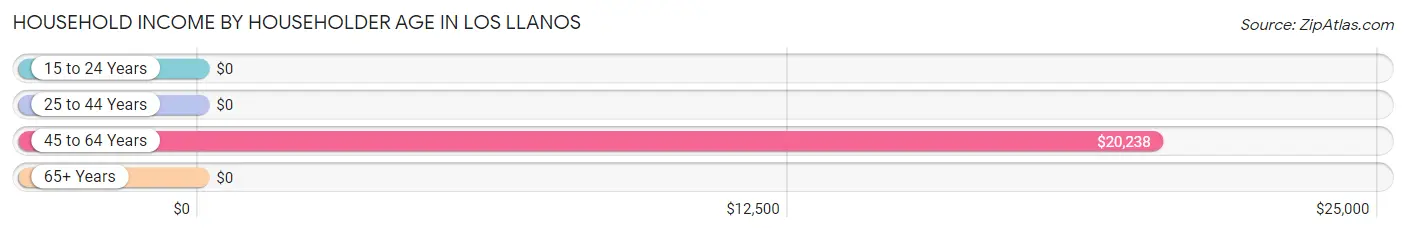
Household Income by Householder Age in Los Llanos
The median household income in Los Llanos is $13,811, with the highest median household income of $20,238 found in the 45 to 64 years age bracket for the primary householder. A total of 272 households (39.7%) fall into this category. Meanwhile, the 15 to 24 years age bracket for the primary householder has the lowest median household income of $0, with 12 households (1.8%) in this group.
| Income Bracket | # Households | Median Income |
| 15 to 24 Years | 12 (1.8%) | $0 |
| 25 to 44 Years | 55 (8.0%) | $0 |
| 45 to 64 Years | 272 (39.7%) | $20,238 |
| 65+ Years | 346 (50.5%) | $0 |
| Total | 685 (100.0%) | $13,811 |
Poverty in Los Llanos
Income Below Poverty by Sex and Age in Los Llanos
With 59.1% poverty level for males and 52.6% for females among the residents of Los Llanos, 6 to 11 year old males and 6 to 11 year old females are the most vulnerable to poverty, with 30 males (100.0%) and 27 females (100.0%) in their respective age groups living below the poverty level.
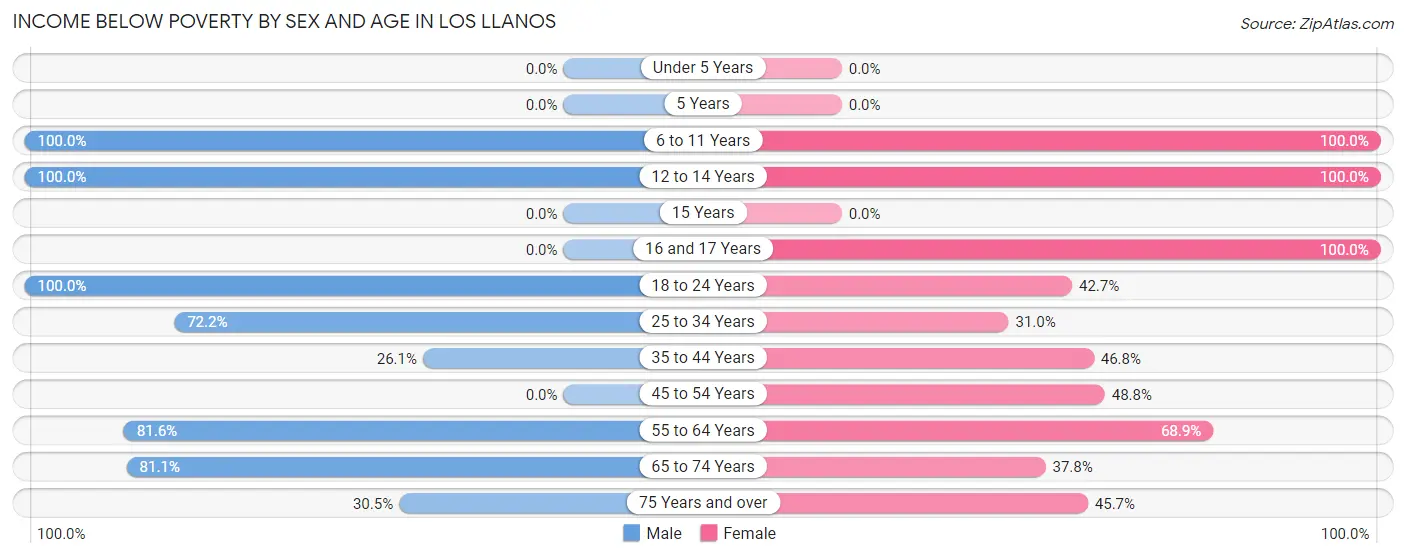
| Age Bracket | Male | Female |
| Under 5 Years | 0 (0.0%) | 0 (0.0%) |
| 5 Years | 0 (0.0%) | 0 (0.0%) |
| 6 to 11 Years | 30 (100.0%) | 27 (100.0%) |
| 12 to 14 Years | 60 (100.0%) | 76 (100.0%) |
| 15 Years | 0 (0.0%) | 0 (0.0%) |
| 16 and 17 Years | 0 (0.0%) | 34 (100.0%) |
| 18 to 24 Years | 51 (100.0%) | 53 (42.7%) |
| 25 to 34 Years | 78 (72.2%) | 26 (30.9%) |
| 35 to 44 Years | 36 (26.1%) | 29 (46.8%) |
| 45 to 54 Years | 0 (0.0%) | 62 (48.8%) |
| 55 to 64 Years | 115 (81.6%) | 122 (68.9%) |
| 65 to 74 Years | 77 (81.0%) | 59 (37.8%) |
| 75 Years and over | 36 (30.5%) | 58 (45.7%) |
| Total | 483 (59.1%) | 546 (52.6%) |
Income Above Poverty by Sex and Age in Los Llanos
According to the poverty statistics in Los Llanos, males aged 45 to 54 years and females aged under 5 years are the age groups that are most secure financially, with 100.0% of males and 100.0% of females in these age groups living above the poverty line.
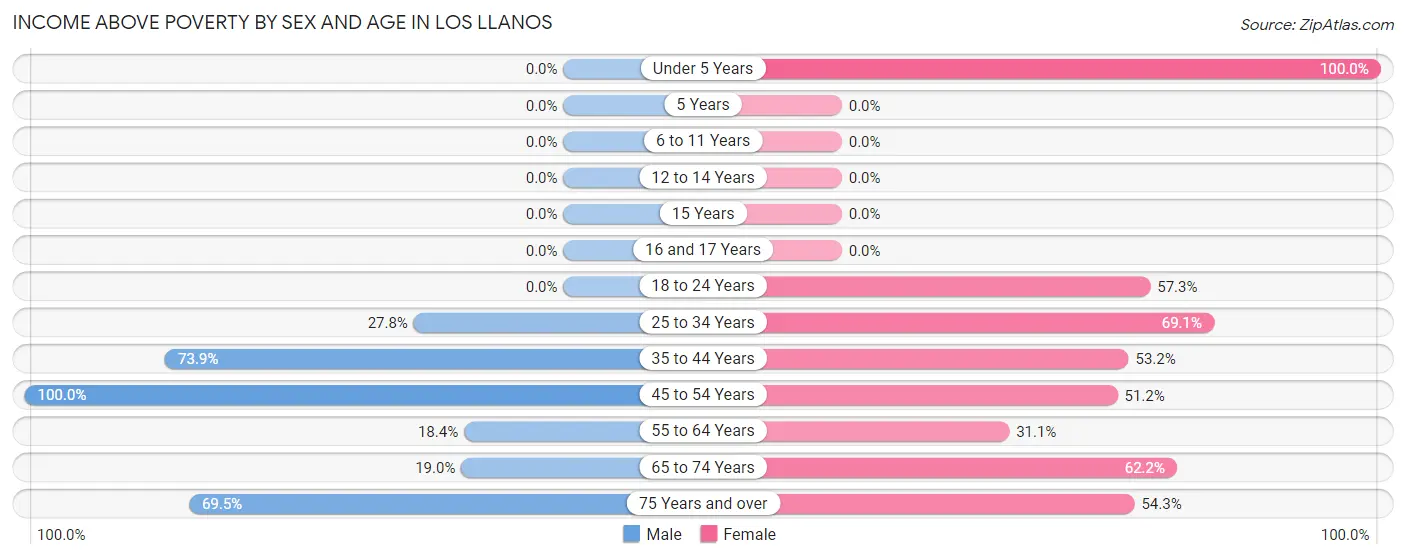
| Age Bracket | Male | Female |
| Under 5 Years | 0 (0.0%) | 43 (100.0%) |
| 5 Years | 0 (0.0%) | 0 (0.0%) |
| 6 to 11 Years | 0 (0.0%) | 0 (0.0%) |
| 12 to 14 Years | 0 (0.0%) | 0 (0.0%) |
| 15 Years | 0 (0.0%) | 0 (0.0%) |
| 16 and 17 Years | 0 (0.0%) | 0 (0.0%) |
| 18 to 24 Years | 0 (0.0%) | 71 (57.3%) |
| 25 to 34 Years | 30 (27.8%) | 58 (69.1%) |
| 35 to 44 Years | 102 (73.9%) | 33 (53.2%) |
| 45 to 54 Years | 76 (100.0%) | 65 (51.2%) |
| 55 to 64 Years | 26 (18.4%) | 55 (31.1%) |
| 65 to 74 Years | 18 (19.0%) | 97 (62.2%) |
| 75 Years and over | 82 (69.5%) | 69 (54.3%) |
| Total | 334 (40.9%) | 491 (47.3%) |
Income Below Poverty Among Married-Couple Families in Los Llanos
The poverty statistics for married-couple families in Los Llanos show that 25.8% or 51 of the total 198 families live below the poverty line. Families with no children have the highest poverty rate of 25.8%, comprising of 51 families. On the other hand, families with no children have the lowest poverty rate of 25.8%, which includes 51 families.
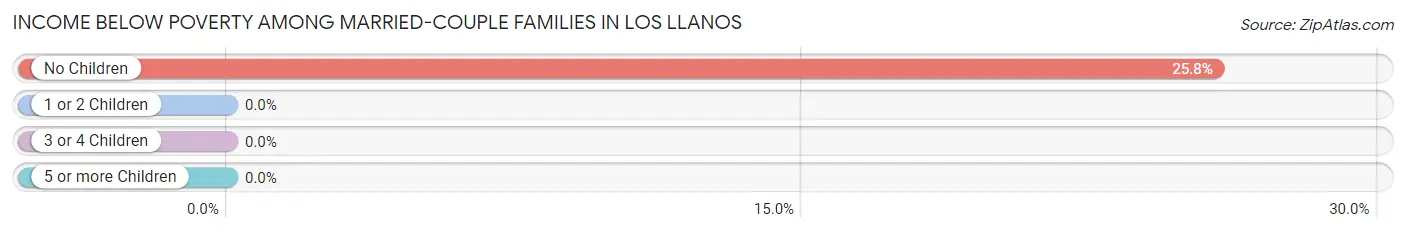
| Children | Above Poverty | Below Poverty |
| No Children | 147 (74.2%) | 51 (25.8%) |
| 1 or 2 Children | 0 (0.0%) | 0 (0.0%) |
| 3 or 4 Children | 0 (0.0%) | 0 (0.0%) |
| 5 or more Children | 0 (0.0%) | 0 (0.0%) |
| Total | 147 (74.2%) | 51 (25.8%) |
Income Below Poverty Among Single-Parent Households in Los Llanos
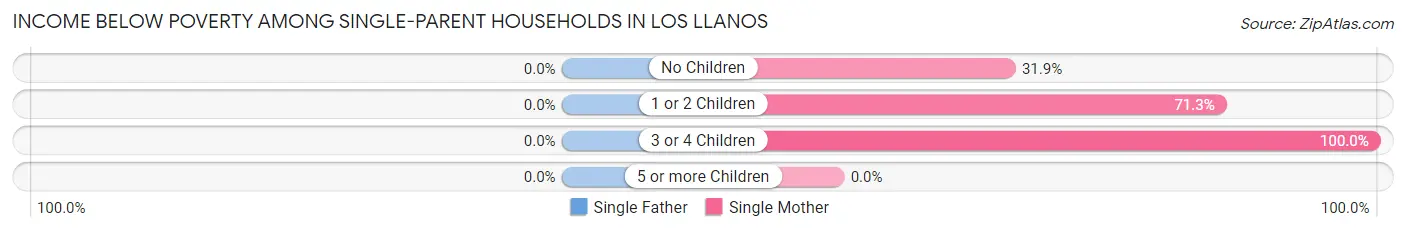
| Children | Single Father | Single Mother |
| No Children | 0 (0.0%) | 30 (31.9%) |
| 1 or 2 Children | 0 (0.0%) | 82 (71.3%) |
| 3 or 4 Children | 0 (0.0%) | 26 (100.0%) |
| 5 or more Children | 0 (0.0%) | 0 (0.0%) |
| Total | 0 (0.0%) | 138 (58.7%) |
Income Below Poverty Among Married-Couple vs Single-Parent Households in Los Llanos
The poverty data for Los Llanos shows that 51 of the married-couple family households (25.8%) and 138 of the single-parent households (58.7%) are living below the poverty level. Within the married-couple family households, those with no children have the highest poverty rate, with 51 households (25.8%) falling below the poverty line. Among the single-parent households, those with 3 or 4 children have the highest poverty rate, with 26 household (100.0%) living below poverty.
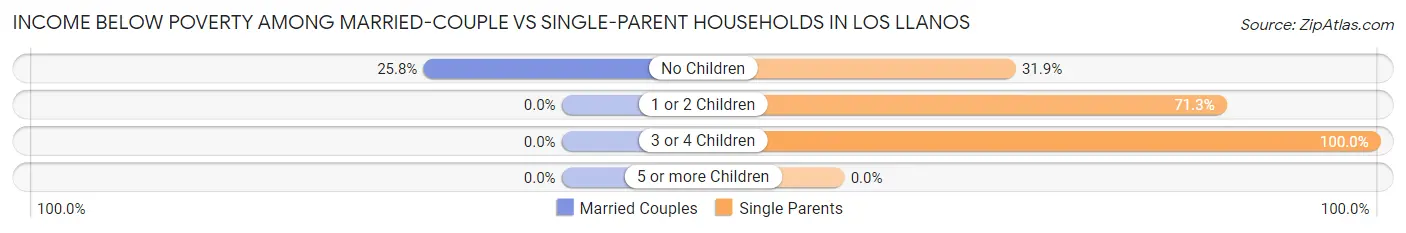
| Children | Married-Couple Families | Single-Parent Households |
| No Children | 51 (25.8%) | 30 (31.9%) |
| 1 or 2 Children | 0 (0.0%) | 82 (71.3%) |
| 3 or 4 Children | 0 (0.0%) | 26 (100.0%) |
| 5 or more Children | 0 (0.0%) | 0 (0.0%) |
| Total | 51 (25.8%) | 138 (58.7%) |
Race in Los Llanos
The most populous races in Los Llanos are Hispanic or Latino (1,885 | 98.4%), Two or more Races (837 | 43.7%), and White / Caucasian (833 | 43.5%).
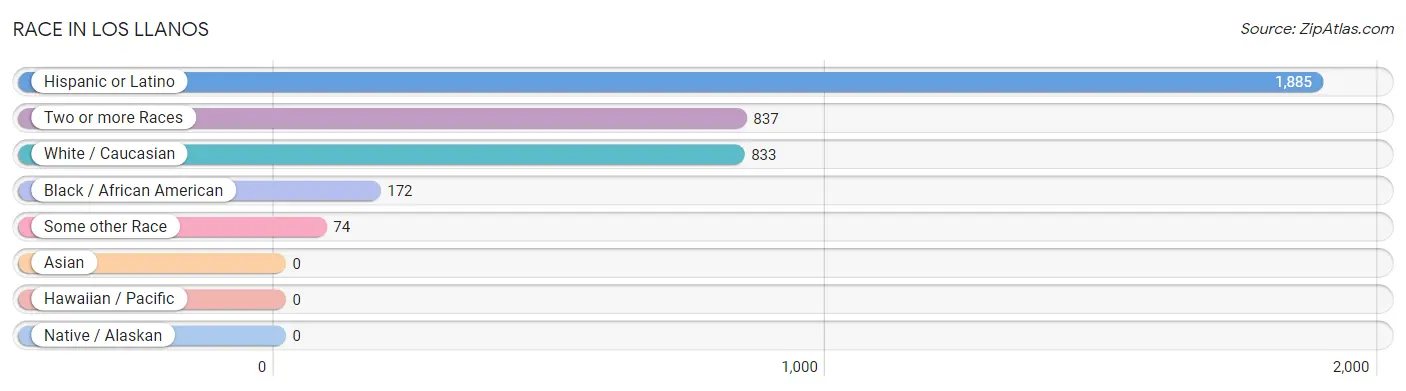
| Race | # Population | % Population |
| Asian | 0 | 0.0% |
| Black / African American | 172 | 9.0% |
| Hawaiian / Pacific | 0 | 0.0% |
| Hispanic or Latino | 1,885 | 98.4% |
| Native / Alaskan | 0 | 0.0% |
| White / Caucasian | 833 | 43.5% |
| Two or more Races | 837 | 43.7% |
| Some other Race | 74 | 3.9% |
| Total | 1,916 | 100.0% |
Ancestry in Los Llanos
The most populous ancestries reported in Los Llanos are Puerto Rican (1,885 | 98.4%), and American (79 | 4.1%), together accounting for 102.5% of all Los Llanos residents.
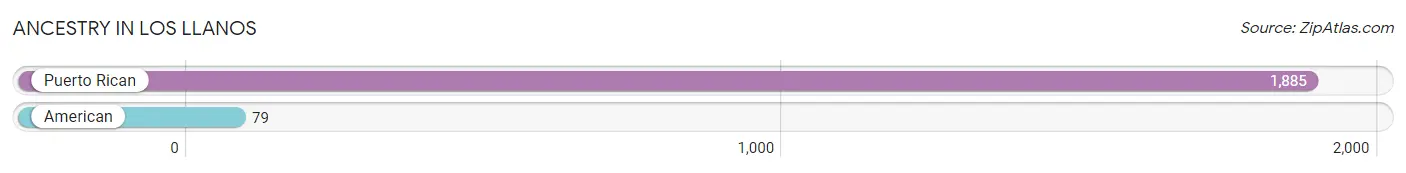
| Ancestry | # Population | % Population |
| American | 79 | 4.1% |
| Puerto Rican | 1,885 | 98.4% | View All 2 Rows |
Immigrants in Los Llanos

| Immigration Origin | # Population | % Population | View All 0 Rows |
Sex and Age in Los Llanos
Sex and Age in Los Llanos
The most populous age groups in Los Llanos are 55 to 59 Years (141 | 16.2%) for men and 60 to 64 Years (111 | 10.6%) for women.
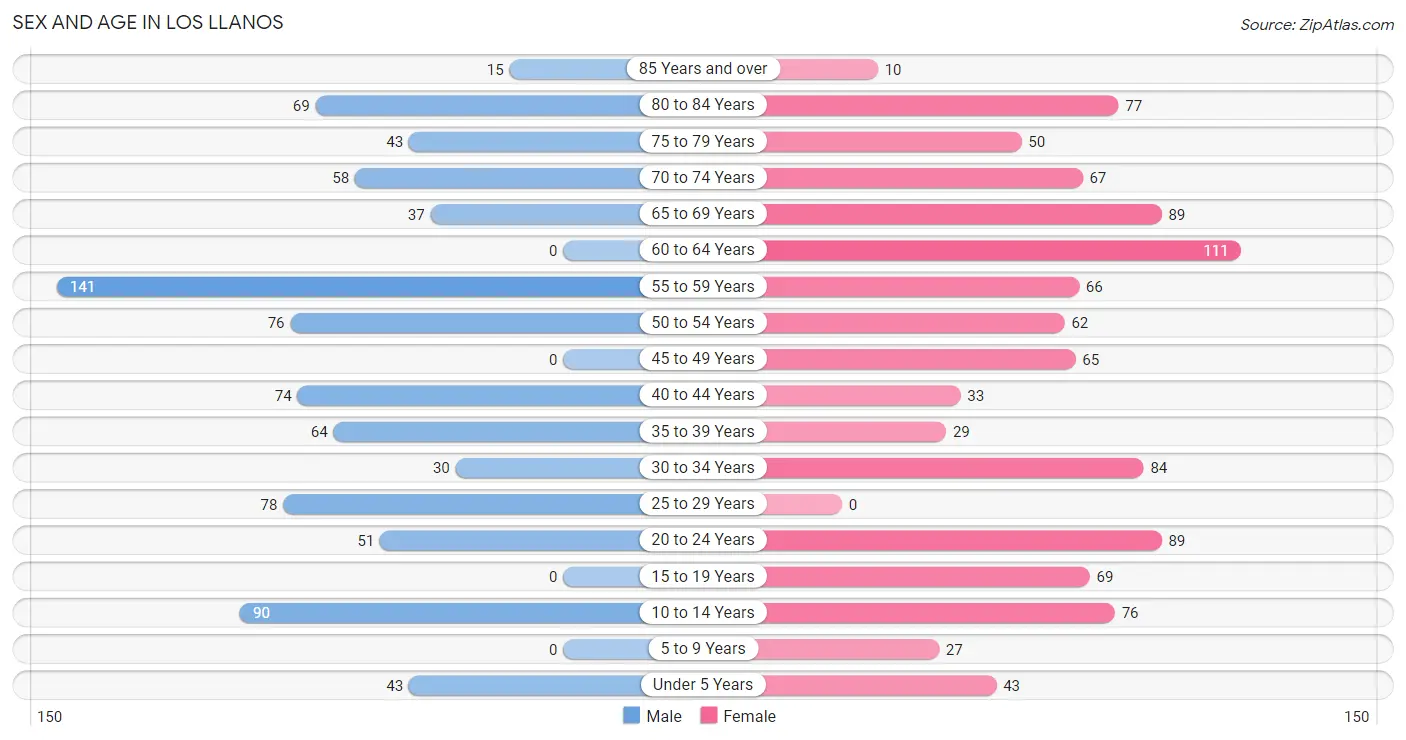
| Age Bracket | Male | Female |
| Under 5 Years | 43 (5.0%) | 43 (4.1%) |
| 5 to 9 Years | 0 (0.0%) | 27 (2.6%) |
| 10 to 14 Years | 90 (10.4%) | 76 (7.3%) |
| 15 to 19 Years | 0 (0.0%) | 69 (6.6%) |
| 20 to 24 Years | 51 (5.9%) | 89 (8.5%) |
| 25 to 29 Years | 78 (9.0%) | 0 (0.0%) |
| 30 to 34 Years | 30 (3.5%) | 84 (8.0%) |
| 35 to 39 Years | 64 (7.4%) | 29 (2.8%) |
| 40 to 44 Years | 74 (8.5%) | 33 (3.2%) |
| 45 to 49 Years | 0 (0.0%) | 65 (6.2%) |
| 50 to 54 Years | 76 (8.7%) | 62 (5.9%) |
| 55 to 59 Years | 141 (16.2%) | 66 (6.3%) |
| 60 to 64 Years | 0 (0.0%) | 111 (10.6%) |
| 65 to 69 Years | 37 (4.3%) | 89 (8.5%) |
| 70 to 74 Years | 58 (6.7%) | 67 (6.4%) |
| 75 to 79 Years | 43 (5.0%) | 50 (4.8%) |
| 80 to 84 Years | 69 (7.9%) | 77 (7.3%) |
| 85 Years and over | 15 (1.7%) | 10 (1.0%) |
| Total | 869 (100.0%) | 1,047 (100.0%) |
Families and Households in Los Llanos
Median Family Size in Los Llanos
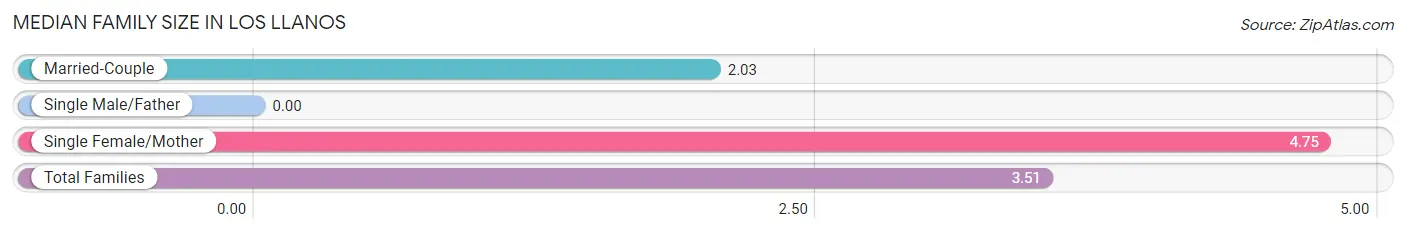
| Family Type | # Families | Family Size |
| Married-Couple | 198 (45.7%) | 2.03 |
| Single Male/Father | 0 (0.0%) | - |
| Single Female/Mother | 235 (54.3%) | 4.75 |
| Total Families | 433 (100.0%) | 3.51 |
Median Household Size in Los Llanos
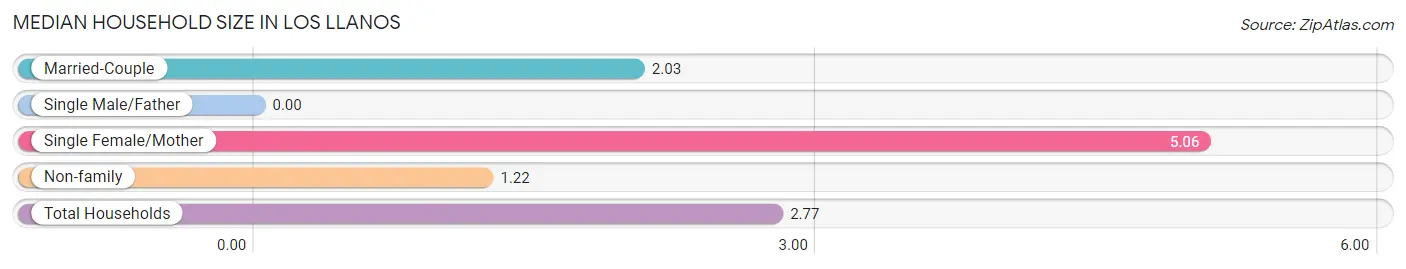
| Household Type | # Households | Household Size |
| Married-Couple | 198 (28.9%) | 2.03 |
| Single Male/Father | 0 (0.0%) | - |
| Single Female/Mother | 235 (34.3%) | 5.06 |
| Non-family | 252 (36.8%) | 1.22 |
| Total Households | 685 (100.0%) | 2.77 |
Household Size by Marriage Status in Los Llanos
Out of a total of 685 households in Los Llanos, 433 (63.2%) are family households, while 252 (36.8%) are nonfamily households. The most numerous type of family households are 2-person households, comprising 198, and the most common type of nonfamily households are 1-person households, comprising 211.
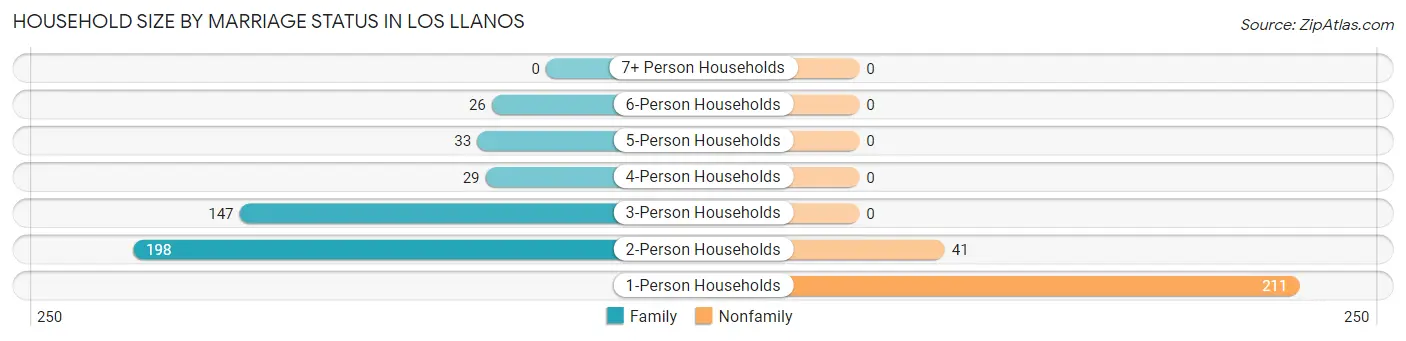
| Household Size | Family Households | Nonfamily Households |
| 1-Person Households | - | 211 (30.8%) |
| 2-Person Households | 198 (28.9%) | 41 (6.0%) |
| 3-Person Households | 147 (21.5%) | 0 (0.0%) |
| 4-Person Households | 29 (4.2%) | 0 (0.0%) |
| 5-Person Households | 33 (4.8%) | 0 (0.0%) |
| 6-Person Households | 26 (3.8%) | 0 (0.0%) |
| 7+ Person Households | 0 (0.0%) | 0 (0.0%) |
| Total | 433 (63.2%) | 252 (36.8%) |
Female Fertility in Los Llanos
Fertility by Age in Los Llanos
Average fertility rate in Los Llanos is 93.0 births per 1,000 women. Women in the age bracket of 20 to 34 years have the highest fertility rate with 208.0 births per 1,000 women. Women in the age bracket of 20 to 34 years acount for 100.0% of all women with births.
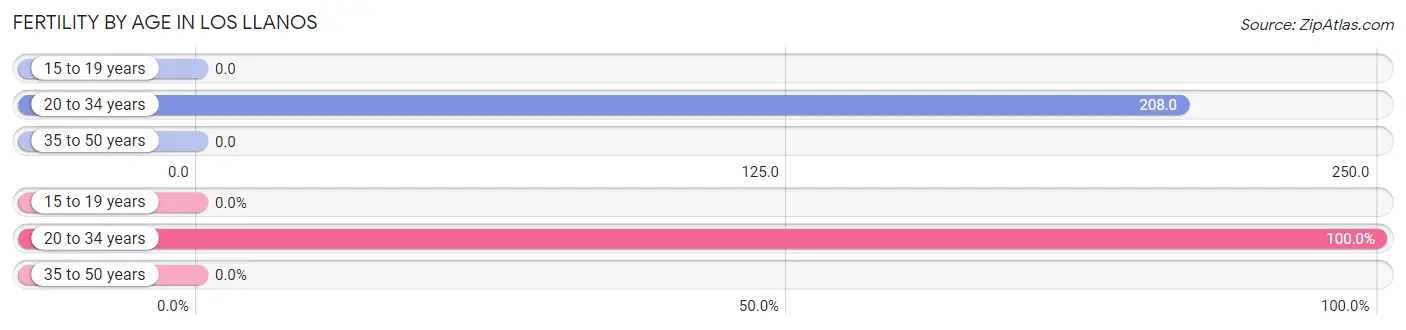
| Age Bracket | Women with Births | Births / 1,000 Women |
| 15 to 19 years | 0 (0.0%) | 0.0 |
| 20 to 34 years | 36 (100.0%) | 208.0 |
| 35 to 50 years | 0 (0.0%) | 0.0 |
| Total | 36 (100.0%) | 93.0 |
Fertility by Age by Marriage Status in Los Llanos
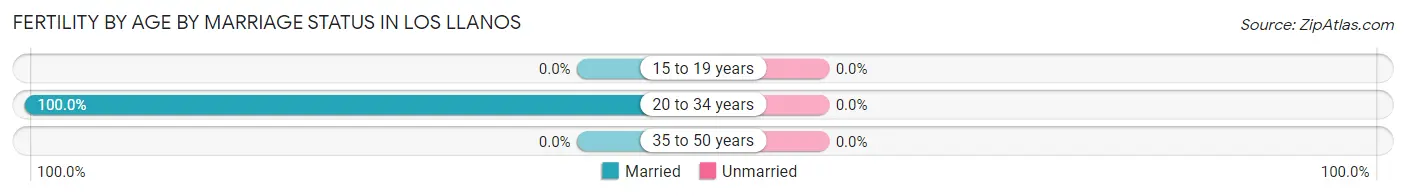
| Age Bracket | Married | Unmarried |
| 15 to 19 years | 0 (0.0%) | 0 (0.0%) |
| 20 to 34 years | 36 (100.0%) | 0 (0.0%) |
| 35 to 50 years | 0 (0.0%) | 0 (0.0%) |
| Total | 36 (100.0%) | 0 (0.0%) |
Fertility by Education in Los Llanos
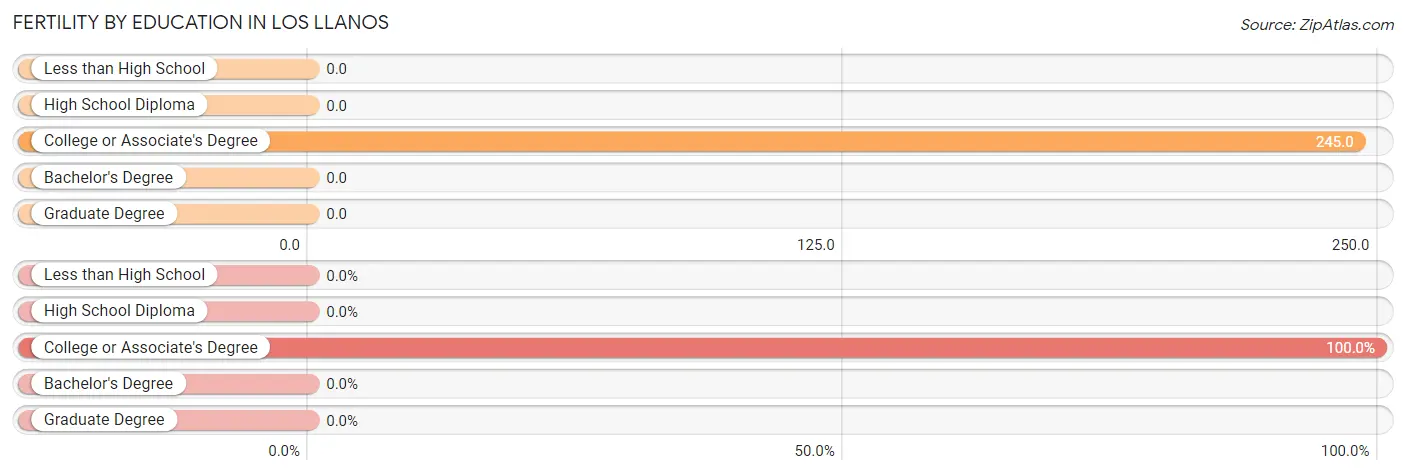
| Educational Attainment | Women with Births | Births / 1,000 Women |
| Less than High School | 0 (0.0%) | 0.0 |
| High School Diploma | 0 (0.0%) | 0.0 |
| College or Associate's Degree | 36 (100.0%) | 245.0 |
| Bachelor's Degree | 0 (0.0%) | 0.0 |
| Graduate Degree | 0 (0.0%) | 0.0 |
| Total | 36 (100.0%) | 93.0 |
Fertility by Education by Marriage Status in Los Llanos
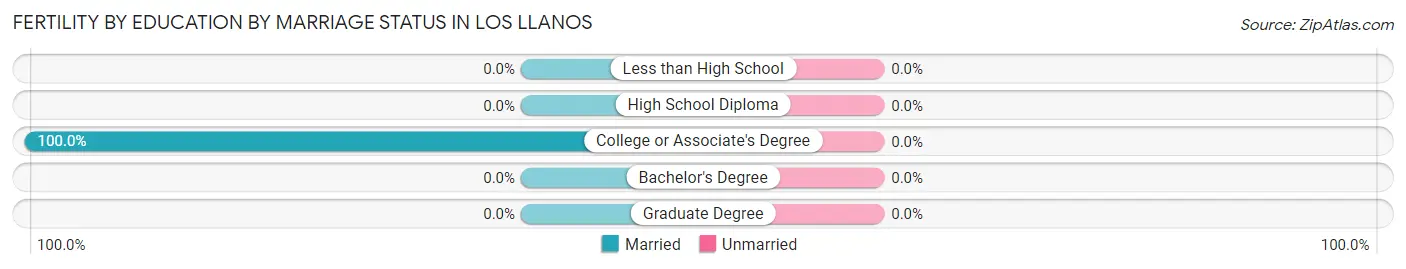
| Educational Attainment | Married | Unmarried |
| Less than High School | 0 (0.0%) | 0 (0.0%) |
| High School Diploma | 0 (0.0%) | 0 (0.0%) |
| College or Associate's Degree | 36 (100.0%) | 0 (0.0%) |
| Bachelor's Degree | 0 (0.0%) | 0 (0.0%) |
| Graduate Degree | 0 (0.0%) | 0 (0.0%) |
| Total | 36 (100.0%) | 0 (0.0%) |
Employment Characteristics in Los Llanos
Employment by Class of Employer in Los Llanos
Among the 395 employed individuals in Los Llanos, private company employees (275 | 69.6%), self-employed (not incorporated) (40 | 10.1%), and state government employees (40 | 10.1%) make up the most common classes of employment.
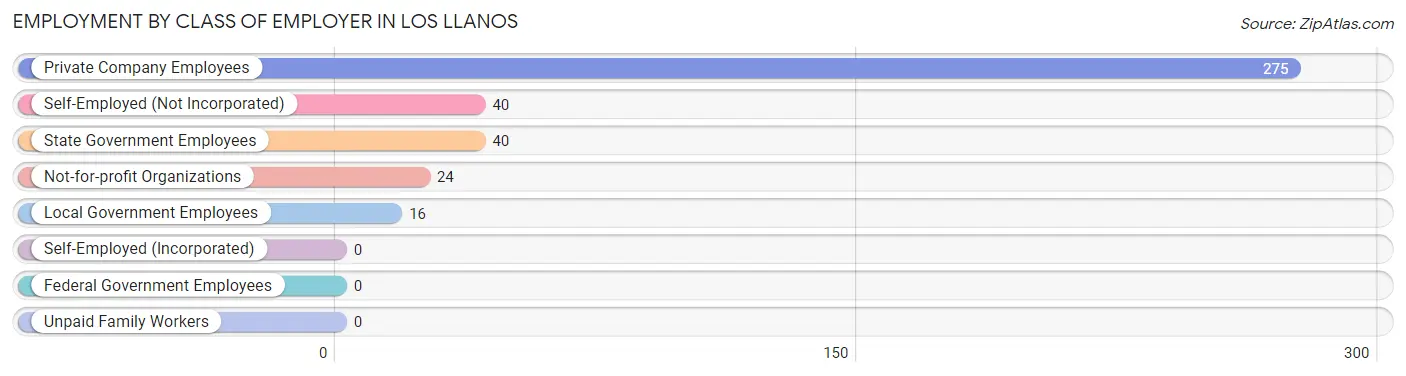
| Employer Class | # Employees | % Employees |
| Private Company Employees | 275 | 69.6% |
| Self-Employed (Incorporated) | 0 | 0.0% |
| Self-Employed (Not Incorporated) | 40 | 10.1% |
| Not-for-profit Organizations | 24 | 6.1% |
| Local Government Employees | 16 | 4.1% |
| State Government Employees | 40 | 10.1% |
| Federal Government Employees | 0 | 0.0% |
| Unpaid Family Workers | 0 | 0.0% |
| Total | 395 | 100.0% |
Employment Status by Age in Los Llanos
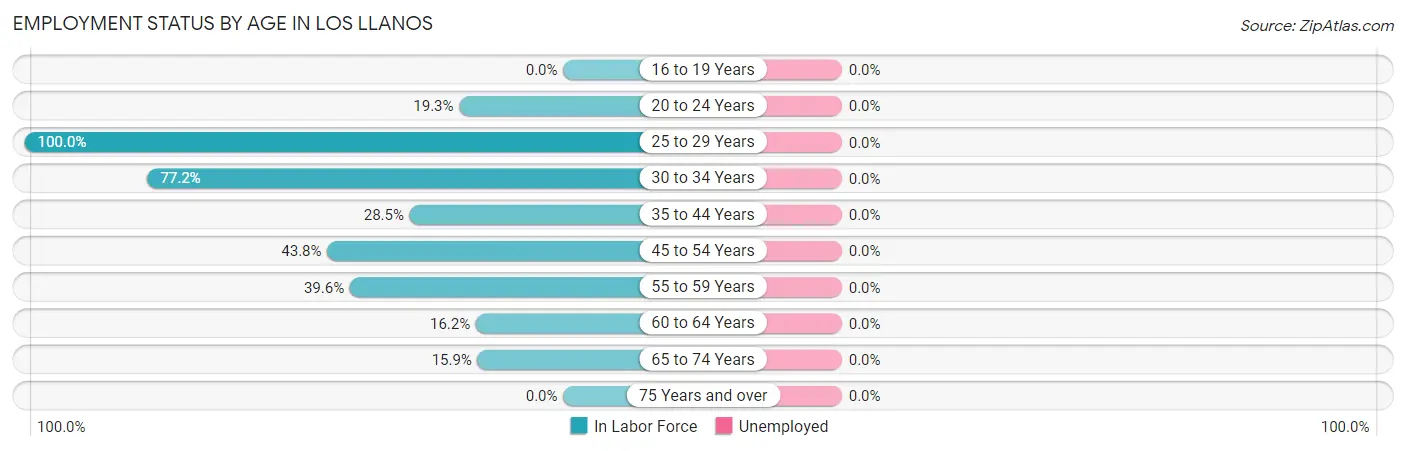
| Age Bracket | In Labor Force | Unemployed |
| 16 to 19 Years | 0 (0.0%) | 0 (0.0%) |
| 20 to 24 Years | 27 (19.3%) | 0 (0.0%) |
| 25 to 29 Years | 78 (100.0%) | 0 (0.0%) |
| 30 to 34 Years | 88 (77.2%) | 0 (0.0%) |
| 35 to 44 Years | 57 (28.5%) | 0 (0.0%) |
| 45 to 54 Years | 89 (43.8%) | 0 (0.0%) |
| 55 to 59 Years | 82 (39.6%) | 0 (0.0%) |
| 60 to 64 Years | 18 (16.2%) | 0 (0.0%) |
| 65 to 74 Years | 40 (15.9%) | 0 (0.0%) |
| 75 Years and over | 0 (0.0%) | 0 (0.0%) |
| Total | 480 (29.3%) | 0 (0.0%) |
Employment Status by Educational Attainment in Los Llanos
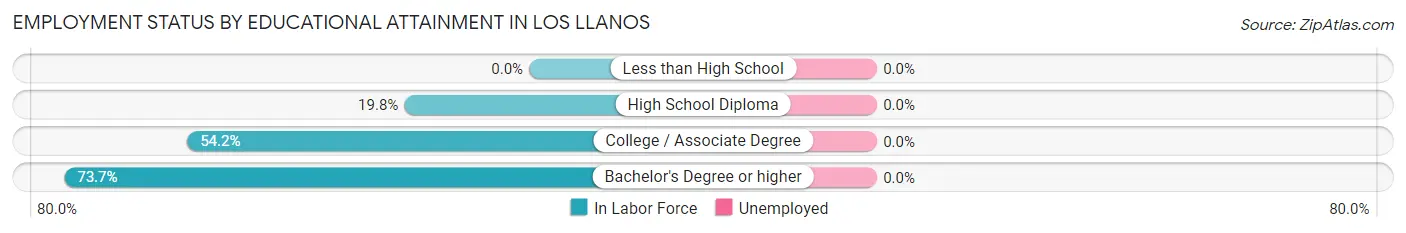
| Educational Attainment | In Labor Force | Unemployed |
| Less than High School | 0 (0.0%) | 0 (0.0%) |
| High School Diploma | 70 (19.8%) | 0 (0.0%) |
| College / Associate Degree | 135 (54.2%) | 0 (0.0%) |
| Bachelor's Degree or higher | 207 (73.7%) | 0 (0.0%) |
| Total | 412 (45.1%) | 0 (0.0%) |
Employment Occupations by Sex in Los Llanos
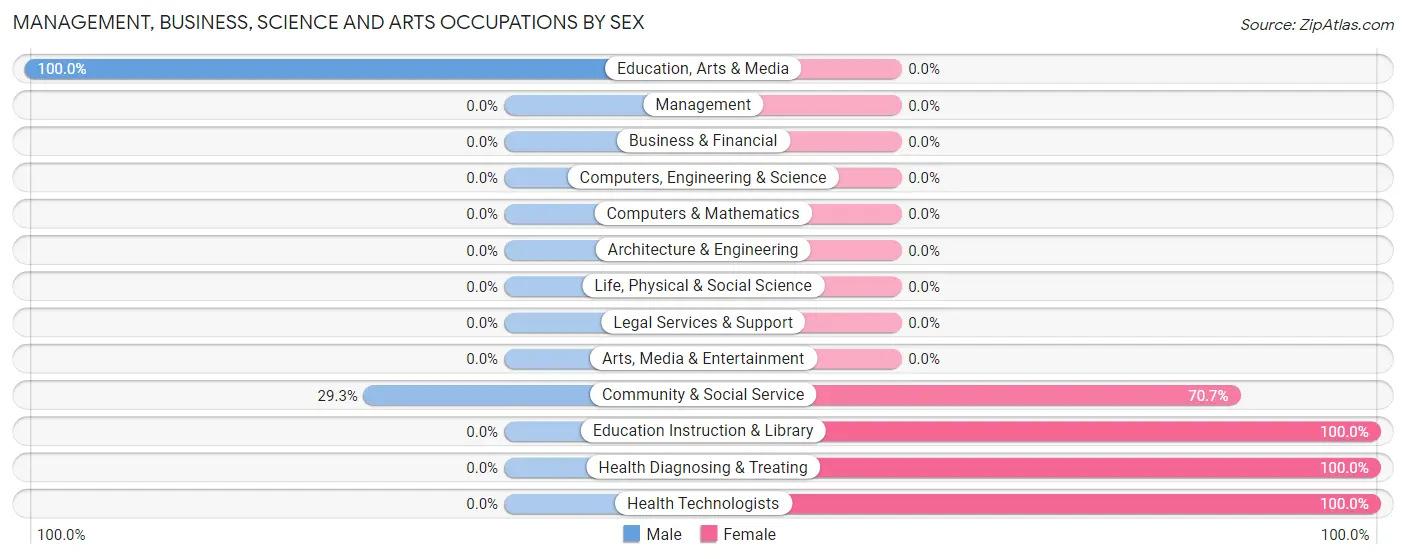
Management, Business, Science and Arts Occupations
The most common Management, Business, Science and Arts occupations in Los Llanos are Community & Social Service (82 | 17.1%), Health Diagnosing & Treating (63 | 13.2%), Health Technologists (63 | 13.2%), Education Instruction & Library (58 | 12.1%), and Education, Arts & Media (24 | 5.0%).
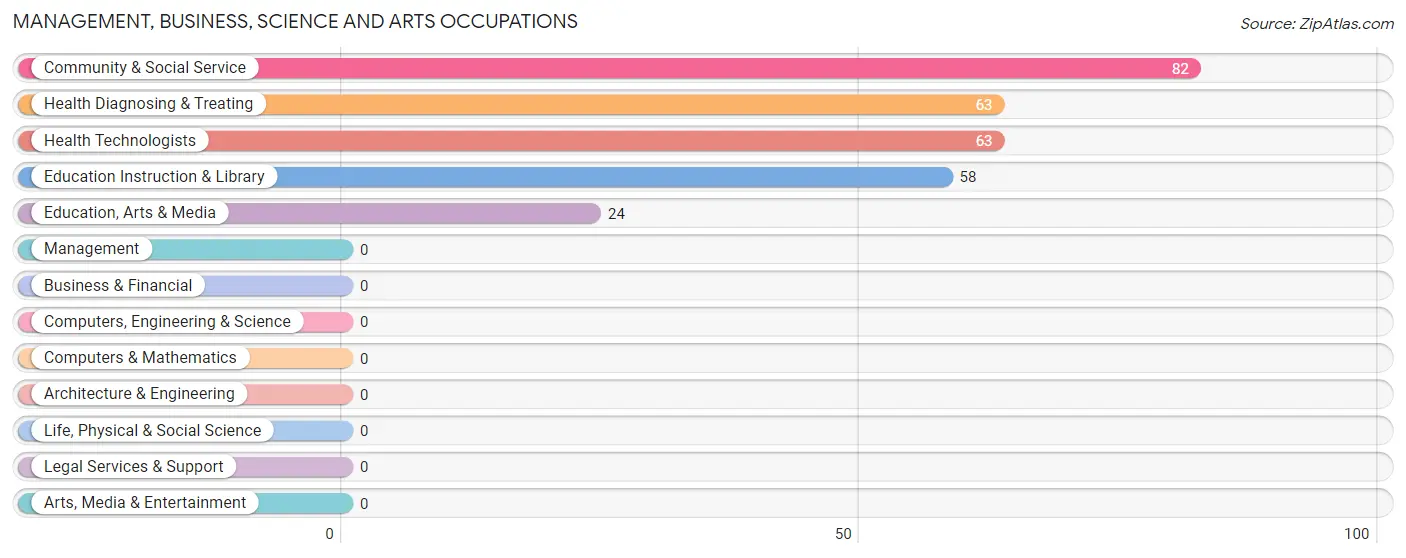
Management, Business, Science and Arts Occupations by Sex
Within the Management, Business, Science and Arts occupations in Los Llanos, the most male-oriented occupations are Education, Arts & Media (100.0%), and Community & Social Service (29.3%), while the most female-oriented occupations are Education Instruction & Library (100.0%), Health Diagnosing & Treating (100.0%), and Health Technologists (100.0%).
| Occupation | Male | Female |
| Management | 0 (0.0%) | 0 (0.0%) |
| Business & Financial | 0 (0.0%) | 0 (0.0%) |
| Computers, Engineering & Science | 0 (0.0%) | 0 (0.0%) |
| Computers & Mathematics | 0 (0.0%) | 0 (0.0%) |
| Architecture & Engineering | 0 (0.0%) | 0 (0.0%) |
| Life, Physical & Social Science | 0 (0.0%) | 0 (0.0%) |
| Community & Social Service | 24 (29.3%) | 58 (70.7%) |
| Education, Arts & Media | 24 (100.0%) | 0 (0.0%) |
| Legal Services & Support | 0 (0.0%) | 0 (0.0%) |
| Education Instruction & Library | 0 (0.0%) | 58 (100.0%) |
| Arts, Media & Entertainment | 0 (0.0%) | 0 (0.0%) |
| Health Diagnosing & Treating | 0 (0.0%) | 63 (100.0%) |
| Health Technologists | 0 (0.0%) | 63 (100.0%) |
| Total (Category) | 24 (16.6%) | 121 (83.5%) |
| Total (Overall) | 278 (58.0%) | 201 (42.0%) |
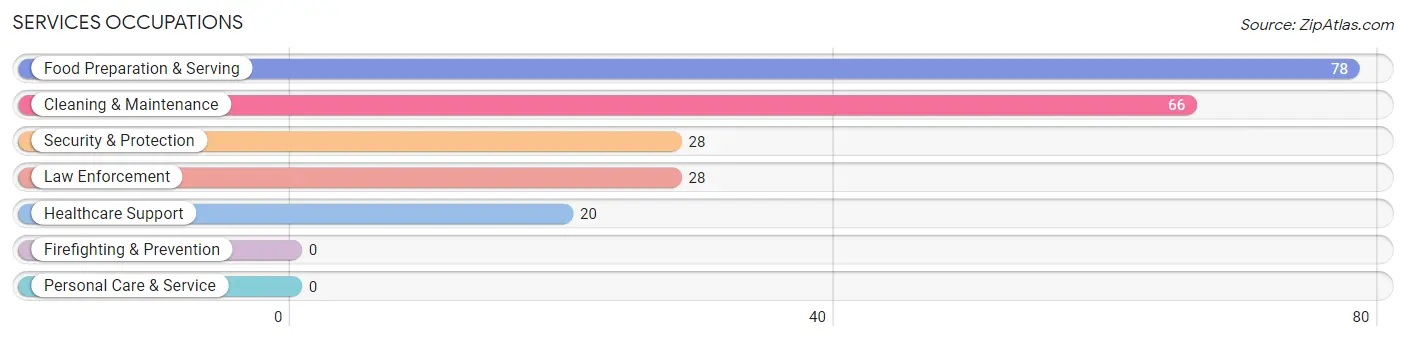
Services Occupations
The most common Services occupations in Los Llanos are Food Preparation & Serving (78 | 16.3%), Cleaning & Maintenance (66 | 13.8%), Security & Protection (28 | 5.9%), Law Enforcement (28 | 5.9%), and Healthcare Support (20 | 4.2%).
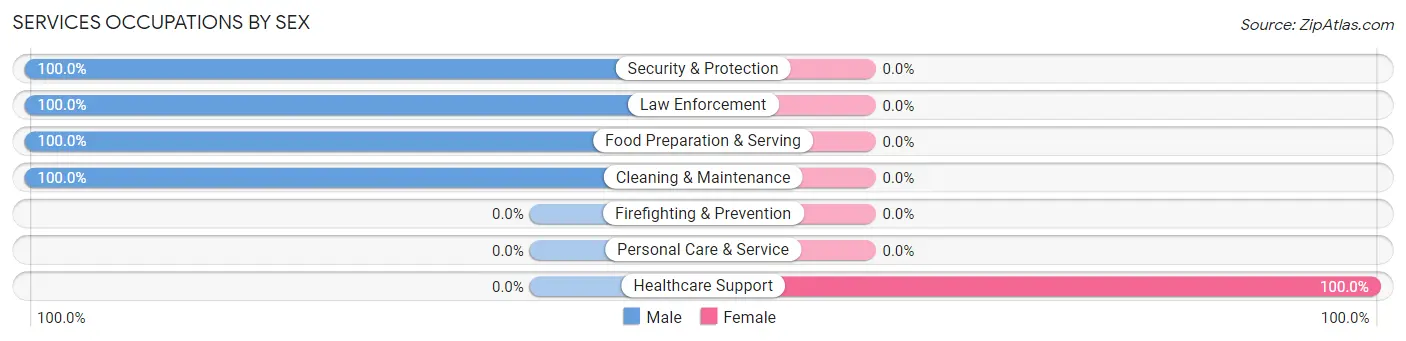
Services Occupations by Sex
| Occupation | Male | Female |
| Healthcare Support | 0 (0.0%) | 20 (100.0%) |
| Security & Protection | 28 (100.0%) | 0 (0.0%) |
| Firefighting & Prevention | 0 (0.0%) | 0 (0.0%) |
| Law Enforcement | 28 (100.0%) | 0 (0.0%) |
| Food Preparation & Serving | 78 (100.0%) | 0 (0.0%) |
| Cleaning & Maintenance | 66 (100.0%) | 0 (0.0%) |
| Personal Care & Service | 0 (0.0%) | 0 (0.0%) |
| Total (Category) | 172 (89.6%) | 20 (10.4%) |
| Total (Overall) | 278 (58.0%) | 201 (42.0%) |
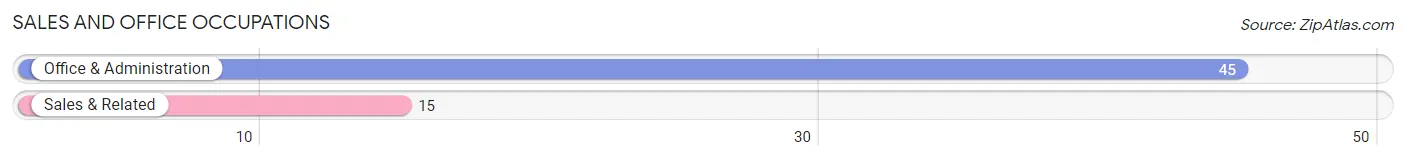
Sales and Office Occupations
The most common Sales and Office occupations in Los Llanos are Office & Administration (45 | 9.4%), and Sales & Related (15 | 3.1%).
Sales and Office Occupations by Sex
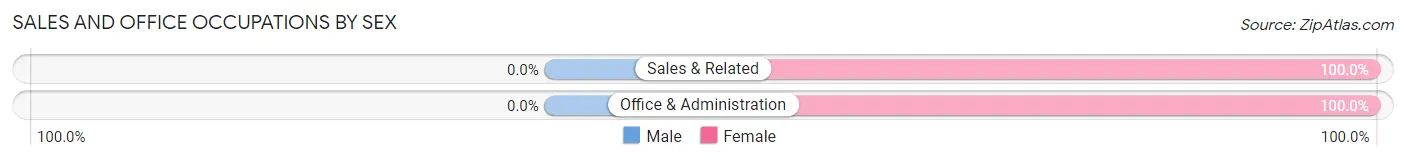
| Occupation | Male | Female |
| Sales & Related | 0 (0.0%) | 15 (100.0%) |
| Office & Administration | 0 (0.0%) | 45 (100.0%) |
| Total (Category) | 0 (0.0%) | 60 (100.0%) |
| Total (Overall) | 278 (58.0%) | 201 (42.0%) |
Natural Resources, Construction and Maintenance Occupations
Natural Resources, Construction and Maintenance Occupations by Sex
| Occupation | Male | Female |
| Farming, Fishing & Forestry | 0 (0.0%) | 0 (0.0%) |
| Construction & Extraction | 0 (0.0%) | 0 (0.0%) |
| Installation, Maintenance & Repair | 0 (0.0%) | 0 (0.0%) |
| Total (Category) | 0 (0.0%) | 0 (0.0%) |
| Total (Overall) | 278 (58.0%) | 201 (42.0%) |
Production, Transportation and Moving Occupations
The most common Production, Transportation and Moving occupations in Los Llanos are , and Production (82 | 17.1%).
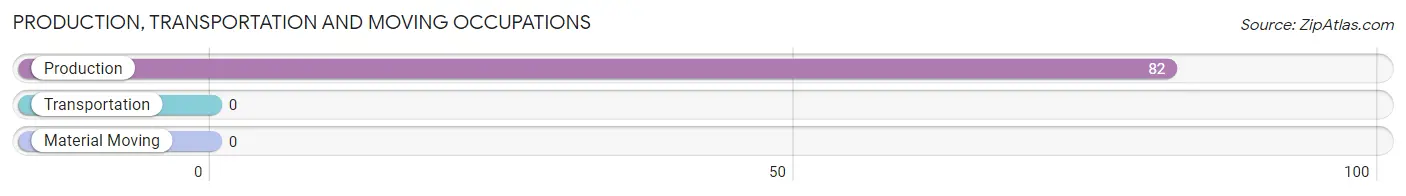
Production, Transportation and Moving Occupations by Sex
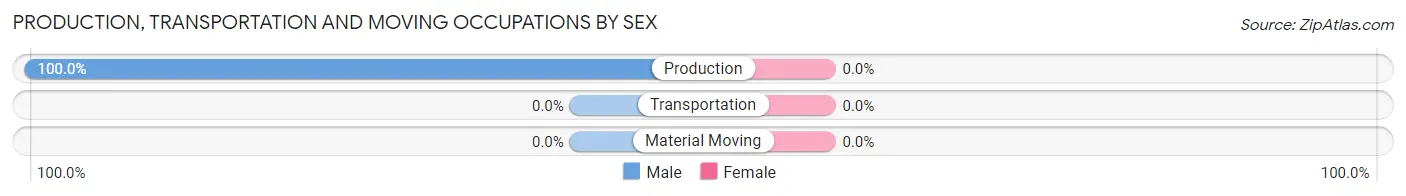
| Occupation | Male | Female |
| Production | 82 (100.0%) | 0 (0.0%) |
| Transportation | 0 (0.0%) | 0 (0.0%) |
| Material Moving | 0 (0.0%) | 0 (0.0%) |
| Total (Category) | 82 (100.0%) | 0 (0.0%) |
| Total (Overall) | 278 (58.0%) | 201 (42.0%) |
Employment Industries by Sex in Los Llanos
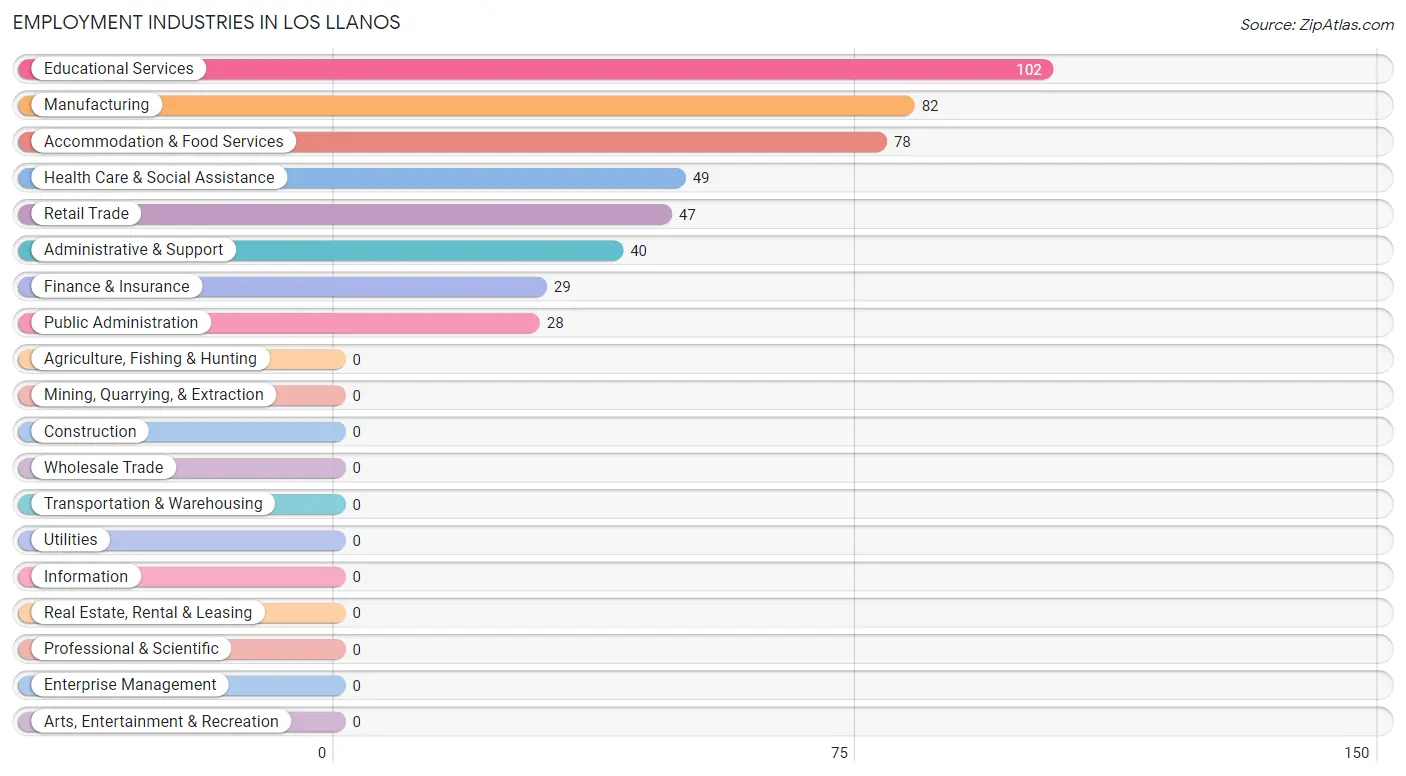
Employment Industries in Los Llanos
The major employment industries in Los Llanos include Educational Services (102 | 21.3%), Manufacturing (82 | 17.1%), Accommodation & Food Services (78 | 16.3%), Health Care & Social Assistance (49 | 10.2%), and Retail Trade (47 | 9.8%).
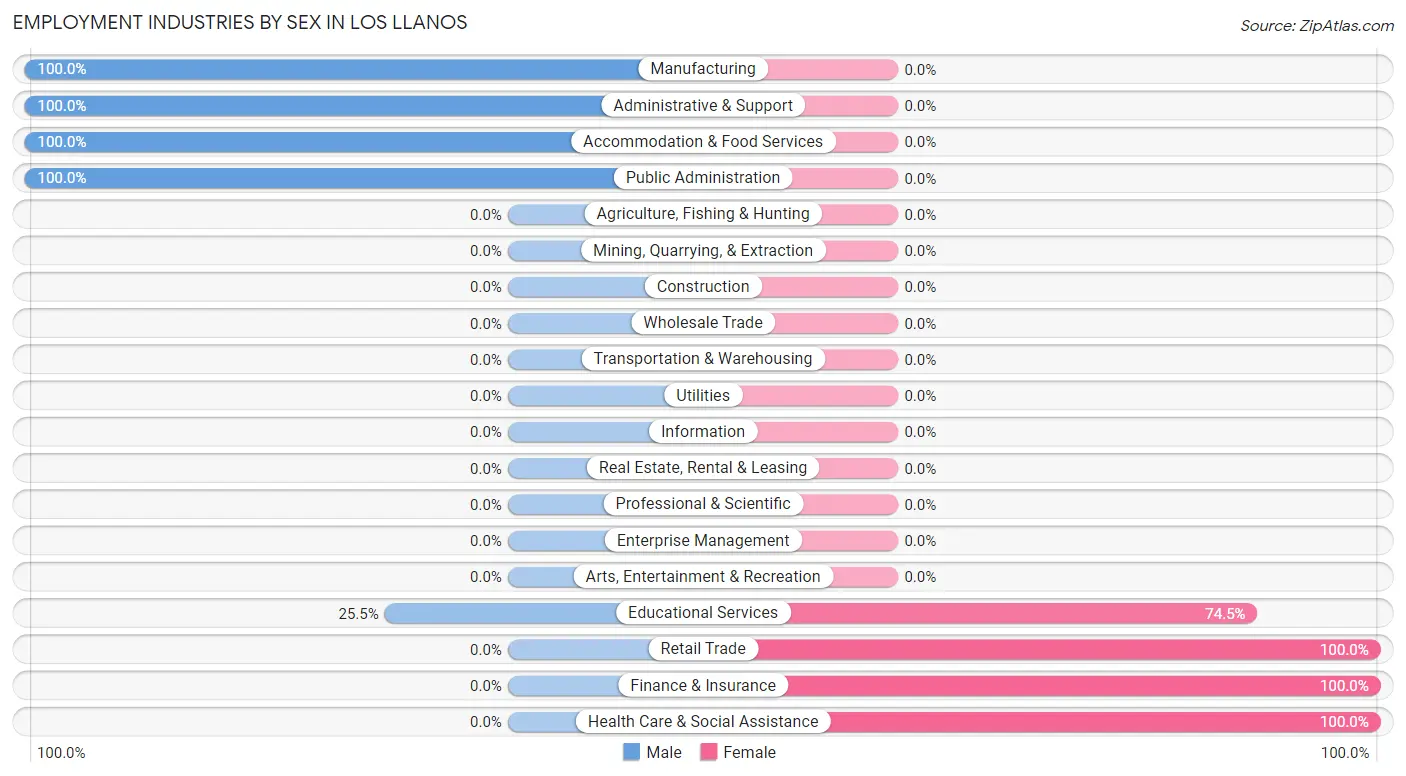
Employment Industries by Sex in Los Llanos
The Los Llanos industries that see more men than women are Manufacturing (100.0%), Administrative & Support (100.0%), and Accommodation & Food Services (100.0%), whereas the industries that tend to have a higher number of women are Retail Trade (100.0%), Finance & Insurance (100.0%), and Health Care & Social Assistance (100.0%).
| Industry | Male | Female |
| Agriculture, Fishing & Hunting | 0 (0.0%) | 0 (0.0%) |
| Mining, Quarrying, & Extraction | 0 (0.0%) | 0 (0.0%) |
| Construction | 0 (0.0%) | 0 (0.0%) |
| Manufacturing | 82 (100.0%) | 0 (0.0%) |
| Wholesale Trade | 0 (0.0%) | 0 (0.0%) |
| Retail Trade | 0 (0.0%) | 47 (100.0%) |
| Transportation & Warehousing | 0 (0.0%) | 0 (0.0%) |
| Utilities | 0 (0.0%) | 0 (0.0%) |
| Information | 0 (0.0%) | 0 (0.0%) |
| Finance & Insurance | 0 (0.0%) | 29 (100.0%) |
| Real Estate, Rental & Leasing | 0 (0.0%) | 0 (0.0%) |
| Professional & Scientific | 0 (0.0%) | 0 (0.0%) |
| Enterprise Management | 0 (0.0%) | 0 (0.0%) |
| Administrative & Support | 40 (100.0%) | 0 (0.0%) |
| Educational Services | 26 (25.5%) | 76 (74.5%) |
| Health Care & Social Assistance | 0 (0.0%) | 49 (100.0%) |
| Arts, Entertainment & Recreation | 0 (0.0%) | 0 (0.0%) |
| Accommodation & Food Services | 78 (100.0%) | 0 (0.0%) |
| Public Administration | 28 (100.0%) | 0 (0.0%) |
| Total | 278 (58.0%) | 201 (42.0%) |
Education in Los Llanos
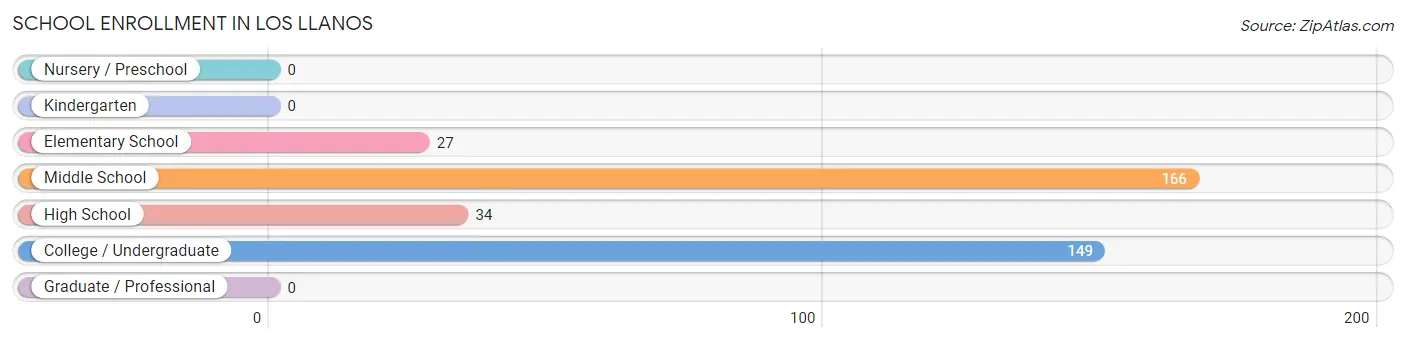
School Enrollment in Los Llanos
The most common levels of schooling among the 376 students in Los Llanos are middle school (166 | 44.2%), college / undergraduate (149 | 39.6%), and high school (34 | 9.0%).
| School Level | # Students | % Students |
| Nursery / Preschool | 0 | 0.0% |
| Kindergarten | 0 | 0.0% |
| Elementary School | 27 | 7.2% |
| Middle School | 166 | 44.2% |
| High School | 34 | 9.0% |
| College / Undergraduate | 149 | 39.6% |
| Graduate / Professional | 0 | 0.0% |
| Total | 376 | 100.0% |
School Enrollment by Age by Funding Source in Los Llanos
Out of a total of 376 students who are enrolled in schools in Los Llanos, 71 (18.9%) attend a private institution, while the remaining 305 (81.1%) are enrolled in public schools. The age group of 18 to 19 year olds has the highest likelihood of being enrolled in private schools, with 35 (100.0% in the age bracket) enrolled. Conversely, the age group of 5 to 9 year old has the lowest likelihood of being enrolled in a private school, with 27 (100.0% in the age bracket) attending a public institution.
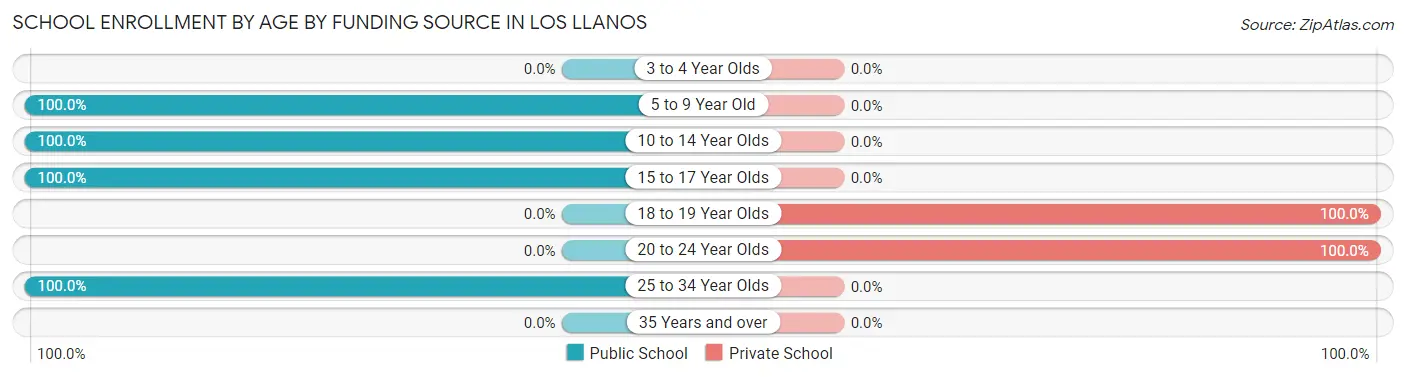
| Age Bracket | Public School | Private School |
| 3 to 4 Year Olds | 0 (0.0%) | 0 (0.0%) |
| 5 to 9 Year Old | 27 (100.0%) | 0 (0.0%) |
| 10 to 14 Year Olds | 166 (100.0%) | 0 (0.0%) |
| 15 to 17 Year Olds | 34 (100.0%) | 0 (0.0%) |
| 18 to 19 Year Olds | 0 (0.0%) | 35 (100.0%) |
| 20 to 24 Year Olds | 0 (0.0%) | 36 (100.0%) |
| 25 to 34 Year Olds | 78 (100.0%) | 0 (0.0%) |
| 35 Years and over | 0 (0.0%) | 0 (0.0%) |
| Total | 305 (81.1%) | 71 (18.9%) |
Educational Attainment by Field of Study in Los Llanos
Education (113 | 35.3%), science & technology (103 | 32.2%), social sciences (40 | 12.5%), engineering (30 | 9.4%), and multidisciplinary studies (18 | 5.6%) are the most common fields of study among 320 individuals in Los Llanos who have obtained a bachelor's degree or higher.
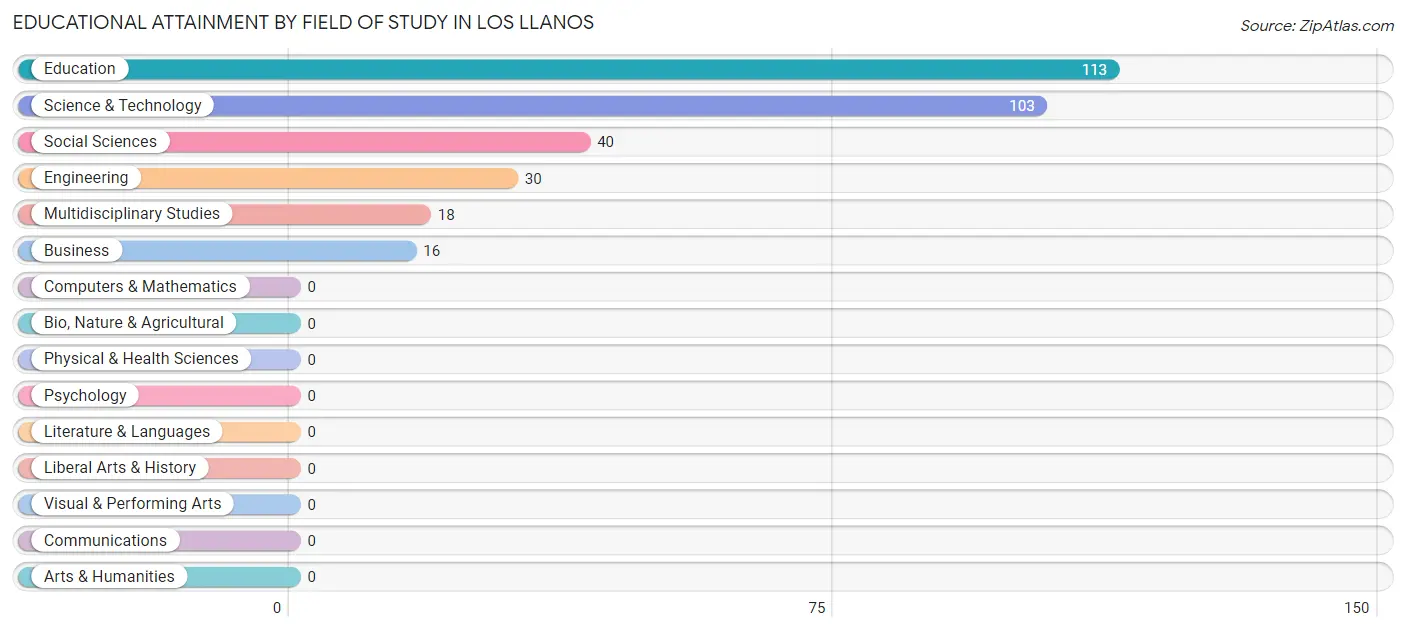
| Field of Study | # Graduates | % Graduates |
| Computers & Mathematics | 0 | 0.0% |
| Bio, Nature & Agricultural | 0 | 0.0% |
| Physical & Health Sciences | 0 | 0.0% |
| Psychology | 0 | 0.0% |
| Social Sciences | 40 | 12.5% |
| Engineering | 30 | 9.4% |
| Multidisciplinary Studies | 18 | 5.6% |
| Science & Technology | 103 | 32.2% |
| Business | 16 | 5.0% |
| Education | 113 | 35.3% |
| Literature & Languages | 0 | 0.0% |
| Liberal Arts & History | 0 | 0.0% |
| Visual & Performing Arts | 0 | 0.0% |
| Communications | 0 | 0.0% |
| Arts & Humanities | 0 | 0.0% |
| Total | 320 | 100.0% |
Transportation & Commute in Los Llanos
Vehicle Availability by Sex in Los Llanos
The most prevalent vehicle ownership categories in Los Llanos are males with 3 vehicles (102, accounting for 40.5%) and females with 3 vehicles (12, making up 71.3%).
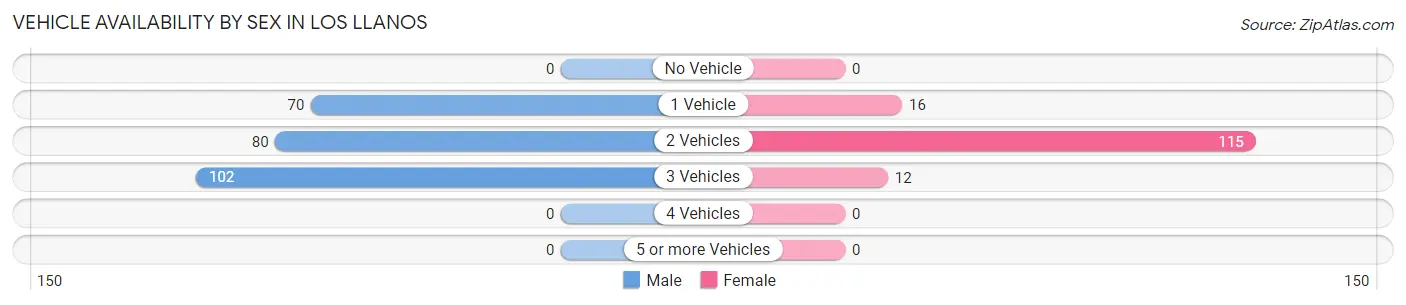
| Vehicles Available | Male | Female |
| No Vehicle | 0 (0.0%) | 0 (0.0%) |
| 1 Vehicle | 70 (27.8%) | 16 (11.2%) |
| 2 Vehicles | 80 (31.8%) | 115 (80.4%) |
| 3 Vehicles | 102 (40.5%) | 12 (8.4%) |
| 4 Vehicles | 0 (0.0%) | 0 (0.0%) |
| 5 or more Vehicles | 0 (0.0%) | 0 (0.0%) |
| Total | 252 (100.0%) | 143 (100.0%) |
Commute Time in Los Llanos
The most frequently occuring commute durations in Los Llanos are 15 to 19 minutes (118 commuters, 29.9%), 10 to 14 minutes (88 commuters, 22.3%), and 5 to 9 minutes (60 commuters, 15.2%).
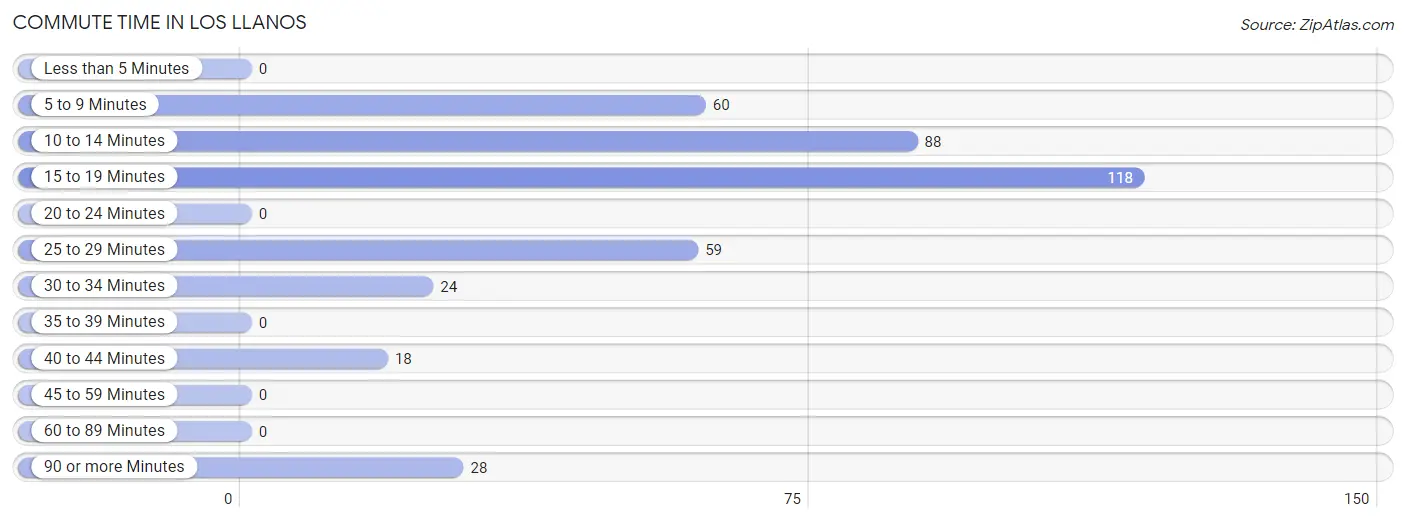
| Commute Time | # Commuters | % Commuters |
| Less than 5 Minutes | 0 | 0.0% |
| 5 to 9 Minutes | 60 | 15.2% |
| 10 to 14 Minutes | 88 | 22.3% |
| 15 to 19 Minutes | 118 | 29.9% |
| 20 to 24 Minutes | 0 | 0.0% |
| 25 to 29 Minutes | 59 | 14.9% |
| 30 to 34 Minutes | 24 | 6.1% |
| 35 to 39 Minutes | 0 | 0.0% |
| 40 to 44 Minutes | 18 | 4.6% |
| 45 to 59 Minutes | 0 | 0.0% |
| 60 to 89 Minutes | 0 | 0.0% |
| 90 or more Minutes | 28 | 7.1% |
Commute Time by Sex in Los Llanos
The most common commute times in Los Llanos are 15 to 19 minutes (102 commuters, 40.5%) for males and 10 to 14 minutes (48 commuters, 33.6%) for females.
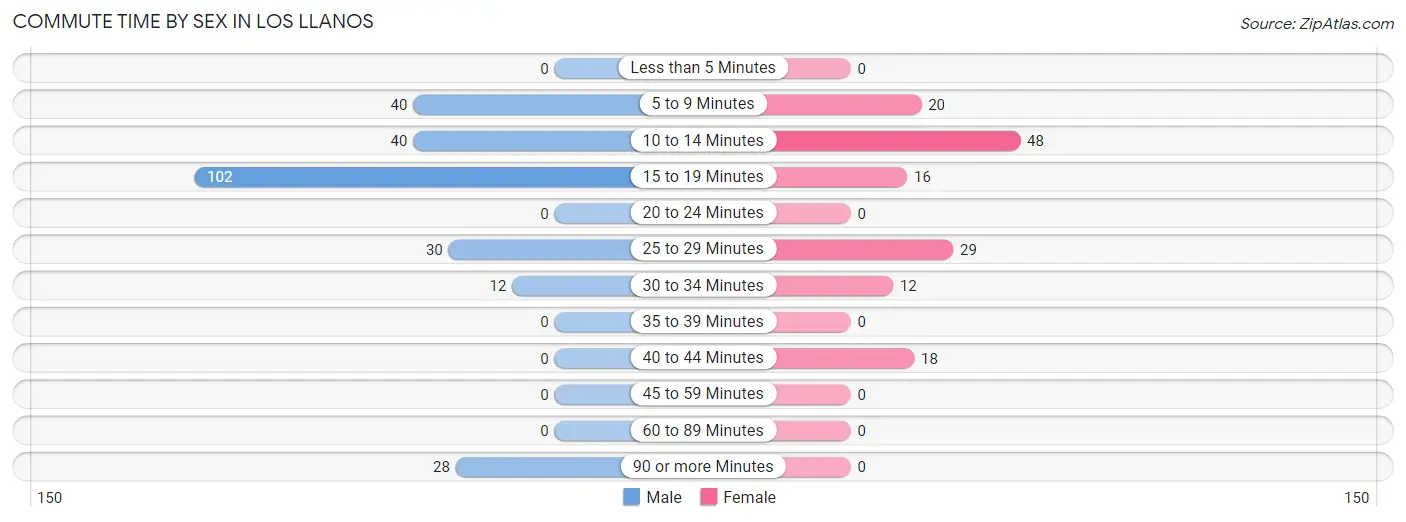
| Commute Time | Male | Female |
| Less than 5 Minutes | 0 (0.0%) | 0 (0.0%) |
| 5 to 9 Minutes | 40 (15.9%) | 20 (14.0%) |
| 10 to 14 Minutes | 40 (15.9%) | 48 (33.6%) |
| 15 to 19 Minutes | 102 (40.5%) | 16 (11.2%) |
| 20 to 24 Minutes | 0 (0.0%) | 0 (0.0%) |
| 25 to 29 Minutes | 30 (11.9%) | 29 (20.3%) |
| 30 to 34 Minutes | 12 (4.8%) | 12 (8.4%) |
| 35 to 39 Minutes | 0 (0.0%) | 0 (0.0%) |
| 40 to 44 Minutes | 0 (0.0%) | 18 (12.6%) |
| 45 to 59 Minutes | 0 (0.0%) | 0 (0.0%) |
| 60 to 89 Minutes | 0 (0.0%) | 0 (0.0%) |
| 90 or more Minutes | 28 (11.1%) | 0 (0.0%) |
Time of Departure to Work by Sex in Los Llanos
The most frequent times of departure to work in Los Llanos are 12:00 PM to 3:59 PM (212, 84.1%) for males and 6:30 AM to 6:59 AM (65, 45.5%) for females.
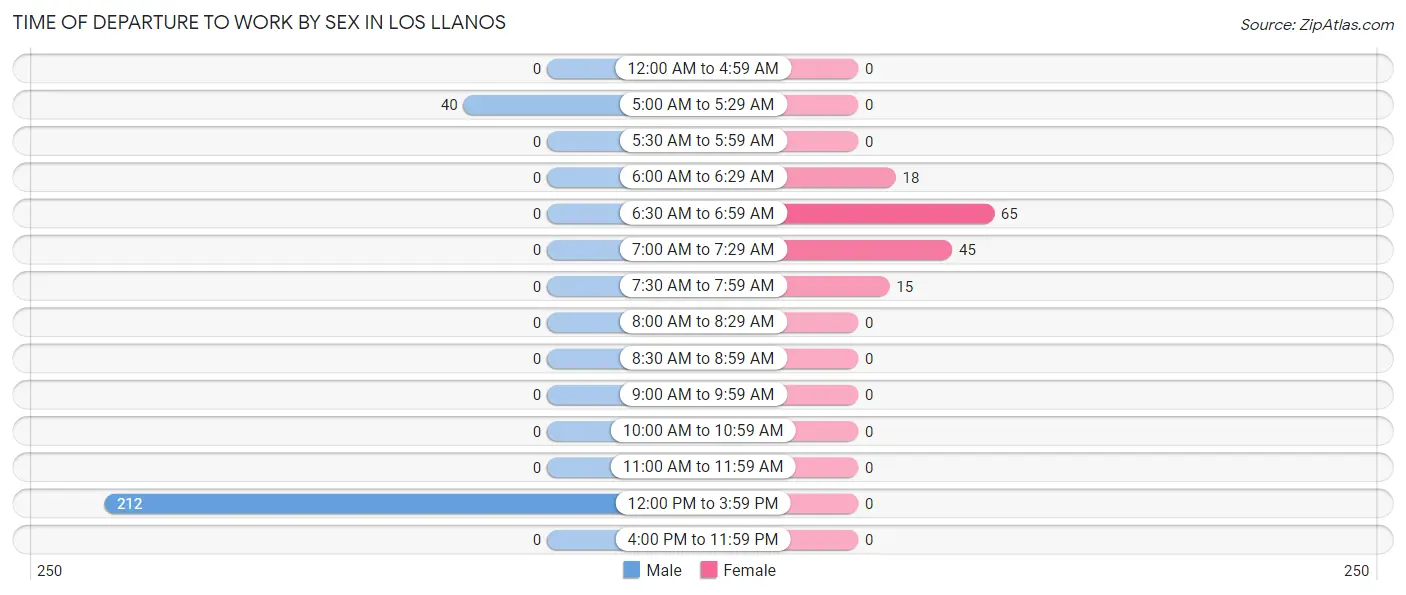
| Time of Departure | Male | Female |
| 12:00 AM to 4:59 AM | 0 (0.0%) | 0 (0.0%) |
| 5:00 AM to 5:29 AM | 40 (15.9%) | 0 (0.0%) |
| 5:30 AM to 5:59 AM | 0 (0.0%) | 0 (0.0%) |
| 6:00 AM to 6:29 AM | 0 (0.0%) | 18 (12.6%) |
| 6:30 AM to 6:59 AM | 0 (0.0%) | 65 (45.5%) |
| 7:00 AM to 7:29 AM | 0 (0.0%) | 45 (31.5%) |
| 7:30 AM to 7:59 AM | 0 (0.0%) | 15 (10.5%) |
| 8:00 AM to 8:29 AM | 0 (0.0%) | 0 (0.0%) |
| 8:30 AM to 8:59 AM | 0 (0.0%) | 0 (0.0%) |
| 9:00 AM to 9:59 AM | 0 (0.0%) | 0 (0.0%) |
| 10:00 AM to 10:59 AM | 0 (0.0%) | 0 (0.0%) |
| 11:00 AM to 11:59 AM | 0 (0.0%) | 0 (0.0%) |
| 12:00 PM to 3:59 PM | 212 (84.1%) | 0 (0.0%) |
| 4:00 PM to 11:59 PM | 0 (0.0%) | 0 (0.0%) |
| Total | 252 (100.0%) | 143 (100.0%) |
Housing Occupancy in Los Llanos
Occupancy by Ownership in Los Llanos
Of the total 685 dwellings in Los Llanos, owner-occupied units account for 615 (89.8%), while renter-occupied units make up 70 (10.2%).
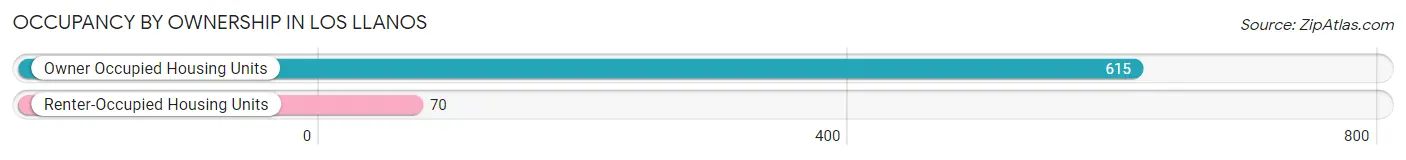
| Occupancy | # Housing Units | % Housing Units |
| Owner Occupied Housing Units | 615 | 89.8% |
| Renter-Occupied Housing Units | 70 | 10.2% |
| Total Occupied Housing Units | 685 | 100.0% |
Occupancy by Household Size in Los Llanos
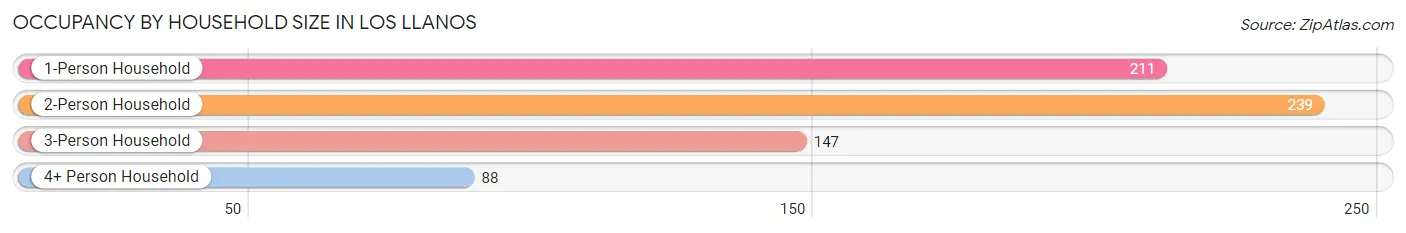
| Household Size | # Housing Units | % Housing Units |
| 1-Person Household | 211 | 30.8% |
| 2-Person Household | 239 | 34.9% |
| 3-Person Household | 147 | 21.5% |
| 4+ Person Household | 88 | 12.9% |
| Total Housing Units | 685 | 100.0% |
Occupancy by Ownership by Household Size in Los Llanos
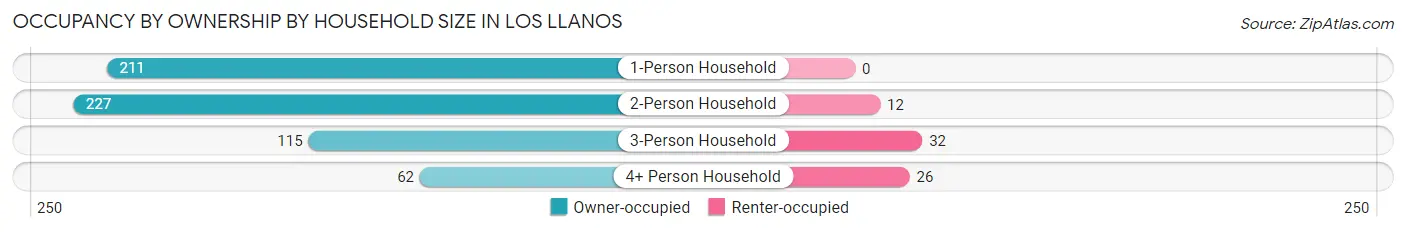
| Household Size | Owner-occupied | Renter-occupied |
| 1-Person Household | 211 (100.0%) | 0 (0.0%) |
| 2-Person Household | 227 (95.0%) | 12 (5.0%) |
| 3-Person Household | 115 (78.2%) | 32 (21.8%) |
| 4+ Person Household | 62 (70.5%) | 26 (29.5%) |
| Total Housing Units | 615 (89.8%) | 70 (10.2%) |
Occupancy by Educational Attainment in Los Llanos
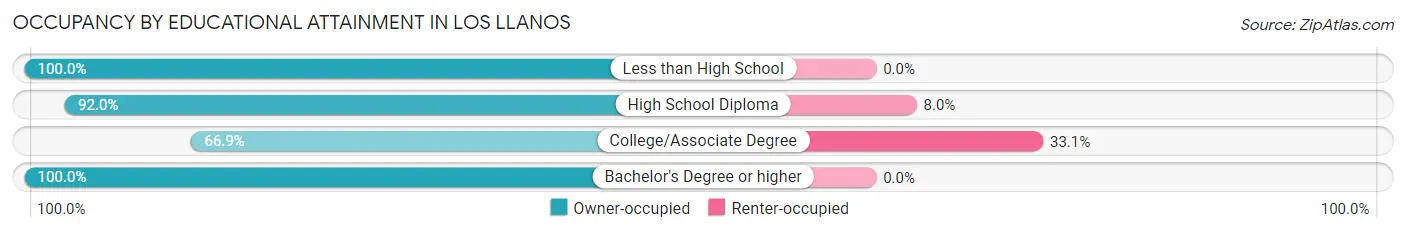
| Household Size | Owner-occupied | Renter-occupied |
| Less than High School | 132 (100.0%) | 0 (0.0%) |
| High School Diploma | 298 (92.0%) | 26 (8.0%) |
| College/Associate Degree | 89 (66.9%) | 44 (33.1%) |
| Bachelor's Degree or higher | 96 (100.0%) | 0 (0.0%) |
Occupancy by Age of Householder in Los Llanos
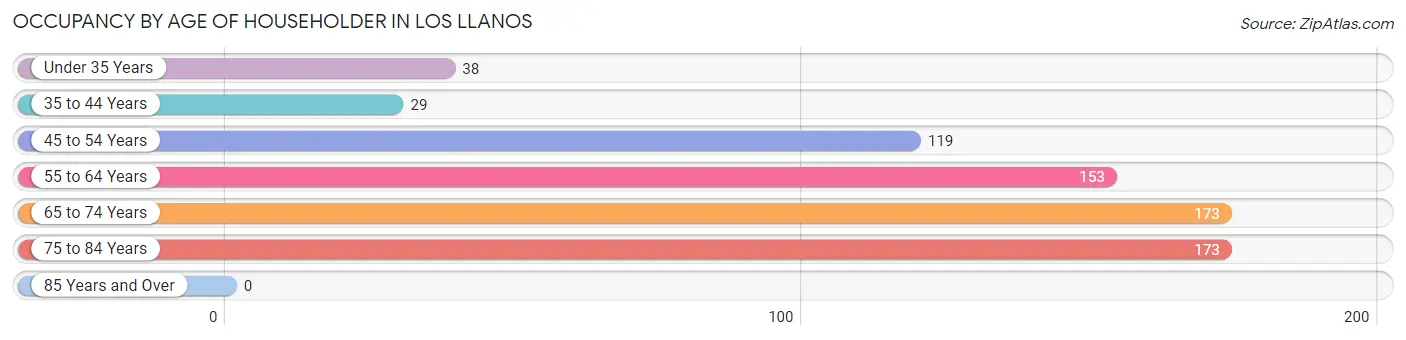
| Age Bracket | # Households | % Households |
| Under 35 Years | 38 | 5.6% |
| 35 to 44 Years | 29 | 4.2% |
| 45 to 54 Years | 119 | 17.4% |
| 55 to 64 Years | 153 | 22.3% |
| 65 to 74 Years | 173 | 25.3% |
| 75 to 84 Years | 173 | 25.3% |
| 85 Years and Over | 0 | 0.0% |
| Total | 685 | 100.0% |
Housing Finances in Los Llanos
Median Income by Occupancy in Los Llanos
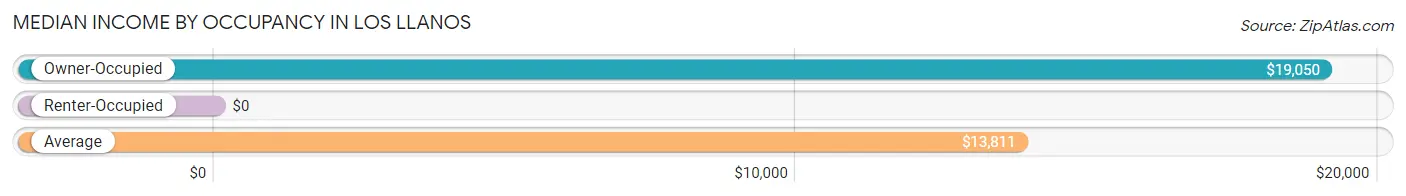
| Occupancy Type | # Households | Median Income |
| Owner-Occupied | 615 (89.8%) | $19,050 |
| Renter-Occupied | 70 (10.2%) | $0 |
| Average | 685 (100.0%) | $13,811 |
Occupancy by Householder Income Bracket in Los Llanos
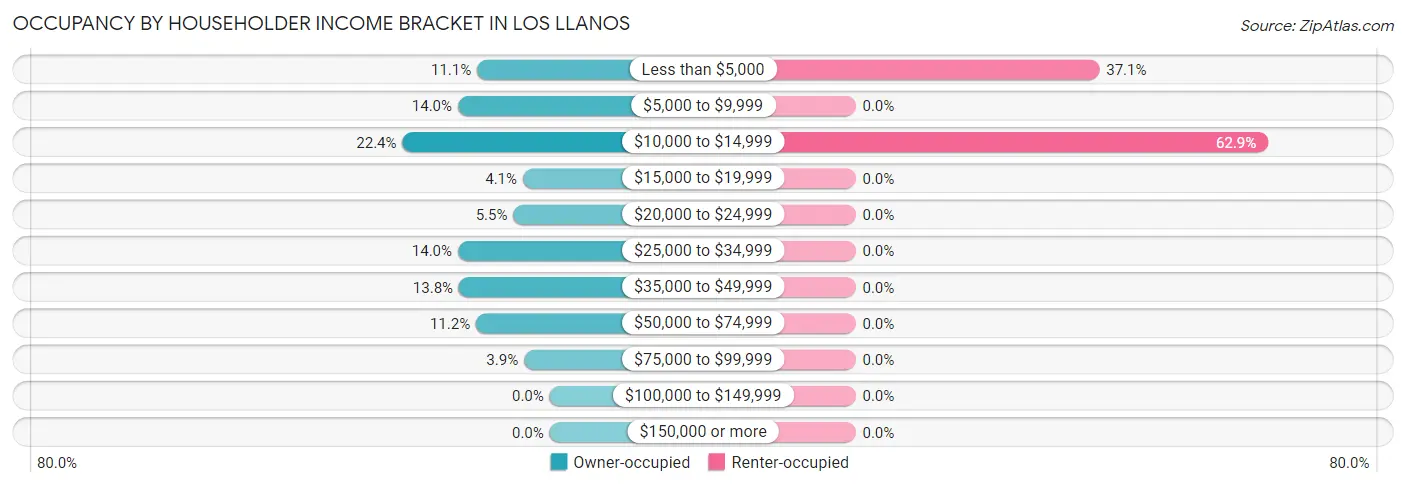
| Income Bracket | Owner-occupied | Renter-occupied |
| Less than $5,000 | 68 (11.1%) | 26 (37.1%) |
| $5,000 to $9,999 | 86 (14.0%) | 0 (0.0%) |
| $10,000 to $14,999 | 138 (22.4%) | 44 (62.9%) |
| $15,000 to $19,999 | 25 (4.1%) | 0 (0.0%) |
| $20,000 to $24,999 | 34 (5.5%) | 0 (0.0%) |
| $25,000 to $34,999 | 86 (14.0%) | 0 (0.0%) |
| $35,000 to $49,999 | 85 (13.8%) | 0 (0.0%) |
| $50,000 to $74,999 | 69 (11.2%) | 0 (0.0%) |
| $75,000 to $99,999 | 24 (3.9%) | 0 (0.0%) |
| $100,000 to $149,999 | 0 (0.0%) | 0 (0.0%) |
| $150,000 or more | 0 (0.0%) | 0 (0.0%) |
| Total | 615 (100.0%) | 70 (100.0%) |
Monthly Housing Cost Tiers in Los Llanos
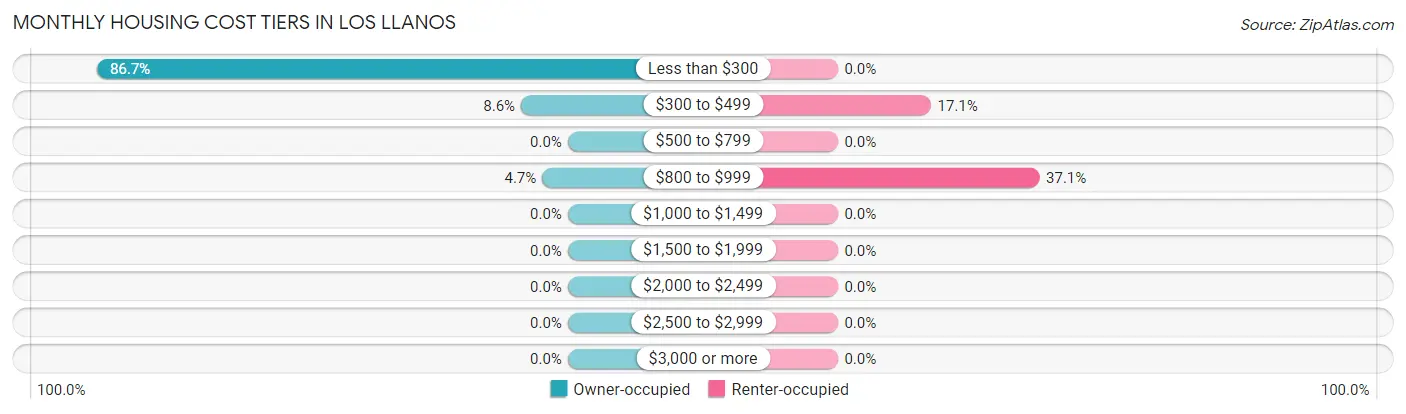
| Monthly Cost | Owner-occupied | Renter-occupied |
| Less than $300 | 533 (86.7%) | 0 (0.0%) |
| $300 to $499 | 53 (8.6%) | 12 (17.1%) |
| $500 to $799 | 0 (0.0%) | 0 (0.0%) |
| $800 to $999 | 29 (4.7%) | 26 (37.1%) |
| $1,000 to $1,499 | 0 (0.0%) | 0 (0.0%) |
| $1,500 to $1,999 | 0 (0.0%) | 0 (0.0%) |
| $2,000 to $2,499 | 0 (0.0%) | 0 (0.0%) |
| $2,500 to $2,999 | 0 (0.0%) | 0 (0.0%) |
| $3,000 or more | 0 (0.0%) | 0 (0.0%) |
| Total | 615 (100.0%) | 70 (100.0%) |
Physical Housing Characteristics in Los Llanos
Housing Structures in Los Llanos
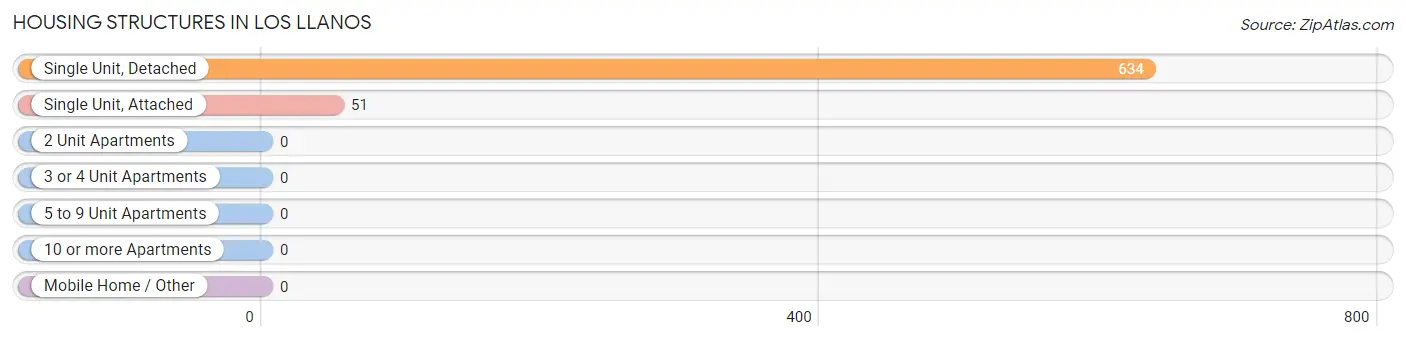
| Structure Type | # Housing Units | % Housing Units |
| Single Unit, Detached | 634 | 92.5% |
| Single Unit, Attached | 51 | 7.4% |
| 2 Unit Apartments | 0 | 0.0% |
| 3 or 4 Unit Apartments | 0 | 0.0% |
| 5 to 9 Unit Apartments | 0 | 0.0% |
| 10 or more Apartments | 0 | 0.0% |
| Mobile Home / Other | 0 | 0.0% |
| Total | 685 | 100.0% |
Housing Structures by Occupancy in Los Llanos
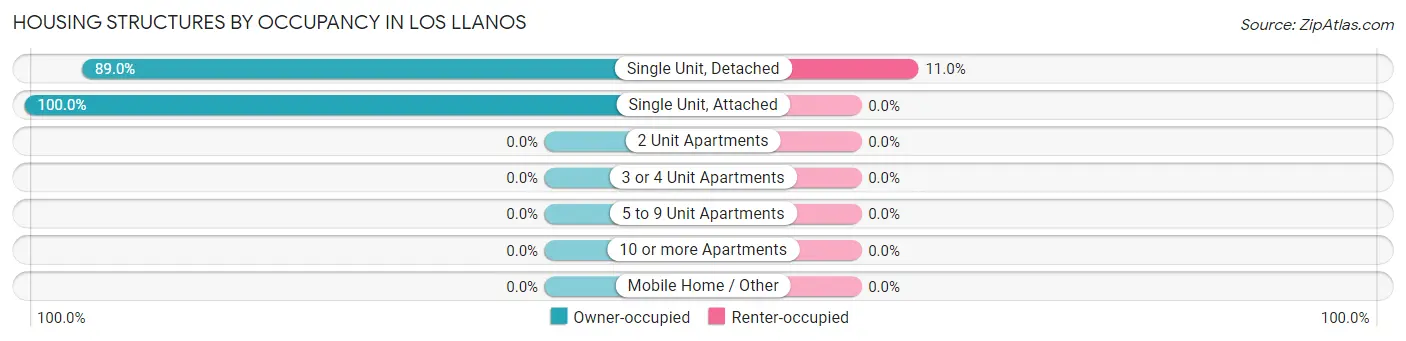
| Structure Type | Owner-occupied | Renter-occupied |
| Single Unit, Detached | 564 (89.0%) | 70 (11.0%) |
| Single Unit, Attached | 51 (100.0%) | 0 (0.0%) |
| 2 Unit Apartments | 0 (0.0%) | 0 (0.0%) |
| 3 or 4 Unit Apartments | 0 (0.0%) | 0 (0.0%) |
| 5 to 9 Unit Apartments | 0 (0.0%) | 0 (0.0%) |
| 10 or more Apartments | 0 (0.0%) | 0 (0.0%) |
| Mobile Home / Other | 0 (0.0%) | 0 (0.0%) |
| Total | 615 (89.8%) | 70 (10.2%) |
Housing Structures by Number of Rooms in Los Llanos
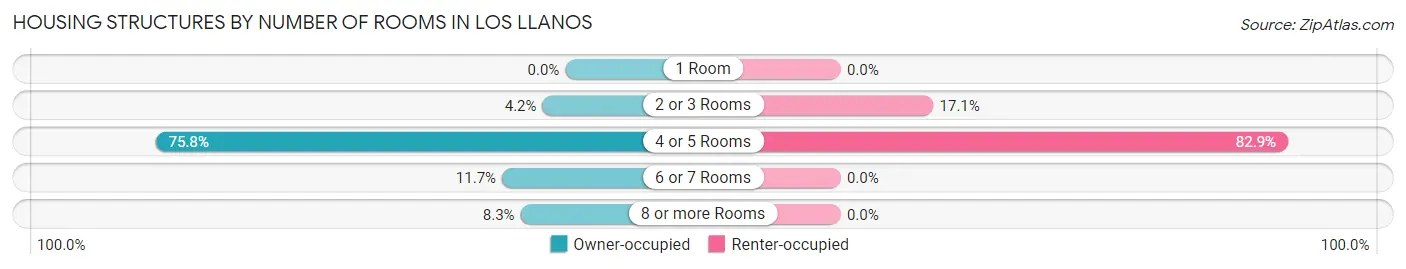
| Number of Rooms | Owner-occupied | Renter-occupied |
| 1 Room | 0 (0.0%) | 0 (0.0%) |
| 2 or 3 Rooms | 26 (4.2%) | 12 (17.1%) |
| 4 or 5 Rooms | 466 (75.8%) | 58 (82.9%) |
| 6 or 7 Rooms | 72 (11.7%) | 0 (0.0%) |
| 8 or more Rooms | 51 (8.3%) | 0 (0.0%) |
| Total | 615 (100.0%) | 70 (100.0%) |
Housing Structure by Heating Type in Los Llanos
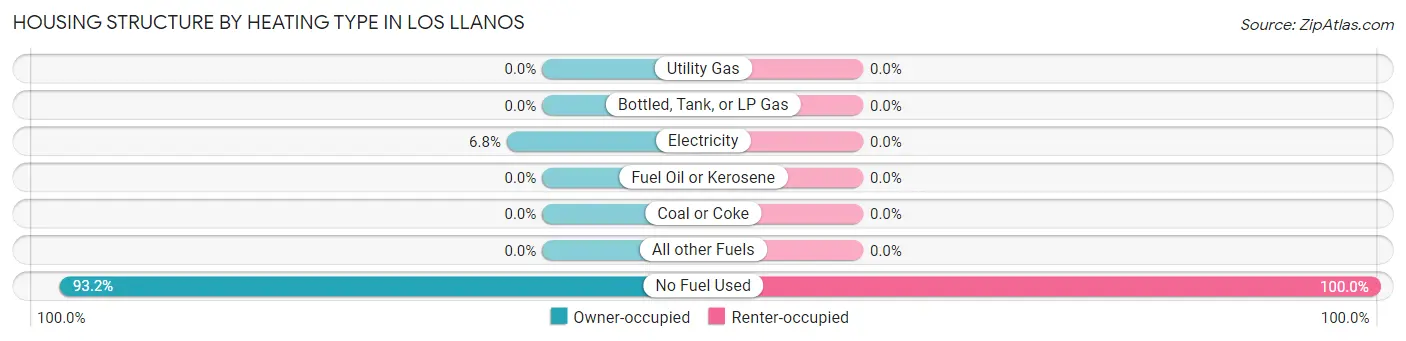
| Heating Type | Owner-occupied | Renter-occupied |
| Utility Gas | 0 (0.0%) | 0 (0.0%) |
| Bottled, Tank, or LP Gas | 0 (0.0%) | 0 (0.0%) |
| Electricity | 42 (6.8%) | 0 (0.0%) |
| Fuel Oil or Kerosene | 0 (0.0%) | 0 (0.0%) |
| Coal or Coke | 0 (0.0%) | 0 (0.0%) |
| All other Fuels | 0 (0.0%) | 0 (0.0%) |
| No Fuel Used | 573 (93.2%) | 70 (100.0%) |
| Total | 615 (100.0%) | 70 (100.0%) |
Household Vehicle Usage in Los Llanos
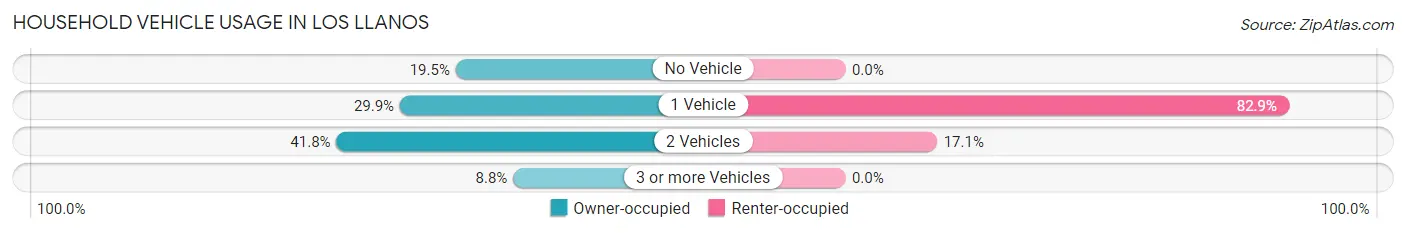
| Vehicles per Household | Owner-occupied | Renter-occupied |
| No Vehicle | 120 (19.5%) | 0 (0.0%) |
| 1 Vehicle | 184 (29.9%) | 58 (82.9%) |
| 2 Vehicles | 257 (41.8%) | 12 (17.1%) |
| 3 or more Vehicles | 54 (8.8%) | 0 (0.0%) |
| Total | 615 (100.0%) | 70 (100.0%) |
Real Estate & Mortgages in Los Llanos
Real Estate and Mortgage Overview in Los Llanos
| Characteristic | Without Mortgage | With Mortgage |
| Housing Units | 586 | 29 |
| Median Property Value | $87,700 | $0 |
| Median Household Income | $17,600 | $0 |
| Monthly Housing Costs | $144 | $0 |
| Real Estate Taxes | - | - |
Property Value by Mortgage Status in Los Llanos
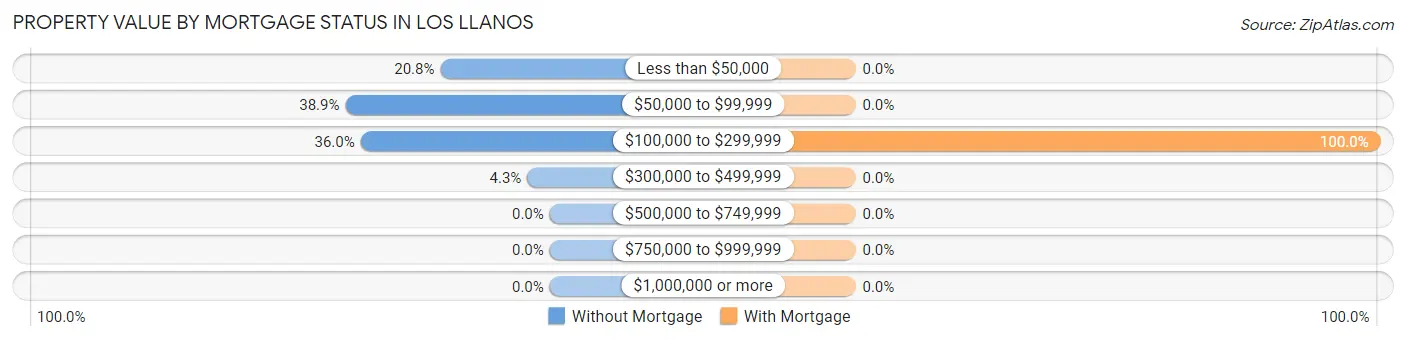
| Property Value | Without Mortgage | With Mortgage |
| Less than $50,000 | 122 (20.8%) | 0 (0.0%) |
| $50,000 to $99,999 | 228 (38.9%) | 0 (0.0%) |
| $100,000 to $299,999 | 211 (36.0%) | 29 (100.0%) |
| $300,000 to $499,999 | 25 (4.3%) | 0 (0.0%) |
| $500,000 to $749,999 | 0 (0.0%) | 0 (0.0%) |
| $750,000 to $999,999 | 0 (0.0%) | 0 (0.0%) |
| $1,000,000 or more | 0 (0.0%) | 0 (0.0%) |
| Total | 586 (100.0%) | 29 (100.0%) |
Household Income by Mortgage Status in Los Llanos
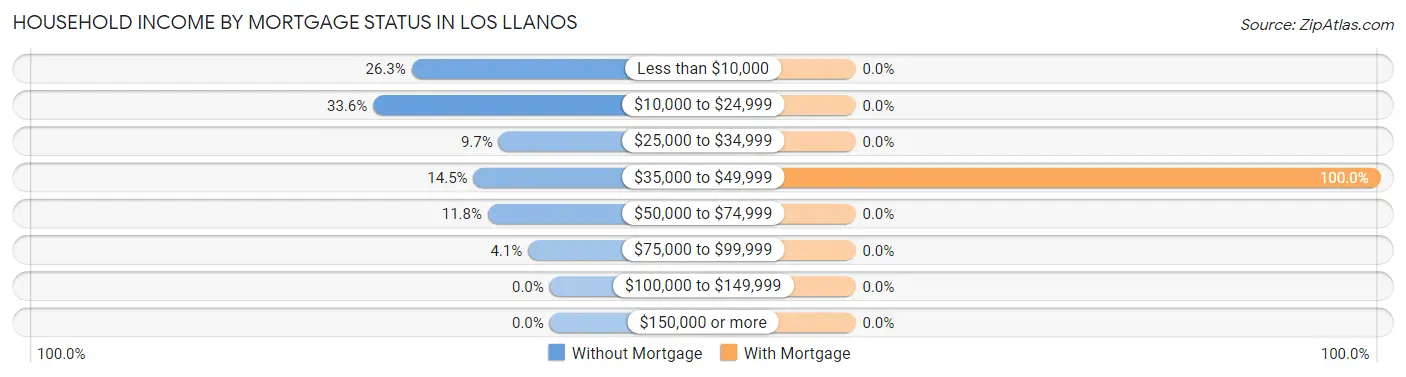
| Household Income | Without Mortgage | With Mortgage |
| Less than $10,000 | 154 (26.3%) | 0 (0.0%) |
| $10,000 to $24,999 | 197 (33.6%) | 0 (0.0%) |
| $25,000 to $34,999 | 57 (9.7%) | 0 (0.0%) |
| $35,000 to $49,999 | 85 (14.5%) | 29 (100.0%) |
| $50,000 to $74,999 | 69 (11.8%) | 0 (0.0%) |
| $75,000 to $99,999 | 24 (4.1%) | 0 (0.0%) |
| $100,000 to $149,999 | 0 (0.0%) | 0 (0.0%) |
| $150,000 or more | 0 (0.0%) | 0 (0.0%) |
| Total | 586 (100.0%) | 29 (100.0%) |
Property Value to Household Income Ratio in Los Llanos
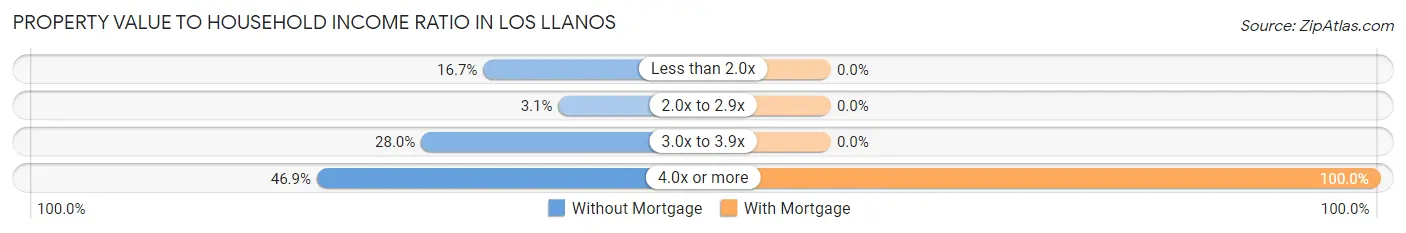
| Value-to-Income Ratio | Without Mortgage | With Mortgage |
| Less than 2.0x | 98 (16.7%) | 0 (0.0%) |
| 2.0x to 2.9x | 18 (3.1%) | 0 (0.0%) |
| 3.0x to 3.9x | 164 (28.0%) | 0 (0.0%) |
| 4.0x or more | 275 (46.9%) | 29 (100.0%) |
| Total | 586 (100.0%) | 29 (100.0%) |
Real Estate Taxes by Mortgage Status in Los Llanos
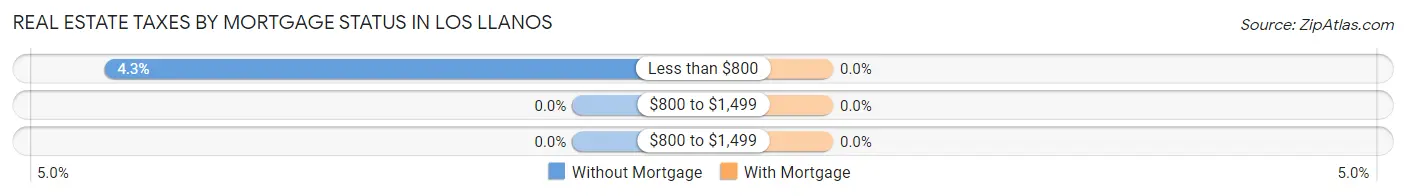
| Property Taxes | Without Mortgage | With Mortgage |
| Less than $800 | 25 (4.3%) | 0 (0.0%) |
| $800 to $1,499 | 0 (0.0%) | 0 (0.0%) |
| $800 to $1,499 | 0 (0.0%) | 0 (0.0%) |
| Total | 586 (100.0%) | 29 (100.0%) |
Health & Disability in Los Llanos
Health Insurance Coverage by Age in Los Llanos
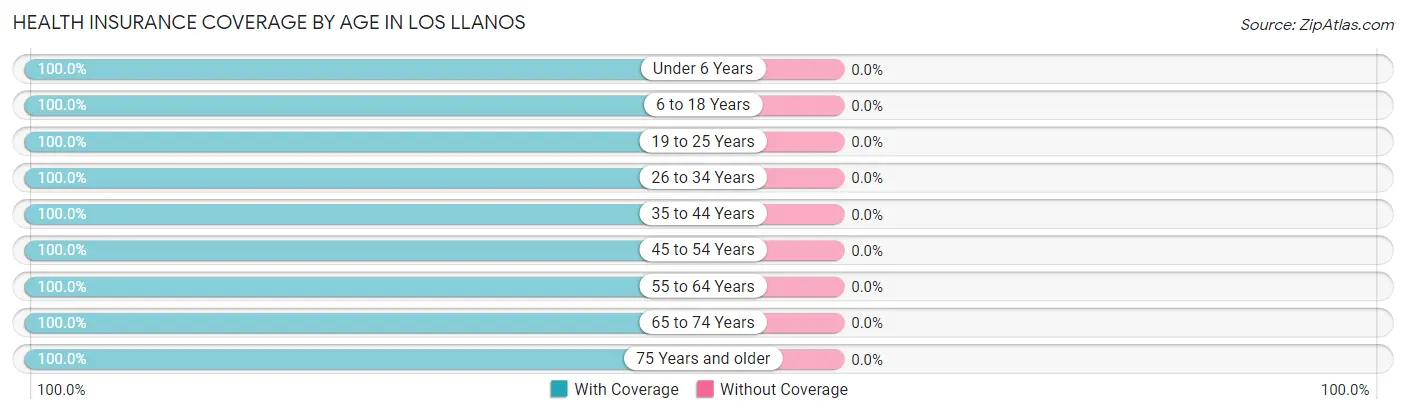
| Age Bracket | With Coverage | Without Coverage |
| Under 6 Years | 86 (100.0%) | 0 (0.0%) |
| 6 to 18 Years | 227 (100.0%) | 0 (0.0%) |
| 19 to 25 Years | 175 (100.0%) | 0 (0.0%) |
| 26 to 34 Years | 192 (100.0%) | 0 (0.0%) |
| 35 to 44 Years | 200 (100.0%) | 0 (0.0%) |
| 45 to 54 Years | 203 (100.0%) | 0 (0.0%) |
| 55 to 64 Years | 318 (100.0%) | 0 (0.0%) |
| 65 to 74 Years | 251 (100.0%) | 0 (0.0%) |
| 75 Years and older | 245 (100.0%) | 0 (0.0%) |
| Total | 1,897 (100.0%) | 0 (0.0%) |
Health Insurance Coverage by Citizenship Status in Los Llanos
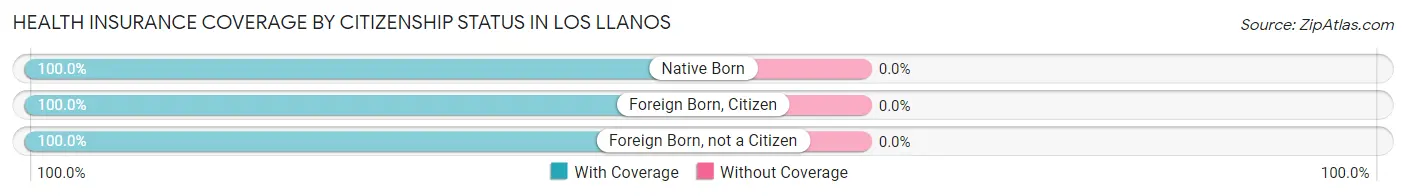
| Citizenship Status | With Coverage | Without Coverage |
| Native Born | 86 (100.0%) | 0 (0.0%) |
| Foreign Born, Citizen | 227 (100.0%) | 0 (0.0%) |
| Foreign Born, not a Citizen | 175 (100.0%) | 0 (0.0%) |
Health Insurance Coverage by Household Income in Los Llanos
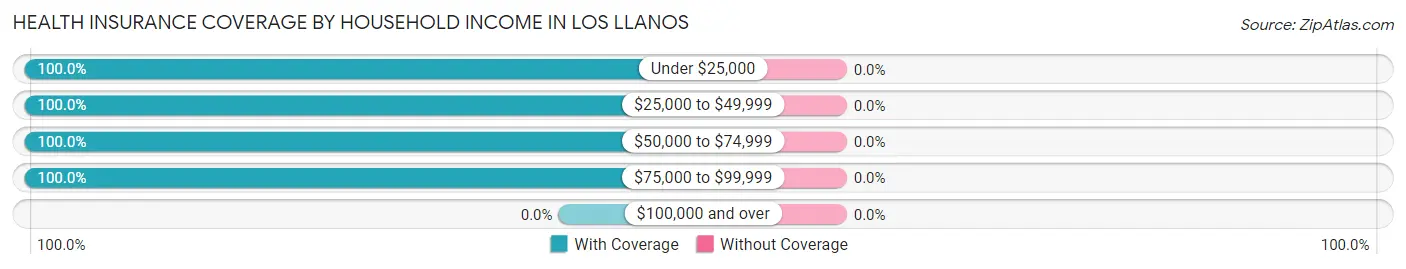
| Household Income | With Coverage | Without Coverage |
| Under $25,000 | 1,022 (100.0%) | 0 (0.0%) |
| $25,000 to $49,999 | 512 (100.0%) | 0 (0.0%) |
| $50,000 to $74,999 | 327 (100.0%) | 0 (0.0%) |
| $75,000 to $99,999 | 36 (100.0%) | 0 (0.0%) |
| $100,000 and over | 0 (0.0%) | 0 (0.0%) |
Public vs Private Health Insurance Coverage by Age in Los Llanos
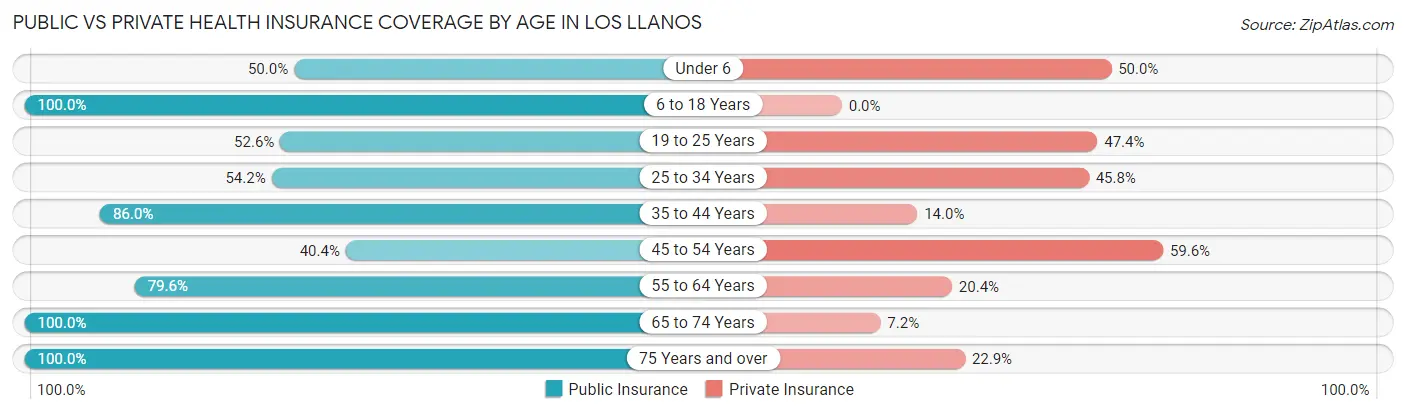
| Age Bracket | Public Insurance | Private Insurance |
| Under 6 | 43 (50.0%) | 43 (50.0%) |
| 6 to 18 Years | 227 (100.0%) | 0 (0.0%) |
| 19 to 25 Years | 92 (52.6%) | 83 (47.4%) |
| 25 to 34 Years | 104 (54.2%) | 88 (45.8%) |
| 35 to 44 Years | 172 (86.0%) | 28 (14.0%) |
| 45 to 54 Years | 82 (40.4%) | 121 (59.6%) |
| 55 to 64 Years | 253 (79.6%) | 65 (20.4%) |
| 65 to 74 Years | 251 (100.0%) | 18 (7.2%) |
| 75 Years and over | 245 (100.0%) | 56 (22.9%) |
| Total | 1,469 (77.4%) | 502 (26.5%) |
Disability Status by Sex by Age in Los Llanos
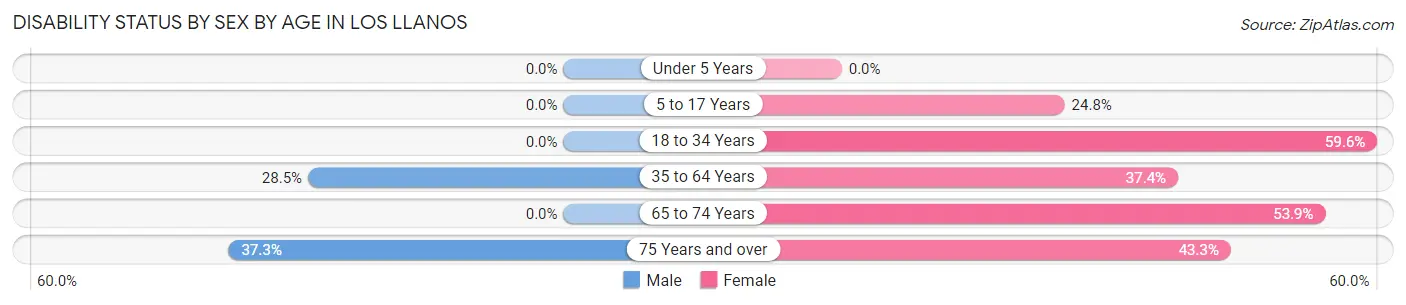
| Age Bracket | Male | Female |
| Under 5 Years | 0 (0.0%) | 0 (0.0%) |
| 5 to 17 Years | 0 (0.0%) | 34 (24.8%) |
| 18 to 34 Years | 0 (0.0%) | 124 (59.6%) |
| 35 to 64 Years | 101 (28.4%) | 137 (37.4%) |
| 65 to 74 Years | 0 (0.0%) | 84 (53.8%) |
| 75 Years and over | 44 (37.3%) | 55 (43.3%) |
Disability Class by Sex by Age in Los Llanos
Disability Class: Hearing Difficulty
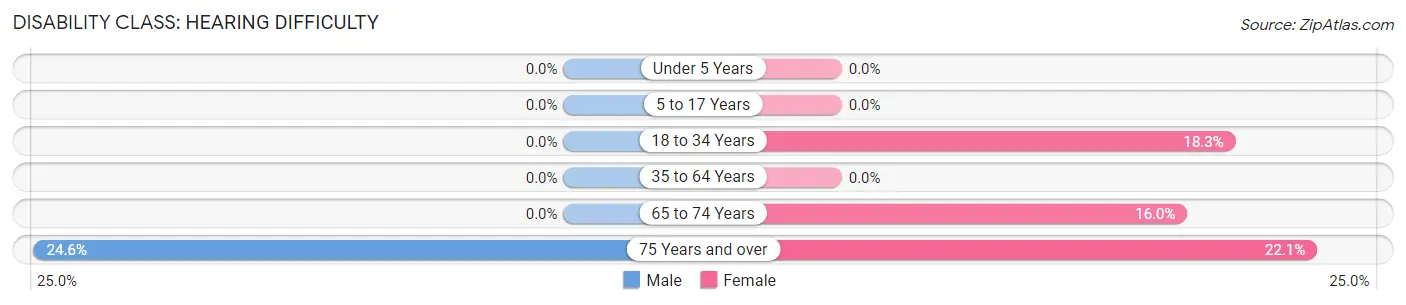
| Age Bracket | Male | Female |
| Under 5 Years | 0 (0.0%) | 0 (0.0%) |
| 5 to 17 Years | 0 (0.0%) | 0 (0.0%) |
| 18 to 34 Years | 0 (0.0%) | 38 (18.3%) |
| 35 to 64 Years | 0 (0.0%) | 0 (0.0%) |
| 65 to 74 Years | 0 (0.0%) | 25 (16.0%) |
| 75 Years and over | 29 (24.6%) | 28 (22.1%) |
Disability Class: Vision Difficulty
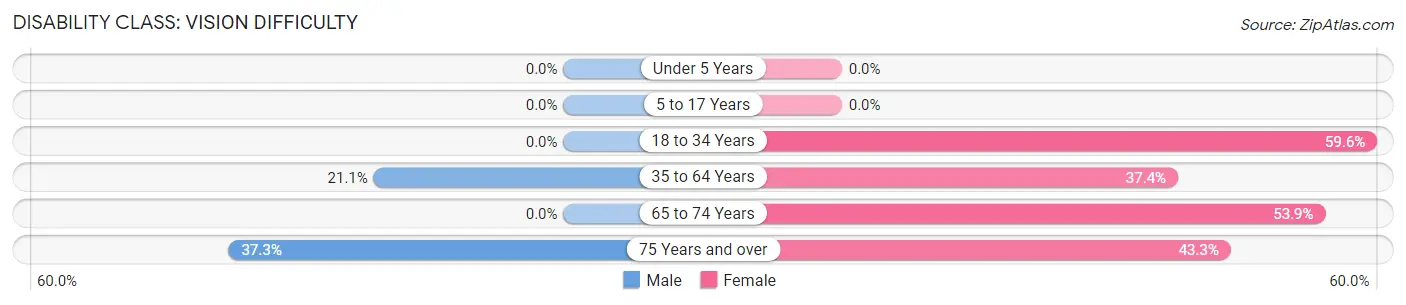
| Age Bracket | Male | Female |
| Under 5 Years | 0 (0.0%) | 0 (0.0%) |
| 5 to 17 Years | 0 (0.0%) | 0 (0.0%) |
| 18 to 34 Years | 0 (0.0%) | 124 (59.6%) |
| 35 to 64 Years | 75 (21.1%) | 137 (37.4%) |
| 65 to 74 Years | 0 (0.0%) | 84 (53.8%) |
| 75 Years and over | 44 (37.3%) | 55 (43.3%) |
Disability Class: Cognitive Difficulty
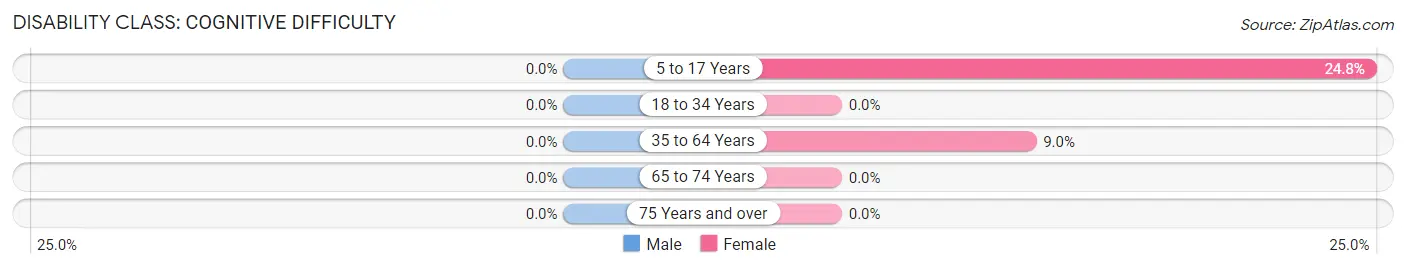
| Age Bracket | Male | Female |
| 5 to 17 Years | 0 (0.0%) | 34 (24.8%) |
| 18 to 34 Years | 0 (0.0%) | 0 (0.0%) |
| 35 to 64 Years | 0 (0.0%) | 33 (9.0%) |
| 65 to 74 Years | 0 (0.0%) | 0 (0.0%) |
| 75 Years and over | 0 (0.0%) | 0 (0.0%) |
Disability Class: Ambulatory Difficulty
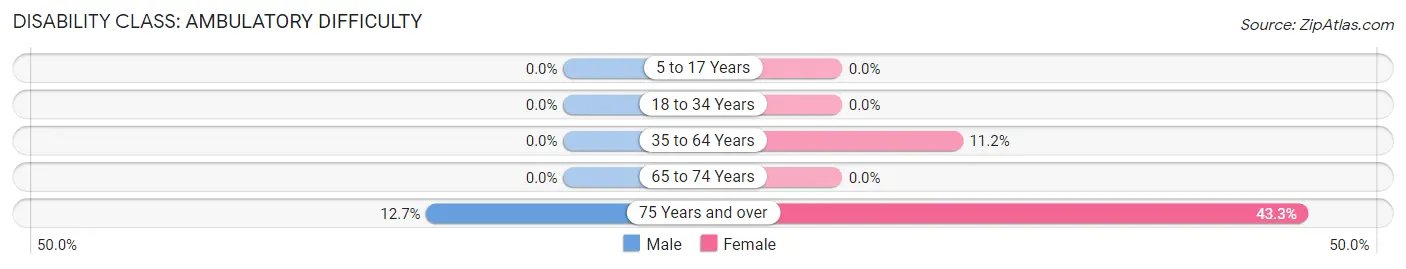
| Age Bracket | Male | Female |
| 5 to 17 Years | 0 (0.0%) | 0 (0.0%) |
| 18 to 34 Years | 0 (0.0%) | 0 (0.0%) |
| 35 to 64 Years | 0 (0.0%) | 41 (11.2%) |
| 65 to 74 Years | 0 (0.0%) | 0 (0.0%) |
| 75 Years and over | 15 (12.7%) | 55 (43.3%) |
Disability Class: Self-Care Difficulty
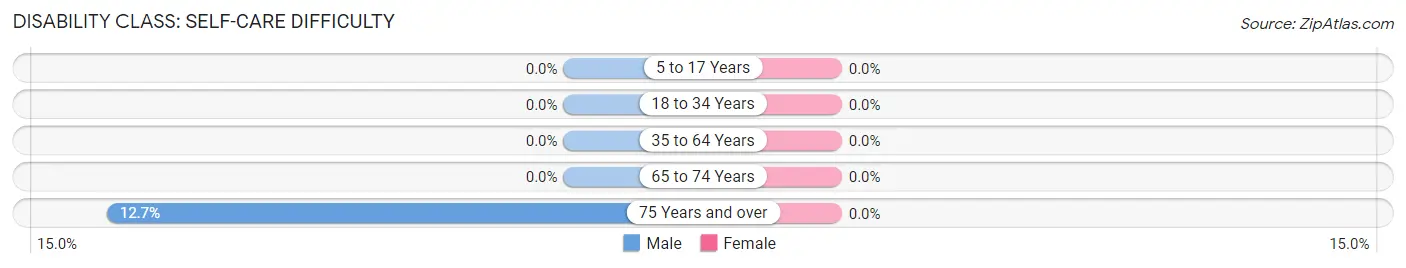
| Age Bracket | Male | Female |
| 5 to 17 Years | 0 (0.0%) | 0 (0.0%) |
| 18 to 34 Years | 0 (0.0%) | 0 (0.0%) |
| 35 to 64 Years | 0 (0.0%) | 0 (0.0%) |
| 65 to 74 Years | 0 (0.0%) | 0 (0.0%) |
| 75 Years and over | 15 (12.7%) | 0 (0.0%) |
Technology Access in Los Llanos
Computing Device Access in Los Llanos
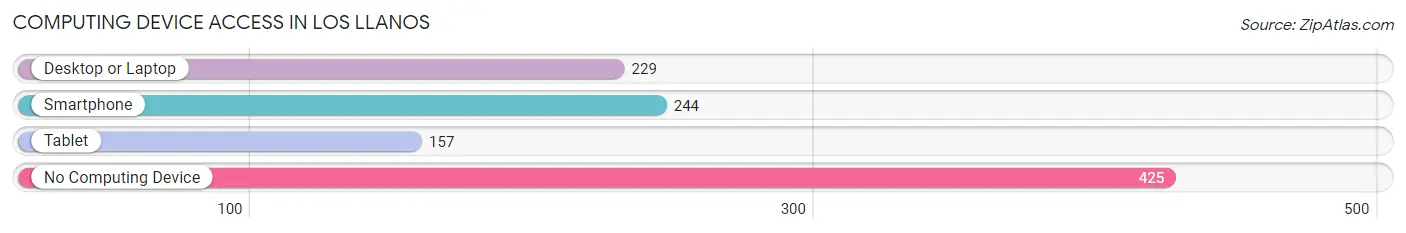
| Device Type | # Households | % Households |
| Desktop or Laptop | 229 | 33.4% |
| Smartphone | 244 | 35.6% |
| Tablet | 157 | 22.9% |
| No Computing Device | 425 | 62.0% |
| Total | 685 | 100.0% |
Internet Access in Los Llanos
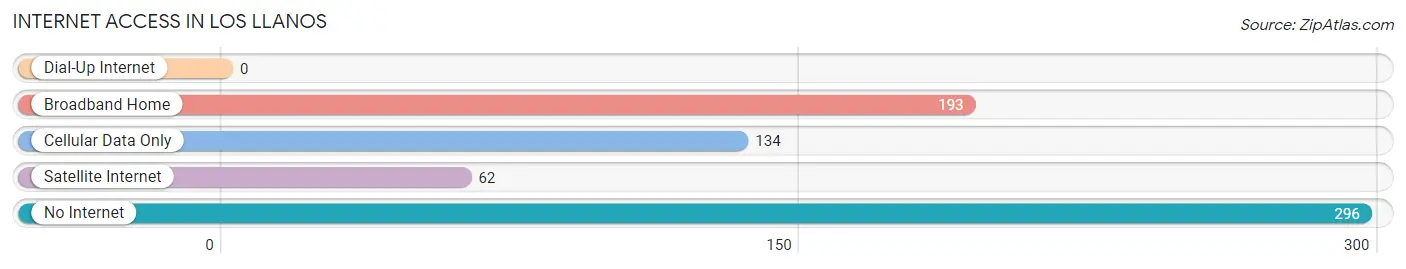
| Internet Type | # Households | % Households |
| Dial-Up Internet | 0 | 0.0% |
| Broadband Home | 193 | 28.2% |
| Cellular Data Only | 134 | 19.6% |
| Satellite Internet | 62 | 9.0% |
| No Internet | 296 | 43.2% |
| Total | 685 | 100.0% |
Los Llanos Summary
Los Llanos is a municipality located in the eastern region of Puerto Rico. It is part of the San Juan-Caguas-Guaynabo Metropolitan Statistical Area. The municipality is bordered by the municipalities of San Lorenzo, Yabucoa, and Maunabo. As of the 2010 census, the population of Los Llanos was 8,845.
Geography
Los Llanos is located in the eastern region of Puerto Rico, in the municipality of Yabucoa. It is bordered by the municipalities of San Lorenzo, Yabucoa, and Maunabo. The municipality has a total area of 11.7 square miles, of which 11.6 square miles is land and 0.1 square miles is water. The terrain is mostly flat, with some hills in the northern part of the municipality.
Climate
Los Llanos has a tropical climate, with temperatures ranging from the mid-70s to the mid-80s Fahrenheit. The average annual precipitation is around 50 inches.
History
Los Llanos was founded in 1815 by Don Juan de la Cruz. The name of the municipality comes from the Spanish word for “plains”, referring to the flat terrain of the area. The municipality was originally part of the municipality of Yabucoa, but was separated in 1825.
Economy
The economy of Los Llanos is largely based on agriculture. The main crops grown in the municipality are sugarcane, coffee, and bananas. The municipality also has a small manufacturing sector, with several small factories producing clothing, furniture, and other goods.
Demographics
As of the 2010 census, the population of Los Llanos was 8,845. The population is mostly of Puerto Rican descent, with a small minority of African and European descent. The median household income in the municipality is $17,845, and the poverty rate is 44.3%. The majority of the population is Roman Catholic, with a small minority of other Christian denominations.
Conclusion
Los Llanos is a municipality located in the eastern region of Puerto Rico. It is bordered by the municipalities of San Lorenzo, Yabucoa, and Maunabo. The municipality has a total area of 11.7 square miles, and a population of 8,845 as of the 2010 census. The economy of Los Llanos is largely based on agriculture, with the main crops being sugarcane, coffee, and bananas. The population is mostly of Puerto Rican descent, with a small minority of African and European descent. The median household income in the municipality is $17,845, and the poverty rate is 44.3%.
Common Questions
What is Per Capita Income in Los Llanos?
Per Capita income in Los Llanos is $9,467.
What is the Median Family Income in Los Llanos?
Median Family Income in Los Llanos is $22,981.
What is the Median Household income in Los Llanos?
Median Household Income in Los Llanos is $13,811.
What is Income or Wage Gap in Los Llanos?
Income or Wage Gap in Los Llanos is 59.2%.
Women in Los Llanos earn 40.8 cents for every dollar earned by a man.
What is Inequality or Gini Index in Los Llanos?
Inequality or Gini Index in Los Llanos is 0.47.
What is the Total Population of Los Llanos?
Total Population of Los Llanos is 1,916.
What is the Total Male Population of Los Llanos?
Total Male Population of Los Llanos is 869.
What is the Total Female Population of Los Llanos?
Total Female Population of Los Llanos is 1,047.
What is the Ratio of Males per 100 Females in Los Llanos?
There are 83.00 Males per 100 Females in Los Llanos.
What is the Ratio of Females per 100 Males in Los Llanos?
There are 120.48 Females per 100 Males in Los Llanos.
What is the Median Population Age in Los Llanos?
Median Population Age in Los Llanos is 50.2 Years.
What is the Average Family Size in Los Llanos
Average Family Size in Los Llanos is 3.5 People.
What is the Average Household Size in Los Llanos
Average Household Size in Los Llanos is 2.8 People.
How Large is the Labor Force in Los Llanos?
There are 480 People in the Labor Forcein in Los Llanos.
What is the Percentage of People in the Labor Force in Los Llanos?
29.3% of People are in the Labor Force in Los Llanos.