Zip Codes with the Highest Percentage of Population with a Degree in Science and Engineering in San Juan, PR
RELATED REPORTS & OPTIONS
Science and Engineering
San Juan
Compare Zip Codes
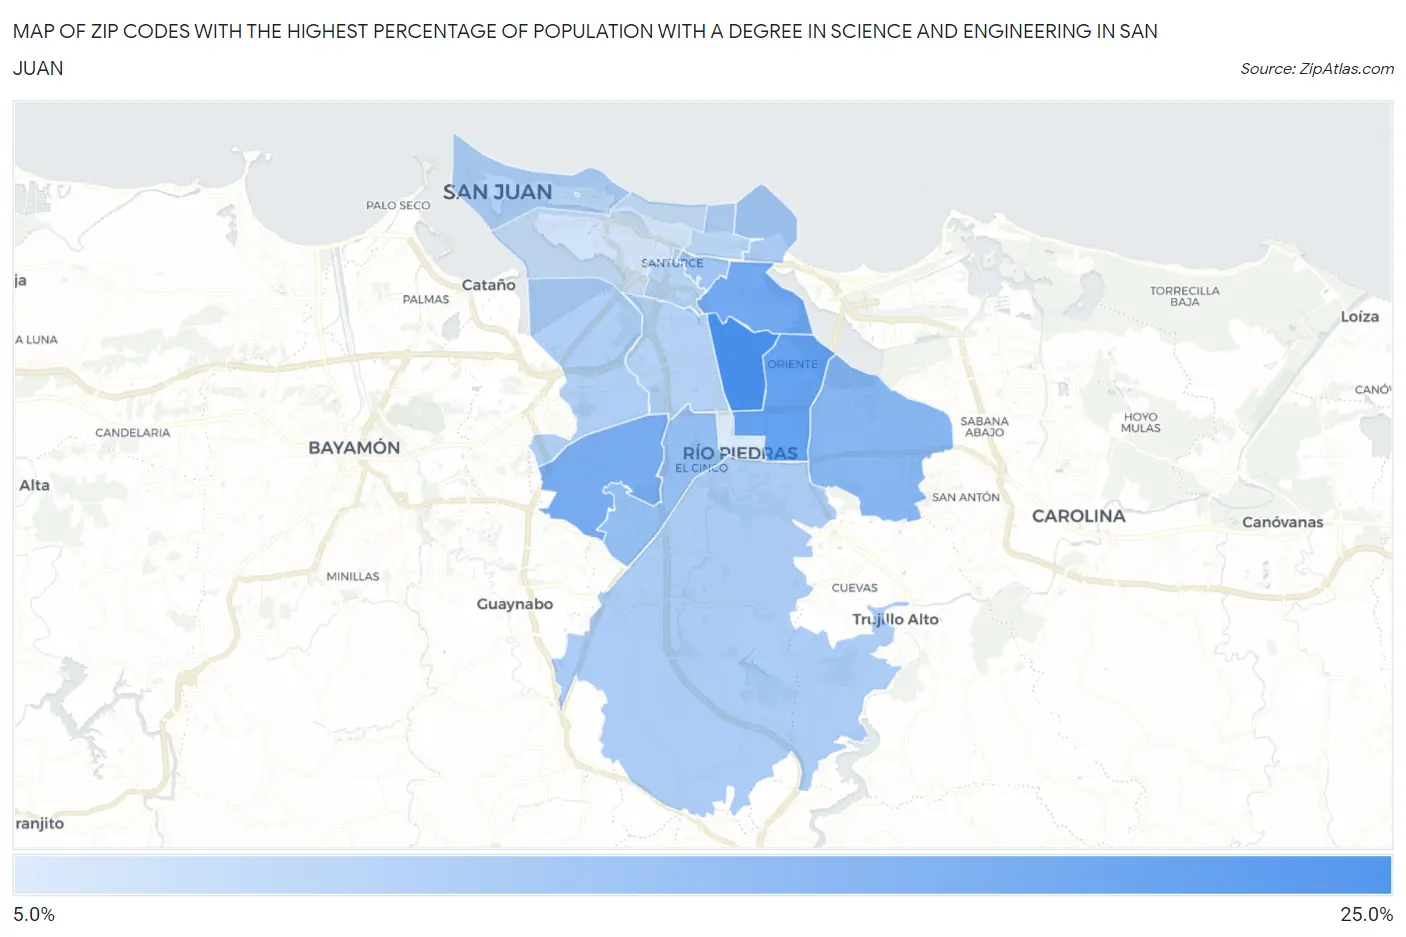
Map of Zip Codes with the Highest Percentage of Population with a Degree in Science and Engineering in San Juan
5.4%
20.0%
Zip Codes with the Highest Percentage of Population with a Degree in Science and Engineering in San Juan, PR
| Zip Code | % Graduates | vs State | vs National | |
| 1. | 00917 | 20.0% | 12.4%(+7.61)#13 | 9.8%(+10.3)#3,312 |
| 2. | 00923 | 16.9% | 12.4%(+4.48)#22 | 9.8%(+7.12)#5,021 |
| 3. | 00915 | 15.7% | 12.4%(+3.29)#30 | 9.8%(+5.93)#5,970 |
| 4. | 00906 | 15.2% | 12.4%(+2.73)#36 | 9.8%(+5.37)#6,563 |
| 5. | 00921 | 15.1% | 12.4%(+2.70)#37 | 9.8%(+5.34)#6,582 |
| 6. | 00924 | 13.4% | 12.4%(+1.01)#56 | 9.8%(+3.66)#8,582 |
| 7. | 00927 | 12.2% | 12.4%(-0.275)#68 | 9.8%(+2.37)#10,632 |
| 8. | 00912 | 11.1% | 12.4%(-1.35)#85 | 9.8%(+1.29)#12,720 |
| 9. | 00913 | 10.1% | 12.4%(-2.30)#99 | 9.8%(+0.340)#14,765 |
| 10. | 00926 | 9.9% | 12.4%(-2.54)#100 | 9.8%(+0.105)#15,298 |
| 11. | 00920 | 9.5% | 12.4%(-2.92)#105 | 9.8%(-0.279)#16,163 |
| 12. | 00901 | 9.1% | 12.4%(-3.36)#108 | 9.8%(-0.714)#17,179 |
| 13. | 00918 | 9.1% | 12.4%(-3.36)#110 | 9.8%(-0.720)#17,195 |
| 14. | 00911 | 8.6% | 12.4%(-3.83)#113 | 9.8%(-1.19)#18,264 |
| 15. | 00909 | 8.6% | 12.4%(-3.85)#114 | 9.8%(-1.20)#18,293 |
| 16. | 00907 | 6.5% | 12.4%(-5.95)#120 | 9.8%(-3.31)#22,633 |
| 17. | 00925 | 5.4% | 12.4%(-7.04)#122 | 9.8%(-4.40)#24,274 |
1
Common Questions
What are the Top 10 Zip Codes with the Highest Percentage of Population with a Degree in Science and Engineering in San Juan, PR?
Top 10 Zip Codes with the Highest Percentage of Population with a Degree in Science and Engineering in San Juan, PR are:
What zip code has the Highest Percentage of Population with a Degree in Science and Engineering in San Juan, PR?
00917 has the Highest Percentage of Population with a Degree in Science and Engineering in San Juan, PR with 20.0%.
What is the Percentage of Population with a Degree in Science and Engineering in San Juan, PR?
Percentage of Population with a Degree in Science and Engineering in San Juan is 10.9%.
What is the Percentage of Population with a Degree in Science and Engineering in Puerto Rico?
Percentage of Population with a Degree in Science and Engineering in Puerto Rico is 12.4%.
What is the Percentage of Population with a Degree in Science and Engineering in the United States?
Percentage of Population with a Degree in Science and Engineering in the United States is 9.8%.