Parcelas Penuelas, PR Map & Demographics
Parcelas Penuelas Overview
$8,927
PER CAPITA INCOME
$15,433
AVG HOUSEHOLD INCOME
26.0%
WAGE / INCOME GAP [ % ]
74.0¢/ $1
WAGE / INCOME GAP [ $ ]
0.36
INEQUALITY / GINI INDEX
877
TOTAL POPULATION
485
MALE POPULATION
392
FEMALE POPULATION
123.72
MALES / 100 FEMALES
80.82
FEMALES / 100 MALES
45.3
MEDIAN AGE
3.1
AVG FAMILY SIZE
2.5
AVG HOUSEHOLD SIZE
404
LABOR FORCE [ PEOPLE ]
50.9%
PERCENT IN LABOR FORCE
Income in Parcelas Penuelas
Income Overview in Parcelas Penuelas
| Characteristic | Number | Measure |
| Per Capita Income | 877 | $8,927 |
| Median Family Income | 224 | $0 |
| Mean Family Income | 224 | $19,654 |
| Median Household Income | 353 | $15,433 |
| Mean Household Income | 353 | $18,806 |
| Income Deficit | 224 | $0 |
| Wage / Income Gap (%) | 877 | 25.97% |
| Wage / Income Gap ($) | 877 | 74.03¢ per $1 |
| Gini / Inequality Index | 877 | 0.36 |
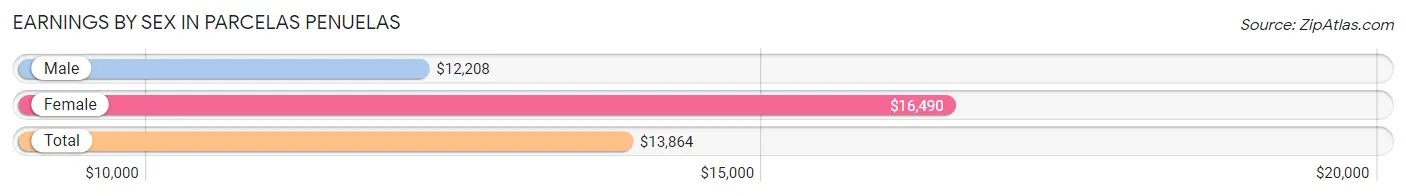
Earnings by Sex in Parcelas Penuelas
Average Earnings in Parcelas Penuelas are $13,864, $12,208 for men and $16,490 for women, a difference of 26.0%.
| Sex | Number | Average Earnings |
| Male | 231 (57.2%) | $12,208 |
| Female | 173 (42.8%) | $16,490 |
| Total | 404 (100.0%) | $13,864 |
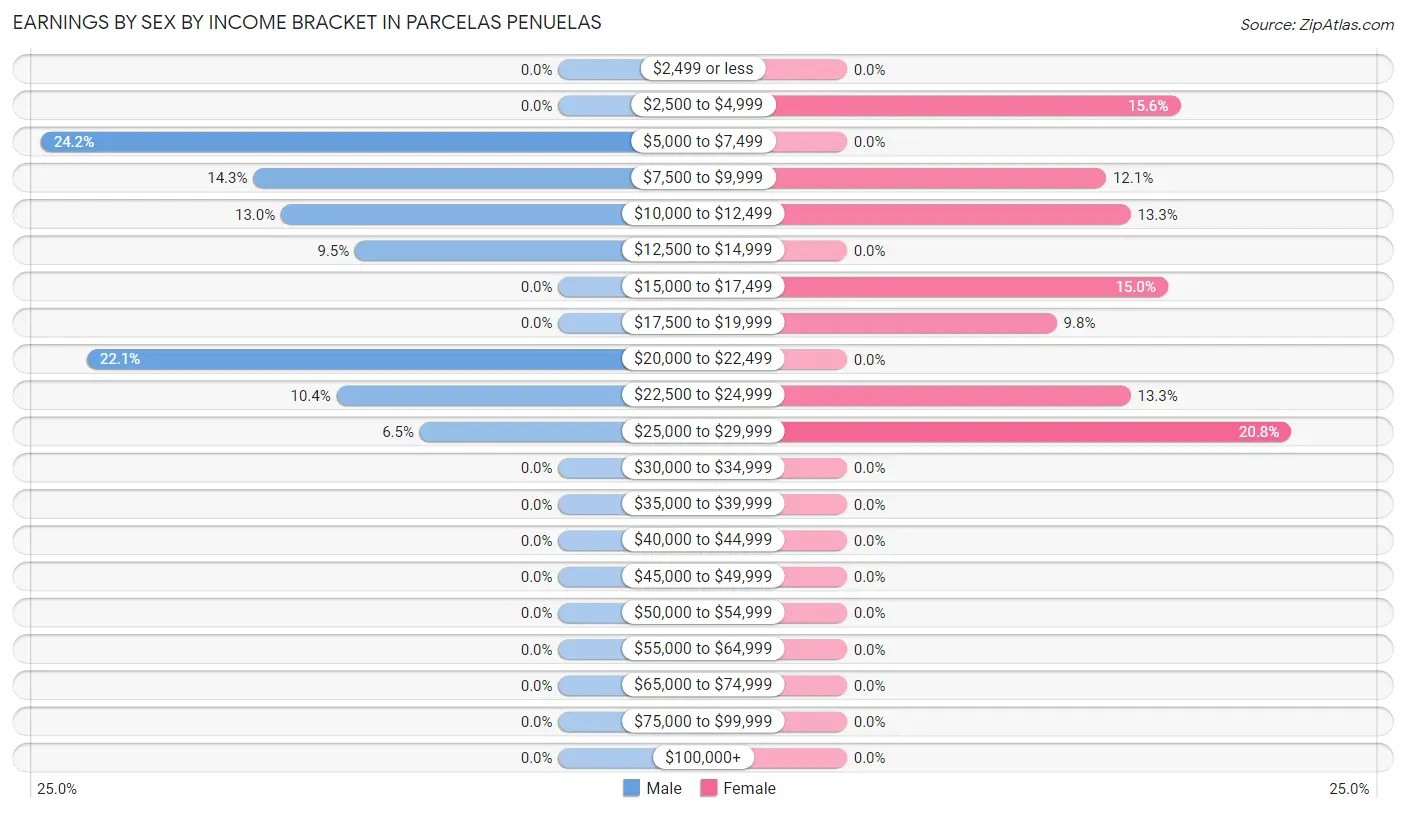
Earnings by Sex by Income Bracket in Parcelas Penuelas
The most common earnings brackets in Parcelas Penuelas are $5,000 to $7,499 for men (56 | 24.2%) and $25,000 to $29,999 for women (36 | 20.8%).
| Income | Male | Female |
| $2,499 or less | 0 (0.0%) | 0 (0.0%) |
| $2,500 to $4,999 | 0 (0.0%) | 27 (15.6%) |
| $5,000 to $7,499 | 56 (24.2%) | 0 (0.0%) |
| $7,500 to $9,999 | 33 (14.3%) | 21 (12.1%) |
| $10,000 to $12,499 | 30 (13.0%) | 23 (13.3%) |
| $12,500 to $14,999 | 22 (9.5%) | 0 (0.0%) |
| $15,000 to $17,499 | 0 (0.0%) | 26 (15.0%) |
| $17,500 to $19,999 | 0 (0.0%) | 17 (9.8%) |
| $20,000 to $22,499 | 51 (22.1%) | 0 (0.0%) |
| $22,500 to $24,999 | 24 (10.4%) | 23 (13.3%) |
| $25,000 to $29,999 | 15 (6.5%) | 36 (20.8%) |
| $30,000 to $34,999 | 0 (0.0%) | 0 (0.0%) |
| $35,000 to $39,999 | 0 (0.0%) | 0 (0.0%) |
| $40,000 to $44,999 | 0 (0.0%) | 0 (0.0%) |
| $45,000 to $49,999 | 0 (0.0%) | 0 (0.0%) |
| $50,000 to $54,999 | 0 (0.0%) | 0 (0.0%) |
| $55,000 to $64,999 | 0 (0.0%) | 0 (0.0%) |
| $65,000 to $74,999 | 0 (0.0%) | 0 (0.0%) |
| $75,000 to $99,999 | 0 (0.0%) | 0 (0.0%) |
| $100,000+ | 0 (0.0%) | 0 (0.0%) |
| Total | 231 (100.0%) | 173 (100.0%) |
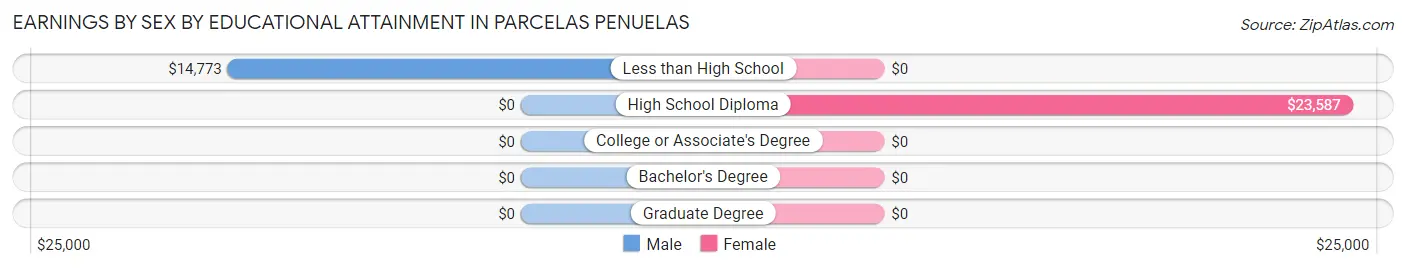
Earnings by Sex by Educational Attainment in Parcelas Penuelas
Average earnings in Parcelas Penuelas are $12,784 for men and $15,673 for women, a difference of 18.4%. Men with an educational attainment of less than high school enjoy the highest average annual earnings of $14,773, while those with less than high school education earn the least with $14,773. Women with an educational attainment of high school diploma earn the most with the average annual earnings of $23,587, while those with high school diploma education have the smallest earnings of $23,587.
| Educational Attainment | Male Income | Female Income |
| Less than High School | $14,773 | $0 |
| High School Diploma | - | - |
| College or Associate's Degree | - | - |
| Bachelor's Degree | - | - |
| Graduate Degree | - | - |
| Total | $12,784 | $15,673 |
Family Income in Parcelas Penuelas
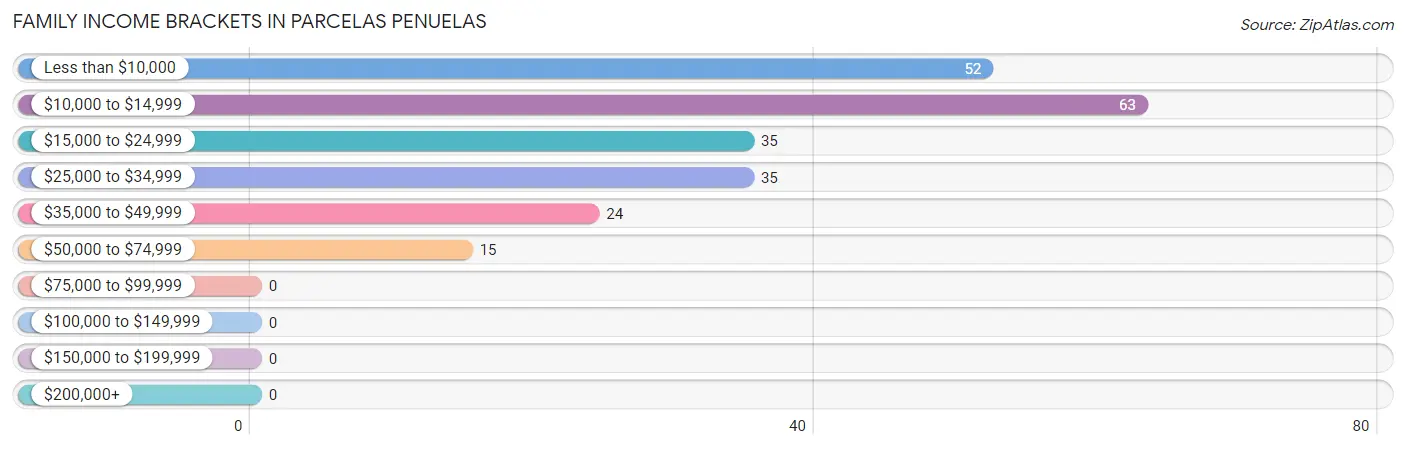
Family Income Brackets in Parcelas Penuelas
According to the Parcelas Penuelas family income data, there are 63 families falling into the $10,000 to $14,999 income range, which is the most common income bracket and makes up 28.1% of all families.
| Income Bracket | # Families | % Families |
| Less than $10,000 | 52 | 23.2% |
| $10,000 to $14,999 | 63 | 28.1% |
| $15,000 to $24,999 | 35 | 15.6% |
| $25,000 to $34,999 | 35 | 15.6% |
| $35,000 to $49,999 | 24 | 10.7% |
| $50,000 to $74,999 | 15 | 6.7% |
| $75,000 to $99,999 | 0 | 0.0% |
| $100,000 to $149,999 | 0 | 0.0% |
| $150,000 to $199,999 | 0 | 0.0% |
| $200,000+ | 0 | 0.0% |
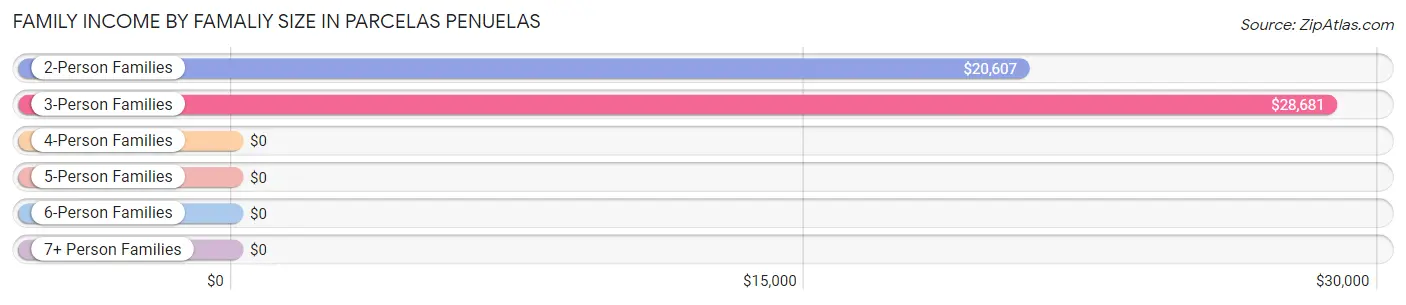
Family Income by Famaliy Size in Parcelas Penuelas
3-person families (49 | 21.9%) account for the highest median family income in Parcelas Penuelas with $28,681 per family, while 2-person families (135 | 60.3%) have the highest median income of $10,304 per family member.
| Income Bracket | # Families | Median Income |
| 2-Person Families | 135 (60.3%) | $20,607 |
| 3-Person Families | 49 (21.9%) | $28,681 |
| 4-Person Families | 40 (17.9%) | $0 |
| 5-Person Families | 0 (0.0%) | $0 |
| 6-Person Families | 0 (0.0%) | $0 |
| 7+ Person Families | 0 (0.0%) | $0 |
| Total | 224 (100.0%) | $0 |
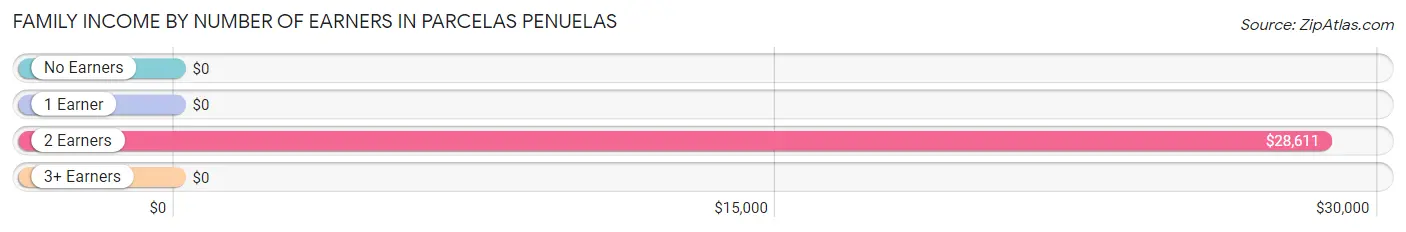
Family Income by Number of Earners in Parcelas Penuelas
| Number of Earners | # Families | Median Income |
| No Earners | 67 (29.9%) | $0 |
| 1 Earner | 107 (47.8%) | $0 |
| 2 Earners | 50 (22.3%) | $28,611 |
| 3+ Earners | 0 (0.0%) | $0 |
| Total | 224 (100.0%) | $0 |
Household Income in Parcelas Penuelas
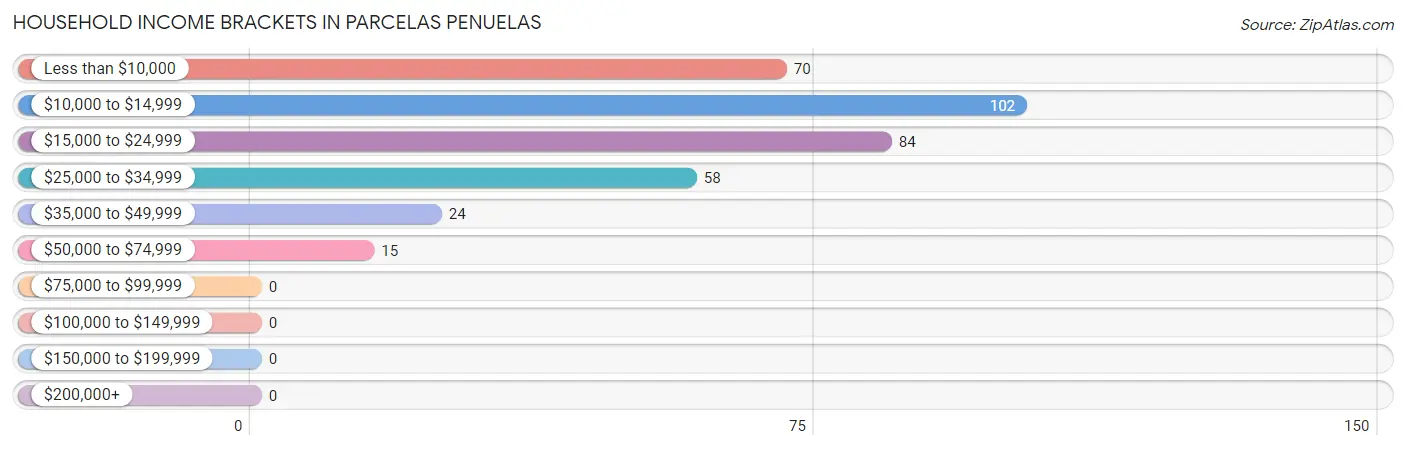
Household Income Brackets in Parcelas Penuelas
With 102 households falling in the category, the $10,000 to $14,999 income range is the most frequent in Parcelas Penuelas, accounting for 28.9% of all households.
| Income Bracket | # Households | % Households |
| Less than $10,000 | 70 | 19.8% |
| $10,000 to $14,999 | 102 | 28.9% |
| $15,000 to $24,999 | 84 | 23.8% |
| $25,000 to $34,999 | 58 | 16.4% |
| $35,000 to $49,999 | 24 | 6.8% |
| $50,000 to $74,999 | 15 | 4.2% |
| $75,000 to $99,999 | 0 | 0.0% |
| $100,000 to $149,999 | 0 | 0.0% |
| $150,000 to $199,999 | 0 | 0.0% |
| $200,000+ | 0 | 0.0% |
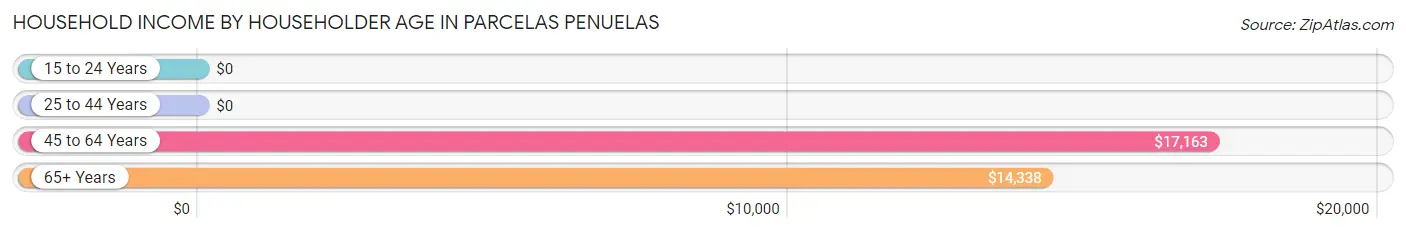
Household Income by Householder Age in Parcelas Penuelas
The median household income in Parcelas Penuelas is $15,433, with the highest median household income of $17,163 found in the 45 to 64 years age bracket for the primary householder. A total of 173 households (49.0%) fall into this category. Meanwhile, the 15 to 24 years age bracket for the primary householder has the lowest median household income of $0, with 12 households (3.4%) in this group.
| Income Bracket | # Households | Median Income |
| 15 to 24 Years | 12 (3.4%) | $0 |
| 25 to 44 Years | 97 (27.5%) | $0 |
| 45 to 64 Years | 173 (49.0%) | $17,163 |
| 65+ Years | 71 (20.1%) | $14,338 |
| Total | 353 (100.0%) | $15,433 |
Poverty in Parcelas Penuelas
Income Below Poverty by Sex and Age in Parcelas Penuelas
With 60.5% poverty level for males and 51.9% for females among the residents of Parcelas Penuelas, under 5 year old males and under 5 year old females are the most vulnerable to poverty, with 28 males (100.0%) and 27 females (100.0%) in their respective age groups living below the poverty level.
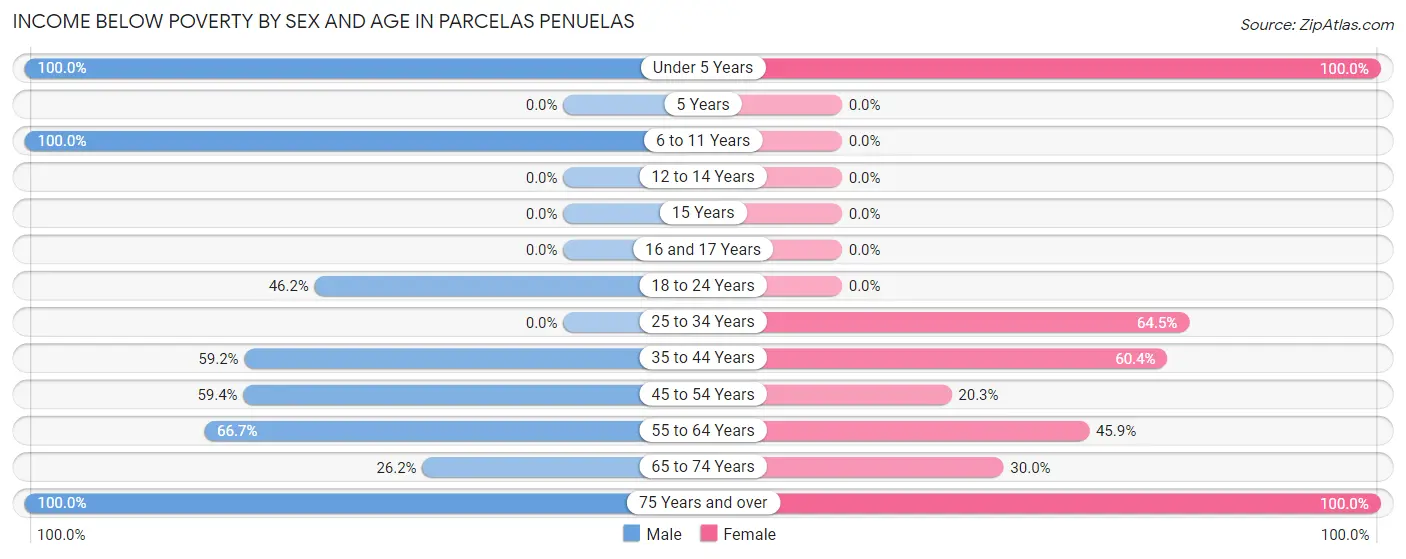
| Age Bracket | Male | Female |
| Under 5 Years | 28 (100.0%) | 27 (100.0%) |
| 5 Years | 0 (0.0%) | 0 (0.0%) |
| 6 to 11 Years | 28 (100.0%) | 0 (0.0%) |
| 12 to 14 Years | 0 (0.0%) | 0 (0.0%) |
| 15 Years | 0 (0.0%) | 0 (0.0%) |
| 16 and 17 Years | 0 (0.0%) | 0 (0.0%) |
| 18 to 24 Years | 12 (46.2%) | 0 (0.0%) |
| 25 to 34 Years | 0 (0.0%) | 49 (64.5%) |
| 35 to 44 Years | 74 (59.2%) | 55 (60.4%) |
| 45 to 54 Years | 57 (59.4%) | 12 (20.3%) |
| 55 to 64 Years | 42 (66.7%) | 39 (45.9%) |
| 65 to 74 Years | 17 (26.2%) | 6 (30.0%) |
| 75 Years and over | 31 (100.0%) | 14 (100.0%) |
| Total | 289 (60.5%) | 202 (51.9%) |
Income Above Poverty by Sex and Age in Parcelas Penuelas
According to the poverty statistics in Parcelas Penuelas, males aged 16 and 17 years and females aged 18 to 24 years are the age groups that are most secure financially, with 100.0% of males and 100.0% of females in these age groups living above the poverty line.
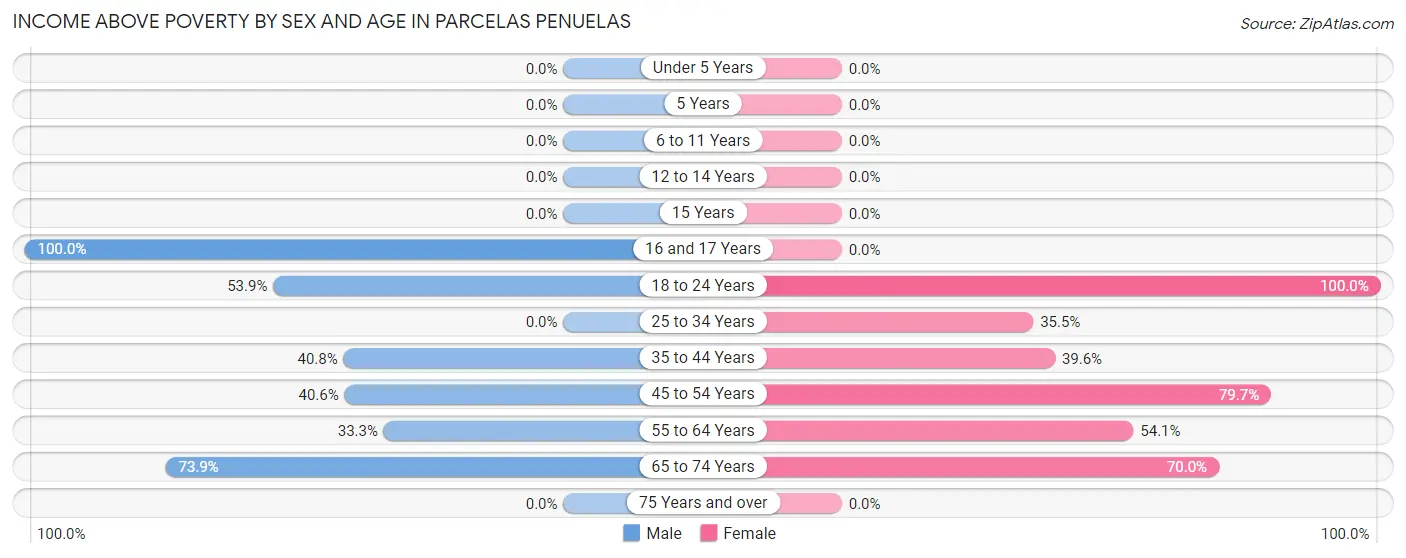
| Age Bracket | Male | Female |
| Under 5 Years | 0 (0.0%) | 0 (0.0%) |
| 5 Years | 0 (0.0%) | 0 (0.0%) |
| 6 to 11 Years | 0 (0.0%) | 0 (0.0%) |
| 12 to 14 Years | 0 (0.0%) | 0 (0.0%) |
| 15 Years | 0 (0.0%) | 0 (0.0%) |
| 16 and 17 Years | 16 (100.0%) | 0 (0.0%) |
| 18 to 24 Years | 14 (53.8%) | 17 (100.0%) |
| 25 to 34 Years | 0 (0.0%) | 27 (35.5%) |
| 35 to 44 Years | 51 (40.8%) | 36 (39.6%) |
| 45 to 54 Years | 39 (40.6%) | 47 (79.7%) |
| 55 to 64 Years | 21 (33.3%) | 46 (54.1%) |
| 65 to 74 Years | 48 (73.9%) | 14 (70.0%) |
| 75 Years and over | 0 (0.0%) | 0 (0.0%) |
| Total | 189 (39.5%) | 187 (48.1%) |
Income Below Poverty Among Married-Couple Families in Parcelas Penuelas
The poverty statistics for married-couple families in Parcelas Penuelas show that 61.4% or 62 of the total 101 families live below the poverty line. Families with 1 or 2 children have the highest poverty rate of 66.7%, comprising of 30 families. On the other hand, families with no children have the lowest poverty rate of 57.1%, which includes 32 families.
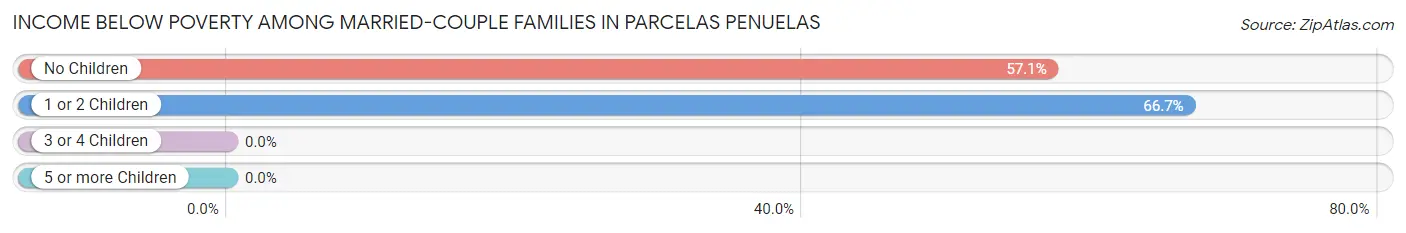
| Children | Above Poverty | Below Poverty |
| No Children | 24 (42.9%) | 32 (57.1%) |
| 1 or 2 Children | 15 (33.3%) | 30 (66.7%) |
| 3 or 4 Children | 0 (0.0%) | 0 (0.0%) |
| 5 or more Children | 0 (0.0%) | 0 (0.0%) |
| Total | 39 (38.6%) | 62 (61.4%) |
Income Below Poverty Among Single-Parent Households in Parcelas Penuelas
According to the poverty data in Parcelas Penuelas, 41.5% or 27 single-father households and 44.8% or 26 single-mother households are living below the poverty line. Among single-father households, those with no children have the highest poverty rate, with 27 households (41.5%) experiencing poverty. Likewise, among single-mother households, those with 1 or 2 children have the highest poverty rate, with 26 households (100.0%) falling below the poverty line.
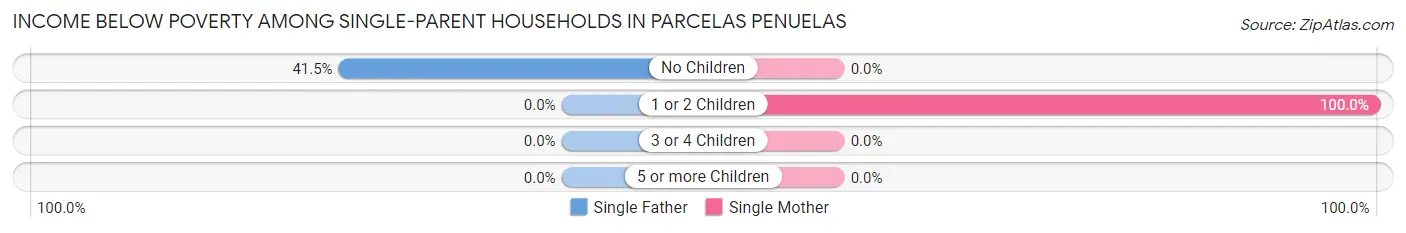
| Children | Single Father | Single Mother |
| No Children | 27 (41.5%) | 0 (0.0%) |
| 1 or 2 Children | 0 (0.0%) | 26 (100.0%) |
| 3 or 4 Children | 0 (0.0%) | 0 (0.0%) |
| 5 or more Children | 0 (0.0%) | 0 (0.0%) |
| Total | 27 (41.5%) | 26 (44.8%) |
Income Below Poverty Among Married-Couple vs Single-Parent Households in Parcelas Penuelas
The poverty data for Parcelas Penuelas shows that 62 of the married-couple family households (61.4%) and 53 of the single-parent households (43.1%) are living below the poverty level. Within the married-couple family households, those with 1 or 2 children have the highest poverty rate, with 30 households (66.7%) falling below the poverty line. Among the single-parent households, those with 1 or 2 children have the highest poverty rate, with 26 household (100.0%) living below poverty.
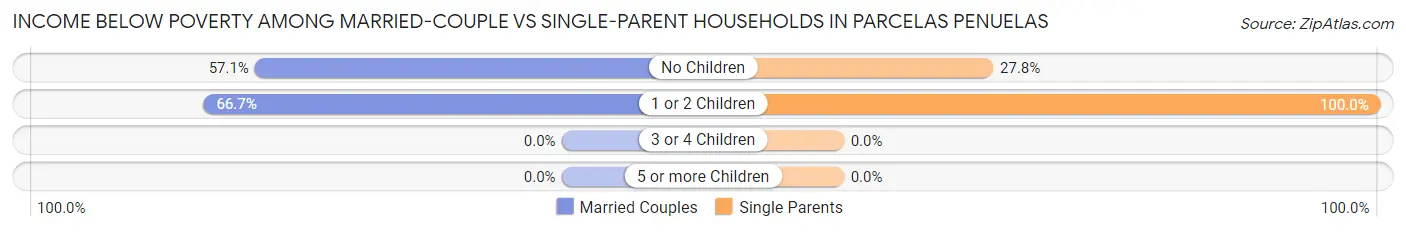
| Children | Married-Couple Families | Single-Parent Households |
| No Children | 32 (57.1%) | 27 (27.8%) |
| 1 or 2 Children | 30 (66.7%) | 26 (100.0%) |
| 3 or 4 Children | 0 (0.0%) | 0 (0.0%) |
| 5 or more Children | 0 (0.0%) | 0 (0.0%) |
| Total | 62 (61.4%) | 53 (43.1%) |
Race in Parcelas Penuelas
The most populous races in Parcelas Penuelas are Hispanic or Latino (877 | 100.0%), Two or more Races (562 | 64.1%), and White / Caucasian (262 | 29.9%).
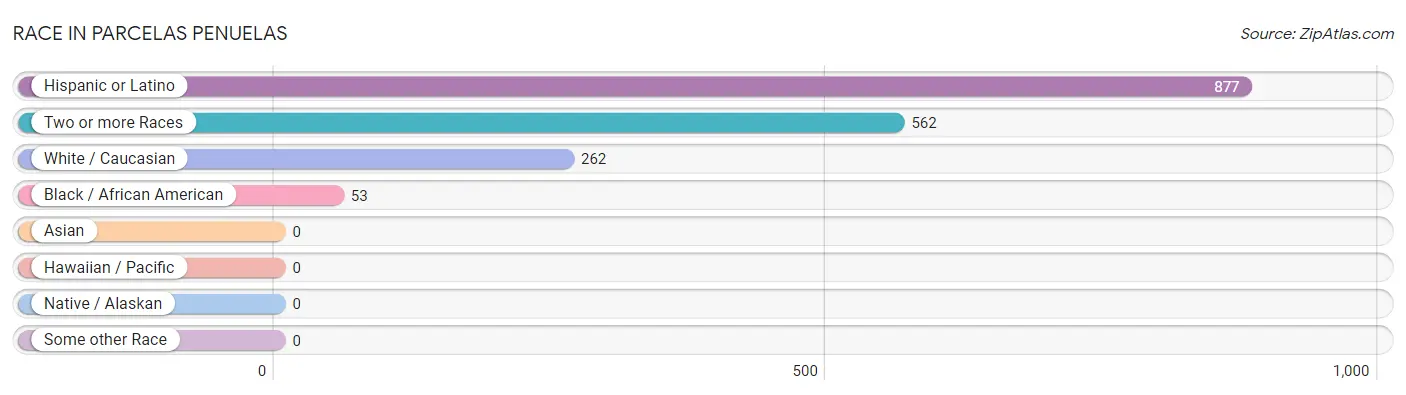
| Race | # Population | % Population |
| Asian | 0 | 0.0% |
| Black / African American | 53 | 6.0% |
| Hawaiian / Pacific | 0 | 0.0% |
| Hispanic or Latino | 877 | 100.0% |
| Native / Alaskan | 0 | 0.0% |
| White / Caucasian | 262 | 29.9% |
| Two or more Races | 562 | 64.1% |
| Some other Race | 0 | 0.0% |
| Total | 877 | 100.0% |
Ancestry in Parcelas Penuelas
The most populous ancestries reported in Parcelas Penuelas are , and Puerto Rican (877 | 100.0%), together accounting for 100.0% of all Parcelas Penuelas residents.

| Ancestry | # Population | % Population |
| Puerto Rican | 877 | 100.0% | View All 1 Rows |
Immigrants in Parcelas Penuelas

| Immigration Origin | # Population | % Population | View All 0 Rows |
Sex and Age in Parcelas Penuelas
Sex and Age in Parcelas Penuelas
The most populous age groups in Parcelas Penuelas are 35 to 39 Years (81 | 16.7%) for men and 25 to 29 Years (76 | 19.4%) for women.
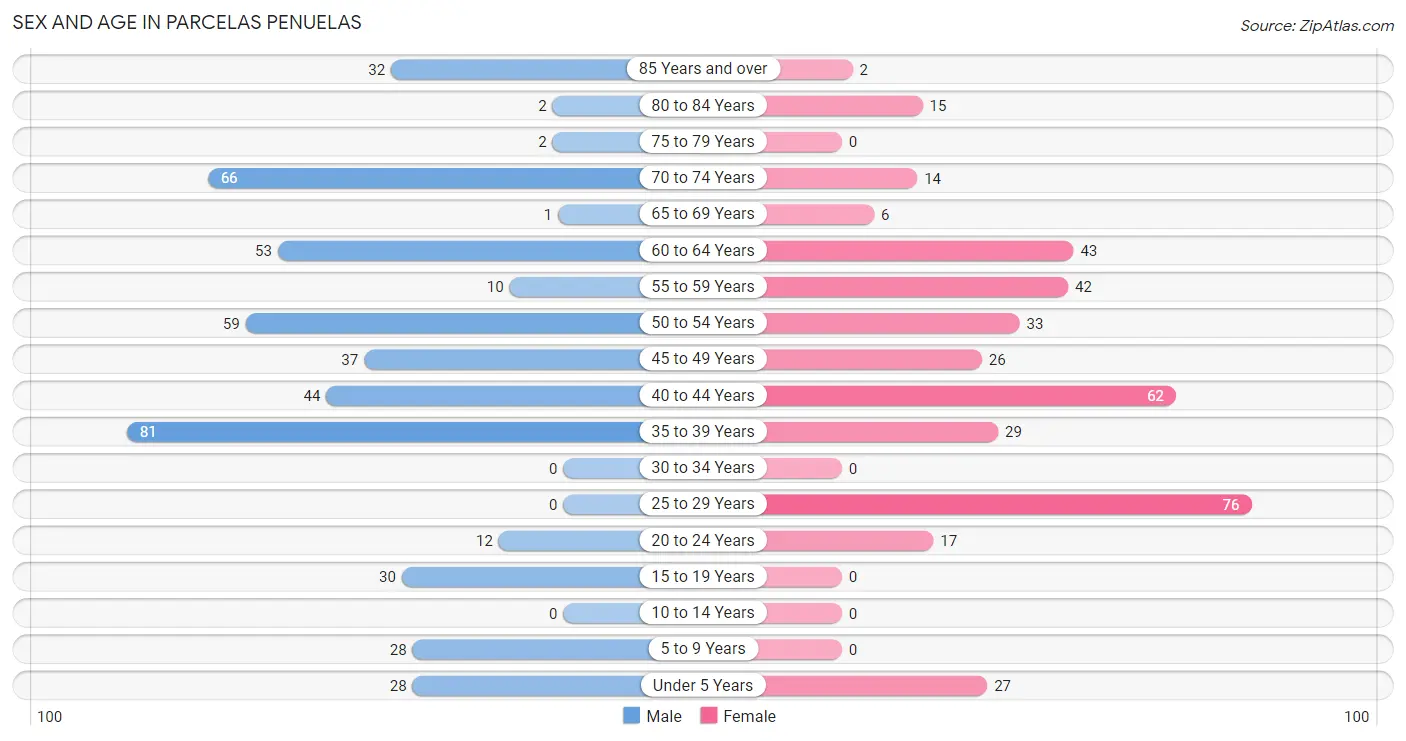
| Age Bracket | Male | Female |
| Under 5 Years | 28 (5.8%) | 27 (6.9%) |
| 5 to 9 Years | 28 (5.8%) | 0 (0.0%) |
| 10 to 14 Years | 0 (0.0%) | 0 (0.0%) |
| 15 to 19 Years | 30 (6.2%) | 0 (0.0%) |
| 20 to 24 Years | 12 (2.5%) | 17 (4.3%) |
| 25 to 29 Years | 0 (0.0%) | 76 (19.4%) |
| 30 to 34 Years | 0 (0.0%) | 0 (0.0%) |
| 35 to 39 Years | 81 (16.7%) | 29 (7.4%) |
| 40 to 44 Years | 44 (9.1%) | 62 (15.8%) |
| 45 to 49 Years | 37 (7.6%) | 26 (6.6%) |
| 50 to 54 Years | 59 (12.2%) | 33 (8.4%) |
| 55 to 59 Years | 10 (2.1%) | 42 (10.7%) |
| 60 to 64 Years | 53 (10.9%) | 43 (11.0%) |
| 65 to 69 Years | 1 (0.2%) | 6 (1.5%) |
| 70 to 74 Years | 66 (13.6%) | 14 (3.6%) |
| 75 to 79 Years | 2 (0.4%) | 0 (0.0%) |
| 80 to 84 Years | 2 (0.4%) | 15 (3.8%) |
| 85 Years and over | 32 (6.6%) | 2 (0.5%) |
| Total | 485 (100.0%) | 392 (100.0%) |
Families and Households in Parcelas Penuelas
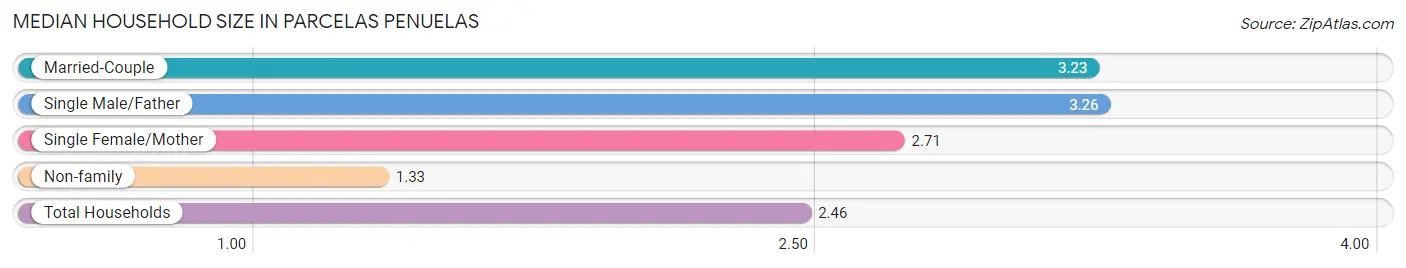
Median Family Size in Parcelas Penuelas
The median family size in Parcelas Penuelas is 3.10 persons per family, with single male/father families (65 | 29.0%) accounting for the largest median family size of 3.26 persons per family. On the other hand, single female/mother families (58 | 25.9%) represent the smallest median family size with 2.71 persons per family.
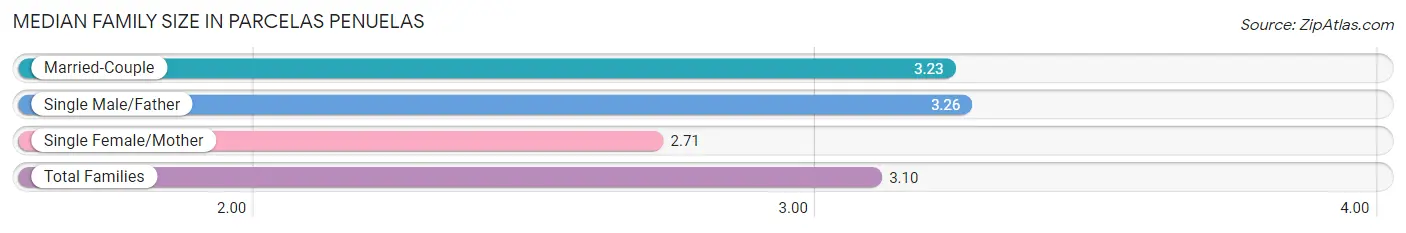
| Family Type | # Families | Family Size |
| Married-Couple | 101 (45.1%) | 3.23 |
| Single Male/Father | 65 (29.0%) | 3.26 |
| Single Female/Mother | 58 (25.9%) | 2.71 |
| Total Families | 224 (100.0%) | 3.10 |
Median Household Size in Parcelas Penuelas
The median household size in Parcelas Penuelas is 2.46 persons per household, with single male/father households (65 | 18.4%) accounting for the largest median household size of 3.26 persons per household. non-family households (129 | 36.5%) represent the smallest median household size with 1.33 persons per household.
| Household Type | # Households | Household Size |
| Married-Couple | 101 (28.6%) | 3.23 |
| Single Male/Father | 65 (18.4%) | 3.26 |
| Single Female/Mother | 58 (16.4%) | 2.71 |
| Non-family | 129 (36.5%) | 1.33 |
| Total Households | 353 (100.0%) | 2.46 |
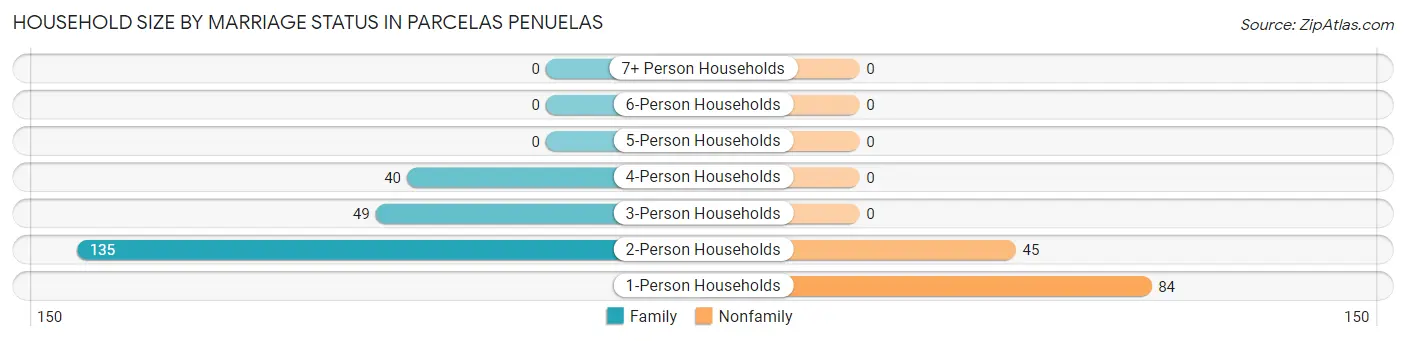
Household Size by Marriage Status in Parcelas Penuelas
Out of a total of 353 households in Parcelas Penuelas, 224 (63.5%) are family households, while 129 (36.5%) are nonfamily households. The most numerous type of family households are 2-person households, comprising 135, and the most common type of nonfamily households are 1-person households, comprising 84.
| Household Size | Family Households | Nonfamily Households |
| 1-Person Households | - | 84 (23.8%) |
| 2-Person Households | 135 (38.2%) | 45 (12.8%) |
| 3-Person Households | 49 (13.9%) | 0 (0.0%) |
| 4-Person Households | 40 (11.3%) | 0 (0.0%) |
| 5-Person Households | 0 (0.0%) | 0 (0.0%) |
| 6-Person Households | 0 (0.0%) | 0 (0.0%) |
| 7+ Person Households | 0 (0.0%) | 0 (0.0%) |
| Total | 224 (63.5%) | 129 (36.5%) |
Female Fertility in Parcelas Penuelas
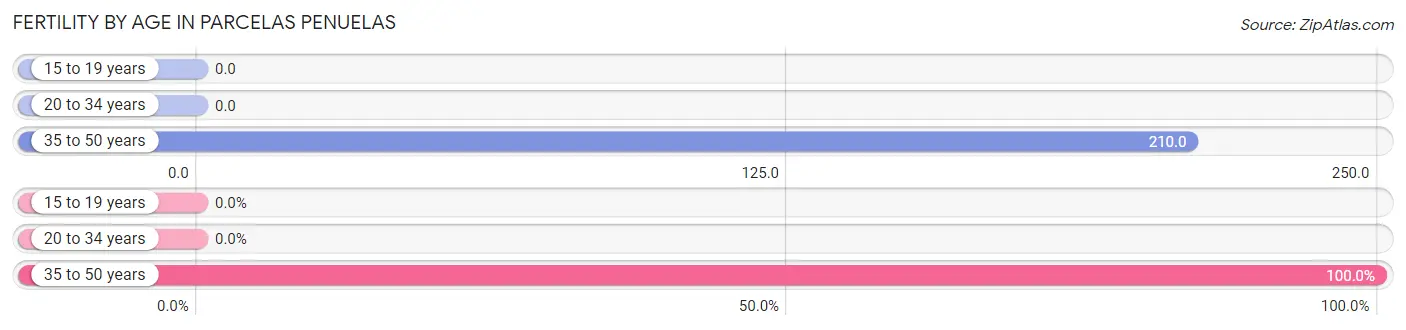
Fertility by Age in Parcelas Penuelas
Average fertility rate in Parcelas Penuelas is 126.0 births per 1,000 women. Women in the age bracket of 35 to 50 years have the highest fertility rate with 210.0 births per 1,000 women. Women in the age bracket of 35 to 50 years acount for 100.0% of all women with births.
| Age Bracket | Women with Births | Births / 1,000 Women |
| 15 to 19 years | 0 (0.0%) | 0.0 |
| 20 to 34 years | 0 (0.0%) | 0.0 |
| 35 to 50 years | 29 (100.0%) | 210.0 |
| Total | 29 (100.0%) | 126.0 |
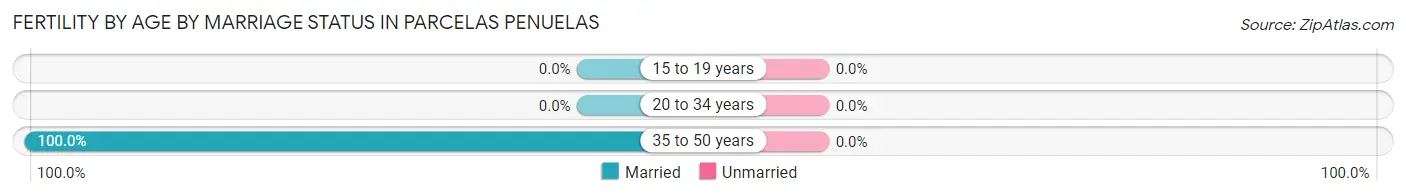
Fertility by Age by Marriage Status in Parcelas Penuelas
| Age Bracket | Married | Unmarried |
| 15 to 19 years | 0 (0.0%) | 0 (0.0%) |
| 20 to 34 years | 0 (0.0%) | 0 (0.0%) |
| 35 to 50 years | 29 (100.0%) | 0 (0.0%) |
| Total | 29 (100.0%) | 0 (0.0%) |
Fertility by Education in Parcelas Penuelas
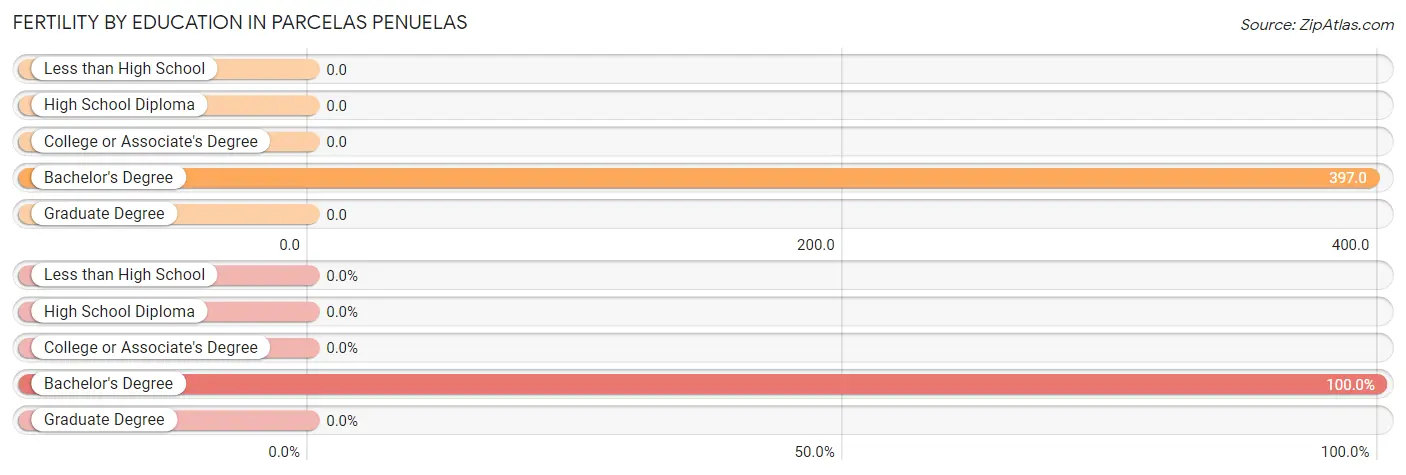
| Educational Attainment | Women with Births | Births / 1,000 Women |
| Less than High School | 0 (0.0%) | 0.0 |
| High School Diploma | 0 (0.0%) | 0.0 |
| College or Associate's Degree | 0 (0.0%) | 0.0 |
| Bachelor's Degree | 29 (100.0%) | 397.0 |
| Graduate Degree | 0 (0.0%) | 0.0 |
| Total | 29 (100.0%) | 126.0 |
Fertility by Education by Marriage Status in Parcelas Penuelas
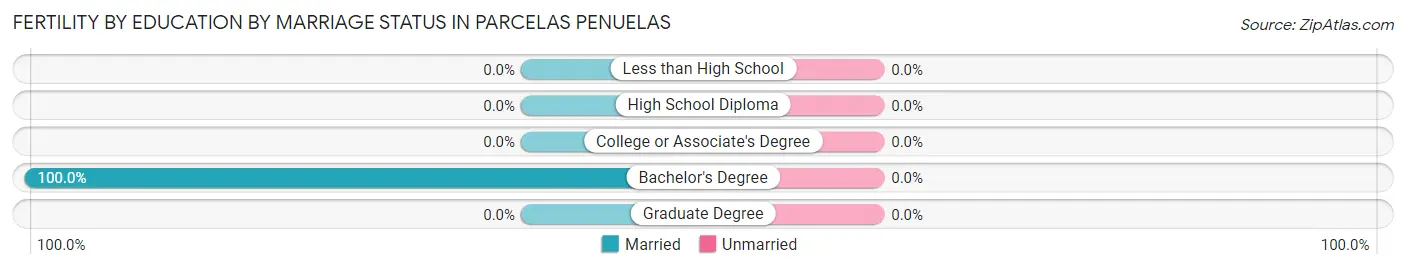
| Educational Attainment | Married | Unmarried |
| Less than High School | 0 (0.0%) | 0 (0.0%) |
| High School Diploma | 0 (0.0%) | 0 (0.0%) |
| College or Associate's Degree | 0 (0.0%) | 0 (0.0%) |
| Bachelor's Degree | 29 (100.0%) | 0 (0.0%) |
| Graduate Degree | 0 (0.0%) | 0 (0.0%) |
| Total | 29 (100.0%) | 0 (0.0%) |
Employment Characteristics in Parcelas Penuelas
Employment by Class of Employer in Parcelas Penuelas
Among the 392 employed individuals in Parcelas Penuelas, private company employees (241 | 61.5%), state government employees (84 | 21.4%), and self-employed (incorporated) (44 | 11.2%) make up the most common classes of employment.
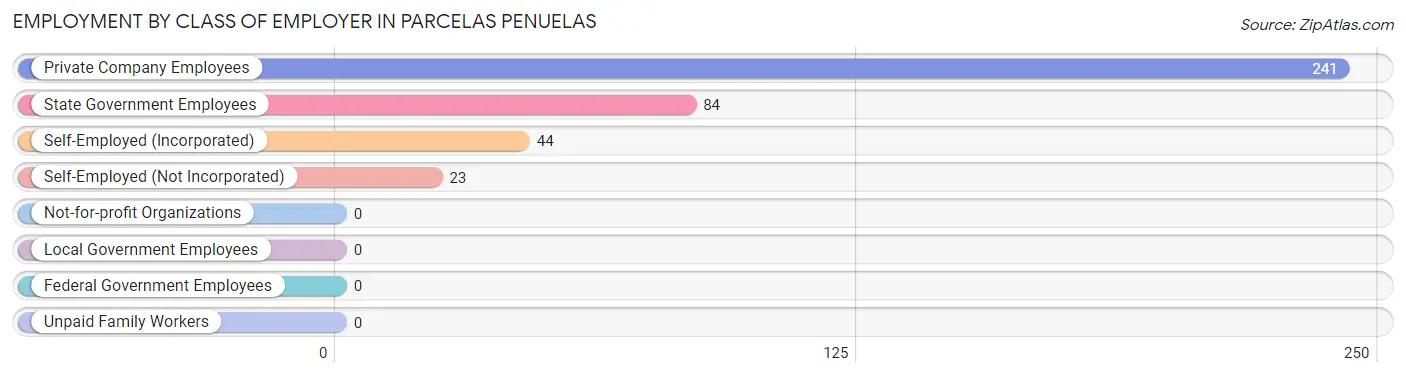
| Employer Class | # Employees | % Employees |
| Private Company Employees | 241 | 61.5% |
| Self-Employed (Incorporated) | 44 | 11.2% |
| Self-Employed (Not Incorporated) | 23 | 5.9% |
| Not-for-profit Organizations | 0 | 0.0% |
| Local Government Employees | 0 | 0.0% |
| State Government Employees | 84 | 21.4% |
| Federal Government Employees | 0 | 0.0% |
| Unpaid Family Workers | 0 | 0.0% |
| Total | 392 | 100.0% |
Employment Status by Age in Parcelas Penuelas
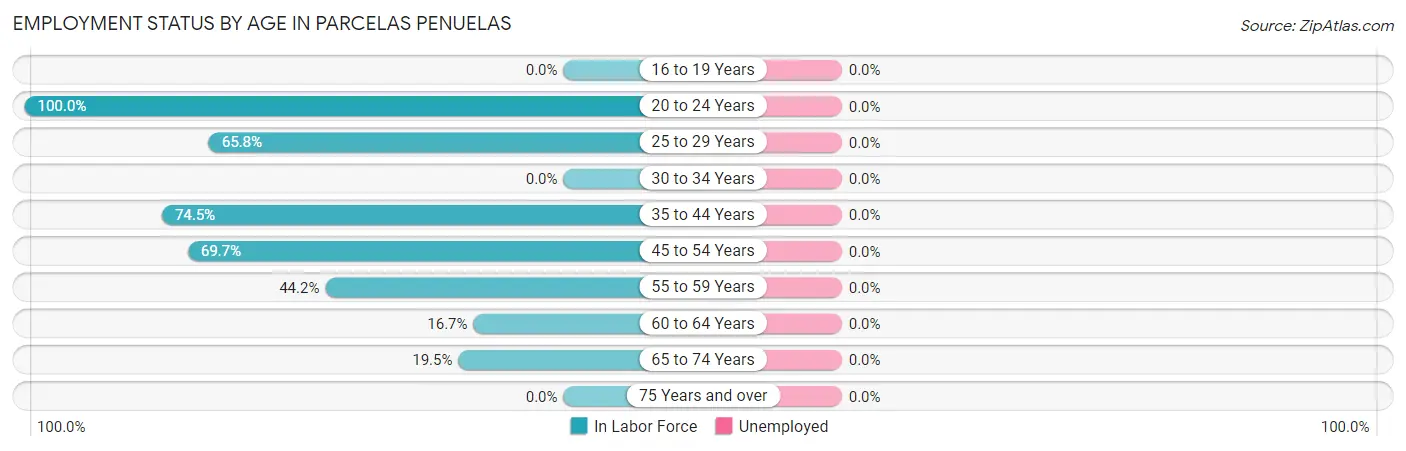
| Age Bracket | In Labor Force | Unemployed |
| 16 to 19 Years | 0 (0.0%) | 0 (0.0%) |
| 20 to 24 Years | 29 (100.0%) | 0 (0.0%) |
| 25 to 29 Years | 50 (65.8%) | 0 (0.0%) |
| 30 to 34 Years | 0 (0.0%) | 0 (0.0%) |
| 35 to 44 Years | 161 (74.5%) | 0 (0.0%) |
| 45 to 54 Years | 108 (69.7%) | 0 (0.0%) |
| 55 to 59 Years | 23 (44.2%) | 0 (0.0%) |
| 60 to 64 Years | 16 (16.7%) | 0 (0.0%) |
| 65 to 74 Years | 17 (19.5%) | 0 (0.0%) |
| 75 Years and over | 0 (0.0%) | 0 (0.0%) |
| Total | 404 (50.9%) | 0 (0.0%) |
Employment Status by Educational Attainment in Parcelas Penuelas
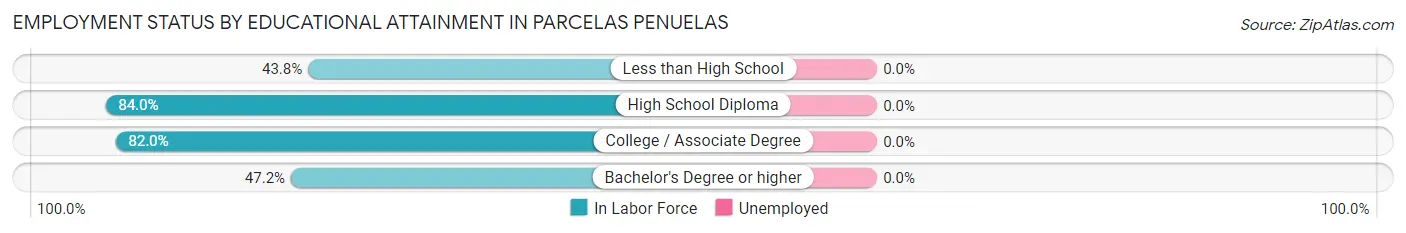
| Educational Attainment | In Labor Force | Unemployed |
| Less than High School | 89 (43.8%) | 0 (0.0%) |
| High School Diploma | 121 (84.0%) | 0 (0.0%) |
| College / Associate Degree | 73 (82.0%) | 0 (0.0%) |
| Bachelor's Degree or higher | 75 (47.2%) | 0 (0.0%) |
| Total | 358 (60.2%) | 0 (0.0%) |
Employment Occupations by Sex in Parcelas Penuelas
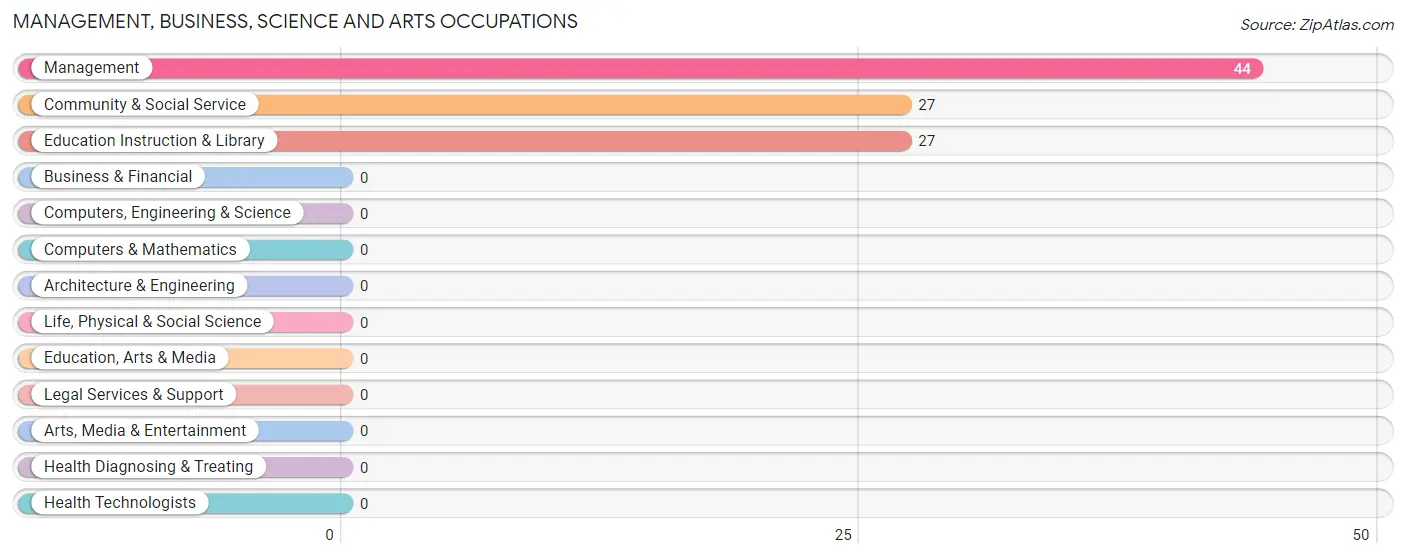
Management, Business, Science and Arts Occupations
The most common Management, Business, Science and Arts occupations in Parcelas Penuelas are Management (44 | 10.9%), Community & Social Service (27 | 6.7%), and Education Instruction & Library (27 | 6.7%).
Management, Business, Science and Arts Occupations by Sex
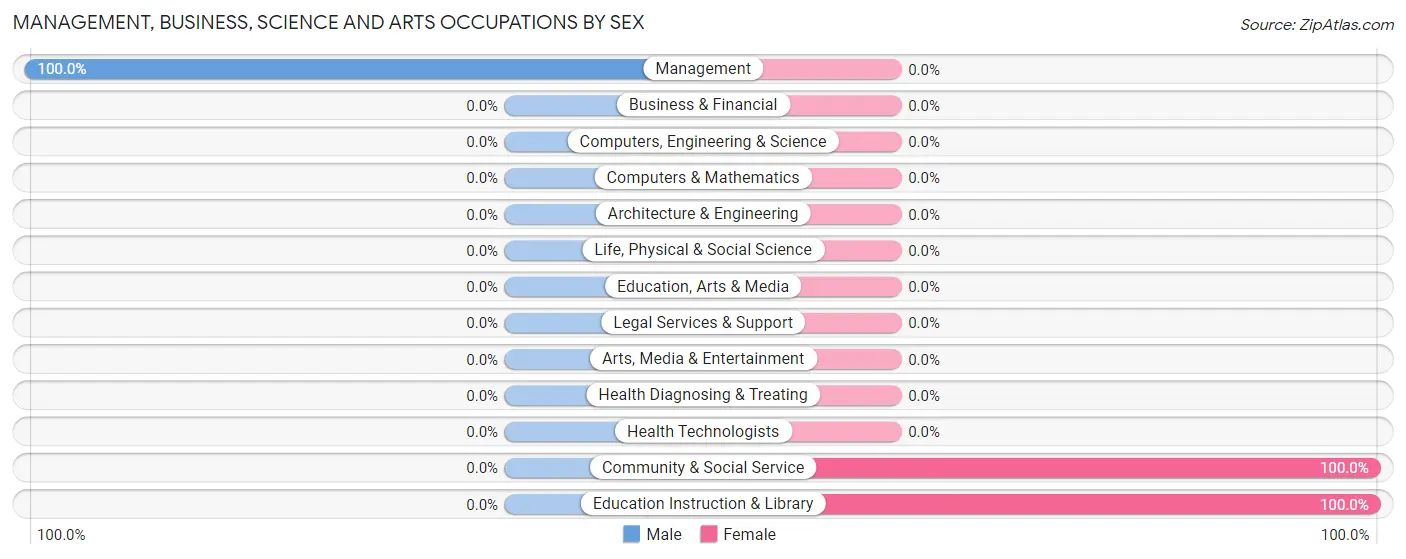
| Occupation | Male | Female |
| Management | 44 (100.0%) | 0 (0.0%) |
| Business & Financial | 0 (0.0%) | 0 (0.0%) |
| Computers, Engineering & Science | 0 (0.0%) | 0 (0.0%) |
| Computers & Mathematics | 0 (0.0%) | 0 (0.0%) |
| Architecture & Engineering | 0 (0.0%) | 0 (0.0%) |
| Life, Physical & Social Science | 0 (0.0%) | 0 (0.0%) |
| Community & Social Service | 0 (0.0%) | 27 (100.0%) |
| Education, Arts & Media | 0 (0.0%) | 0 (0.0%) |
| Legal Services & Support | 0 (0.0%) | 0 (0.0%) |
| Education Instruction & Library | 0 (0.0%) | 27 (100.0%) |
| Arts, Media & Entertainment | 0 (0.0%) | 0 (0.0%) |
| Health Diagnosing & Treating | 0 (0.0%) | 0 (0.0%) |
| Health Technologists | 0 (0.0%) | 0 (0.0%) |
| Total (Category) | 44 (62.0%) | 27 (38.0%) |
| Total (Overall) | 231 (57.2%) | 173 (42.8%) |
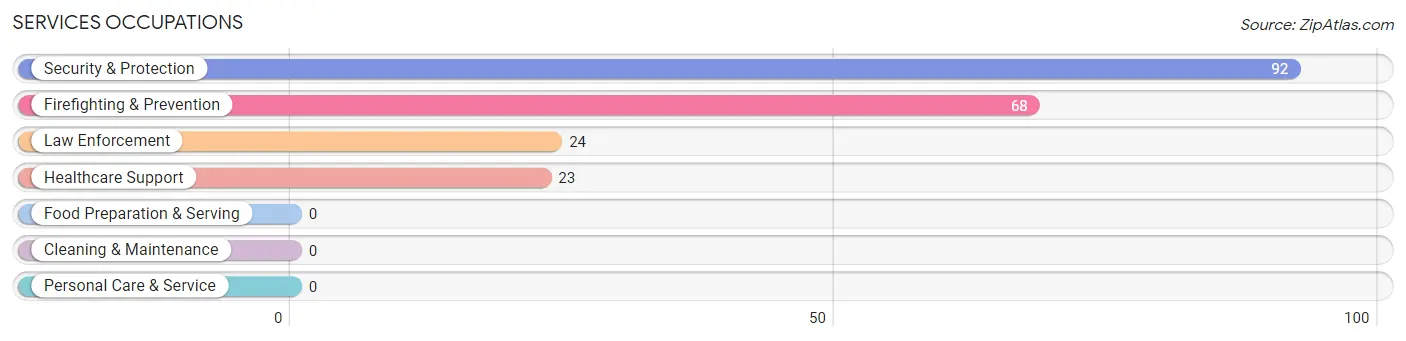
Services Occupations
The most common Services occupations in Parcelas Penuelas are Security & Protection (92 | 22.8%), Firefighting & Prevention (68 | 16.8%), Law Enforcement (24 | 5.9%), and Healthcare Support (23 | 5.7%).
Services Occupations by Sex
Within the Services occupations in Parcelas Penuelas, the most male-oriented occupations are Law Enforcement (100.0%), Security & Protection (58.7%), and Firefighting & Prevention (44.1%), while the most female-oriented occupations are Healthcare Support (100.0%), Firefighting & Prevention (55.9%), and Security & Protection (41.3%).
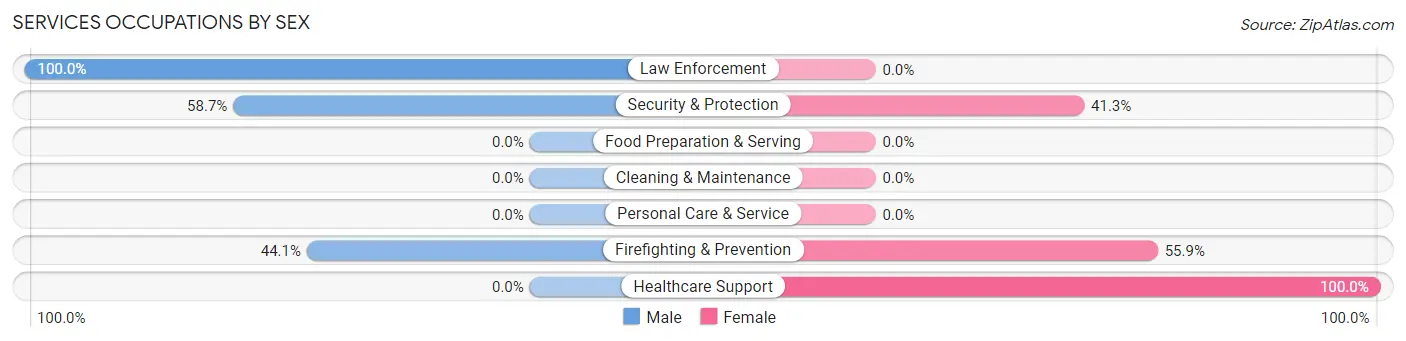
| Occupation | Male | Female |
| Healthcare Support | 0 (0.0%) | 23 (100.0%) |
| Security & Protection | 54 (58.7%) | 38 (41.3%) |
| Firefighting & Prevention | 30 (44.1%) | 38 (55.9%) |
| Law Enforcement | 24 (100.0%) | 0 (0.0%) |
| Food Preparation & Serving | 0 (0.0%) | 0 (0.0%) |
| Cleaning & Maintenance | 0 (0.0%) | 0 (0.0%) |
| Personal Care & Service | 0 (0.0%) | 0 (0.0%) |
| Total (Category) | 54 (47.0%) | 61 (53.0%) |
| Total (Overall) | 231 (57.2%) | 173 (42.8%) |
Sales and Office Occupations
The most common Sales and Office occupations in Parcelas Penuelas are , and Office & Administration (18 | 4.5%).

Sales and Office Occupations by Sex

| Occupation | Male | Female |
| Sales & Related | 0 (0.0%) | 0 (0.0%) |
| Office & Administration | 0 (0.0%) | 18 (100.0%) |
| Total (Category) | 0 (0.0%) | 18 (100.0%) |
| Total (Overall) | 231 (57.2%) | 173 (42.8%) |
Natural Resources, Construction and Maintenance Occupations
The most common Natural Resources, Construction and Maintenance occupations in Parcelas Penuelas are , and Farming, Fishing & Forestry (65 | 16.1%).
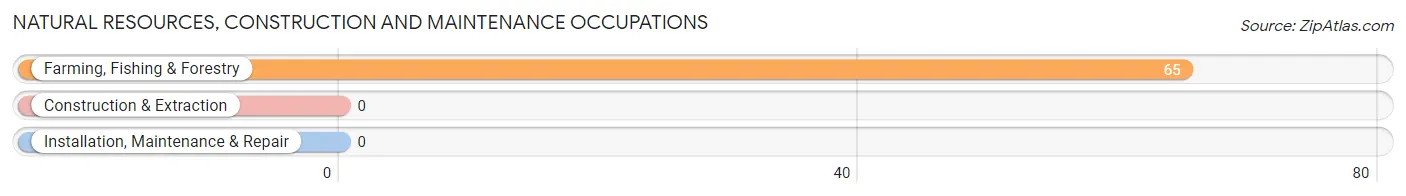
Natural Resources, Construction and Maintenance Occupations by Sex
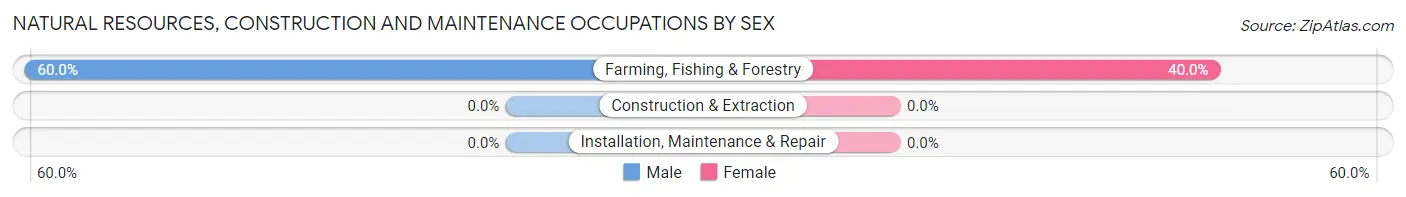
| Occupation | Male | Female |
| Farming, Fishing & Forestry | 39 (60.0%) | 26 (40.0%) |
| Construction & Extraction | 0 (0.0%) | 0 (0.0%) |
| Installation, Maintenance & Repair | 0 (0.0%) | 0 (0.0%) |
| Total (Category) | 39 (60.0%) | 26 (40.0%) |
| Total (Overall) | 231 (57.2%) | 173 (42.8%) |
Production, Transportation and Moving Occupations
The most common Production, Transportation and Moving occupations in Parcelas Penuelas are Material Moving (63 | 15.6%), Production (57 | 14.1%), and Transportation (15 | 3.7%).
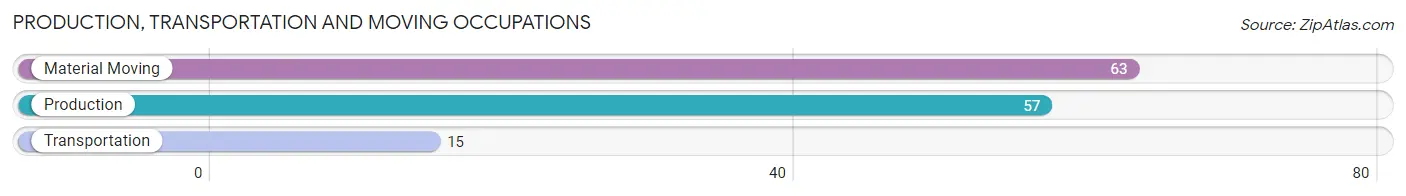
Production, Transportation and Moving Occupations by Sex
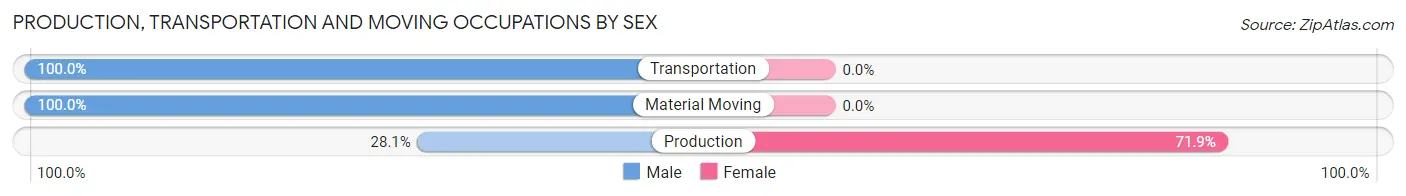
| Occupation | Male | Female |
| Production | 16 (28.1%) | 41 (71.9%) |
| Transportation | 15 (100.0%) | 0 (0.0%) |
| Material Moving | 63 (100.0%) | 0 (0.0%) |
| Total (Category) | 94 (69.6%) | 41 (30.4%) |
| Total (Overall) | 231 (57.2%) | 173 (42.8%) |
Employment Industries by Sex in Parcelas Penuelas
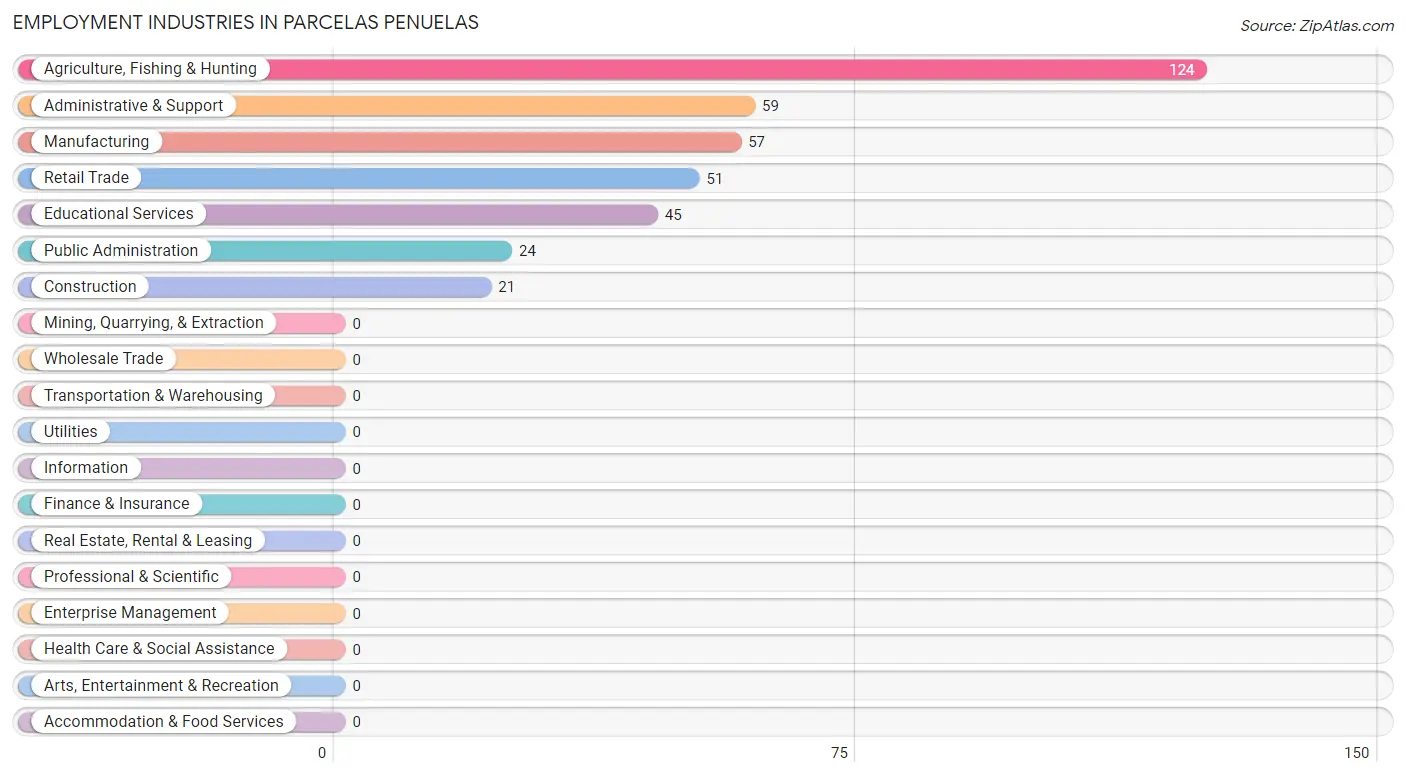
Employment Industries in Parcelas Penuelas
The major employment industries in Parcelas Penuelas include Agriculture, Fishing & Hunting (124 | 30.7%), Administrative & Support (59 | 14.6%), Manufacturing (57 | 14.1%), Retail Trade (51 | 12.6%), and Educational Services (45 | 11.1%).
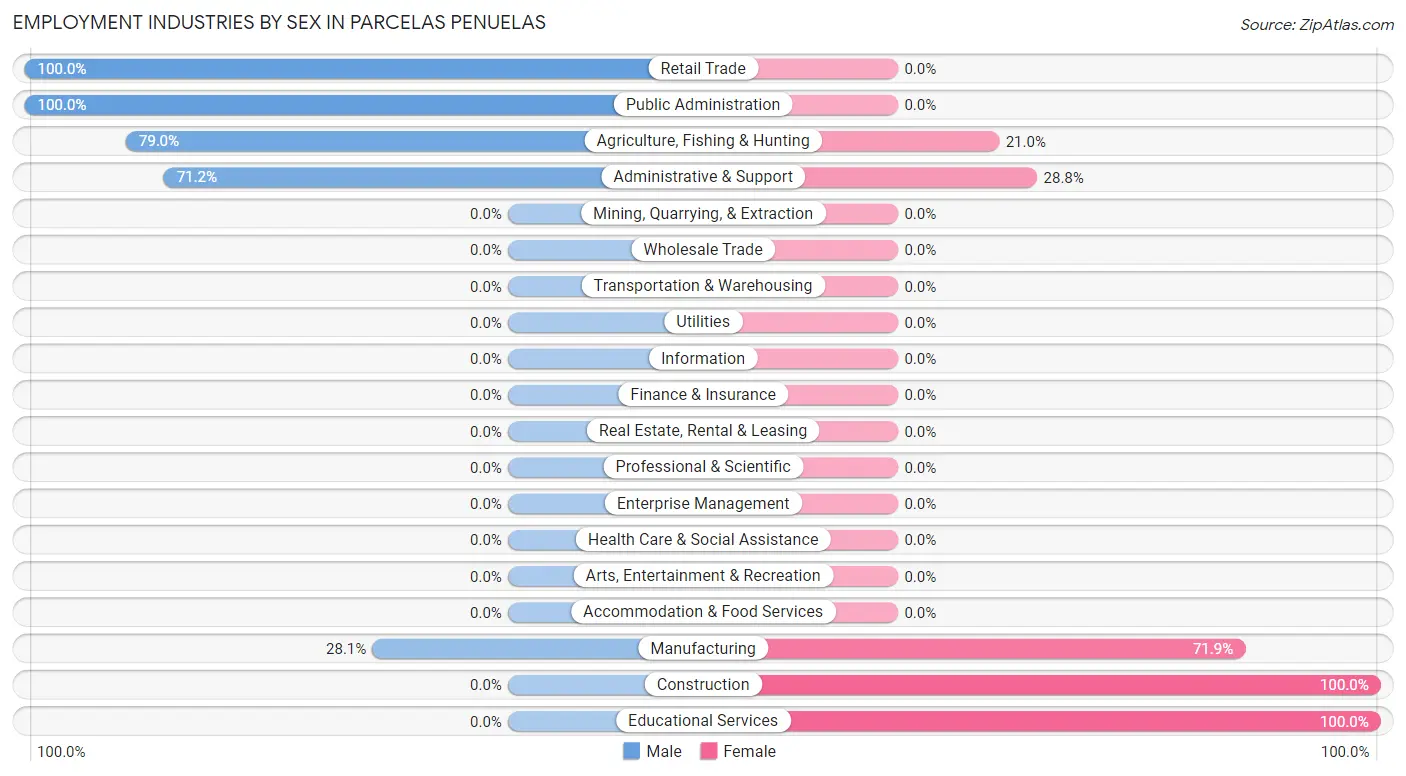
Employment Industries by Sex in Parcelas Penuelas
The Parcelas Penuelas industries that see more men than women are Retail Trade (100.0%), Public Administration (100.0%), and Agriculture, Fishing & Hunting (79.0%), whereas the industries that tend to have a higher number of women are Construction (100.0%), Educational Services (100.0%), and Manufacturing (71.9%).
| Industry | Male | Female |
| Agriculture, Fishing & Hunting | 98 (79.0%) | 26 (21.0%) |
| Mining, Quarrying, & Extraction | 0 (0.0%) | 0 (0.0%) |
| Construction | 0 (0.0%) | 21 (100.0%) |
| Manufacturing | 16 (28.1%) | 41 (71.9%) |
| Wholesale Trade | 0 (0.0%) | 0 (0.0%) |
| Retail Trade | 51 (100.0%) | 0 (0.0%) |
| Transportation & Warehousing | 0 (0.0%) | 0 (0.0%) |
| Utilities | 0 (0.0%) | 0 (0.0%) |
| Information | 0 (0.0%) | 0 (0.0%) |
| Finance & Insurance | 0 (0.0%) | 0 (0.0%) |
| Real Estate, Rental & Leasing | 0 (0.0%) | 0 (0.0%) |
| Professional & Scientific | 0 (0.0%) | 0 (0.0%) |
| Enterprise Management | 0 (0.0%) | 0 (0.0%) |
| Administrative & Support | 42 (71.2%) | 17 (28.8%) |
| Educational Services | 0 (0.0%) | 45 (100.0%) |
| Health Care & Social Assistance | 0 (0.0%) | 0 (0.0%) |
| Arts, Entertainment & Recreation | 0 (0.0%) | 0 (0.0%) |
| Accommodation & Food Services | 0 (0.0%) | 0 (0.0%) |
| Public Administration | 24 (100.0%) | 0 (0.0%) |
| Total | 231 (57.2%) | 173 (42.8%) |
Education in Parcelas Penuelas
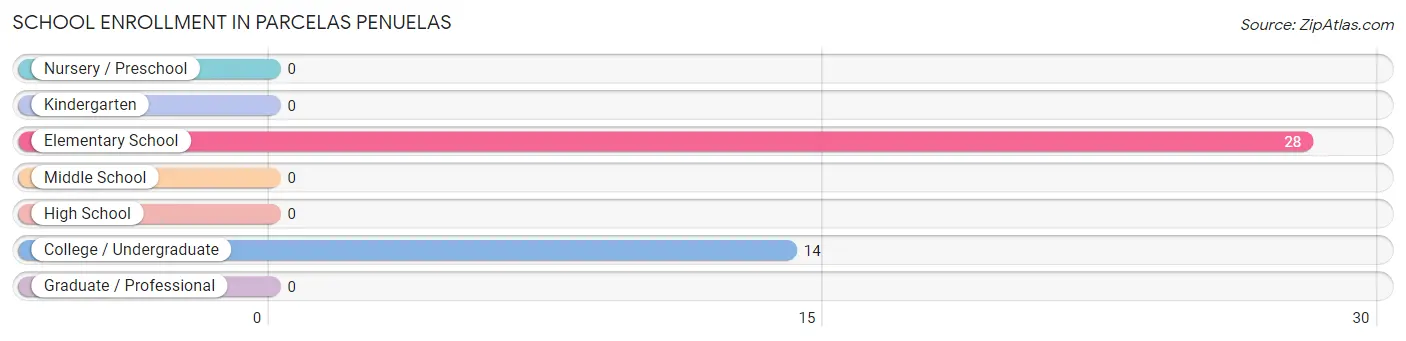
School Enrollment in Parcelas Penuelas
The most common levels of schooling among the 42 students in Parcelas Penuelas are elementary school (28 | 66.7%), and college / undergraduate (14 | 33.3%).
| School Level | # Students | % Students |
| Nursery / Preschool | 0 | 0.0% |
| Kindergarten | 0 | 0.0% |
| Elementary School | 28 | 66.7% |
| Middle School | 0 | 0.0% |
| High School | 0 | 0.0% |
| College / Undergraduate | 14 | 33.3% |
| Graduate / Professional | 0 | 0.0% |
| Total | 42 | 100.0% |
School Enrollment by Age by Funding Source in Parcelas Penuelas
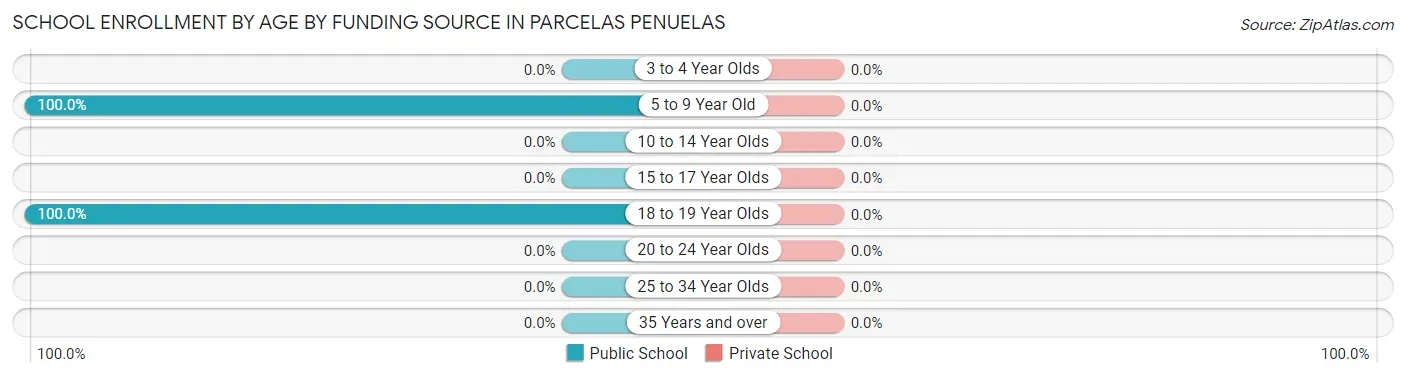
| Age Bracket | Public School | Private School |
| 3 to 4 Year Olds | 0 (0.0%) | 0 (0.0%) |
| 5 to 9 Year Old | 28 (100.0%) | 0 (0.0%) |
| 10 to 14 Year Olds | 0 (0.0%) | 0 (0.0%) |
| 15 to 17 Year Olds | 0 (0.0%) | 0 (0.0%) |
| 18 to 19 Year Olds | 14 (100.0%) | 0 (0.0%) |
| 20 to 24 Year Olds | 0 (0.0%) | 0 (0.0%) |
| 25 to 34 Year Olds | 0 (0.0%) | 0 (0.0%) |
| 35 Years and over | 0 (0.0%) | 0 (0.0%) |
| Total | 42 (100.0%) | 0 (0.0%) |
Educational Attainment by Field of Study in Parcelas Penuelas
Education (80 | 49.1%), bio, nature & agricultural (37 | 22.7%), science & technology (26 | 16.0%), and business (20 | 12.3%) are the most common fields of study among 163 individuals in Parcelas Penuelas who have obtained a bachelor's degree or higher.
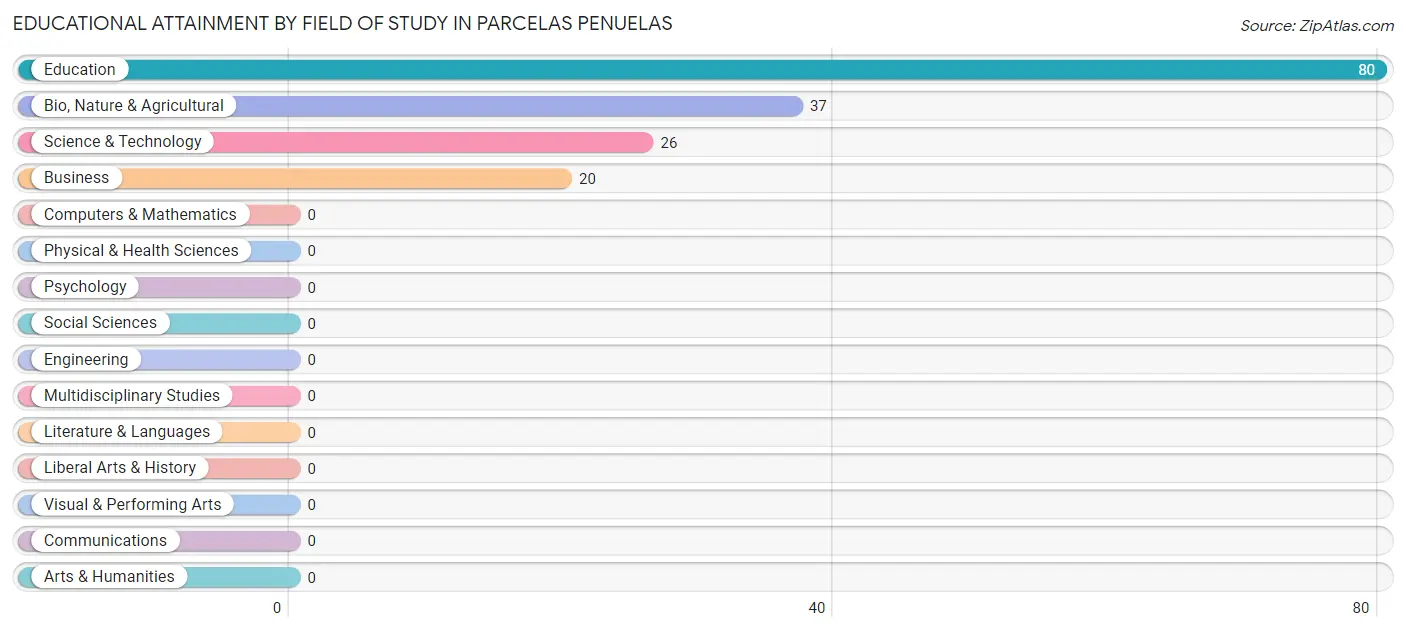
| Field of Study | # Graduates | % Graduates |
| Computers & Mathematics | 0 | 0.0% |
| Bio, Nature & Agricultural | 37 | 22.7% |
| Physical & Health Sciences | 0 | 0.0% |
| Psychology | 0 | 0.0% |
| Social Sciences | 0 | 0.0% |
| Engineering | 0 | 0.0% |
| Multidisciplinary Studies | 0 | 0.0% |
| Science & Technology | 26 | 16.0% |
| Business | 20 | 12.3% |
| Education | 80 | 49.1% |
| Literature & Languages | 0 | 0.0% |
| Liberal Arts & History | 0 | 0.0% |
| Visual & Performing Arts | 0 | 0.0% |
| Communications | 0 | 0.0% |
| Arts & Humanities | 0 | 0.0% |
| Total | 163 | 100.0% |
Transportation & Commute in Parcelas Penuelas
Vehicle Availability by Sex in Parcelas Penuelas
The most prevalent vehicle ownership categories in Parcelas Penuelas are males with 2 vehicles (120, accounting for 54.8%) and females with 2 vehicles (84, making up 69.4%).
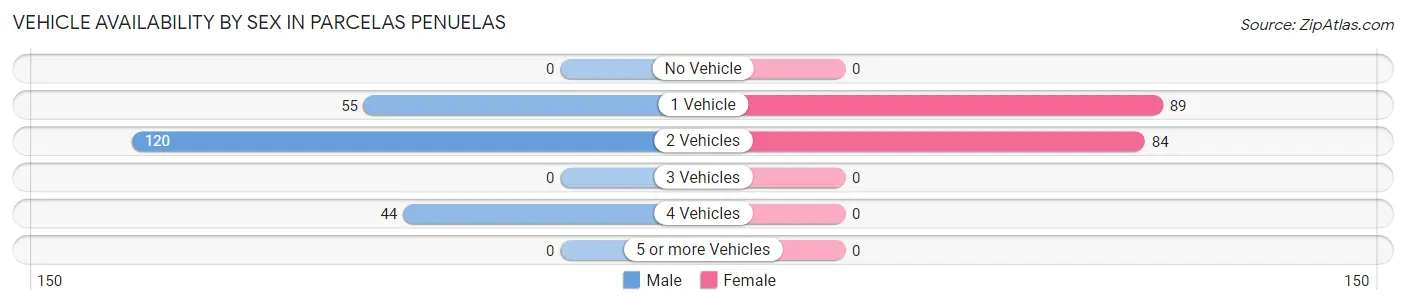
| Vehicles Available | Male | Female |
| No Vehicle | 0 (0.0%) | 0 (0.0%) |
| 1 Vehicle | 55 (25.1%) | 89 (51.4%) |
| 2 Vehicles | 120 (54.8%) | 84 (48.5%) |
| 3 Vehicles | 0 (0.0%) | 0 (0.0%) |
| 4 Vehicles | 44 (20.1%) | 0 (0.0%) |
| 5 or more Vehicles | 0 (0.0%) | 0 (0.0%) |
| Total | 219 (100.0%) | 173 (100.0%) |
Commute Time in Parcelas Penuelas
The most frequently occuring commute durations in Parcelas Penuelas are 5 to 9 minutes (83 commuters, 22.9%), 20 to 24 minutes (73 commuters, 20.2%), and 60 to 89 minutes (53 commuters, 14.6%).
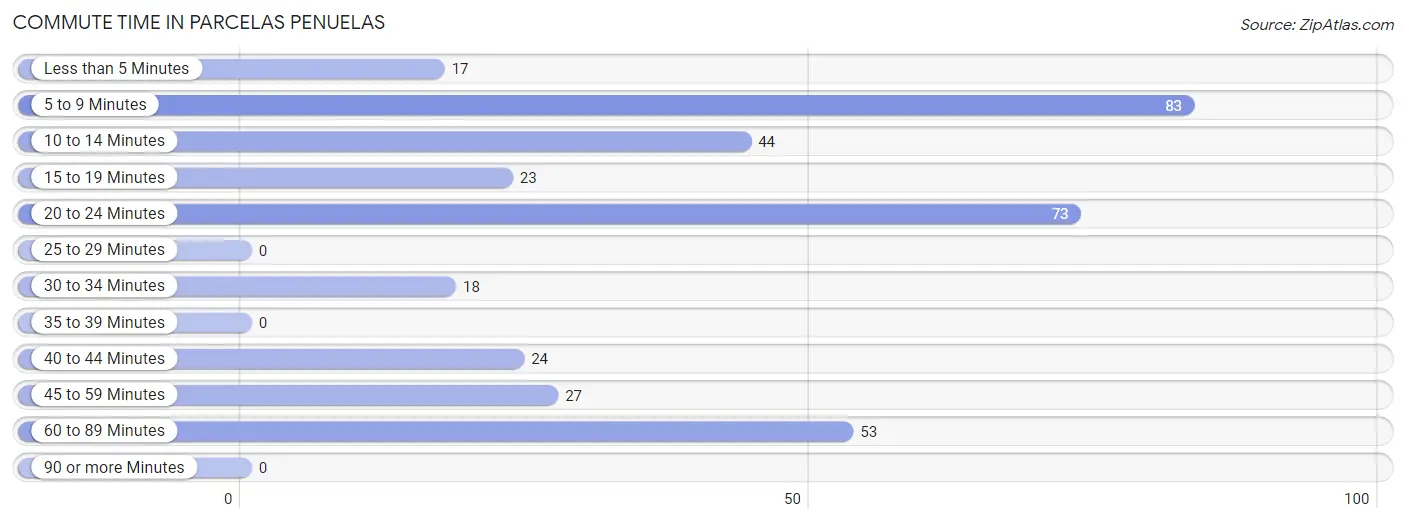
| Commute Time | # Commuters | % Commuters |
| Less than 5 Minutes | 17 | 4.7% |
| 5 to 9 Minutes | 83 | 22.9% |
| 10 to 14 Minutes | 44 | 12.1% |
| 15 to 19 Minutes | 23 | 6.4% |
| 20 to 24 Minutes | 73 | 20.2% |
| 25 to 29 Minutes | 0 | 0.0% |
| 30 to 34 Minutes | 18 | 5.0% |
| 35 to 39 Minutes | 0 | 0.0% |
| 40 to 44 Minutes | 24 | 6.6% |
| 45 to 59 Minutes | 27 | 7.5% |
| 60 to 89 Minutes | 53 | 14.6% |
| 90 or more Minutes | 0 | 0.0% |
Commute Time by Sex in Parcelas Penuelas
The most common commute times in Parcelas Penuelas are 20 to 24 minutes (73 commuters, 38.6%) for males and 5 to 9 minutes (67 commuters, 38.7%) for females.
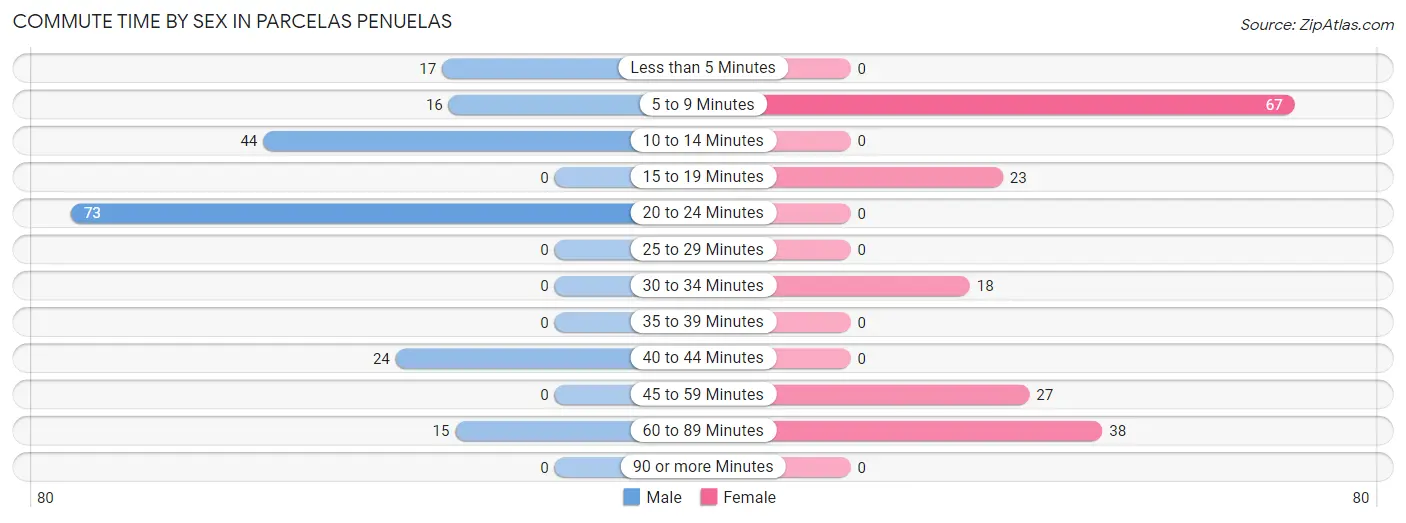
| Commute Time | Male | Female |
| Less than 5 Minutes | 17 (9.0%) | 0 (0.0%) |
| 5 to 9 Minutes | 16 (8.5%) | 67 (38.7%) |
| 10 to 14 Minutes | 44 (23.3%) | 0 (0.0%) |
| 15 to 19 Minutes | 0 (0.0%) | 23 (13.3%) |
| 20 to 24 Minutes | 73 (38.6%) | 0 (0.0%) |
| 25 to 29 Minutes | 0 (0.0%) | 0 (0.0%) |
| 30 to 34 Minutes | 0 (0.0%) | 18 (10.4%) |
| 35 to 39 Minutes | 0 (0.0%) | 0 (0.0%) |
| 40 to 44 Minutes | 24 (12.7%) | 0 (0.0%) |
| 45 to 59 Minutes | 0 (0.0%) | 27 (15.6%) |
| 60 to 89 Minutes | 15 (7.9%) | 38 (22.0%) |
| 90 or more Minutes | 0 (0.0%) | 0 (0.0%) |
Time of Departure to Work by Sex in Parcelas Penuelas
The most frequent times of departure to work in Parcelas Penuelas are 8:00 AM to 8:29 AM (51, 27.0%) for males and 5:00 AM to 5:29 AM (71, 41.0%) for females.
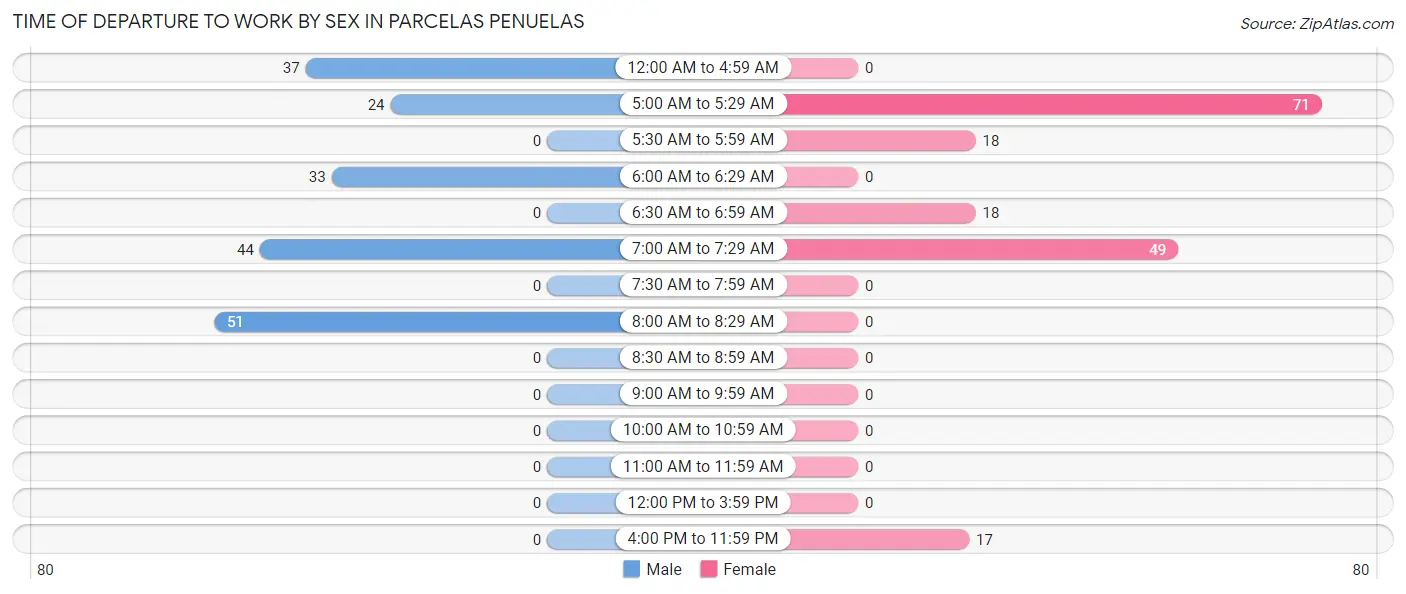
| Time of Departure | Male | Female |
| 12:00 AM to 4:59 AM | 37 (19.6%) | 0 (0.0%) |
| 5:00 AM to 5:29 AM | 24 (12.7%) | 71 (41.0%) |
| 5:30 AM to 5:59 AM | 0 (0.0%) | 18 (10.4%) |
| 6:00 AM to 6:29 AM | 33 (17.5%) | 0 (0.0%) |
| 6:30 AM to 6:59 AM | 0 (0.0%) | 18 (10.4%) |
| 7:00 AM to 7:29 AM | 44 (23.3%) | 49 (28.3%) |
| 7:30 AM to 7:59 AM | 0 (0.0%) | 0 (0.0%) |
| 8:00 AM to 8:29 AM | 51 (27.0%) | 0 (0.0%) |
| 8:30 AM to 8:59 AM | 0 (0.0%) | 0 (0.0%) |
| 9:00 AM to 9:59 AM | 0 (0.0%) | 0 (0.0%) |
| 10:00 AM to 10:59 AM | 0 (0.0%) | 0 (0.0%) |
| 11:00 AM to 11:59 AM | 0 (0.0%) | 0 (0.0%) |
| 12:00 PM to 3:59 PM | 0 (0.0%) | 0 (0.0%) |
| 4:00 PM to 11:59 PM | 0 (0.0%) | 17 (9.8%) |
| Total | 189 (100.0%) | 173 (100.0%) |
Housing Occupancy in Parcelas Penuelas
Occupancy by Ownership in Parcelas Penuelas
Of the total 353 dwellings in Parcelas Penuelas, owner-occupied units account for 272 (77.0%), while renter-occupied units make up 81 (23.0%).
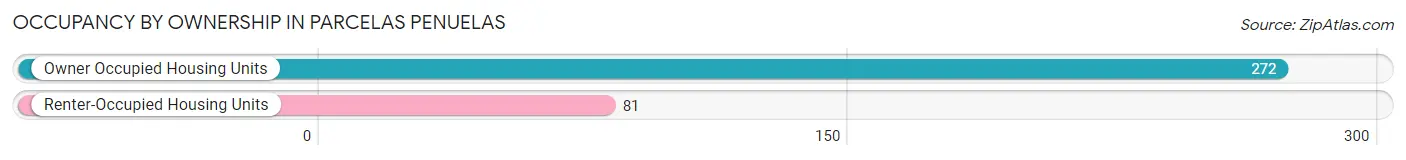
| Occupancy | # Housing Units | % Housing Units |
| Owner Occupied Housing Units | 272 | 77.0% |
| Renter-Occupied Housing Units | 81 | 23.0% |
| Total Occupied Housing Units | 353 | 100.0% |
Occupancy by Household Size in Parcelas Penuelas
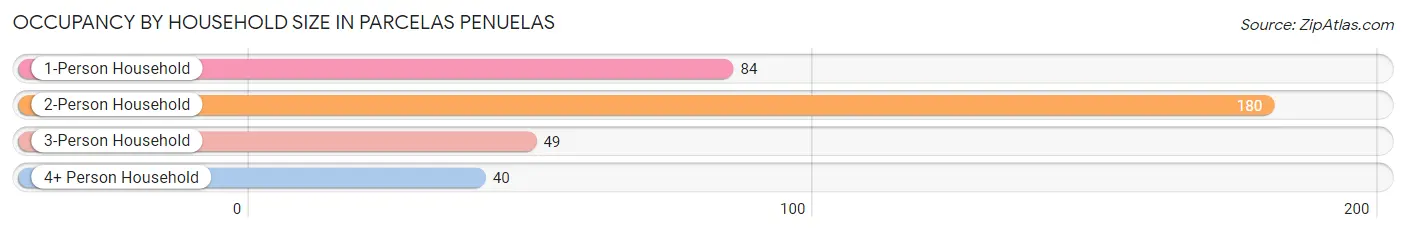
| Household Size | # Housing Units | % Housing Units |
| 1-Person Household | 84 | 23.8% |
| 2-Person Household | 180 | 51.0% |
| 3-Person Household | 49 | 13.9% |
| 4+ Person Household | 40 | 11.3% |
| Total Housing Units | 353 | 100.0% |
Occupancy by Ownership by Household Size in Parcelas Penuelas
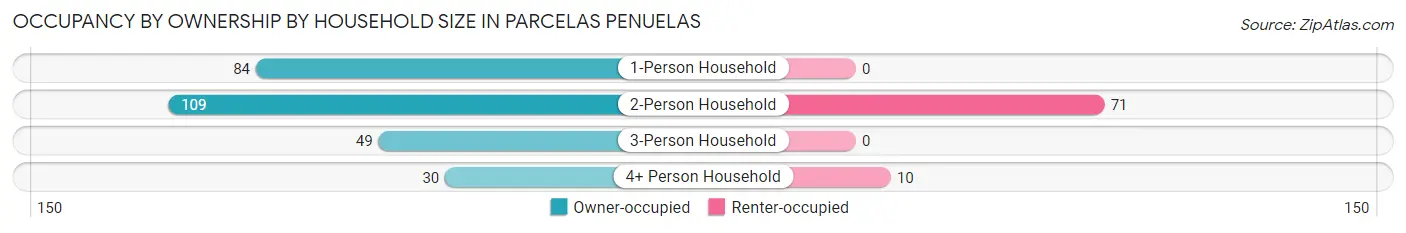
| Household Size | Owner-occupied | Renter-occupied |
| 1-Person Household | 84 (100.0%) | 0 (0.0%) |
| 2-Person Household | 109 (60.6%) | 71 (39.4%) |
| 3-Person Household | 49 (100.0%) | 0 (0.0%) |
| 4+ Person Household | 30 (75.0%) | 10 (25.0%) |
| Total Housing Units | 272 (77.0%) | 81 (23.0%) |
Occupancy by Educational Attainment in Parcelas Penuelas
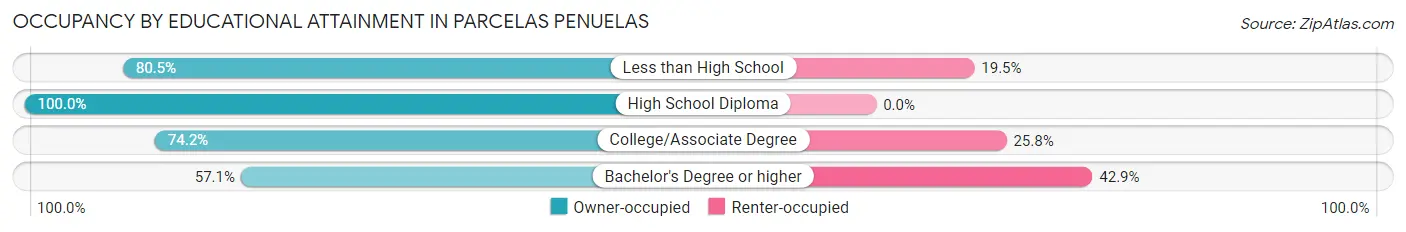
| Household Size | Owner-occupied | Renter-occupied |
| Less than High School | 91 (80.5%) | 22 (19.5%) |
| High School Diploma | 67 (100.0%) | 0 (0.0%) |
| College/Associate Degree | 66 (74.2%) | 23 (25.8%) |
| Bachelor's Degree or higher | 48 (57.1%) | 36 (42.9%) |
Occupancy by Age of Householder in Parcelas Penuelas
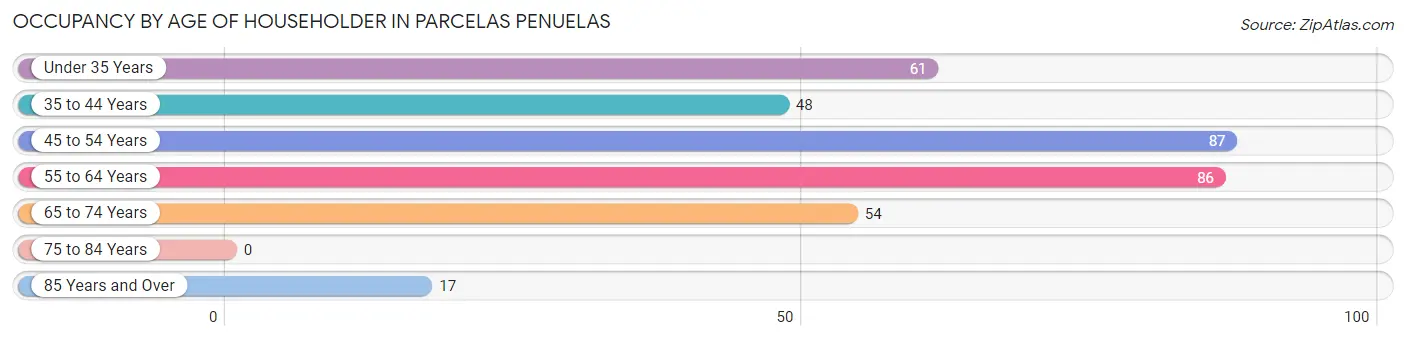
| Age Bracket | # Households | % Households |
| Under 35 Years | 61 | 17.3% |
| 35 to 44 Years | 48 | 13.6% |
| 45 to 54 Years | 87 | 24.6% |
| 55 to 64 Years | 86 | 24.4% |
| 65 to 74 Years | 54 | 15.3% |
| 75 to 84 Years | 0 | 0.0% |
| 85 Years and Over | 17 | 4.8% |
| Total | 353 | 100.0% |
Housing Finances in Parcelas Penuelas
Median Income by Occupancy in Parcelas Penuelas
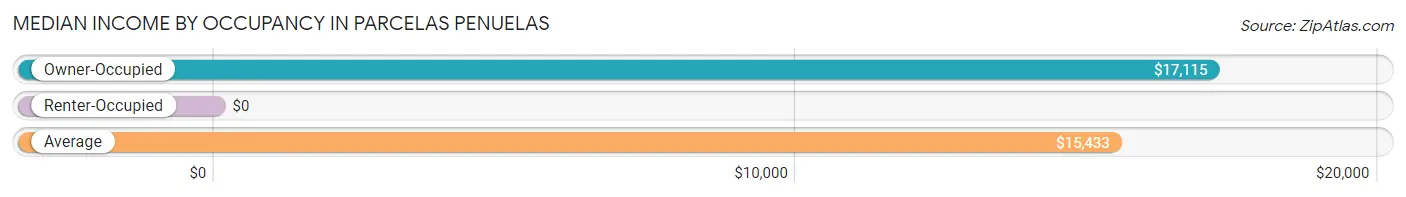
| Occupancy Type | # Households | Median Income |
| Owner-Occupied | 272 (77.0%) | $17,115 |
| Renter-Occupied | 81 (23.0%) | $0 |
| Average | 353 (100.0%) | $15,433 |
Occupancy by Householder Income Bracket in Parcelas Penuelas
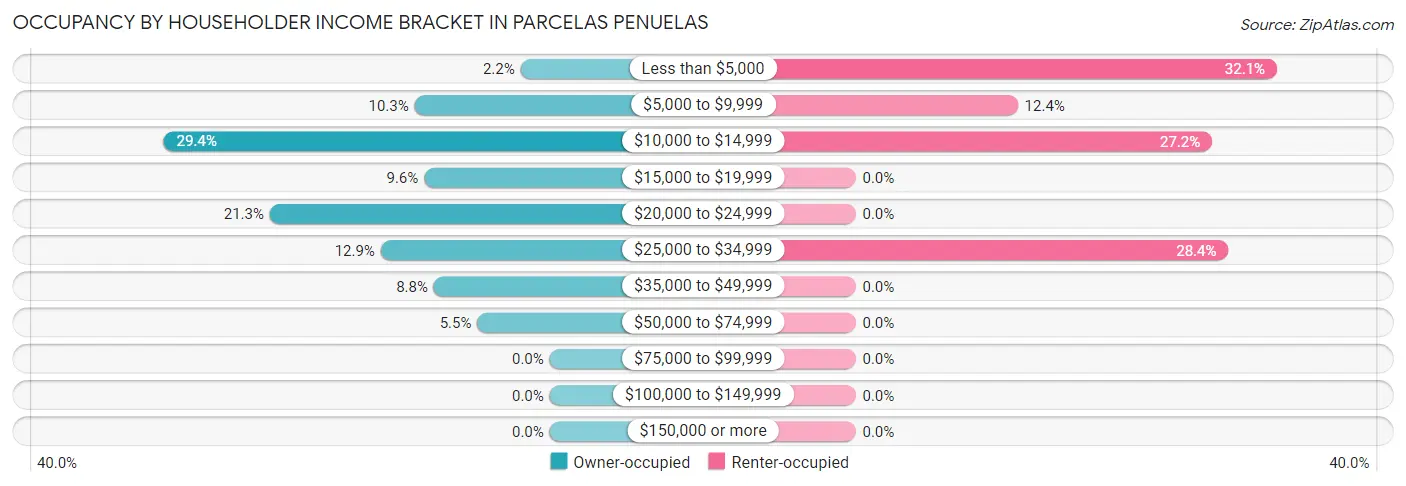
| Income Bracket | Owner-occupied | Renter-occupied |
| Less than $5,000 | 6 (2.2%) | 26 (32.1%) |
| $5,000 to $9,999 | 28 (10.3%) | 10 (12.3%) |
| $10,000 to $14,999 | 80 (29.4%) | 22 (27.2%) |
| $15,000 to $19,999 | 26 (9.6%) | 0 (0.0%) |
| $20,000 to $24,999 | 58 (21.3%) | 0 (0.0%) |
| $25,000 to $34,999 | 35 (12.9%) | 23 (28.4%) |
| $35,000 to $49,999 | 24 (8.8%) | 0 (0.0%) |
| $50,000 to $74,999 | 15 (5.5%) | 0 (0.0%) |
| $75,000 to $99,999 | 0 (0.0%) | 0 (0.0%) |
| $100,000 to $149,999 | 0 (0.0%) | 0 (0.0%) |
| $150,000 or more | 0 (0.0%) | 0 (0.0%) |
| Total | 272 (100.0%) | 81 (100.0%) |
Monthly Housing Cost Tiers in Parcelas Penuelas
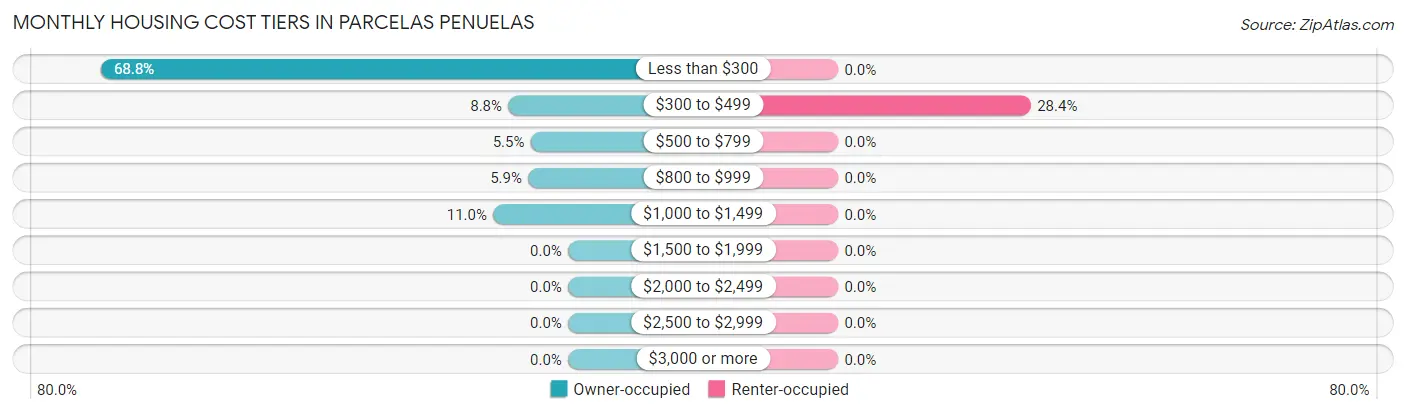
| Monthly Cost | Owner-occupied | Renter-occupied |
| Less than $300 | 187 (68.8%) | 0 (0.0%) |
| $300 to $499 | 24 (8.8%) | 23 (28.4%) |
| $500 to $799 | 15 (5.5%) | 0 (0.0%) |
| $800 to $999 | 16 (5.9%) | 0 (0.0%) |
| $1,000 to $1,499 | 30 (11.0%) | 0 (0.0%) |
| $1,500 to $1,999 | 0 (0.0%) | 0 (0.0%) |
| $2,000 to $2,499 | 0 (0.0%) | 0 (0.0%) |
| $2,500 to $2,999 | 0 (0.0%) | 0 (0.0%) |
| $3,000 or more | 0 (0.0%) | 0 (0.0%) |
| Total | 272 (100.0%) | 81 (100.0%) |
Physical Housing Characteristics in Parcelas Penuelas
Housing Structures in Parcelas Penuelas
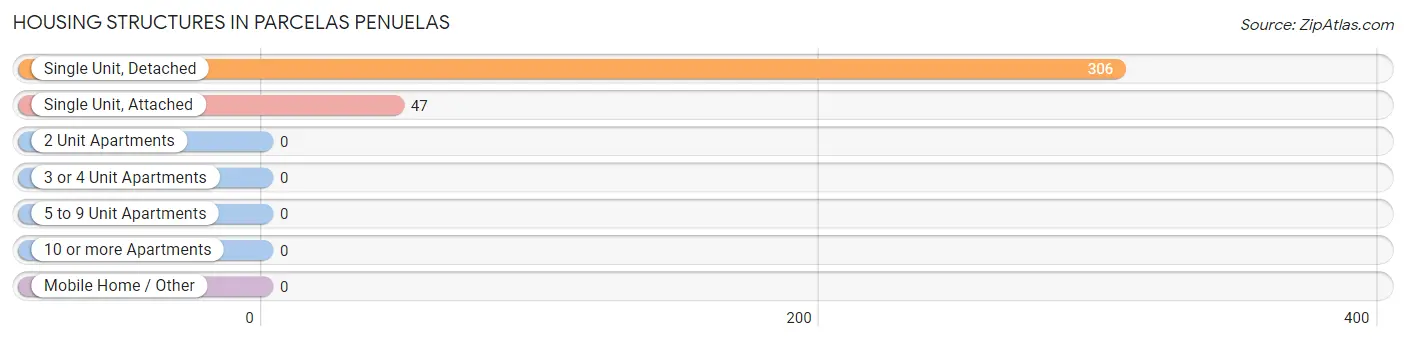
| Structure Type | # Housing Units | % Housing Units |
| Single Unit, Detached | 306 | 86.7% |
| Single Unit, Attached | 47 | 13.3% |
| 2 Unit Apartments | 0 | 0.0% |
| 3 or 4 Unit Apartments | 0 | 0.0% |
| 5 to 9 Unit Apartments | 0 | 0.0% |
| 10 or more Apartments | 0 | 0.0% |
| Mobile Home / Other | 0 | 0.0% |
| Total | 353 | 100.0% |
Housing Structures by Occupancy in Parcelas Penuelas
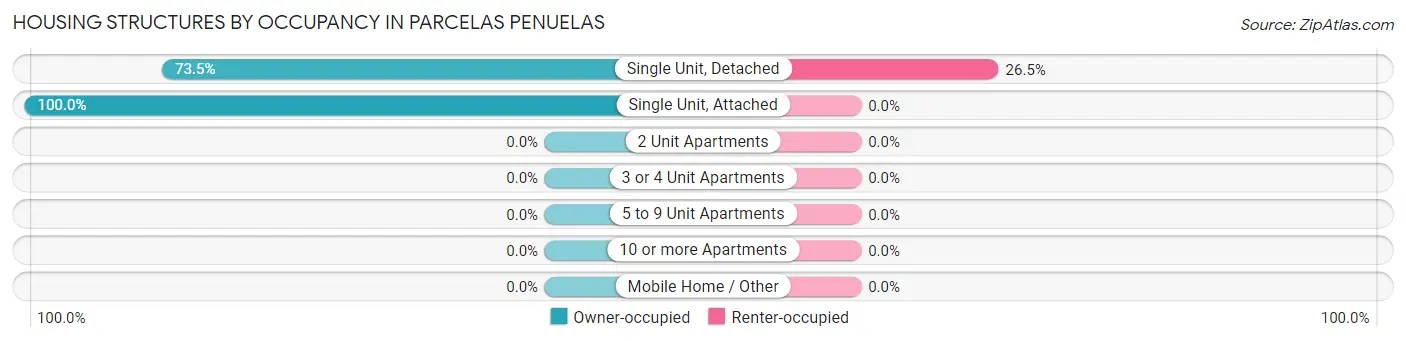
| Structure Type | Owner-occupied | Renter-occupied |
| Single Unit, Detached | 225 (73.5%) | 81 (26.5%) |
| Single Unit, Attached | 47 (100.0%) | 0 (0.0%) |
| 2 Unit Apartments | 0 (0.0%) | 0 (0.0%) |
| 3 or 4 Unit Apartments | 0 (0.0%) | 0 (0.0%) |
| 5 to 9 Unit Apartments | 0 (0.0%) | 0 (0.0%) |
| 10 or more Apartments | 0 (0.0%) | 0 (0.0%) |
| Mobile Home / Other | 0 (0.0%) | 0 (0.0%) |
| Total | 272 (77.0%) | 81 (23.0%) |
Housing Structures by Number of Rooms in Parcelas Penuelas
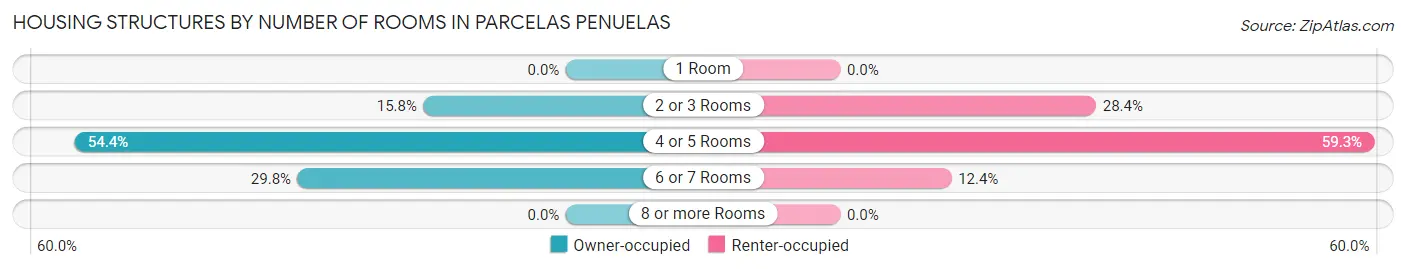
| Number of Rooms | Owner-occupied | Renter-occupied |
| 1 Room | 0 (0.0%) | 0 (0.0%) |
| 2 or 3 Rooms | 43 (15.8%) | 23 (28.4%) |
| 4 or 5 Rooms | 148 (54.4%) | 48 (59.3%) |
| 6 or 7 Rooms | 81 (29.8%) | 10 (12.3%) |
| 8 or more Rooms | 0 (0.0%) | 0 (0.0%) |
| Total | 272 (100.0%) | 81 (100.0%) |
Housing Structure by Heating Type in Parcelas Penuelas
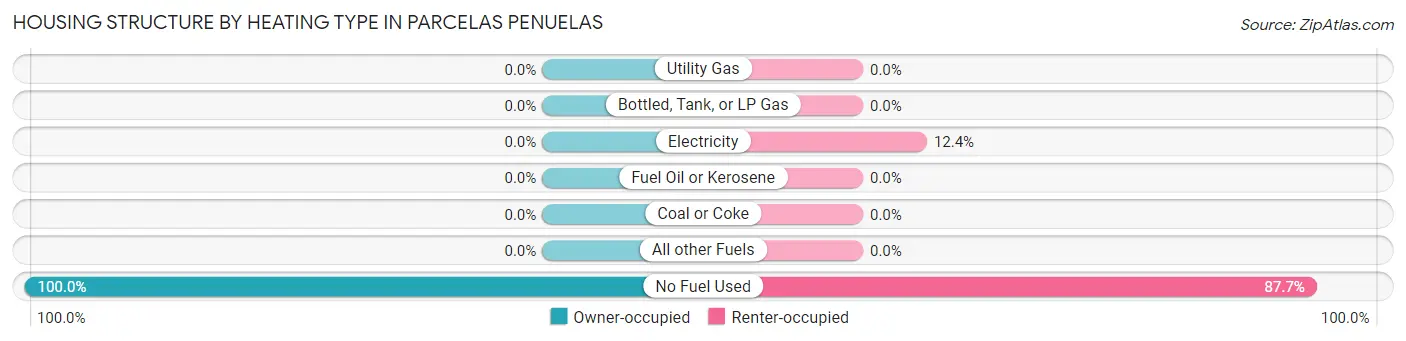
| Heating Type | Owner-occupied | Renter-occupied |
| Utility Gas | 0 (0.0%) | 0 (0.0%) |
| Bottled, Tank, or LP Gas | 0 (0.0%) | 0 (0.0%) |
| Electricity | 0 (0.0%) | 10 (12.3%) |
| Fuel Oil or Kerosene | 0 (0.0%) | 0 (0.0%) |
| Coal or Coke | 0 (0.0%) | 0 (0.0%) |
| All other Fuels | 0 (0.0%) | 0 (0.0%) |
| No Fuel Used | 272 (100.0%) | 71 (87.6%) |
| Total | 272 (100.0%) | 81 (100.0%) |
Household Vehicle Usage in Parcelas Penuelas
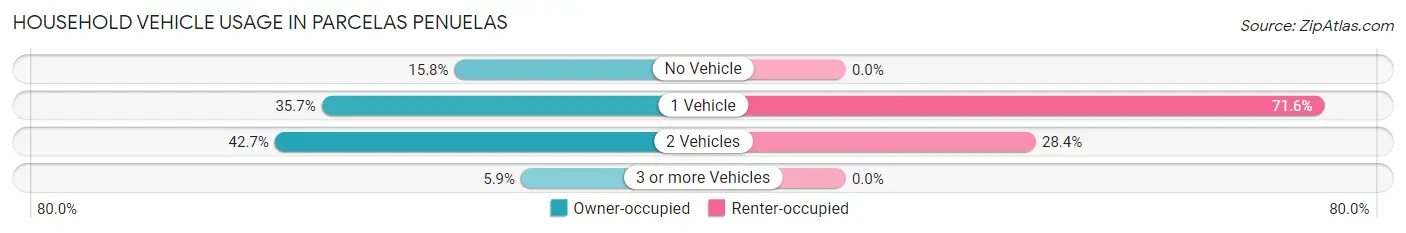
| Vehicles per Household | Owner-occupied | Renter-occupied |
| No Vehicle | 43 (15.8%) | 0 (0.0%) |
| 1 Vehicle | 97 (35.7%) | 58 (71.6%) |
| 2 Vehicles | 116 (42.6%) | 23 (28.4%) |
| 3 or more Vehicles | 16 (5.9%) | 0 (0.0%) |
| Total | 272 (100.0%) | 81 (100.0%) |
Real Estate & Mortgages in Parcelas Penuelas
Real Estate and Mortgage Overview in Parcelas Penuelas
| Characteristic | Without Mortgage | With Mortgage |
| Housing Units | 187 | 85 |
| Median Property Value | $100,200 | $86,000 |
| Median Household Income | $17,452 | $0 |
| Monthly Housing Costs | $125 | $0 |
| Real Estate Taxes | - | - |
Property Value by Mortgage Status in Parcelas Penuelas
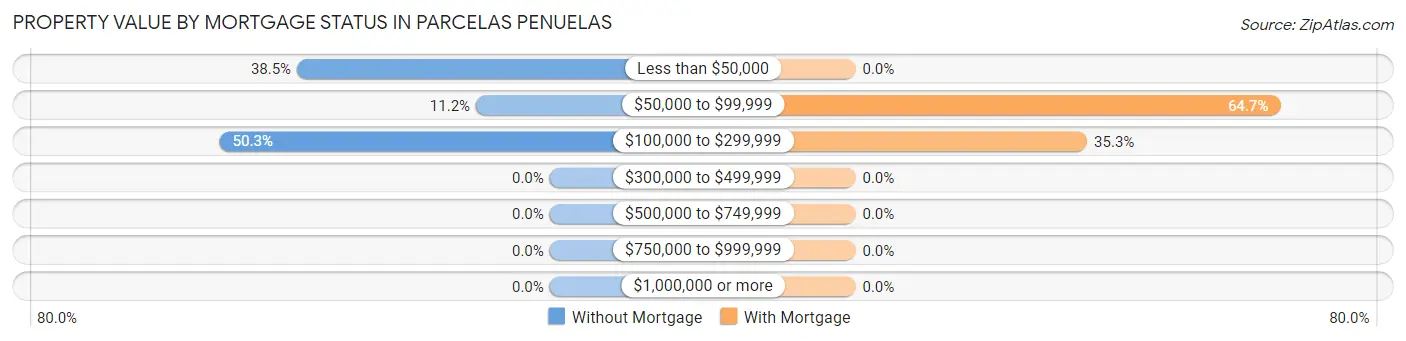
| Property Value | Without Mortgage | With Mortgage |
| Less than $50,000 | 72 (38.5%) | 0 (0.0%) |
| $50,000 to $99,999 | 21 (11.2%) | 55 (64.7%) |
| $100,000 to $299,999 | 94 (50.3%) | 30 (35.3%) |
| $300,000 to $499,999 | 0 (0.0%) | 0 (0.0%) |
| $500,000 to $749,999 | 0 (0.0%) | 0 (0.0%) |
| $750,000 to $999,999 | 0 (0.0%) | 0 (0.0%) |
| $1,000,000 or more | 0 (0.0%) | 0 (0.0%) |
| Total | 187 (100.0%) | 85 (100.0%) |
Household Income by Mortgage Status in Parcelas Penuelas
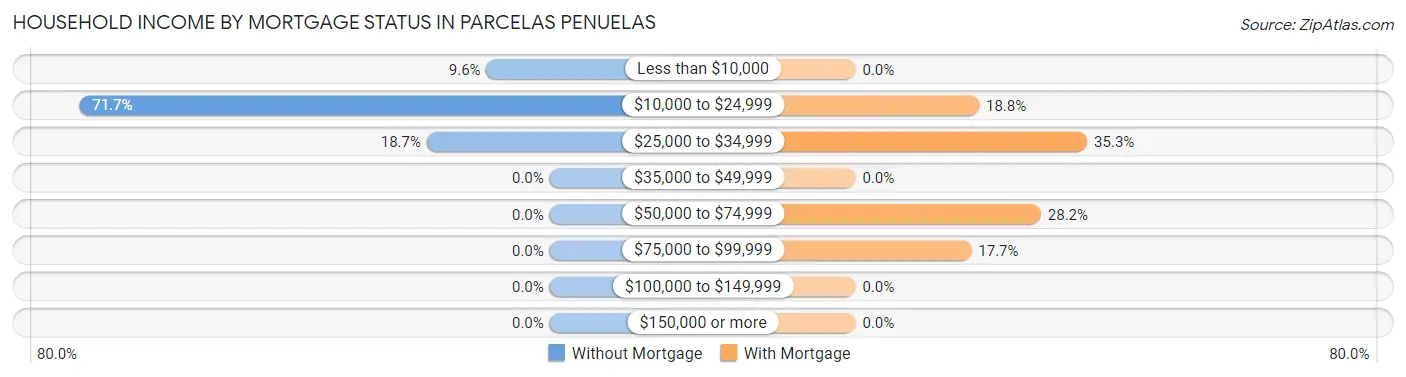
| Household Income | Without Mortgage | With Mortgage |
| Less than $10,000 | 18 (9.6%) | 0 (0.0%) |
| $10,000 to $24,999 | 134 (71.7%) | 16 (18.8%) |
| $25,000 to $34,999 | 35 (18.7%) | 30 (35.3%) |
| $35,000 to $49,999 | 0 (0.0%) | 0 (0.0%) |
| $50,000 to $74,999 | 0 (0.0%) | 24 (28.2%) |
| $75,000 to $99,999 | 0 (0.0%) | 15 (17.6%) |
| $100,000 to $149,999 | 0 (0.0%) | 0 (0.0%) |
| $150,000 or more | 0 (0.0%) | 0 (0.0%) |
| Total | 187 (100.0%) | 85 (100.0%) |
Property Value to Household Income Ratio in Parcelas Penuelas
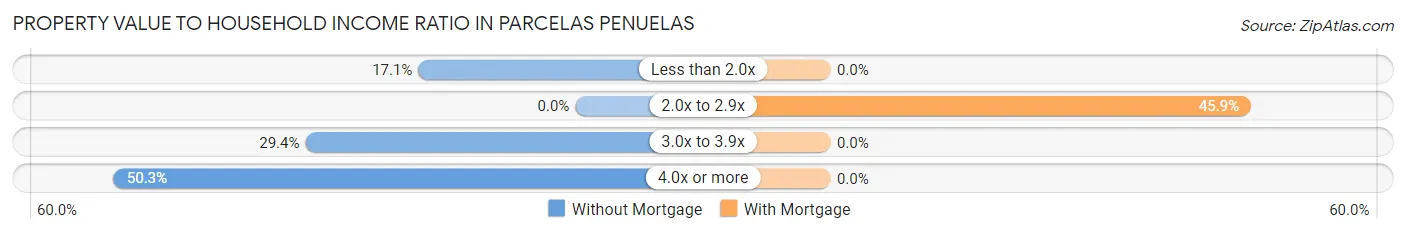
| Value-to-Income Ratio | Without Mortgage | With Mortgage |
| Less than 2.0x | 32 (17.1%) | 0 (0.0%) |
| 2.0x to 2.9x | 0 (0.0%) | 39 (45.9%) |
| 3.0x to 3.9x | 55 (29.4%) | 0 (0.0%) |
| 4.0x or more | 94 (50.3%) | 0 (0.0%) |
| Total | 187 (100.0%) | 85 (100.0%) |
Real Estate Taxes by Mortgage Status in Parcelas Penuelas
| Property Taxes | Without Mortgage | With Mortgage |
| Less than $800 | 0 (0.0%) | 0 (0.0%) |
| $800 to $1,499 | 0 (0.0%) | 0 (0.0%) |
| $800 to $1,499 | 0 (0.0%) | 0 (0.0%) |
| Total | 187 (100.0%) | 85 (100.0%) |
Health & Disability in Parcelas Penuelas
Health Insurance Coverage by Age in Parcelas Penuelas
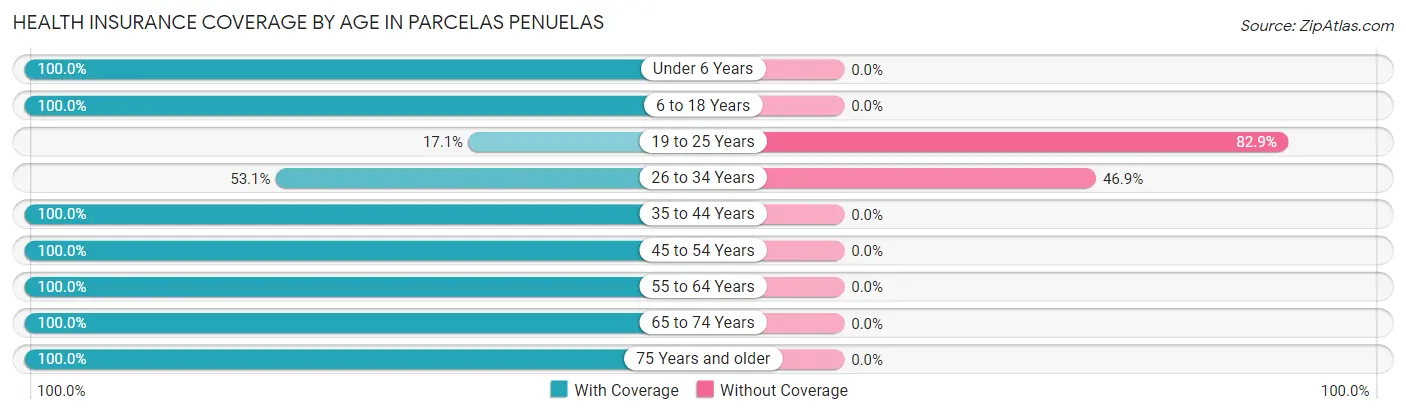
| Age Bracket | With Coverage | Without Coverage |
| Under 6 Years | 55 (100.0%) | 0 (0.0%) |
| 6 to 18 Years | 44 (100.0%) | 0 (0.0%) |
| 19 to 25 Years | 12 (17.1%) | 58 (82.9%) |
| 26 to 34 Years | 26 (53.1%) | 23 (46.9%) |
| 35 to 44 Years | 216 (100.0%) | 0 (0.0%) |
| 45 to 54 Years | 155 (100.0%) | 0 (0.0%) |
| 55 to 64 Years | 148 (100.0%) | 0 (0.0%) |
| 65 to 74 Years | 85 (100.0%) | 0 (0.0%) |
| 75 Years and older | 45 (100.0%) | 0 (0.0%) |
| Total | 786 (90.7%) | 81 (9.3%) |
Health Insurance Coverage by Citizenship Status in Parcelas Penuelas
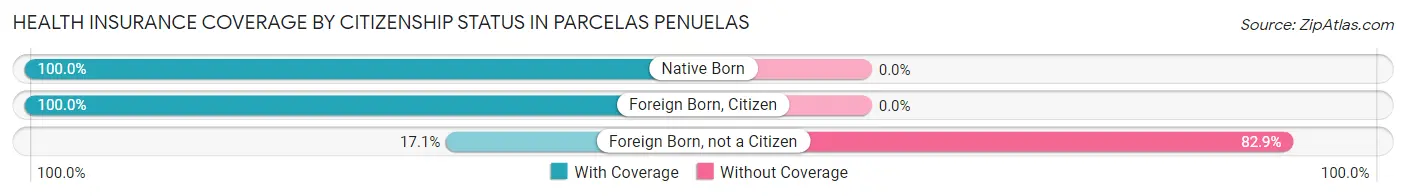
| Citizenship Status | With Coverage | Without Coverage |
| Native Born | 55 (100.0%) | 0 (0.0%) |
| Foreign Born, Citizen | 44 (100.0%) | 0 (0.0%) |
| Foreign Born, not a Citizen | 12 (17.1%) | 58 (82.9%) |
Health Insurance Coverage by Household Income in Parcelas Penuelas
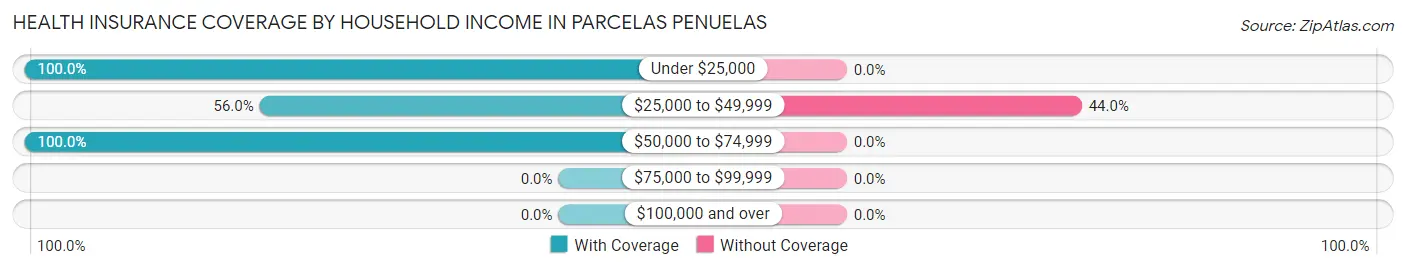
| Household Income | With Coverage | Without Coverage |
| Under $25,000 | 634 (100.0%) | 0 (0.0%) |
| $25,000 to $49,999 | 103 (56.0%) | 81 (44.0%) |
| $50,000 to $74,999 | 49 (100.0%) | 0 (0.0%) |
| $75,000 to $99,999 | 0 (0.0%) | 0 (0.0%) |
| $100,000 and over | 0 (0.0%) | 0 (0.0%) |
Public vs Private Health Insurance Coverage by Age in Parcelas Penuelas
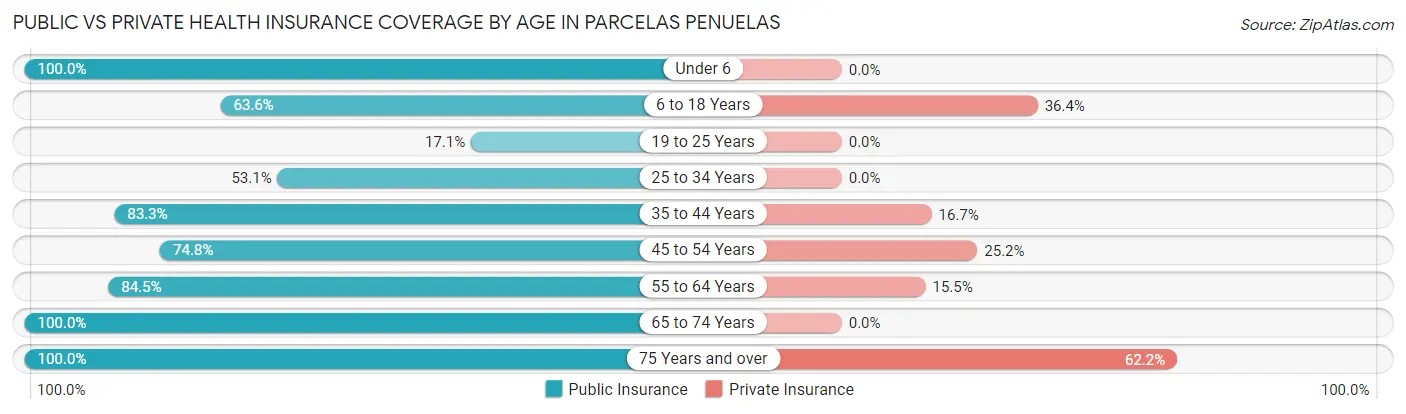
| Age Bracket | Public Insurance | Private Insurance |
| Under 6 | 55 (100.0%) | 0 (0.0%) |
| 6 to 18 Years | 28 (63.6%) | 16 (36.4%) |
| 19 to 25 Years | 12 (17.1%) | 0 (0.0%) |
| 25 to 34 Years | 26 (53.1%) | 0 (0.0%) |
| 35 to 44 Years | 180 (83.3%) | 36 (16.7%) |
| 45 to 54 Years | 116 (74.8%) | 39 (25.2%) |
| 55 to 64 Years | 125 (84.5%) | 23 (15.5%) |
| 65 to 74 Years | 85 (100.0%) | 0 (0.0%) |
| 75 Years and over | 45 (100.0%) | 28 (62.2%) |
| Total | 672 (77.5%) | 142 (16.4%) |
Disability Status by Sex by Age in Parcelas Penuelas
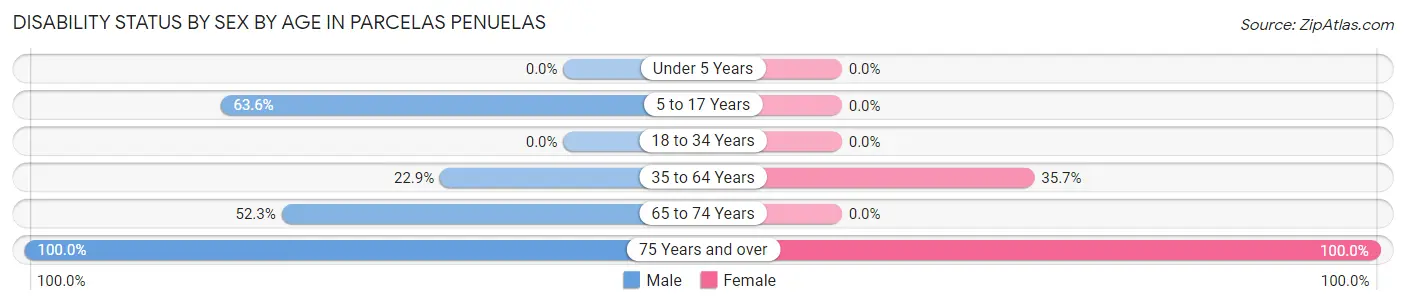
| Age Bracket | Male | Female |
| Under 5 Years | 0 (0.0%) | 0 (0.0%) |
| 5 to 17 Years | 28 (63.6%) | 0 (0.0%) |
| 18 to 34 Years | 0 (0.0%) | 0 (0.0%) |
| 35 to 64 Years | 65 (22.9%) | 84 (35.7%) |
| 65 to 74 Years | 34 (52.3%) | 0 (0.0%) |
| 75 Years and over | 31 (100.0%) | 14 (100.0%) |
Disability Class by Sex by Age in Parcelas Penuelas
Disability Class: Hearing Difficulty
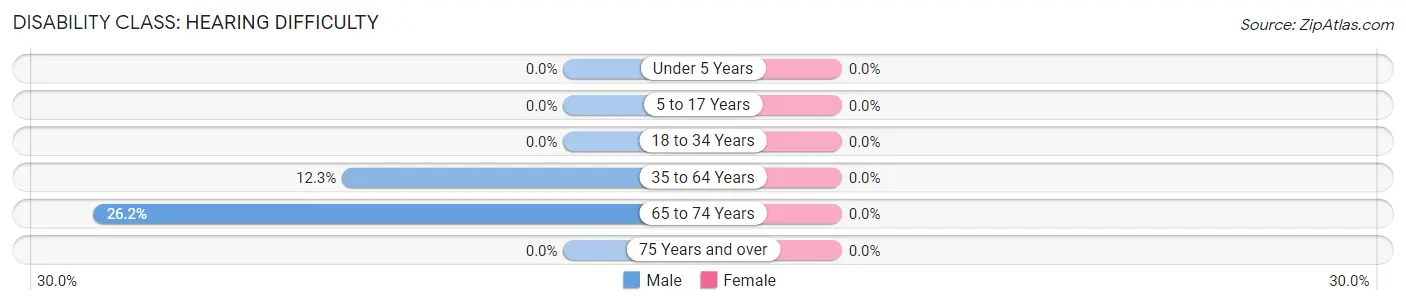
| Age Bracket | Male | Female |
| Under 5 Years | 0 (0.0%) | 0 (0.0%) |
| 5 to 17 Years | 0 (0.0%) | 0 (0.0%) |
| 18 to 34 Years | 0 (0.0%) | 0 (0.0%) |
| 35 to 64 Years | 35 (12.3%) | 0 (0.0%) |
| 65 to 74 Years | 17 (26.2%) | 0 (0.0%) |
| 75 Years and over | 0 (0.0%) | 0 (0.0%) |
Disability Class: Vision Difficulty
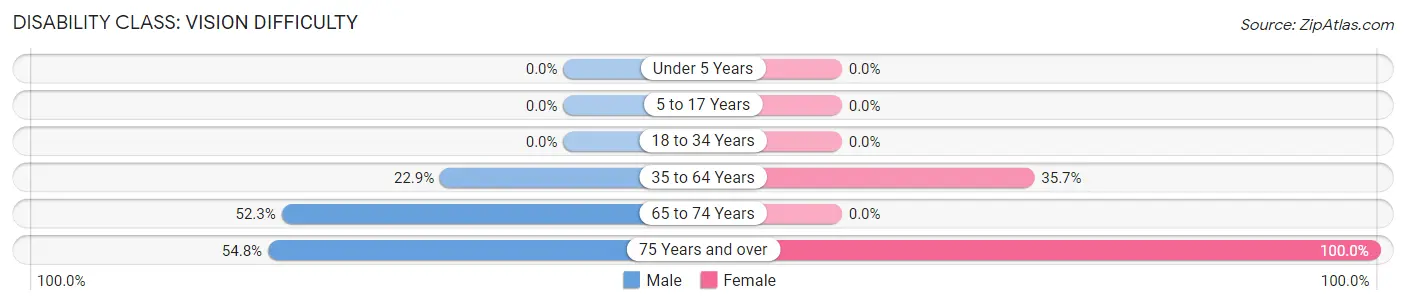
| Age Bracket | Male | Female |
| Under 5 Years | 0 (0.0%) | 0 (0.0%) |
| 5 to 17 Years | 0 (0.0%) | 0 (0.0%) |
| 18 to 34 Years | 0 (0.0%) | 0 (0.0%) |
| 35 to 64 Years | 65 (22.9%) | 84 (35.7%) |
| 65 to 74 Years | 34 (52.3%) | 0 (0.0%) |
| 75 Years and over | 17 (54.8%) | 14 (100.0%) |
Disability Class: Cognitive Difficulty
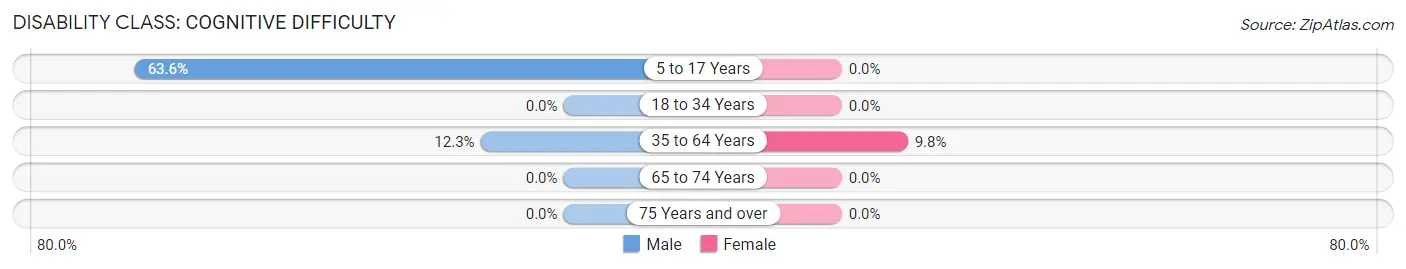
| Age Bracket | Male | Female |
| 5 to 17 Years | 28 (63.6%) | 0 (0.0%) |
| 18 to 34 Years | 0 (0.0%) | 0 (0.0%) |
| 35 to 64 Years | 35 (12.3%) | 23 (9.8%) |
| 65 to 74 Years | 0 (0.0%) | 0 (0.0%) |
| 75 Years and over | 0 (0.0%) | 0 (0.0%) |
Disability Class: Ambulatory Difficulty
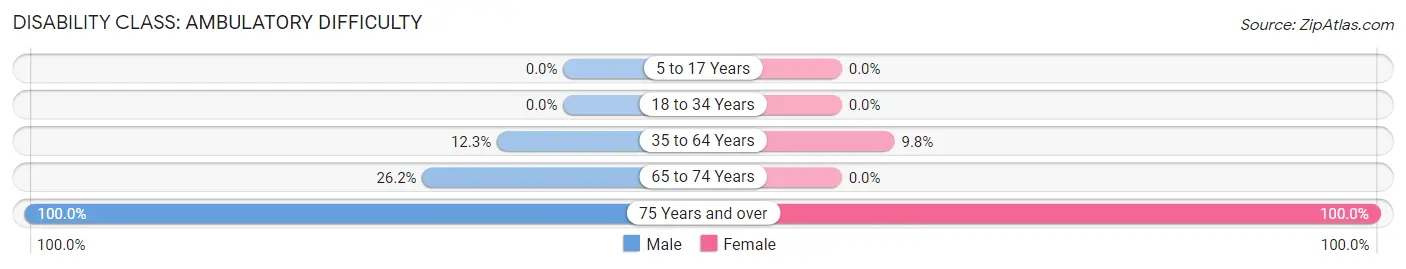
| Age Bracket | Male | Female |
| 5 to 17 Years | 0 (0.0%) | 0 (0.0%) |
| 18 to 34 Years | 0 (0.0%) | 0 (0.0%) |
| 35 to 64 Years | 35 (12.3%) | 23 (9.8%) |
| 65 to 74 Years | 17 (26.2%) | 0 (0.0%) |
| 75 Years and over | 31 (100.0%) | 14 (100.0%) |
Disability Class: Self-Care Difficulty

| Age Bracket | Male | Female |
| 5 to 17 Years | 0 (0.0%) | 0 (0.0%) |
| 18 to 34 Years | 0 (0.0%) | 0 (0.0%) |
| 35 to 64 Years | 35 (12.3%) | 23 (9.8%) |
| 65 to 74 Years | 17 (26.2%) | 0 (0.0%) |
| 75 Years and over | 0 (0.0%) | 14 (100.0%) |
Technology Access in Parcelas Penuelas
Computing Device Access in Parcelas Penuelas
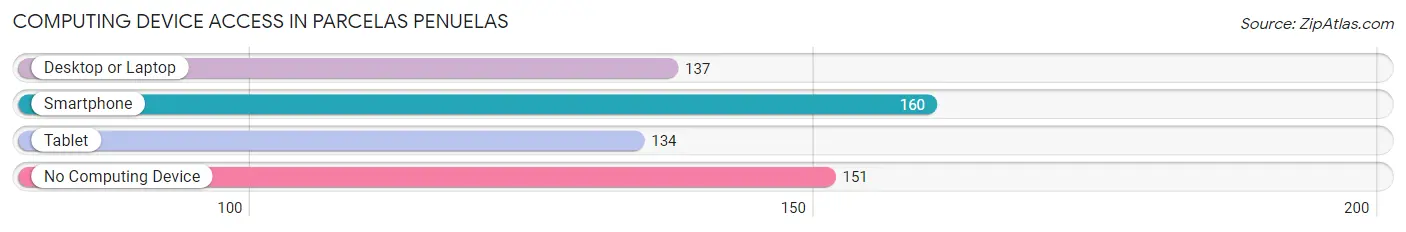
| Device Type | # Households | % Households |
| Desktop or Laptop | 137 | 38.8% |
| Smartphone | 160 | 45.3% |
| Tablet | 134 | 38.0% |
| No Computing Device | 151 | 42.8% |
| Total | 353 | 100.0% |
Internet Access in Parcelas Penuelas
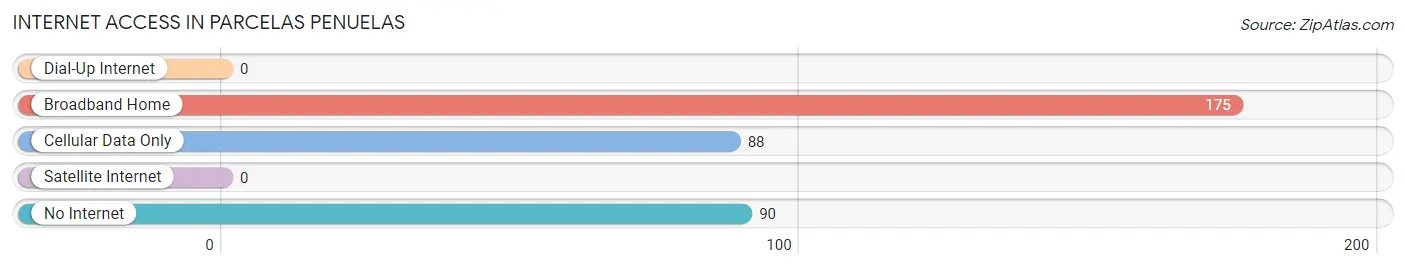
| Internet Type | # Households | % Households |
| Dial-Up Internet | 0 | 0.0% |
| Broadband Home | 175 | 49.6% |
| Cellular Data Only | 88 | 24.9% |
| Satellite Internet | 0 | 0.0% |
| No Internet | 90 | 25.5% |
| Total | 353 | 100.0% |
Parcelas Penuelas Summary
Parcelas Penuelas is a small town located in the municipality of Penuelas, Puerto Rico. It is situated in the southwestern part of the island, about 20 miles from the capital city of San Juan. The town has a population of approximately 2,000 people and is known for its agricultural production.
Geography
Parcelas Penuelas is located in the southwestern part of Puerto Rico, in the municipality of Penuelas. It is situated at an elevation of about 500 feet above sea level and is surrounded by mountains. The town is located near the Caribbean Sea and is about 20 miles from the capital city of San Juan. The climate in Parcelas Penuelas is tropical, with temperatures ranging from the mid-70s to the mid-80s Fahrenheit.
Economy
The economy of Parcelas Penuelas is largely based on agriculture. The town is known for its production of coffee, sugar cane, and other crops. In addition, the town is home to several small businesses, including restaurants, grocery stores, and other retail establishments.
Demographics
As of the 2010 census, the population of Parcelas Penuelas was 2,000. The majority of the population is of Hispanic or Latino descent, with a small percentage of African American and other ethnicities. The median age of the population is 33 years old, and the median household income is $17,000.
History
Parcelas Penuelas was founded in the late 19th century by a group of farmers from the nearby town of Penuelas. The town was originally known as “Las Parcelas”, which means “the parcels” in Spanish. The name was changed to Parcelas Penuelas in the early 20th century.
The town has a long history of agricultural production, and it was one of the first towns in Puerto Rico to produce coffee. In the early 20th century, the town was also known for its production of sugar cane.
In the late 20th century, Parcelas Penuelas experienced a period of economic decline. The town was hit hard by the economic crisis of the 1980s and 1990s, and many of its residents left in search of better opportunities elsewhere. However, in recent years, the town has seen a resurgence in its economy, and it is now home to several small businesses.
Conclusion
Parcelas Penuelas is a small town located in the municipality of Penuelas, Puerto Rico. It is situated in the southwestern part of the island, about 20 miles from the capital city of San Juan. The town has a population of approximately 2,000 people and is known for its agricultural production. The economy of Parcelas Penuelas is largely based on agriculture, and the town is home to several small businesses. The majority of the population is of Hispanic or Latino descent, with a small percentage of African American and other ethnicities. Parcelas Penuelas has a long history of agricultural production, and it was one of the first towns in Puerto Rico to produce coffee. In recent years, the town has seen a resurgence in its economy, and it is now home to several small businesses.
Common Questions
What is Per Capita Income in Parcelas Penuelas?
Per Capita income in Parcelas Penuelas is $8,927.
What is the Median Household income in Parcelas Penuelas?
Median Household Income in Parcelas Penuelas is $15,433.
What is Income or Wage Gap in Parcelas Penuelas?
Income or Wage Gap in Parcelas Penuelas is 26.0%.
Women in Parcelas Penuelas earn 74.0 cents for every dollar earned by a man.
What is Inequality or Gini Index in Parcelas Penuelas?
Inequality or Gini Index in Parcelas Penuelas is 0.36.
What is the Total Population of Parcelas Penuelas?
Total Population of Parcelas Penuelas is 877.
What is the Total Male Population of Parcelas Penuelas?
Total Male Population of Parcelas Penuelas is 485.
What is the Total Female Population of Parcelas Penuelas?
Total Female Population of Parcelas Penuelas is 392.
What is the Ratio of Males per 100 Females in Parcelas Penuelas?
There are 123.72 Males per 100 Females in Parcelas Penuelas.
What is the Ratio of Females per 100 Males in Parcelas Penuelas?
There are 80.82 Females per 100 Males in Parcelas Penuelas.
What is the Median Population Age in Parcelas Penuelas?
Median Population Age in Parcelas Penuelas is 45.3 Years.
What is the Average Family Size in Parcelas Penuelas
Average Family Size in Parcelas Penuelas is 3.1 People.
What is the Average Household Size in Parcelas Penuelas
Average Household Size in Parcelas Penuelas is 2.5 People.
How Large is the Labor Force in Parcelas Penuelas?
There are 404 People in the Labor Forcein in Parcelas Penuelas.
What is the Percentage of People in the Labor Force in Parcelas Penuelas?
50.9% of People are in the Labor Force in Parcelas Penuelas.