Rodriguez Hevia, PR Map & Demographics
Rodriguez Hevia Overview
$16,080
PER CAPITA INCOME
$43,068
AVG FAMILY INCOME
$43,298
AVG HOUSEHOLD INCOME
0.37
INEQUALITY / GINI INDEX
591
TOTAL POPULATION
232
MALE POPULATION
359
FEMALE POPULATION
64.62
MALES / 100 FEMALES
154.74
FEMALES / 100 MALES
42.3
MEDIAN AGE
3.9
AVG FAMILY SIZE
3.3
AVG HOUSEHOLD SIZE
337
LABOR FORCE [ PEOPLE ]
60.2%
PERCENT IN LABOR FORCE
4.2%
UNEMPLOYMENT RATE
Income in Rodriguez Hevia
Income Overview in Rodriguez Hevia
Per Capita Income in Rodriguez Hevia is $16,080, while median incomes of families and households are $43,068 and $43,298 respectively.
| Characteristic | Number | Measure |
| Per Capita Income | 591 | $16,080 |
| Median Family Income | 131 | $43,068 |
| Mean Family Income | 131 | $45,996 |
| Median Household Income | 178 | $43,298 |
| Mean Household Income | 178 | $43,840 |
| Income Deficit | 131 | $0 |
| Wage / Income Gap (%) | 591 | 0.00% |
| Wage / Income Gap ($) | 591 | 100.00¢ per $1 |
| Gini / Inequality Index | 591 | 0.37 |
Earnings by Sex in Rodriguez Hevia
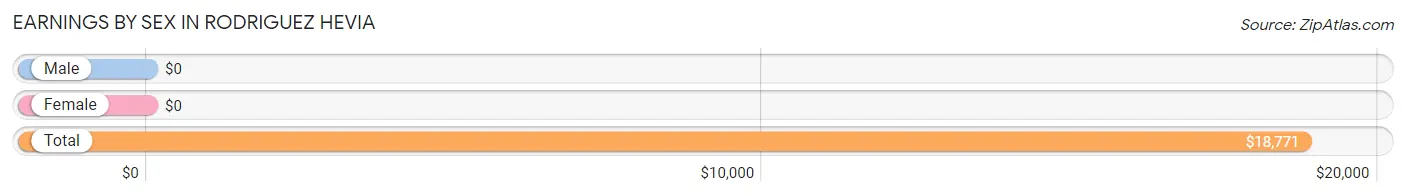
| Sex | Number | Average Earnings |
| Male | 136 (42.1%) | $0 |
| Female | 187 (57.9%) | $0 |
| Total | 323 (100.0%) | $18,771 |
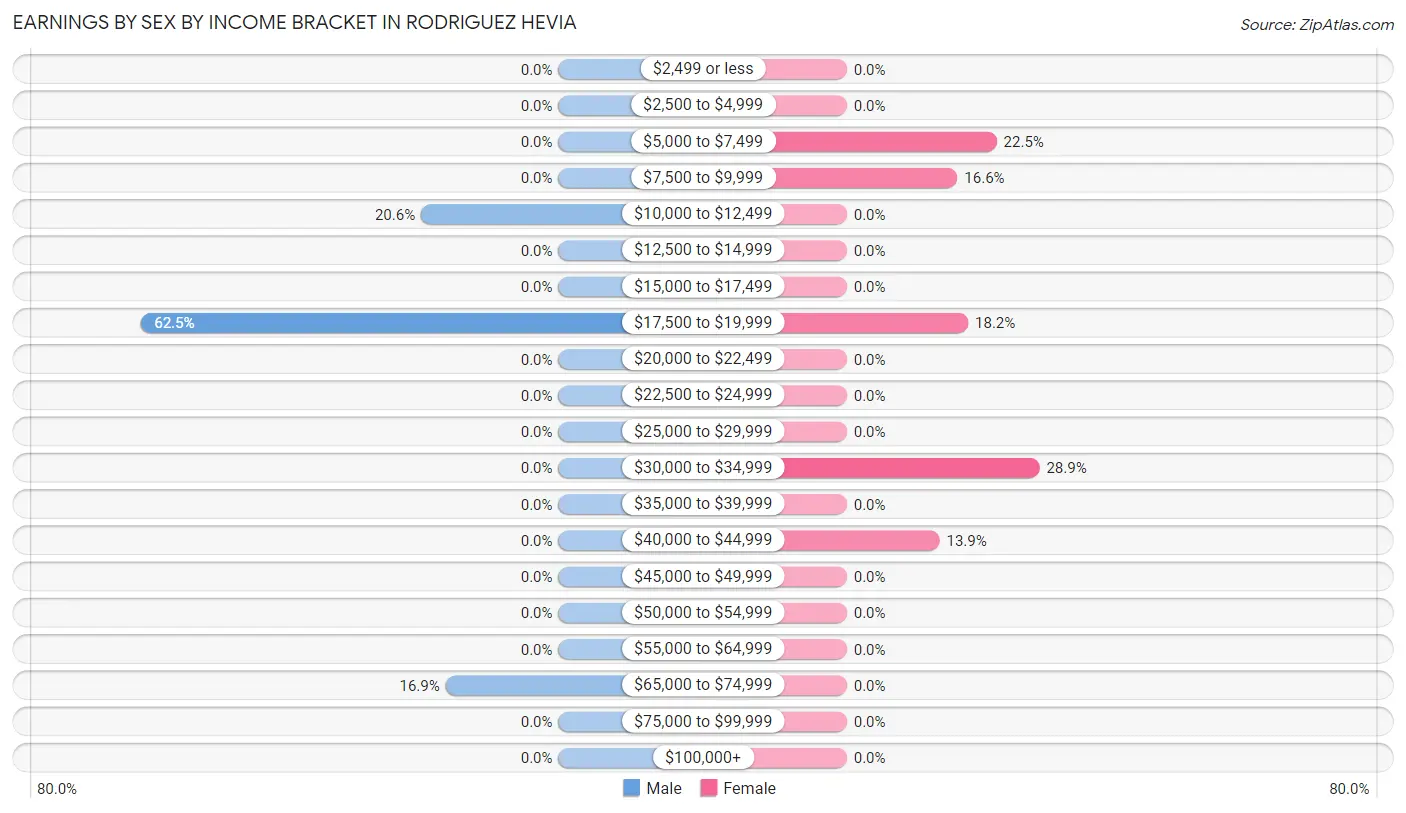
Earnings by Sex by Income Bracket in Rodriguez Hevia
The most common earnings brackets in Rodriguez Hevia are $17,500 to $19,999 for men (85 | 62.5%) and $30,000 to $34,999 for women (54 | 28.9%).
| Income | Male | Female |
| $2,499 or less | 0 (0.0%) | 0 (0.0%) |
| $2,500 to $4,999 | 0 (0.0%) | 0 (0.0%) |
| $5,000 to $7,499 | 0 (0.0%) | 42 (22.5%) |
| $7,500 to $9,999 | 0 (0.0%) | 31 (16.6%) |
| $10,000 to $12,499 | 28 (20.6%) | 0 (0.0%) |
| $12,500 to $14,999 | 0 (0.0%) | 0 (0.0%) |
| $15,000 to $17,499 | 0 (0.0%) | 0 (0.0%) |
| $17,500 to $19,999 | 85 (62.5%) | 34 (18.2%) |
| $20,000 to $22,499 | 0 (0.0%) | 0 (0.0%) |
| $22,500 to $24,999 | 0 (0.0%) | 0 (0.0%) |
| $25,000 to $29,999 | 0 (0.0%) | 0 (0.0%) |
| $30,000 to $34,999 | 0 (0.0%) | 54 (28.9%) |
| $35,000 to $39,999 | 0 (0.0%) | 0 (0.0%) |
| $40,000 to $44,999 | 0 (0.0%) | 26 (13.9%) |
| $45,000 to $49,999 | 0 (0.0%) | 0 (0.0%) |
| $50,000 to $54,999 | 0 (0.0%) | 0 (0.0%) |
| $55,000 to $64,999 | 0 (0.0%) | 0 (0.0%) |
| $65,000 to $74,999 | 23 (16.9%) | 0 (0.0%) |
| $75,000 to $99,999 | 0 (0.0%) | 0 (0.0%) |
| $100,000+ | 0 (0.0%) | 0 (0.0%) |
| Total | 136 (100.0%) | 187 (100.0%) |
Earnings by Sex by Educational Attainment in Rodriguez Hevia
| Educational Attainment | Male Income | Female Income |
| Less than High School | - | - |
| High School Diploma | - | - |
| College or Associate's Degree | - | - |
| Bachelor's Degree | - | - |
| Graduate Degree | - | - |
| Total | - | - |
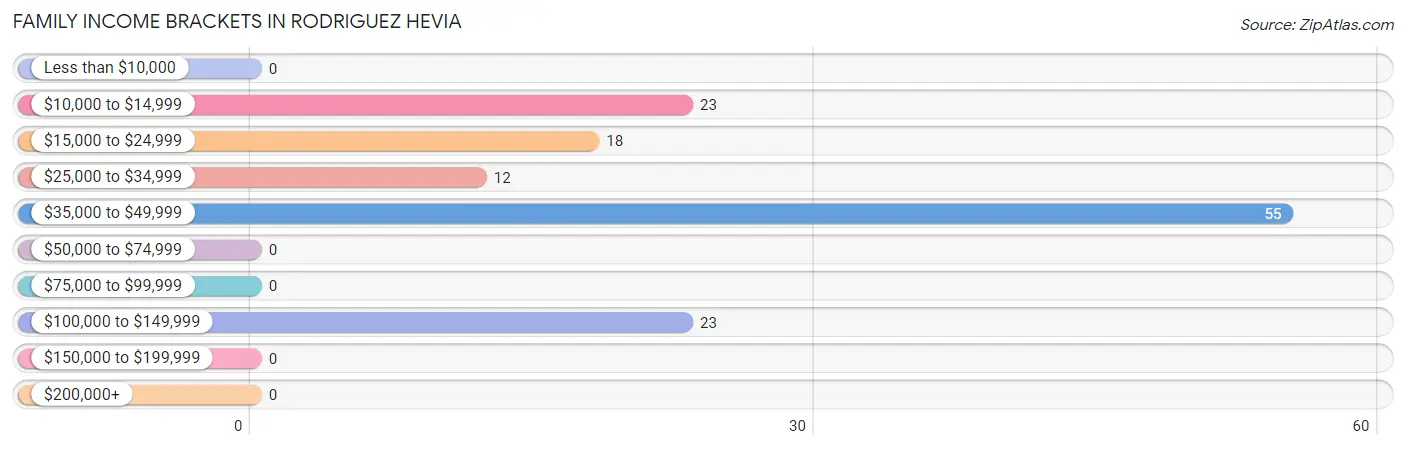
Family Income in Rodriguez Hevia
Family Income Brackets in Rodriguez Hevia
According to the Rodriguez Hevia family income data, there are 55 families falling into the $35,000 to $49,999 income range, which is the most common income bracket and makes up 42.0% of all families.
| Income Bracket | # Families | % Families |
| Less than $10,000 | 0 | 0.0% |
| $10,000 to $14,999 | 23 | 17.6% |
| $15,000 to $24,999 | 18 | 13.7% |
| $25,000 to $34,999 | 12 | 9.2% |
| $35,000 to $49,999 | 55 | 42.0% |
| $50,000 to $74,999 | 0 | 0.0% |
| $75,000 to $99,999 | 0 | 0.0% |
| $100,000 to $149,999 | 23 | 17.6% |
| $150,000 to $199,999 | 0 | 0.0% |
| $200,000+ | 0 | 0.0% |
Family Income by Famaliy Size in Rodriguez Hevia
| Income Bracket | # Families | Median Income |
| 2-Person Families | 18 (13.7%) | $0 |
| 3-Person Families | 67 (51.1%) | $0 |
| 4-Person Families | 46 (35.1%) | $0 |
| 5-Person Families | 0 (0.0%) | $0 |
| 6-Person Families | 0 (0.0%) | $0 |
| 7+ Person Families | 0 (0.0%) | $0 |
| Total | 131 (100.0%) | $43,068 |
Family Income by Number of Earners in Rodriguez Hevia
| Number of Earners | # Families | Median Income |
| No Earners | 41 (31.3%) | $0 |
| 1 Earner | 33 (25.2%) | $0 |
| 2 Earners | 23 (17.6%) | $0 |
| 3+ Earners | 34 (26.0%) | $0 |
| Total | 131 (100.0%) | $43,068 |
Household Income in Rodriguez Hevia
Household Income Brackets in Rodriguez Hevia
With 47 households falling in the category, the $35,000 to $49,999 income range is the most frequent in Rodriguez Hevia, accounting for 26.4% of all households.
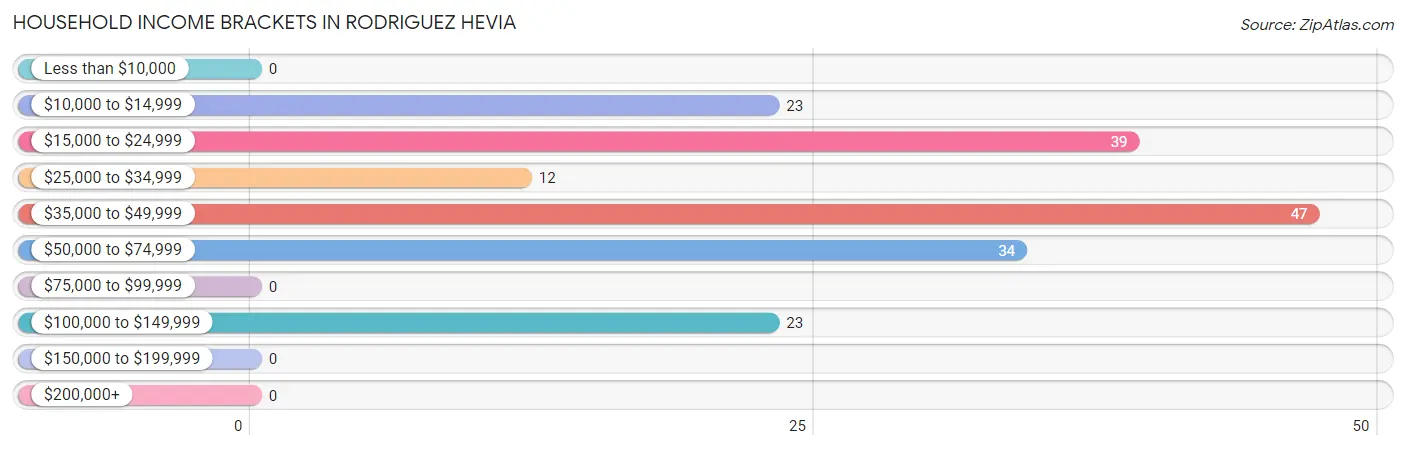
| Income Bracket | # Households | % Households |
| Less than $10,000 | 0 | 0.0% |
| $10,000 to $14,999 | 23 | 12.9% |
| $15,000 to $24,999 | 39 | 21.9% |
| $25,000 to $34,999 | 12 | 6.7% |
| $35,000 to $49,999 | 47 | 26.4% |
| $50,000 to $74,999 | 34 | 19.1% |
| $75,000 to $99,999 | 0 | 0.0% |
| $100,000 to $149,999 | 23 | 12.9% |
| $150,000 to $199,999 | 0 | 0.0% |
| $200,000+ | 0 | 0.0% |
Household Income by Householder Age in Rodriguez Hevia
| Income Bracket | # Households | Median Income |
| 15 to 24 Years | 0 (0.0%) | $0 |
| 25 to 44 Years | 57 (32.0%) | $0 |
| 45 to 64 Years | 61 (34.3%) | $0 |
| 65+ Years | 60 (33.7%) | $0 |
| Total | 178 (100.0%) | $43,298 |
Poverty in Rodriguez Hevia
Income Below Poverty by Sex and Age in Rodriguez Hevia
With 27.6% poverty level for males and 31.2% for females among the residents of Rodriguez Hevia, 35 to 44 year old males and 5 year old females are the most vulnerable to poverty, with 28 males (100.0%) and 31 females (100.0%) in their respective age groups living below the poverty level.
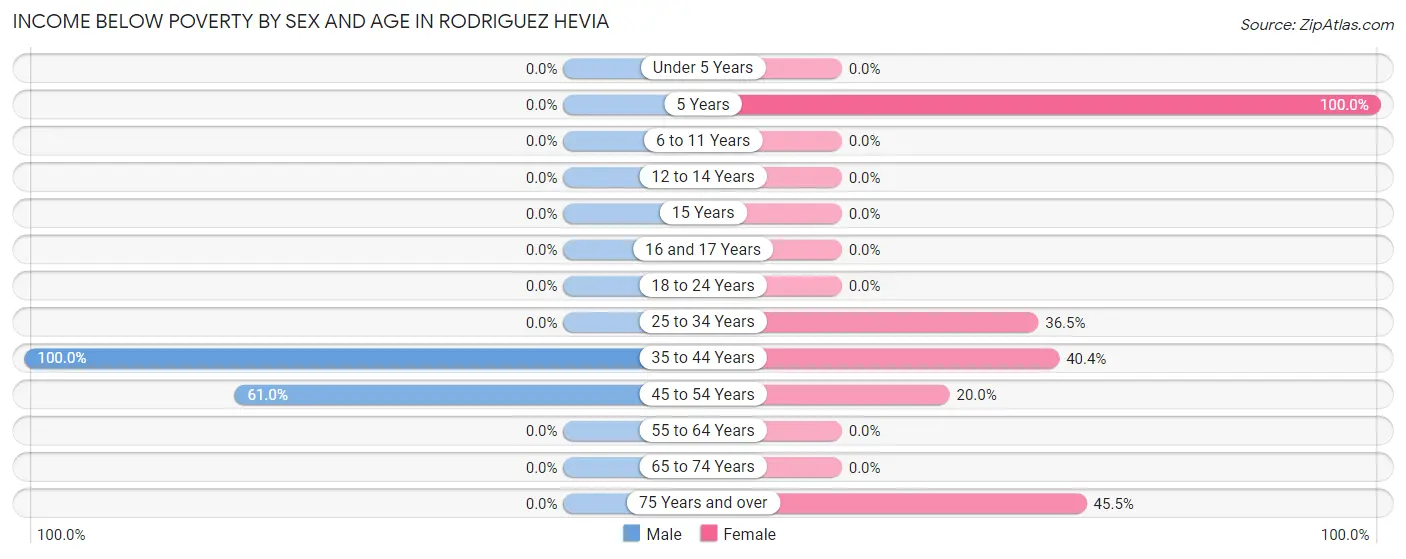
| Age Bracket | Male | Female |
| Under 5 Years | 0 (0.0%) | 0 (0.0%) |
| 5 Years | 0 (0.0%) | 31 (100.0%) |
| 6 to 11 Years | 0 (0.0%) | 0 (0.0%) |
| 12 to 14 Years | 0 (0.0%) | 0 (0.0%) |
| 15 Years | 0 (0.0%) | 0 (0.0%) |
| 16 and 17 Years | 0 (0.0%) | 0 (0.0%) |
| 18 to 24 Years | 0 (0.0%) | 0 (0.0%) |
| 25 to 34 Years | 0 (0.0%) | 31 (36.5%) |
| 35 to 44 Years | 28 (100.0%) | 23 (40.4%) |
| 45 to 54 Years | 36 (61.0%) | 12 (20.0%) |
| 55 to 64 Years | 0 (0.0%) | 0 (0.0%) |
| 65 to 74 Years | 0 (0.0%) | 0 (0.0%) |
| 75 Years and over | 0 (0.0%) | 15 (45.5%) |
| Total | 64 (27.6%) | 112 (31.2%) |
Income Above Poverty by Sex and Age in Rodriguez Hevia
According to the poverty statistics in Rodriguez Hevia, males aged 18 to 24 years and females aged 18 to 24 years are the age groups that are most secure financially, with 100.0% of males and 100.0% of females in these age groups living above the poverty line.
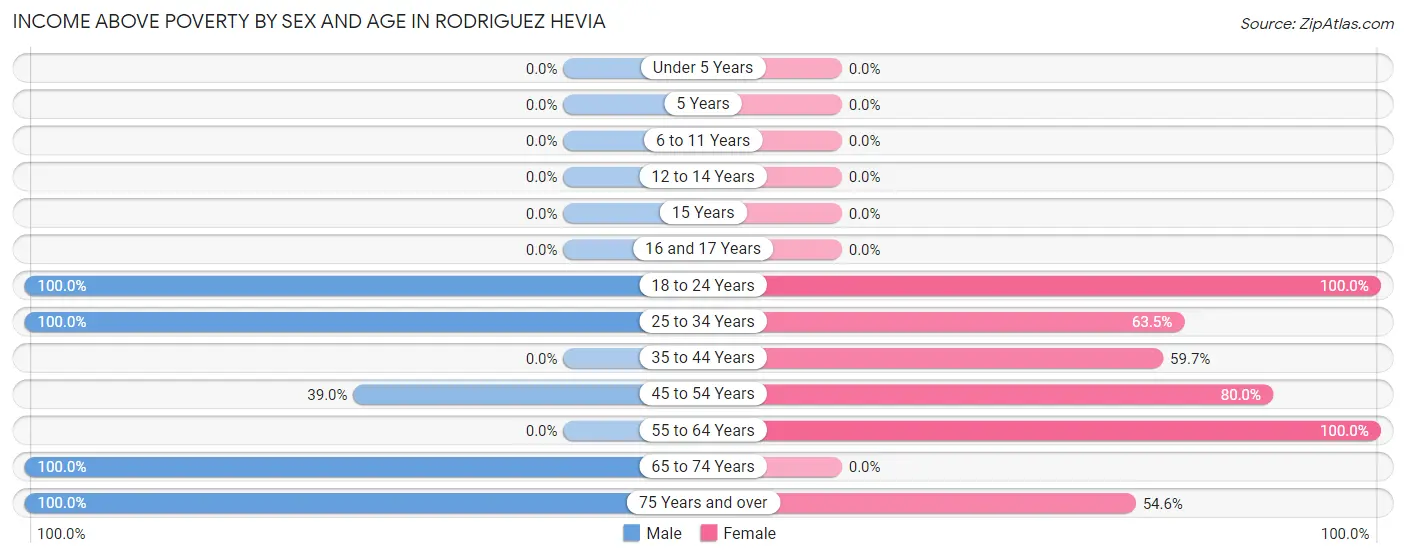
| Age Bracket | Male | Female |
| Under 5 Years | 0 (0.0%) | 0 (0.0%) |
| 5 Years | 0 (0.0%) | 0 (0.0%) |
| 6 to 11 Years | 0 (0.0%) | 0 (0.0%) |
| 12 to 14 Years | 0 (0.0%) | 0 (0.0%) |
| 15 Years | 0 (0.0%) | 0 (0.0%) |
| 16 and 17 Years | 0 (0.0%) | 0 (0.0%) |
| 18 to 24 Years | 45 (100.0%) | 76 (100.0%) |
| 25 to 34 Years | 40 (100.0%) | 54 (63.5%) |
| 35 to 44 Years | 0 (0.0%) | 34 (59.7%) |
| 45 to 54 Years | 23 (39.0%) | 48 (80.0%) |
| 55 to 64 Years | 0 (0.0%) | 17 (100.0%) |
| 65 to 74 Years | 42 (100.0%) | 0 (0.0%) |
| 75 Years and over | 18 (100.0%) | 18 (54.5%) |
| Total | 168 (72.4%) | 247 (68.8%) |
Income Below Poverty Among Married-Couple Families in Rodriguez Hevia
The poverty statistics for married-couple families in Rodriguez Hevia show that 36.1% or 35 of the total 97 families live below the poverty line. Families with 1 or 2 children have the highest poverty rate of 100.0%, comprising of 23 families. On the other hand, families with no children have the lowest poverty rate of 16.2%, which includes 12 families.
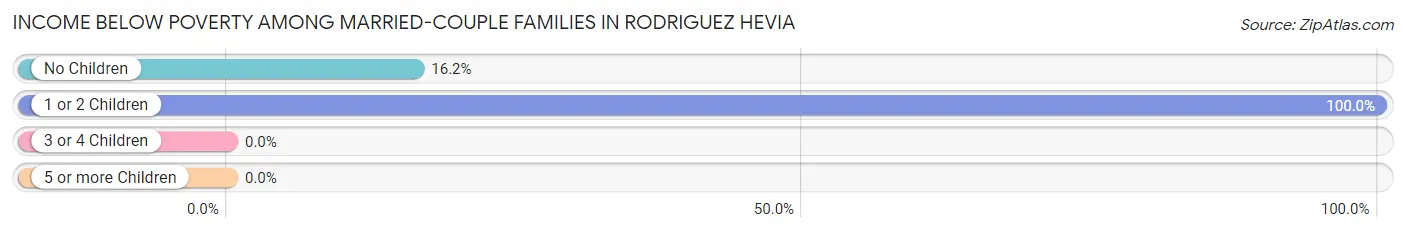
| Children | Above Poverty | Below Poverty |
| No Children | 62 (83.8%) | 12 (16.2%) |
| 1 or 2 Children | 0 (0.0%) | 23 (100.0%) |
| 3 or 4 Children | 0 (0.0%) | 0 (0.0%) |
| 5 or more Children | 0 (0.0%) | 0 (0.0%) |
| Total | 62 (63.9%) | 35 (36.1%) |
Income Below Poverty Among Single-Parent Households in Rodriguez Hevia
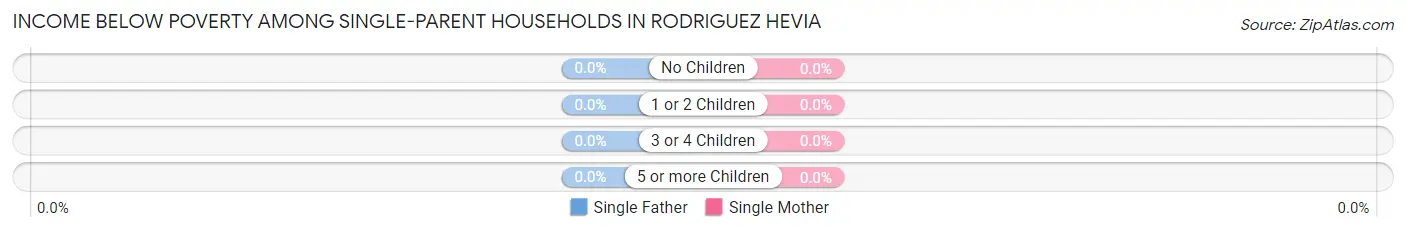
| Children | Single Father | Single Mother |
| No Children | 0 (0.0%) | 0 (0.0%) |
| 1 or 2 Children | 0 (0.0%) | 0 (0.0%) |
| 3 or 4 Children | 0 (0.0%) | 0 (0.0%) |
| 5 or more Children | 0 (0.0%) | 0 (0.0%) |
| Total | 0 (0.0%) | 0 (0.0%) |
Income Below Poverty Among Married-Couple vs Single-Parent Households in Rodriguez Hevia
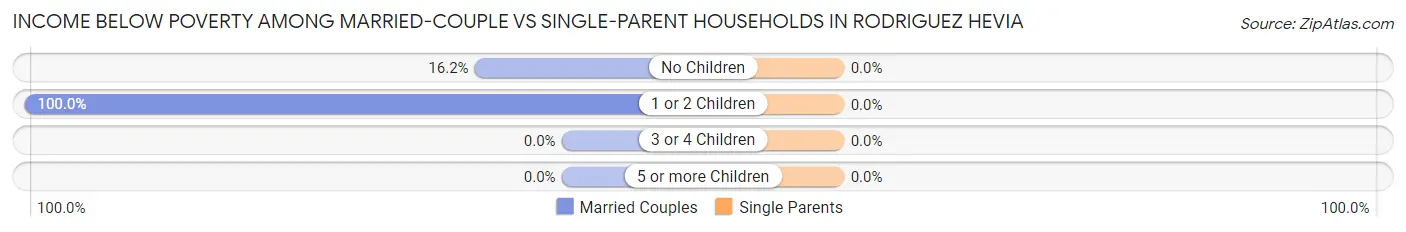
| Children | Married-Couple Families | Single-Parent Households |
| No Children | 12 (16.2%) | 0 (0.0%) |
| 1 or 2 Children | 23 (100.0%) | 0 (0.0%) |
| 3 or 4 Children | 0 (0.0%) | 0 (0.0%) |
| 5 or more Children | 0 (0.0%) | 0 (0.0%) |
| Total | 35 (36.1%) | 0 (0.0%) |
Race in Rodriguez Hevia
The most populous races in Rodriguez Hevia are Hispanic or Latino (591 | 100.0%), White / Caucasian (287 | 48.6%), and Two or more Races (169 | 28.6%).
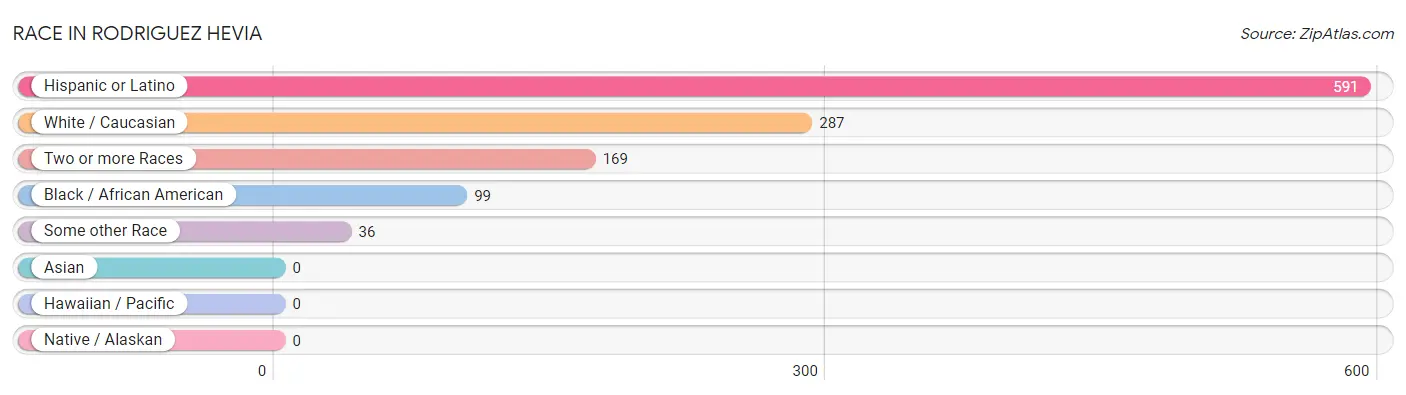
| Race | # Population | % Population |
| Asian | 0 | 0.0% |
| Black / African American | 99 | 16.8% |
| Hawaiian / Pacific | 0 | 0.0% |
| Hispanic or Latino | 591 | 100.0% |
| Native / Alaskan | 0 | 0.0% |
| White / Caucasian | 287 | 48.6% |
| Two or more Races | 169 | 28.6% |
| Some other Race | 36 | 6.1% |
| Total | 591 | 100.0% |
Ancestry in Rodriguez Hevia
The most populous ancestries reported in Rodriguez Hevia are , and Puerto Rican (591 | 100.0%), together accounting for 100.0% of all Rodriguez Hevia residents.

| Ancestry | # Population | % Population |
| Puerto Rican | 591 | 100.0% | View All 1 Rows |
Immigrants in Rodriguez Hevia

| Immigration Origin | # Population | % Population | View All 0 Rows |
Sex and Age in Rodriguez Hevia
Sex and Age in Rodriguez Hevia
The most populous age groups in Rodriguez Hevia are 20 to 24 Years (45 | 19.4%) for men and 25 to 29 Years (85 | 23.7%) for women.
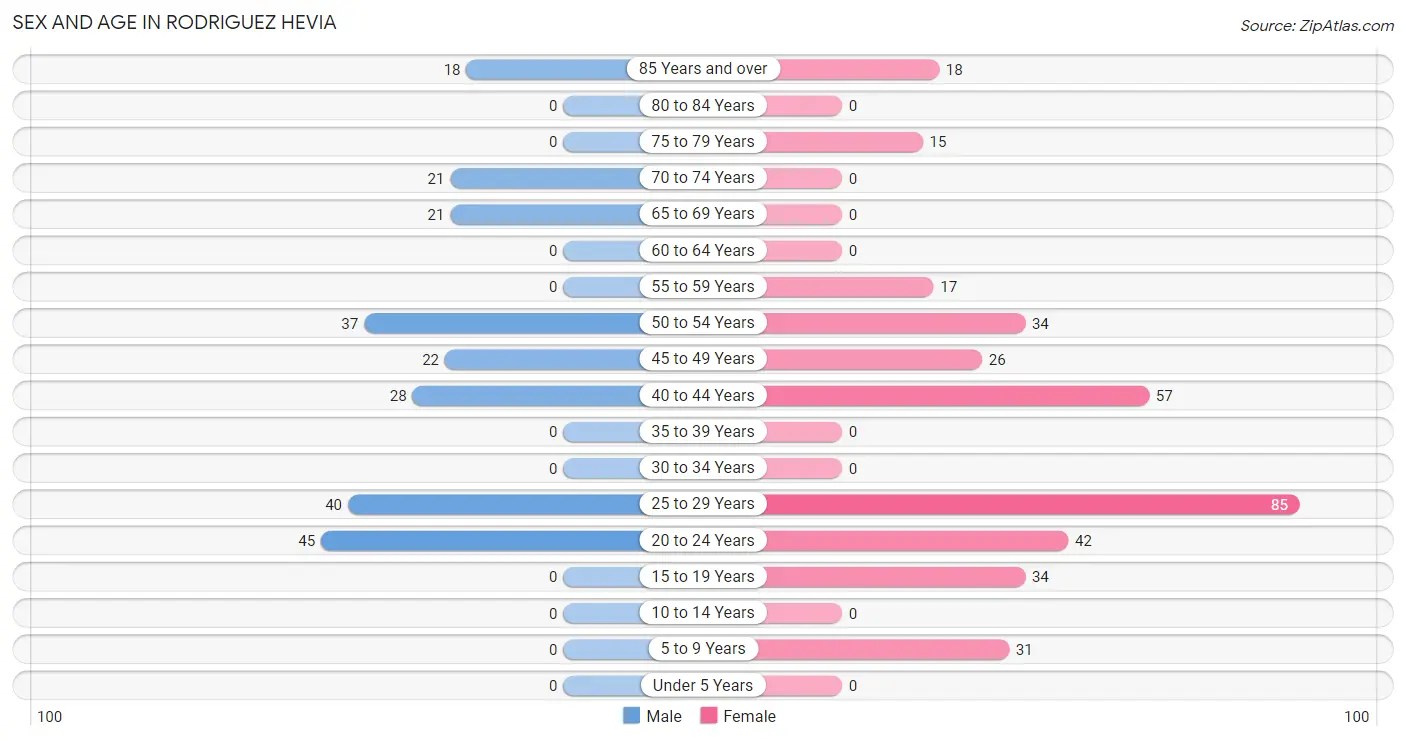
| Age Bracket | Male | Female |
| Under 5 Years | 0 (0.0%) | 0 (0.0%) |
| 5 to 9 Years | 0 (0.0%) | 31 (8.6%) |
| 10 to 14 Years | 0 (0.0%) | 0 (0.0%) |
| 15 to 19 Years | 0 (0.0%) | 34 (9.5%) |
| 20 to 24 Years | 45 (19.4%) | 42 (11.7%) |
| 25 to 29 Years | 40 (17.2%) | 85 (23.7%) |
| 30 to 34 Years | 0 (0.0%) | 0 (0.0%) |
| 35 to 39 Years | 0 (0.0%) | 0 (0.0%) |
| 40 to 44 Years | 28 (12.1%) | 57 (15.9%) |
| 45 to 49 Years | 22 (9.5%) | 26 (7.2%) |
| 50 to 54 Years | 37 (16.0%) | 34 (9.5%) |
| 55 to 59 Years | 0 (0.0%) | 17 (4.7%) |
| 60 to 64 Years | 0 (0.0%) | 0 (0.0%) |
| 65 to 69 Years | 21 (9.0%) | 0 (0.0%) |
| 70 to 74 Years | 21 (9.0%) | 0 (0.0%) |
| 75 to 79 Years | 0 (0.0%) | 15 (4.2%) |
| 80 to 84 Years | 0 (0.0%) | 0 (0.0%) |
| 85 Years and over | 18 (7.8%) | 18 (5.0%) |
| Total | 232 (100.0%) | 359 (100.0%) |
Families and Households in Rodriguez Hevia
Median Family Size in Rodriguez Hevia
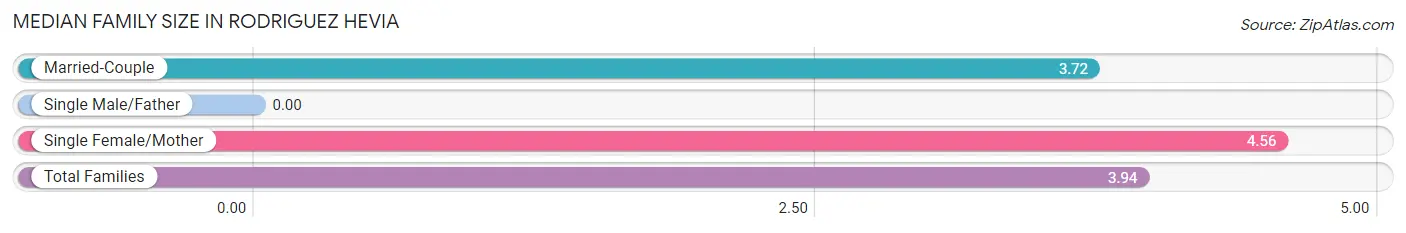
| Family Type | # Families | Family Size |
| Married-Couple | 97 (74.1%) | 3.72 |
| Single Male/Father | 0 (0.0%) | - |
| Single Female/Mother | 34 (26.0%) | 4.56 |
| Total Families | 131 (100.0%) | 3.94 |
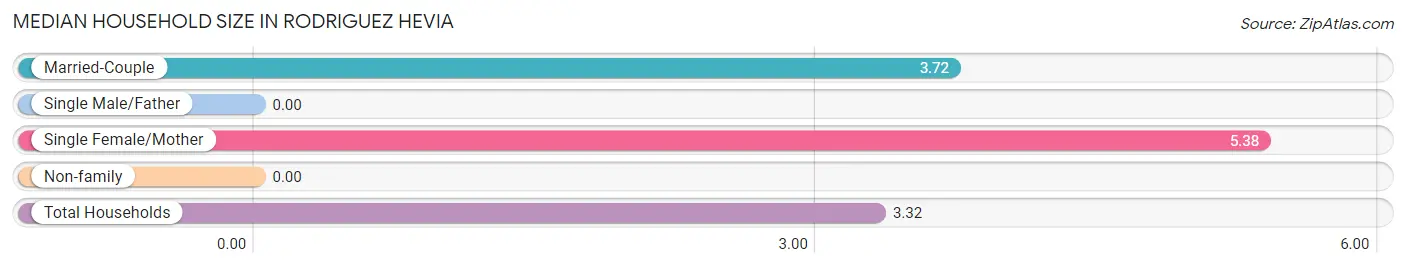
Median Household Size in Rodriguez Hevia
| Household Type | # Households | Household Size |
| Married-Couple | 97 (54.5%) | 3.72 |
| Single Male/Father | 0 (0.0%) | - |
| Single Female/Mother | 34 (19.1%) | 5.38 |
| Non-family | 47 (26.4%) | - |
| Total Households | 178 (100.0%) | 3.32 |
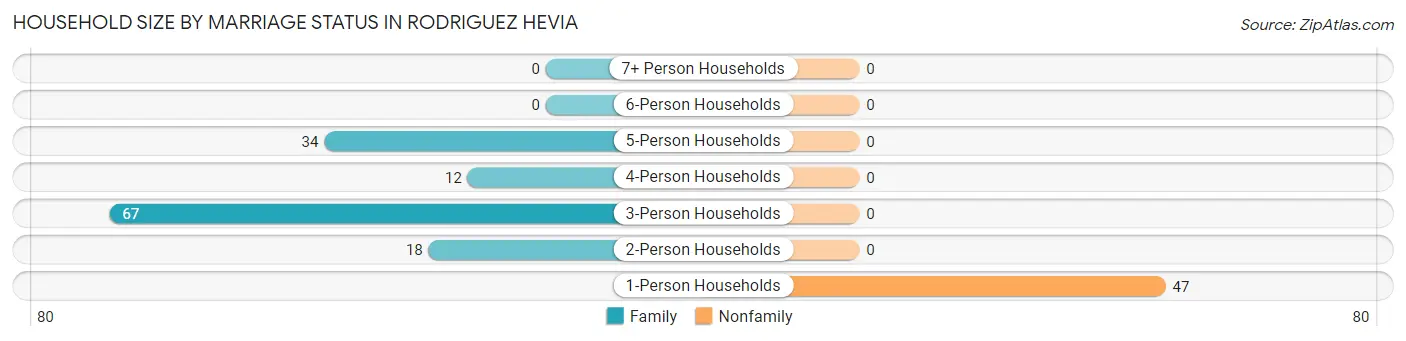
Household Size by Marriage Status in Rodriguez Hevia
Out of a total of 178 households in Rodriguez Hevia, 131 (73.6%) are family households, while 47 (26.4%) are nonfamily households. The most numerous type of family households are 3-person households, comprising 67, and the most common type of nonfamily households are 1-person households, comprising 47.
| Household Size | Family Households | Nonfamily Households |
| 1-Person Households | - | 47 (26.4%) |
| 2-Person Households | 18 (10.1%) | 0 (0.0%) |
| 3-Person Households | 67 (37.6%) | 0 (0.0%) |
| 4-Person Households | 12 (6.7%) | 0 (0.0%) |
| 5-Person Households | 34 (19.1%) | 0 (0.0%) |
| 6-Person Households | 0 (0.0%) | 0 (0.0%) |
| 7+ Person Households | 0 (0.0%) | 0 (0.0%) |
| Total | 131 (73.6%) | 47 (26.4%) |
Female Fertility in Rodriguez Hevia
Fertility by Age in Rodriguez Hevia
| Age Bracket | Women with Births | Births / 1,000 Women |
| 15 to 19 years | 0 (0.0%) | 0.0 |
| 20 to 34 years | 0 (0.0%) | 0.0 |
| 35 to 50 years | 0 (0.0%) | 0.0 |
| Total | 0 (0.0%) | 0.0 |
Fertility by Age by Marriage Status in Rodriguez Hevia
| Age Bracket | Married | Unmarried |
| 15 to 19 years | 0 (0.0%) | 0 (0.0%) |
| 20 to 34 years | 0 (0.0%) | 0 (0.0%) |
| 35 to 50 years | 0 (0.0%) | 0 (0.0%) |
| Total | 0 (0.0%) | 0 (0.0%) |
Fertility by Education in Rodriguez Hevia
| Educational Attainment | Women with Births | Births / 1,000 Women |
| Less than High School | 0 (0.0%) | 0.0 |
| High School Diploma | 0 (0.0%) | 0.0 |
| College or Associate's Degree | 0 (0.0%) | 0.0 |
| Bachelor's Degree | 0 (0.0%) | 0.0 |
| Graduate Degree | 0 (0.0%) | 0.0 |
| Total | 0 (0.0%) | 0.0 |
Fertility by Education by Marriage Status in Rodriguez Hevia
| Educational Attainment | Married | Unmarried |
| Less than High School | 0 (0.0%) | 0 (0.0%) |
| High School Diploma | 0 (0.0%) | 0 (0.0%) |
| College or Associate's Degree | 0 (0.0%) | 0 (0.0%) |
| Bachelor's Degree | 0 (0.0%) | 0 (0.0%) |
| Graduate Degree | 0 (0.0%) | 0 (0.0%) |
| Total | 0 (0.0%) | 0 (0.0%) |
Employment Characteristics in Rodriguez Hevia
Employment by Class of Employer in Rodriguez Hevia
Among the 323 employed individuals in Rodriguez Hevia, private company employees (297 | 91.9%), and state government employees (26 | 8.1%) make up the most common classes of employment.

| Employer Class | # Employees | % Employees |
| Private Company Employees | 297 | 91.9% |
| Self-Employed (Incorporated) | 0 | 0.0% |
| Self-Employed (Not Incorporated) | 0 | 0.0% |
| Not-for-profit Organizations | 0 | 0.0% |
| Local Government Employees | 0 | 0.0% |
| State Government Employees | 26 | 8.1% |
| Federal Government Employees | 0 | 0.0% |
| Unpaid Family Workers | 0 | 0.0% |
| Total | 323 | 100.0% |
Employment Status by Age in Rodriguez Hevia
According to the labor force statistics for Rodriguez Hevia, out of the total population over 16 years of age (560), 60.2% or 337 individuals are in the labor force, with 4.2% or 14 of them unemployed. The age group with the highest labor force participation rate is 20 to 24 years, with 100.0% or 87 individuals in the labor force. Within the labor force, the 45 to 54 years age range has the highest percentage of unemployed individuals, with 22.2% or 14 of them being unemployed.
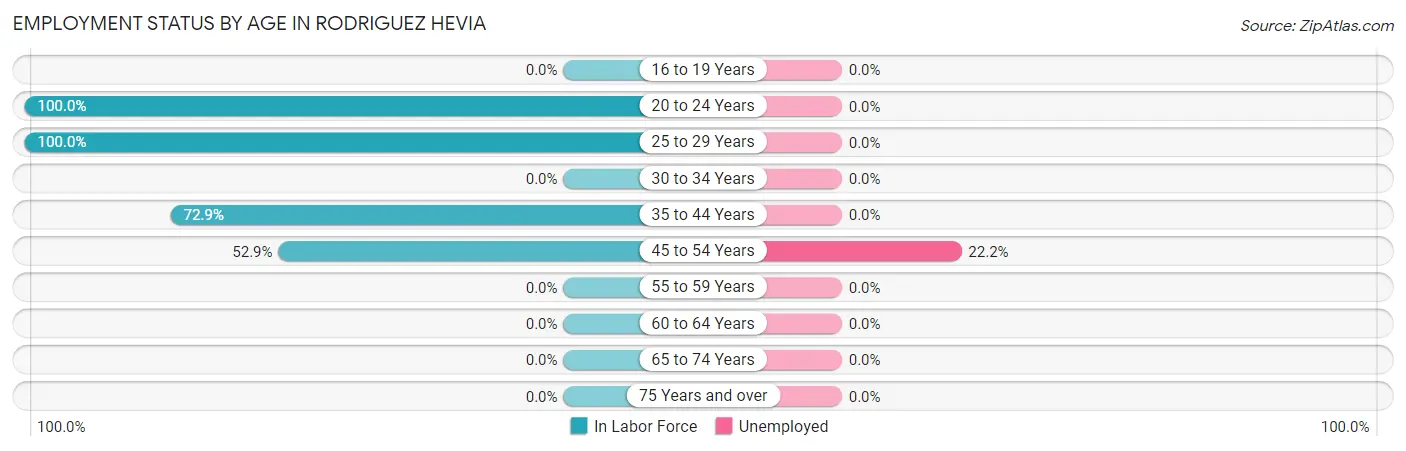
| Age Bracket | In Labor Force | Unemployed |
| 16 to 19 Years | 0 (0.0%) | 0 (0.0%) |
| 20 to 24 Years | 87 (100.0%) | 0 (0.0%) |
| 25 to 29 Years | 125 (100.0%) | 0 (0.0%) |
| 30 to 34 Years | 0 (0.0%) | 0 (0.0%) |
| 35 to 44 Years | 62 (72.9%) | 0 (0.0%) |
| 45 to 54 Years | 63 (52.9%) | 14 (22.2%) |
| 55 to 59 Years | 0 (0.0%) | 0 (0.0%) |
| 60 to 64 Years | 0 (0.0%) | 0 (0.0%) |
| 65 to 74 Years | 0 (0.0%) | 0 (0.0%) |
| 75 Years and over | 0 (0.0%) | 0 (0.0%) |
| Total | 337 (60.2%) | 14 (4.2%) |
Employment Status by Educational Attainment in Rodriguez Hevia
According to labor force statistics for Rodriguez Hevia, 72.3% of individuals (250) out of the total population between 25 and 64 years of age (346) are in the labor force, with 5.6% or 14 of them being unemployed. The group with the highest labor force participation rate are those with the educational attainment of college / associate degree, with 82.7% or 105 individuals in the labor force. Within the labor force, individuals with high school diploma education have the highest percentage of unemployment, with 100.0% or 14 of them being unemployed.
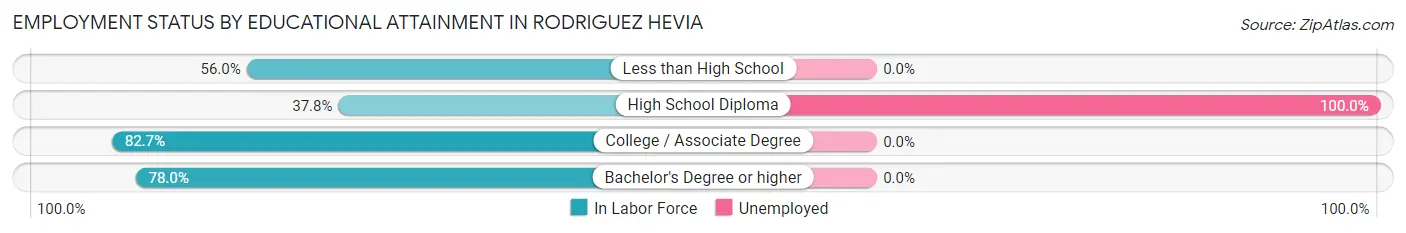
| Educational Attainment | In Labor Force | Unemployed |
| Less than High School | 28 (56.0%) | 0 (0.0%) |
| High School Diploma | 14 (37.8%) | 37 (100.0%) |
| College / Associate Degree | 105 (82.7%) | 0 (0.0%) |
| Bachelor's Degree or higher | 103 (78.0%) | 0 (0.0%) |
| Total | 250 (72.3%) | 19 (5.6%) |
Employment Occupations by Sex in Rodriguez Hevia
Management, Business, Science and Arts Occupations
The most common Management, Business, Science and Arts occupations in Rodriguez Hevia are Health Diagnosing & Treating (54 | 16.7%), Health Technologists (54 | 16.7%), and Management (28 | 8.7%).
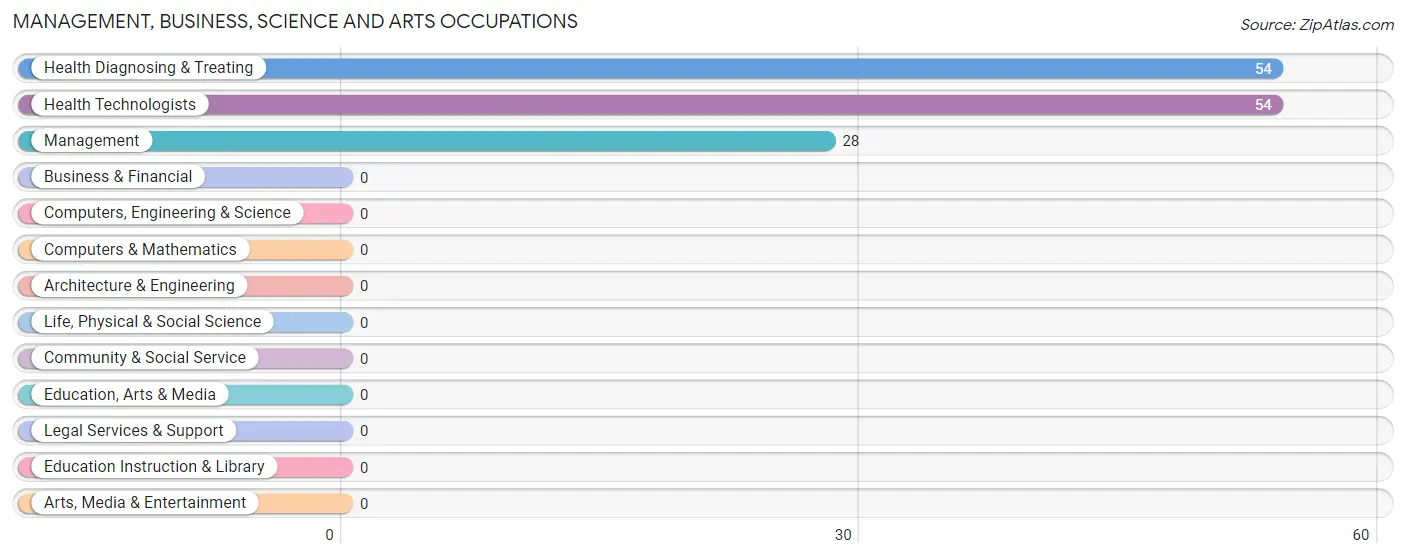
Management, Business, Science and Arts Occupations by Sex
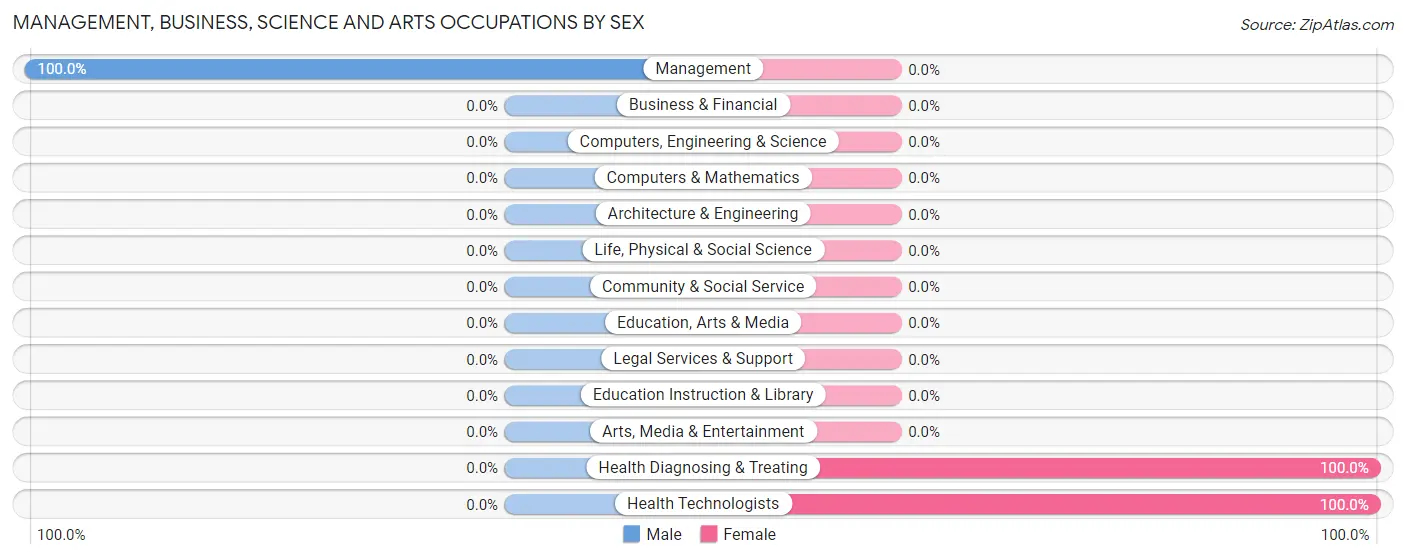
| Occupation | Male | Female |
| Management | 28 (100.0%) | 0 (0.0%) |
| Business & Financial | 0 (0.0%) | 0 (0.0%) |
| Computers, Engineering & Science | 0 (0.0%) | 0 (0.0%) |
| Computers & Mathematics | 0 (0.0%) | 0 (0.0%) |
| Architecture & Engineering | 0 (0.0%) | 0 (0.0%) |
| Life, Physical & Social Science | 0 (0.0%) | 0 (0.0%) |
| Community & Social Service | 0 (0.0%) | 0 (0.0%) |
| Education, Arts & Media | 0 (0.0%) | 0 (0.0%) |
| Legal Services & Support | 0 (0.0%) | 0 (0.0%) |
| Education Instruction & Library | 0 (0.0%) | 0 (0.0%) |
| Arts, Media & Entertainment | 0 (0.0%) | 0 (0.0%) |
| Health Diagnosing & Treating | 0 (0.0%) | 54 (100.0%) |
| Health Technologists | 0 (0.0%) | 54 (100.0%) |
| Total (Category) | 28 (34.2%) | 54 (65.8%) |
| Total (Overall) | 136 (42.1%) | 187 (57.9%) |
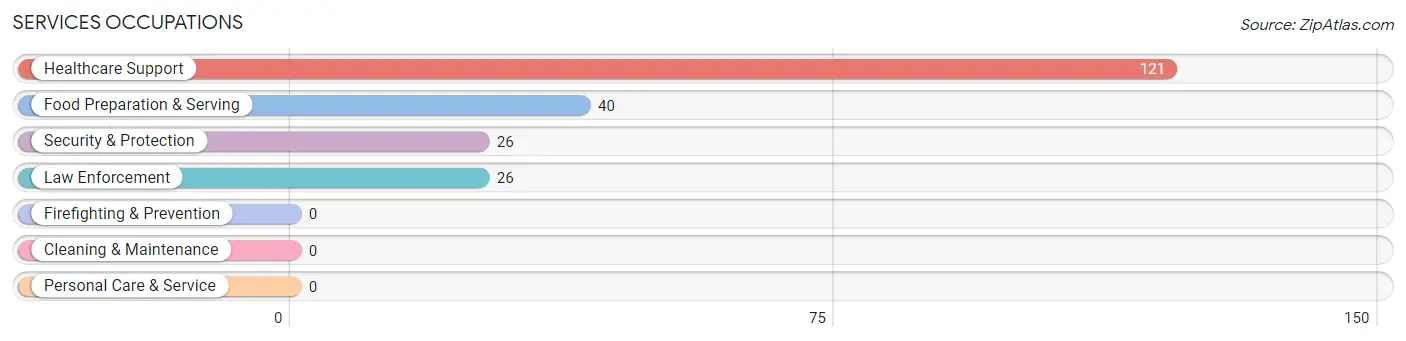
Services Occupations
The most common Services occupations in Rodriguez Hevia are Healthcare Support (121 | 37.5%), Food Preparation & Serving (40 | 12.4%), Security & Protection (26 | 8.1%), and Law Enforcement (26 | 8.1%).
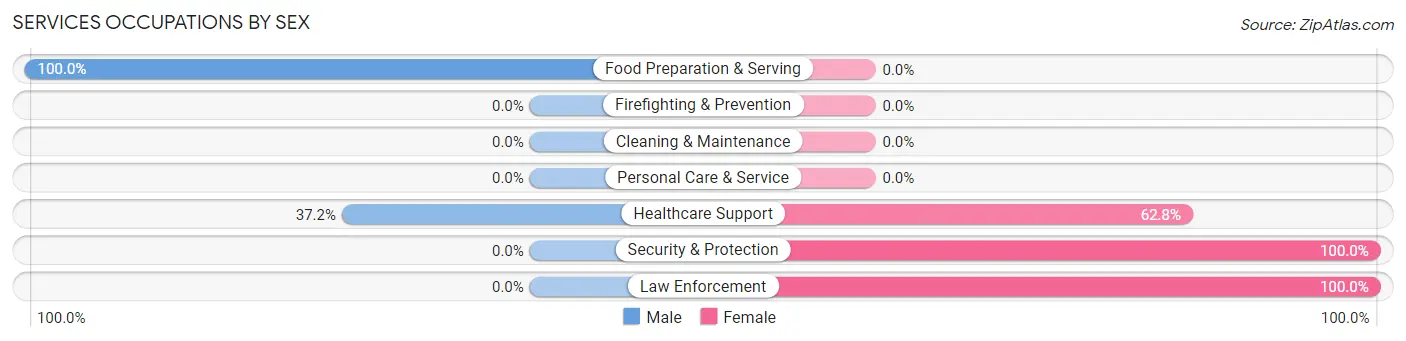
Services Occupations by Sex
Within the Services occupations in Rodriguez Hevia, the most male-oriented occupations are Food Preparation & Serving (100.0%), and Healthcare Support (37.2%), while the most female-oriented occupations are Security & Protection (100.0%), Law Enforcement (100.0%), and Healthcare Support (62.8%).
| Occupation | Male | Female |
| Healthcare Support | 45 (37.2%) | 76 (62.8%) |
| Security & Protection | 0 (0.0%) | 26 (100.0%) |
| Firefighting & Prevention | 0 (0.0%) | 0 (0.0%) |
| Law Enforcement | 0 (0.0%) | 26 (100.0%) |
| Food Preparation & Serving | 40 (100.0%) | 0 (0.0%) |
| Cleaning & Maintenance | 0 (0.0%) | 0 (0.0%) |
| Personal Care & Service | 0 (0.0%) | 0 (0.0%) |
| Total (Category) | 85 (45.5%) | 102 (54.5%) |
| Total (Overall) | 136 (42.1%) | 187 (57.9%) |
Sales and Office Occupations
The most common Sales and Office occupations in Rodriguez Hevia are , and Office & Administration (31 | 9.6%).

Sales and Office Occupations by Sex

| Occupation | Male | Female |
| Sales & Related | 0 (0.0%) | 0 (0.0%) |
| Office & Administration | 0 (0.0%) | 31 (100.0%) |
| Total (Category) | 0 (0.0%) | 31 (100.0%) |
| Total (Overall) | 136 (42.1%) | 187 (57.9%) |
Natural Resources, Construction and Maintenance Occupations

Natural Resources, Construction and Maintenance Occupations by Sex
| Occupation | Male | Female |
| Farming, Fishing & Forestry | 0 (0.0%) | 0 (0.0%) |
| Construction & Extraction | 0 (0.0%) | 0 (0.0%) |
| Installation, Maintenance & Repair | 0 (0.0%) | 0 (0.0%) |
| Total (Category) | 0 (0.0%) | 0 (0.0%) |
| Total (Overall) | 136 (42.1%) | 187 (57.9%) |
Production, Transportation and Moving Occupations
The most common Production, Transportation and Moving occupations in Rodriguez Hevia are , and Production (23 | 7.1%).
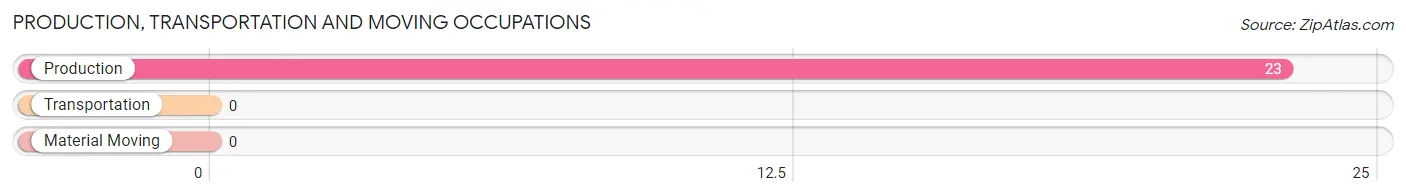
Production, Transportation and Moving Occupations by Sex
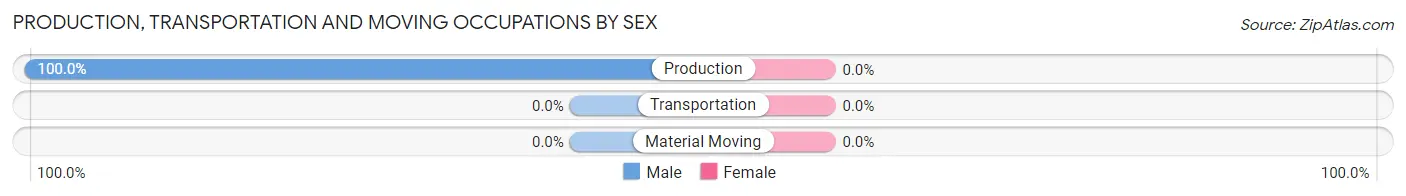
| Occupation | Male | Female |
| Production | 23 (100.0%) | 0 (0.0%) |
| Transportation | 0 (0.0%) | 0 (0.0%) |
| Material Moving | 0 (0.0%) | 0 (0.0%) |
| Total (Category) | 23 (100.0%) | 0 (0.0%) |
| Total (Overall) | 136 (42.1%) | 187 (57.9%) |
Employment Industries by Sex in Rodriguez Hevia
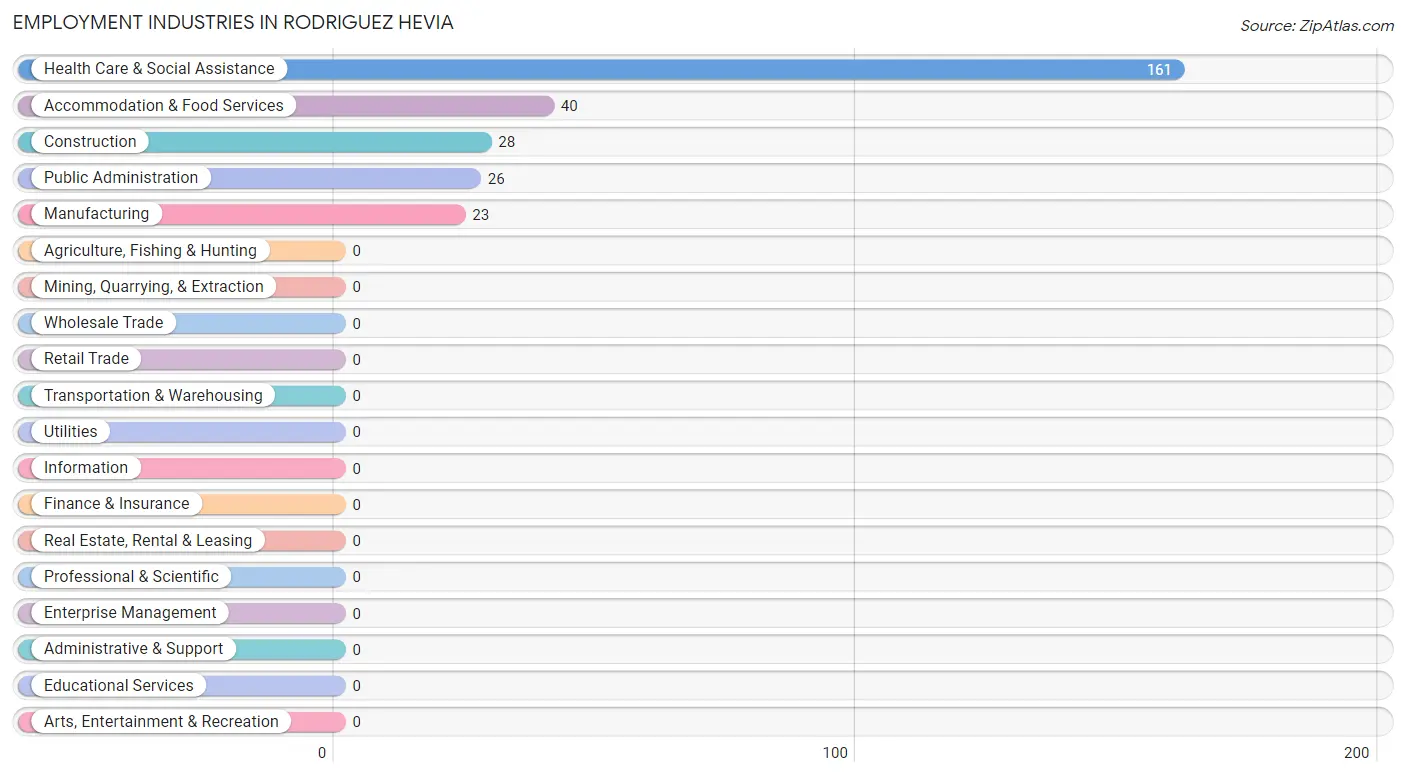
Employment Industries in Rodriguez Hevia
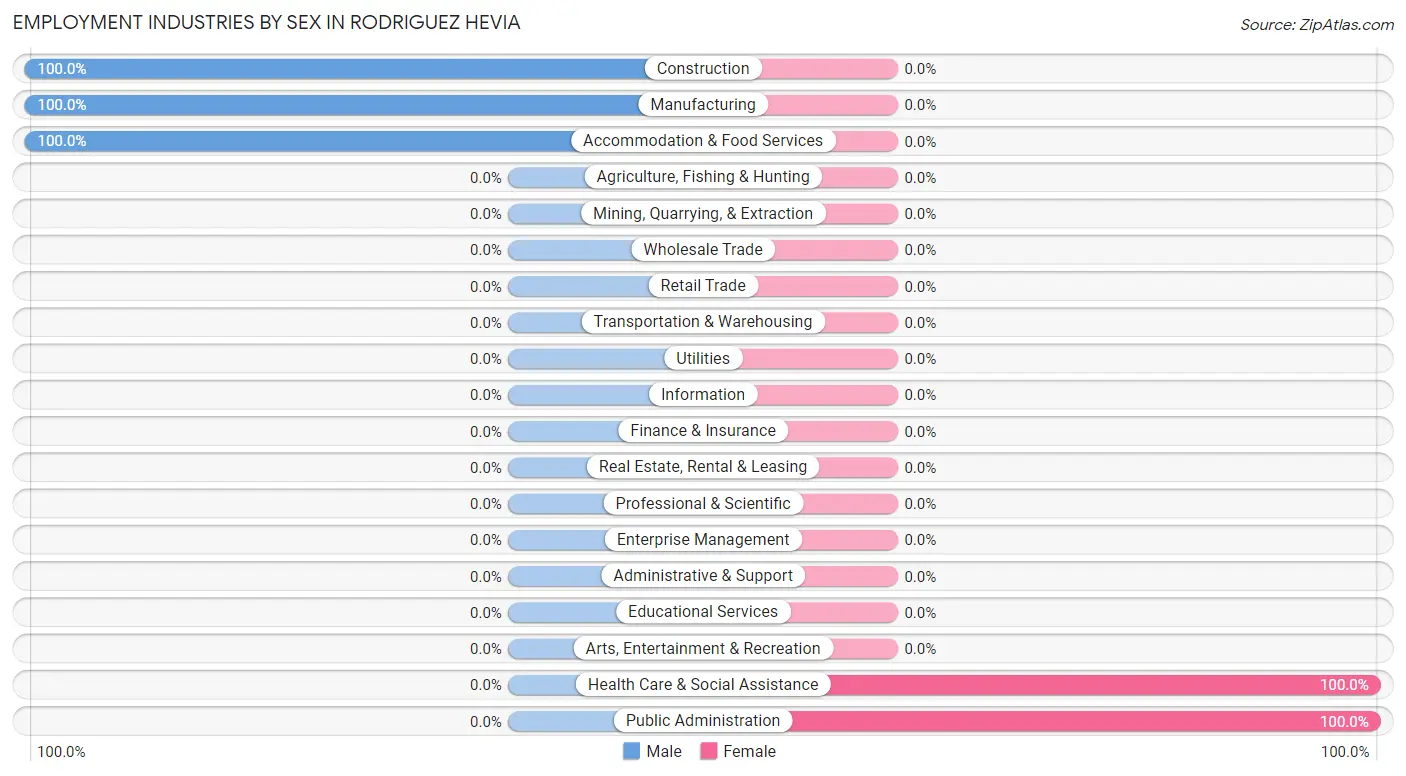
The major employment industries in Rodriguez Hevia include Health Care & Social Assistance (161 | 49.8%), Accommodation & Food Services (40 | 12.4%), Construction (28 | 8.7%), Public Administration (26 | 8.1%), and Manufacturing (23 | 7.1%).
Employment Industries by Sex in Rodriguez Hevia
The Rodriguez Hevia industries that see more men than women are Construction (100.0%), Manufacturing (100.0%), and Accommodation & Food Services (100.0%), whereas the industries that tend to have a higher number of women are Health Care & Social Assistance (100.0%), and Public Administration (100.0%).
| Industry | Male | Female |
| Agriculture, Fishing & Hunting | 0 (0.0%) | 0 (0.0%) |
| Mining, Quarrying, & Extraction | 0 (0.0%) | 0 (0.0%) |
| Construction | 28 (100.0%) | 0 (0.0%) |
| Manufacturing | 23 (100.0%) | 0 (0.0%) |
| Wholesale Trade | 0 (0.0%) | 0 (0.0%) |
| Retail Trade | 0 (0.0%) | 0 (0.0%) |
| Transportation & Warehousing | 0 (0.0%) | 0 (0.0%) |
| Utilities | 0 (0.0%) | 0 (0.0%) |
| Information | 0 (0.0%) | 0 (0.0%) |
| Finance & Insurance | 0 (0.0%) | 0 (0.0%) |
| Real Estate, Rental & Leasing | 0 (0.0%) | 0 (0.0%) |
| Professional & Scientific | 0 (0.0%) | 0 (0.0%) |
| Enterprise Management | 0 (0.0%) | 0 (0.0%) |
| Administrative & Support | 0 (0.0%) | 0 (0.0%) |
| Educational Services | 0 (0.0%) | 0 (0.0%) |
| Health Care & Social Assistance | 0 (0.0%) | 161 (100.0%) |
| Arts, Entertainment & Recreation | 0 (0.0%) | 0 (0.0%) |
| Accommodation & Food Services | 40 (100.0%) | 0 (0.0%) |
| Public Administration | 0 (0.0%) | 26 (100.0%) |
| Total | 136 (42.1%) | 187 (57.9%) |
Education in Rodriguez Hevia
School Enrollment in Rodriguez Hevia
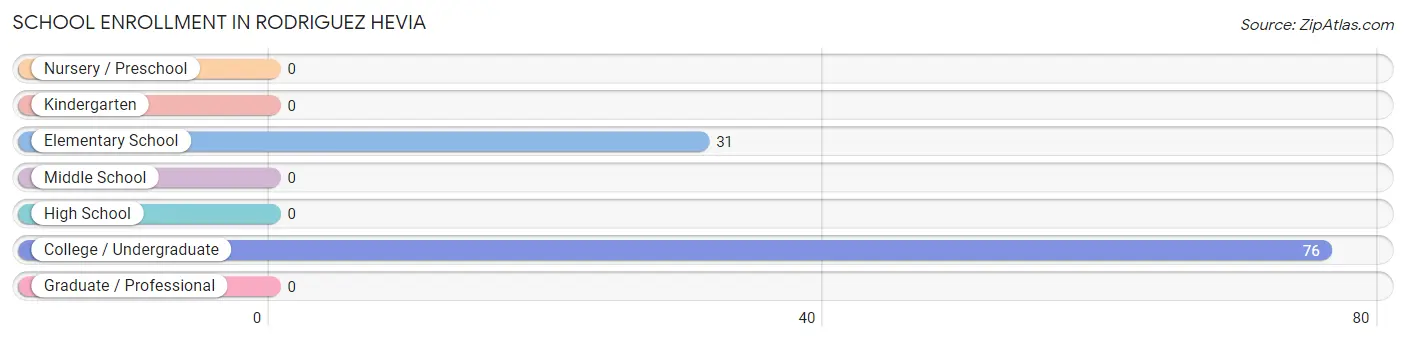
The most common levels of schooling among the 107 students in Rodriguez Hevia are college / undergraduate (76 | 71.0%), and elementary school (31 | 29.0%).
| School Level | # Students | % Students |
| Nursery / Preschool | 0 | 0.0% |
| Kindergarten | 0 | 0.0% |
| Elementary School | 31 | 29.0% |
| Middle School | 0 | 0.0% |
| High School | 0 | 0.0% |
| College / Undergraduate | 76 | 71.0% |
| Graduate / Professional | 0 | 0.0% |
| Total | 107 | 100.0% |
School Enrollment by Age by Funding Source in Rodriguez Hevia
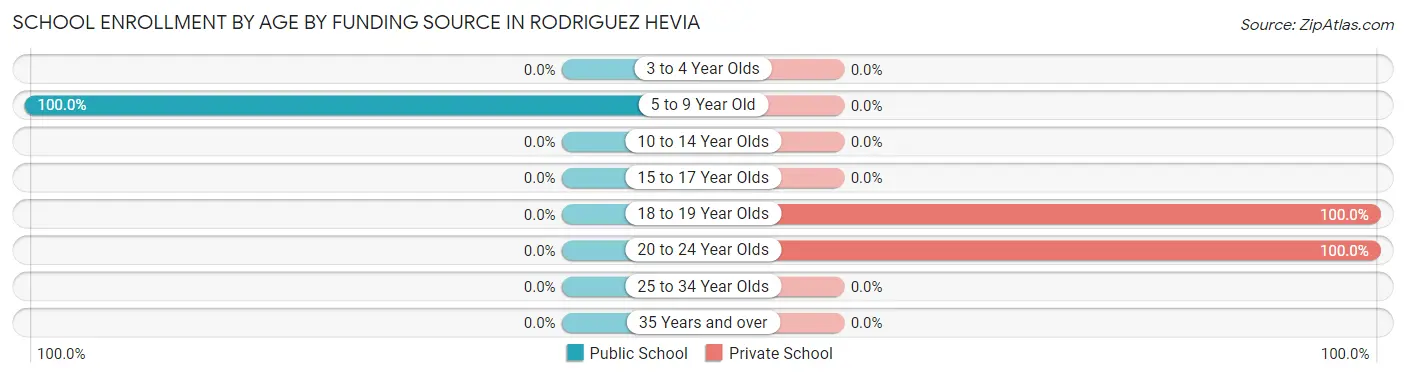
Out of a total of 107 students who are enrolled in schools in Rodriguez Hevia, 76 (71.0%) attend a private institution, while the remaining 31 (29.0%) are enrolled in public schools. The age group of 18 to 19 year olds has the highest likelihood of being enrolled in private schools, with 34 (100.0% in the age bracket) enrolled. Conversely, the age group of 5 to 9 year old has the lowest likelihood of being enrolled in a private school, with 31 (100.0% in the age bracket) attending a public institution.
| Age Bracket | Public School | Private School |
| 3 to 4 Year Olds | 0 (0.0%) | 0 (0.0%) |
| 5 to 9 Year Old | 31 (100.0%) | 0 (0.0%) |
| 10 to 14 Year Olds | 0 (0.0%) | 0 (0.0%) |
| 15 to 17 Year Olds | 0 (0.0%) | 0 (0.0%) |
| 18 to 19 Year Olds | 0 (0.0%) | 34 (100.0%) |
| 20 to 24 Year Olds | 0 (0.0%) | 42 (100.0%) |
| 25 to 34 Year Olds | 0 (0.0%) | 0 (0.0%) |
| 35 Years and over | 0 (0.0%) | 0 (0.0%) |
| Total | 31 (29.0%) | 76 (71.0%) |
Educational Attainment by Field of Study in Rodriguez Hevia
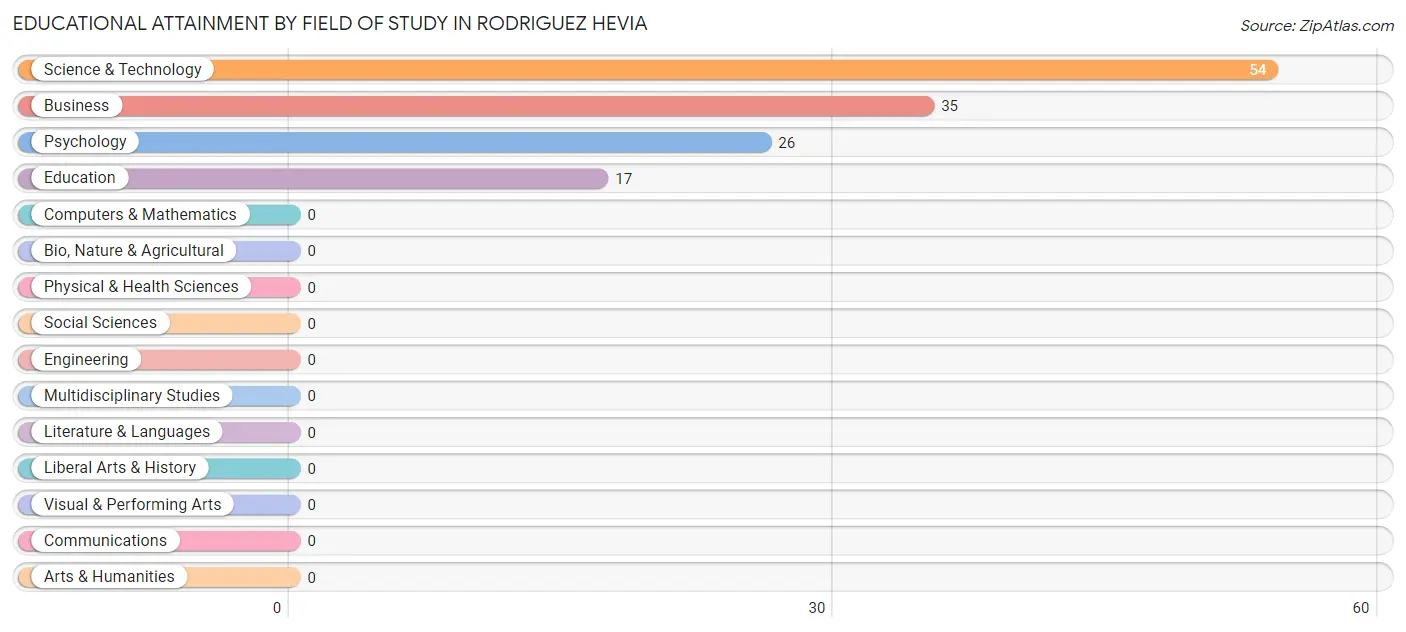
Science & technology (54 | 40.9%), business (35 | 26.5%), psychology (26 | 19.7%), and education (17 | 12.9%) are the most common fields of study among 132 individuals in Rodriguez Hevia who have obtained a bachelor's degree or higher.
| Field of Study | # Graduates | % Graduates |
| Computers & Mathematics | 0 | 0.0% |
| Bio, Nature & Agricultural | 0 | 0.0% |
| Physical & Health Sciences | 0 | 0.0% |
| Psychology | 26 | 19.7% |
| Social Sciences | 0 | 0.0% |
| Engineering | 0 | 0.0% |
| Multidisciplinary Studies | 0 | 0.0% |
| Science & Technology | 54 | 40.9% |
| Business | 35 | 26.5% |
| Education | 17 | 12.9% |
| Literature & Languages | 0 | 0.0% |
| Liberal Arts & History | 0 | 0.0% |
| Visual & Performing Arts | 0 | 0.0% |
| Communications | 0 | 0.0% |
| Arts & Humanities | 0 | 0.0% |
| Total | 132 | 100.0% |
Transportation & Commute in Rodriguez Hevia
Vehicle Availability by Sex in Rodriguez Hevia
The most prevalent vehicle ownership categories in Rodriguez Hevia are males with 4 vehicles (96, accounting for 70.6%) and females with 4 vehicles (130, making up 51.3%).
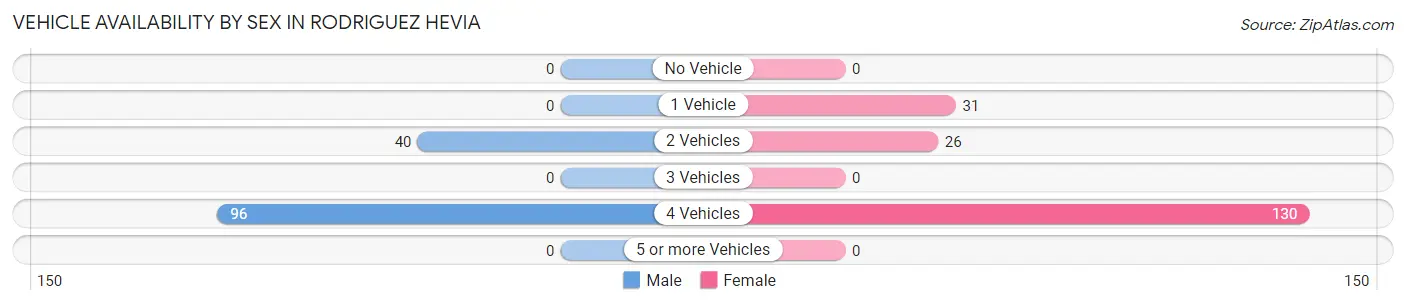
| Vehicles Available | Male | Female |
| No Vehicle | 0 (0.0%) | 0 (0.0%) |
| 1 Vehicle | 0 (0.0%) | 31 (16.6%) |
| 2 Vehicles | 40 (29.4%) | 26 (13.9%) |
| 3 Vehicles | 0 (0.0%) | 0 (0.0%) |
| 4 Vehicles | 96 (70.6%) | 130 (69.5%) |
| 5 or more Vehicles | 0 (0.0%) | 0 (0.0%) |
| Total | 136 (100.0%) | 187 (100.0%) |
Commute Time in Rodriguez Hevia
The most frequently occuring commute durations in Rodriguez Hevia are 35 to 39 minutes (141 commuters, 43.6%), 60 to 89 minutes (54 commuters, 16.7%), and 45 to 59 minutes (40 commuters, 12.4%).
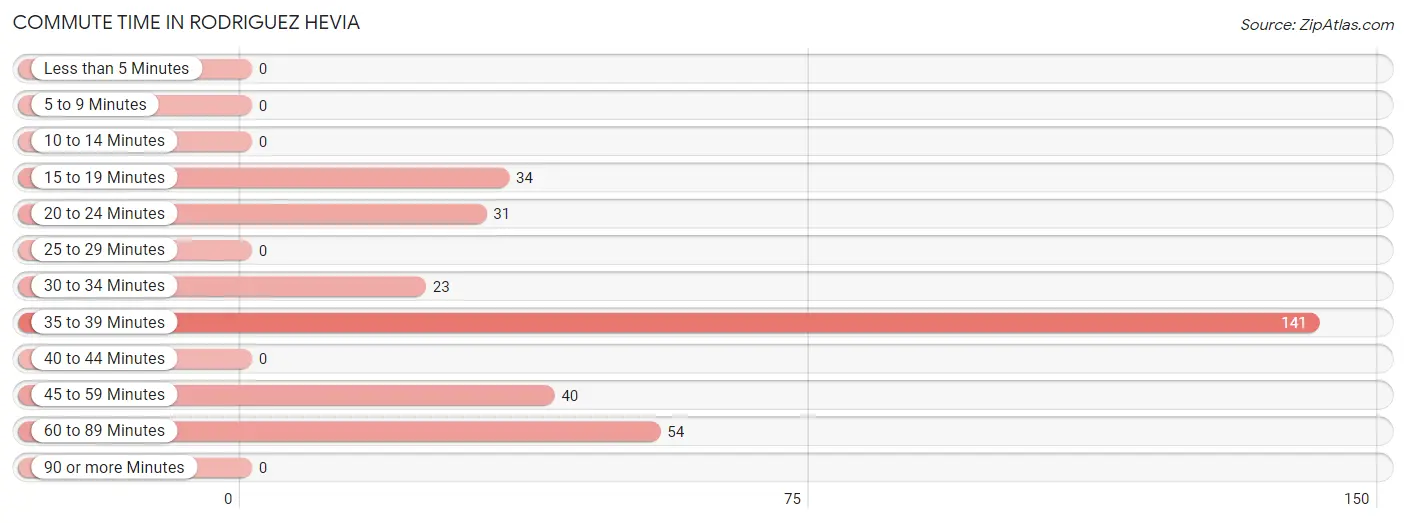
| Commute Time | # Commuters | % Commuters |
| Less than 5 Minutes | 0 | 0.0% |
| 5 to 9 Minutes | 0 | 0.0% |
| 10 to 14 Minutes | 0 | 0.0% |
| 15 to 19 Minutes | 34 | 10.5% |
| 20 to 24 Minutes | 31 | 9.6% |
| 25 to 29 Minutes | 0 | 0.0% |
| 30 to 34 Minutes | 23 | 7.1% |
| 35 to 39 Minutes | 141 | 43.6% |
| 40 to 44 Minutes | 0 | 0.0% |
| 45 to 59 Minutes | 40 | 12.4% |
| 60 to 89 Minutes | 54 | 16.7% |
| 90 or more Minutes | 0 | 0.0% |
Commute Time by Sex in Rodriguez Hevia
The most common commute times in Rodriguez Hevia are 35 to 39 minutes (45 commuters, 33.1%) for males and 35 to 39 minutes (96 commuters, 51.3%) for females.
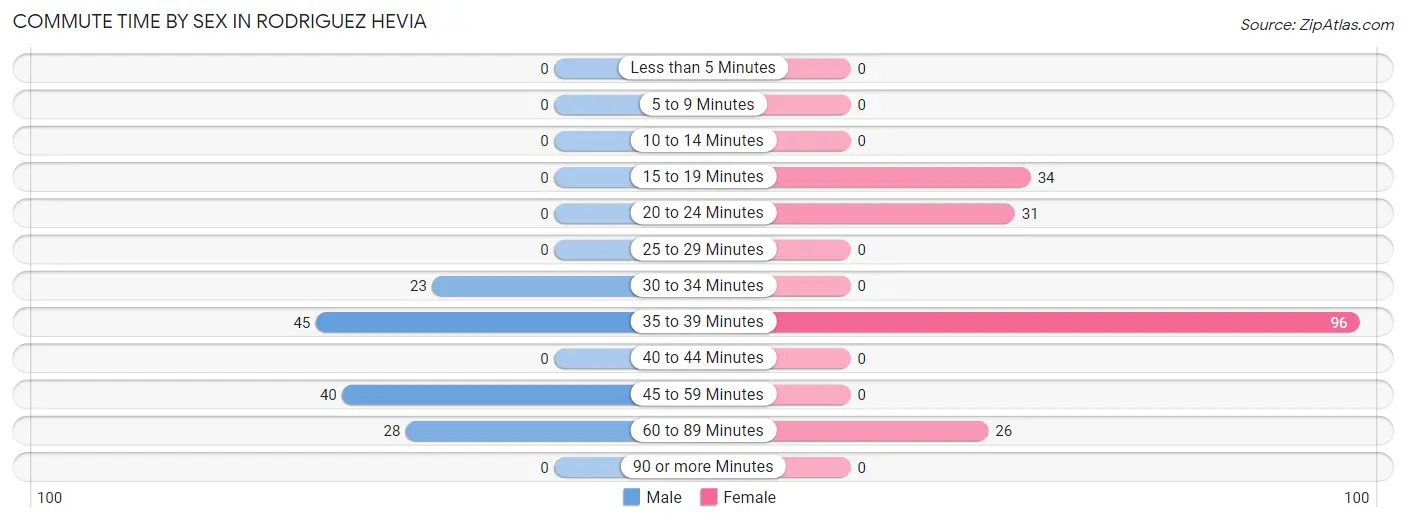
| Commute Time | Male | Female |
| Less than 5 Minutes | 0 (0.0%) | 0 (0.0%) |
| 5 to 9 Minutes | 0 (0.0%) | 0 (0.0%) |
| 10 to 14 Minutes | 0 (0.0%) | 0 (0.0%) |
| 15 to 19 Minutes | 0 (0.0%) | 34 (18.2%) |
| 20 to 24 Minutes | 0 (0.0%) | 31 (16.6%) |
| 25 to 29 Minutes | 0 (0.0%) | 0 (0.0%) |
| 30 to 34 Minutes | 23 (16.9%) | 0 (0.0%) |
| 35 to 39 Minutes | 45 (33.1%) | 96 (51.3%) |
| 40 to 44 Minutes | 0 (0.0%) | 0 (0.0%) |
| 45 to 59 Minutes | 40 (29.4%) | 0 (0.0%) |
| 60 to 89 Minutes | 28 (20.6%) | 26 (13.9%) |
| 90 or more Minutes | 0 (0.0%) | 0 (0.0%) |
Time of Departure to Work by Sex in Rodriguez Hevia
The most frequent times of departure to work in Rodriguez Hevia are 12:00 AM to 4:59 AM (45, 33.1%) for males and 11:00 AM to 11:59 AM (65, 34.8%) for females.
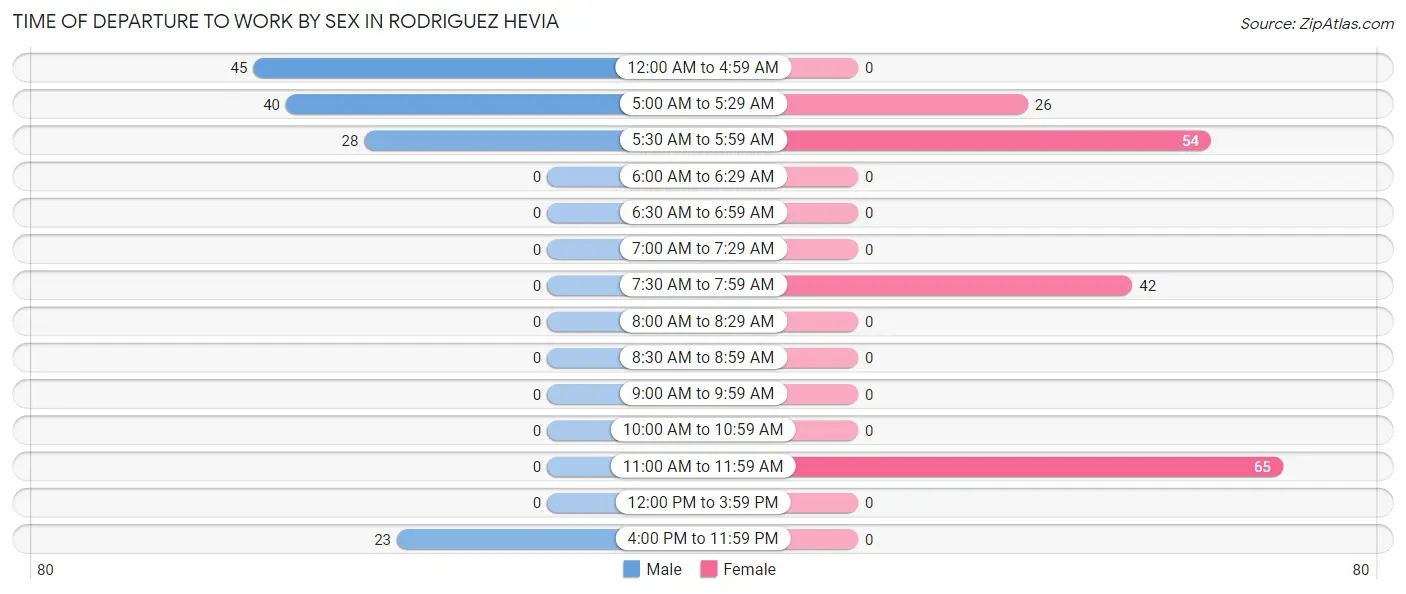
| Time of Departure | Male | Female |
| 12:00 AM to 4:59 AM | 45 (33.1%) | 0 (0.0%) |
| 5:00 AM to 5:29 AM | 40 (29.4%) | 26 (13.9%) |
| 5:30 AM to 5:59 AM | 28 (20.6%) | 54 (28.9%) |
| 6:00 AM to 6:29 AM | 0 (0.0%) | 0 (0.0%) |
| 6:30 AM to 6:59 AM | 0 (0.0%) | 0 (0.0%) |
| 7:00 AM to 7:29 AM | 0 (0.0%) | 0 (0.0%) |
| 7:30 AM to 7:59 AM | 0 (0.0%) | 42 (22.5%) |
| 8:00 AM to 8:29 AM | 0 (0.0%) | 0 (0.0%) |
| 8:30 AM to 8:59 AM | 0 (0.0%) | 0 (0.0%) |
| 9:00 AM to 9:59 AM | 0 (0.0%) | 0 (0.0%) |
| 10:00 AM to 10:59 AM | 0 (0.0%) | 0 (0.0%) |
| 11:00 AM to 11:59 AM | 0 (0.0%) | 65 (34.8%) |
| 12:00 PM to 3:59 PM | 0 (0.0%) | 0 (0.0%) |
| 4:00 PM to 11:59 PM | 23 (16.9%) | 0 (0.0%) |
| Total | 136 (100.0%) | 187 (100.0%) |
Housing Occupancy in Rodriguez Hevia
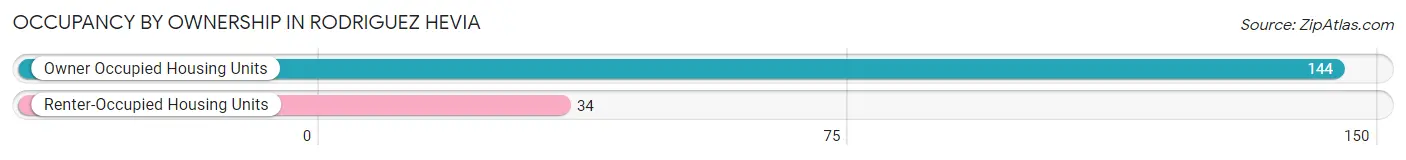
Occupancy by Ownership in Rodriguez Hevia
Of the total 178 dwellings in Rodriguez Hevia, owner-occupied units account for 144 (80.9%), while renter-occupied units make up 34 (19.1%).
| Occupancy | # Housing Units | % Housing Units |
| Owner Occupied Housing Units | 144 | 80.9% |
| Renter-Occupied Housing Units | 34 | 19.1% |
| Total Occupied Housing Units | 178 | 100.0% |
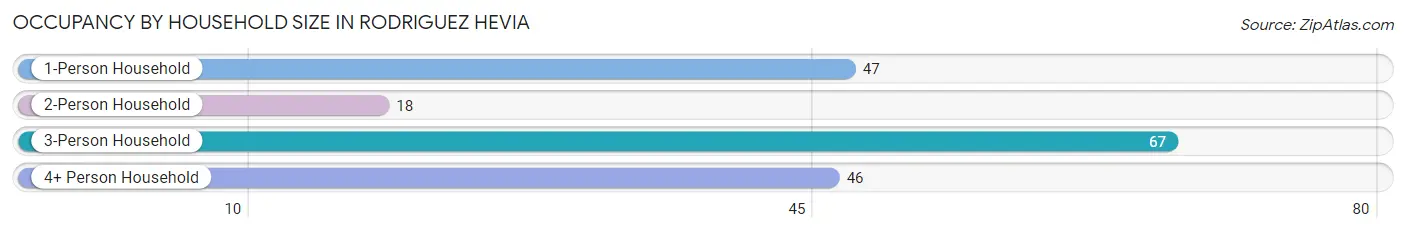
Occupancy by Household Size in Rodriguez Hevia
| Household Size | # Housing Units | % Housing Units |
| 1-Person Household | 47 | 26.4% |
| 2-Person Household | 18 | 10.1% |
| 3-Person Household | 67 | 37.6% |
| 4+ Person Household | 46 | 25.8% |
| Total Housing Units | 178 | 100.0% |
Occupancy by Ownership by Household Size in Rodriguez Hevia
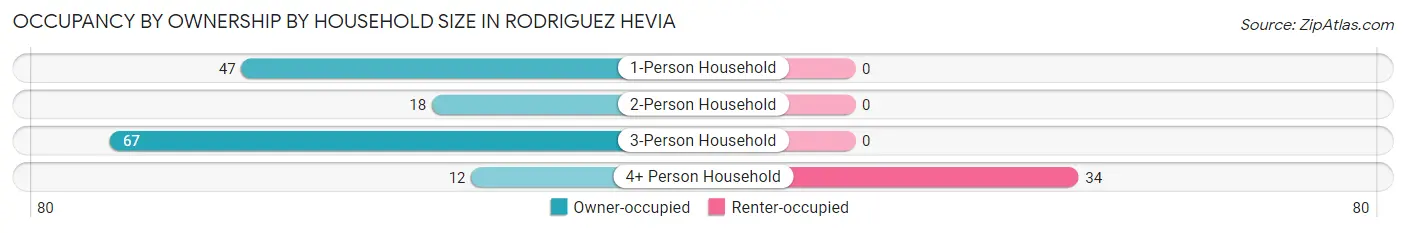
| Household Size | Owner-occupied | Renter-occupied |
| 1-Person Household | 47 (100.0%) | 0 (0.0%) |
| 2-Person Household | 18 (100.0%) | 0 (0.0%) |
| 3-Person Household | 67 (100.0%) | 0 (0.0%) |
| 4+ Person Household | 12 (26.1%) | 34 (73.9%) |
| Total Housing Units | 144 (80.9%) | 34 (19.1%) |
Occupancy by Educational Attainment in Rodriguez Hevia
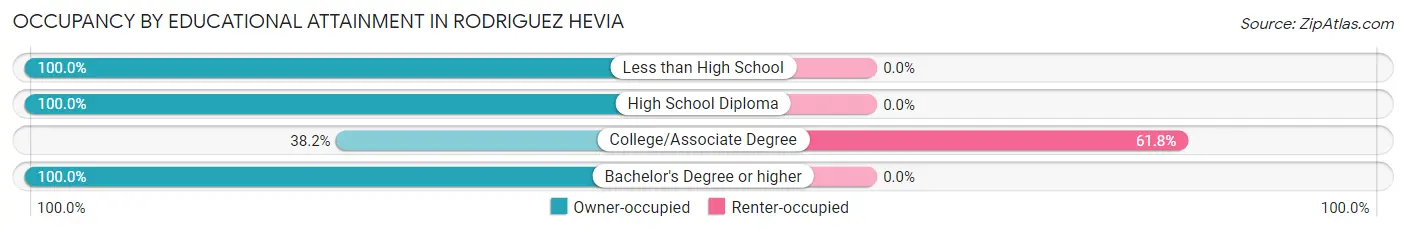
| Household Size | Owner-occupied | Renter-occupied |
| Less than High School | 39 (100.0%) | 0 (0.0%) |
| High School Diploma | 23 (100.0%) | 0 (0.0%) |
| College/Associate Degree | 21 (38.2%) | 34 (61.8%) |
| Bachelor's Degree or higher | 61 (100.0%) | 0 (0.0%) |
Occupancy by Age of Householder in Rodriguez Hevia
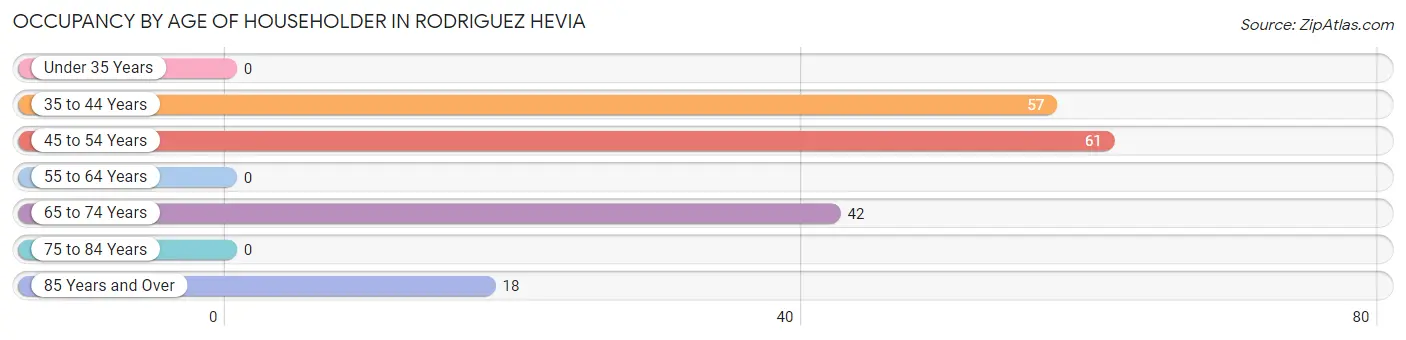
| Age Bracket | # Households | % Households |
| Under 35 Years | 0 | 0.0% |
| 35 to 44 Years | 57 | 32.0% |
| 45 to 54 Years | 61 | 34.3% |
| 55 to 64 Years | 0 | 0.0% |
| 65 to 74 Years | 42 | 23.6% |
| 75 to 84 Years | 0 | 0.0% |
| 85 Years and Over | 18 | 10.1% |
| Total | 178 | 100.0% |
Housing Finances in Rodriguez Hevia
Median Income by Occupancy in Rodriguez Hevia
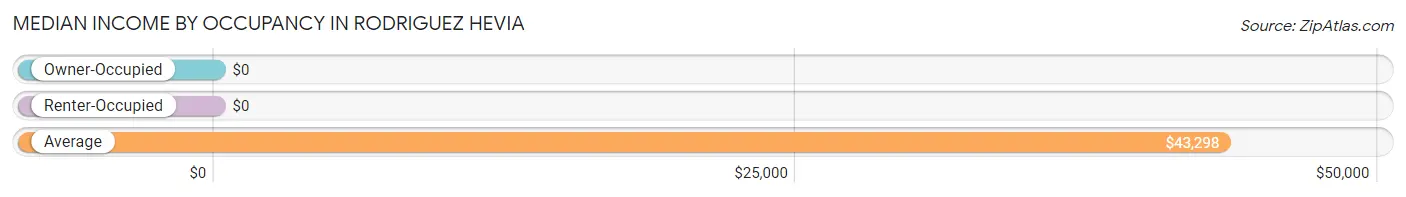
| Occupancy Type | # Households | Median Income |
| Owner-Occupied | 144 (80.9%) | $0 |
| Renter-Occupied | 34 (19.1%) | $0 |
| Average | 178 (100.0%) | $43,298 |
Occupancy by Householder Income Bracket in Rodriguez Hevia
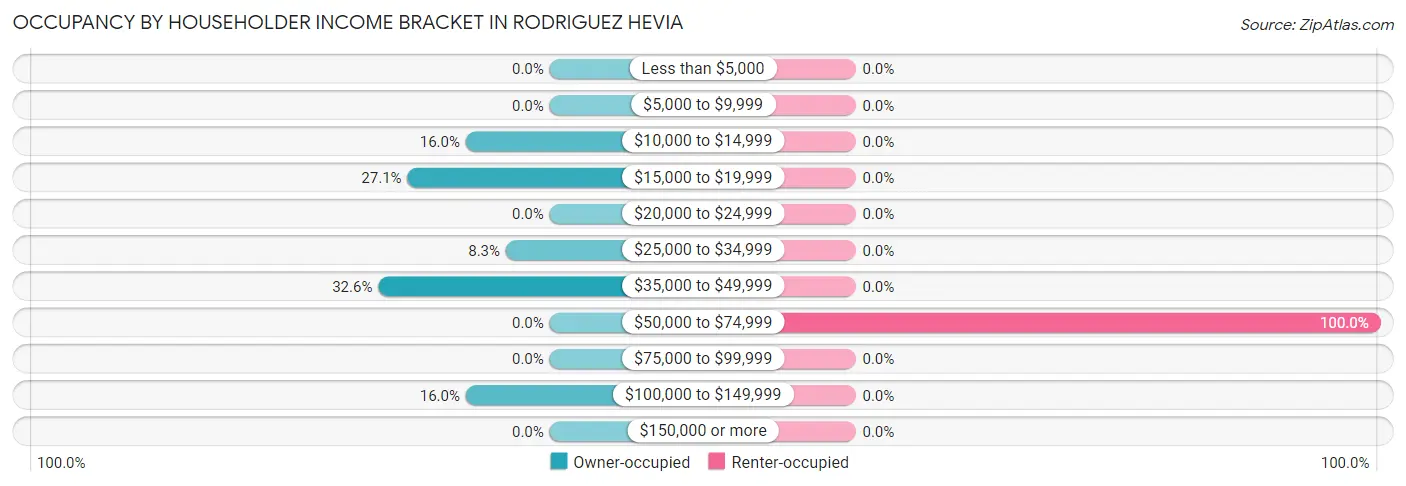
| Income Bracket | Owner-occupied | Renter-occupied |
| Less than $5,000 | 0 (0.0%) | 0 (0.0%) |
| $5,000 to $9,999 | 0 (0.0%) | 0 (0.0%) |
| $10,000 to $14,999 | 23 (16.0%) | 0 (0.0%) |
| $15,000 to $19,999 | 39 (27.1%) | 0 (0.0%) |
| $20,000 to $24,999 | 0 (0.0%) | 0 (0.0%) |
| $25,000 to $34,999 | 12 (8.3%) | 0 (0.0%) |
| $35,000 to $49,999 | 47 (32.6%) | 0 (0.0%) |
| $50,000 to $74,999 | 0 (0.0%) | 34 (100.0%) |
| $75,000 to $99,999 | 0 (0.0%) | 0 (0.0%) |
| $100,000 to $149,999 | 23 (16.0%) | 0 (0.0%) |
| $150,000 or more | 0 (0.0%) | 0 (0.0%) |
| Total | 144 (100.0%) | 34 (100.0%) |
Monthly Housing Cost Tiers in Rodriguez Hevia
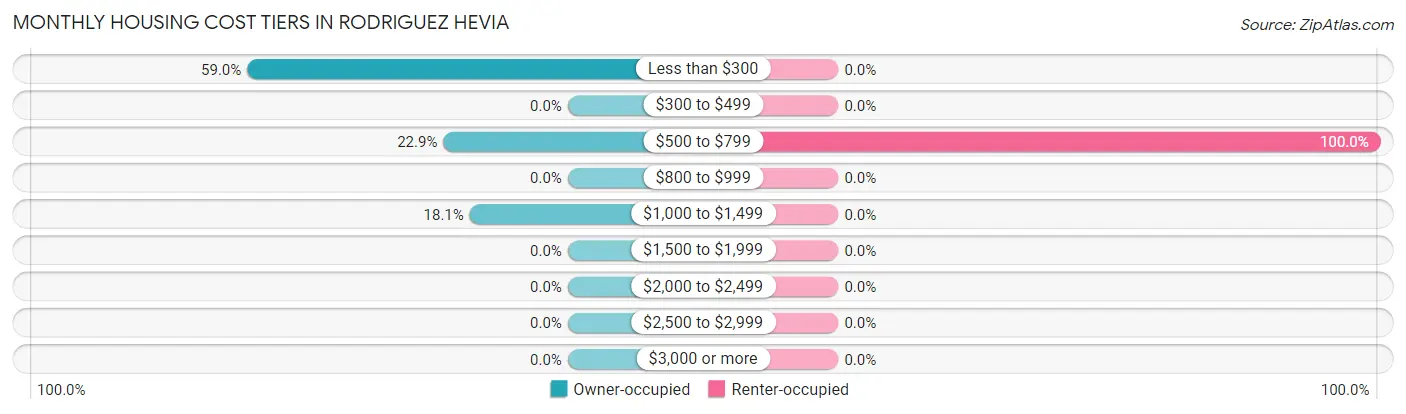
| Monthly Cost | Owner-occupied | Renter-occupied |
| Less than $300 | 85 (59.0%) | 0 (0.0%) |
| $300 to $499 | 0 (0.0%) | 0 (0.0%) |
| $500 to $799 | 33 (22.9%) | 34 (100.0%) |
| $800 to $999 | 0 (0.0%) | 0 (0.0%) |
| $1,000 to $1,499 | 26 (18.1%) | 0 (0.0%) |
| $1,500 to $1,999 | 0 (0.0%) | 0 (0.0%) |
| $2,000 to $2,499 | 0 (0.0%) | 0 (0.0%) |
| $2,500 to $2,999 | 0 (0.0%) | 0 (0.0%) |
| $3,000 or more | 0 (0.0%) | 0 (0.0%) |
| Total | 144 (100.0%) | 34 (100.0%) |
Physical Housing Characteristics in Rodriguez Hevia
Housing Structures in Rodriguez Hevia
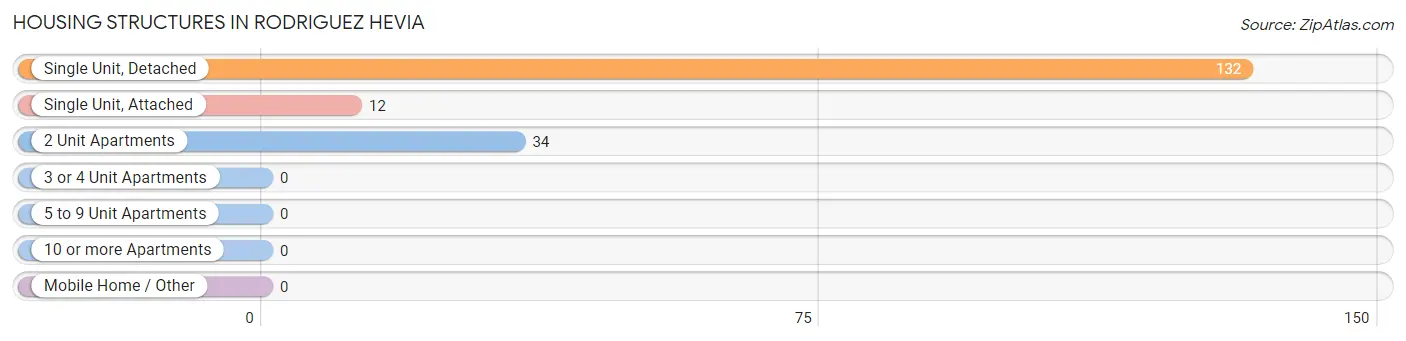
| Structure Type | # Housing Units | % Housing Units |
| Single Unit, Detached | 132 | 74.2% |
| Single Unit, Attached | 12 | 6.7% |
| 2 Unit Apartments | 34 | 19.1% |
| 3 or 4 Unit Apartments | 0 | 0.0% |
| 5 to 9 Unit Apartments | 0 | 0.0% |
| 10 or more Apartments | 0 | 0.0% |
| Mobile Home / Other | 0 | 0.0% |
| Total | 178 | 100.0% |
Housing Structures by Occupancy in Rodriguez Hevia
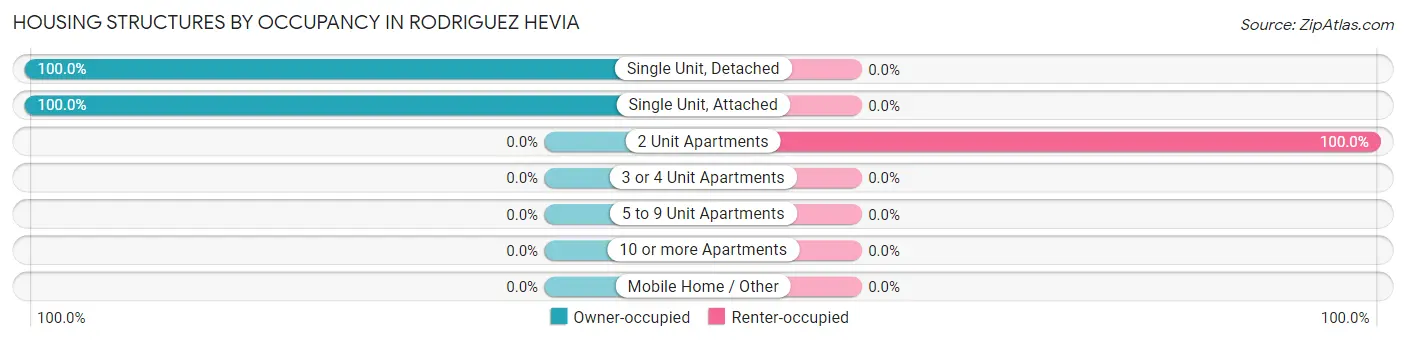
| Structure Type | Owner-occupied | Renter-occupied |
| Single Unit, Detached | 132 (100.0%) | 0 (0.0%) |
| Single Unit, Attached | 12 (100.0%) | 0 (0.0%) |
| 2 Unit Apartments | 0 (0.0%) | 34 (100.0%) |
| 3 or 4 Unit Apartments | 0 (0.0%) | 0 (0.0%) |
| 5 to 9 Unit Apartments | 0 (0.0%) | 0 (0.0%) |
| 10 or more Apartments | 0 (0.0%) | 0 (0.0%) |
| Mobile Home / Other | 0 (0.0%) | 0 (0.0%) |
| Total | 144 (80.9%) | 34 (19.1%) |
Housing Structures by Number of Rooms in Rodriguez Hevia
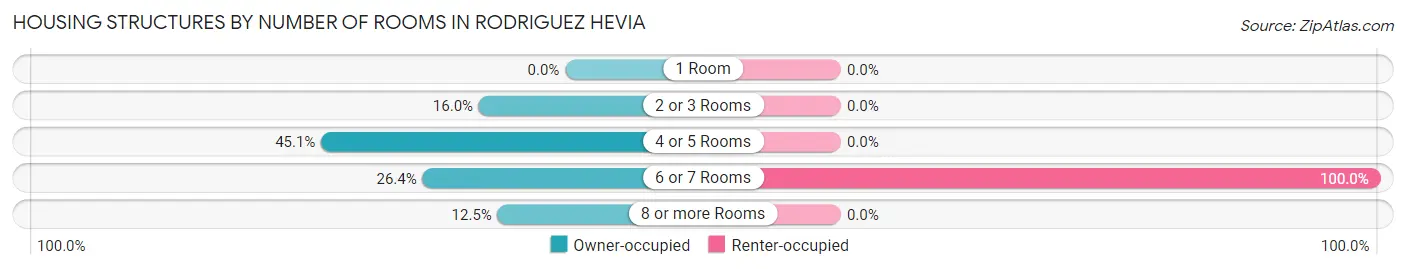
| Number of Rooms | Owner-occupied | Renter-occupied |
| 1 Room | 0 (0.0%) | 0 (0.0%) |
| 2 or 3 Rooms | 23 (16.0%) | 0 (0.0%) |
| 4 or 5 Rooms | 65 (45.1%) | 0 (0.0%) |
| 6 or 7 Rooms | 38 (26.4%) | 34 (100.0%) |
| 8 or more Rooms | 18 (12.5%) | 0 (0.0%) |
| Total | 144 (100.0%) | 34 (100.0%) |
Housing Structure by Heating Type in Rodriguez Hevia
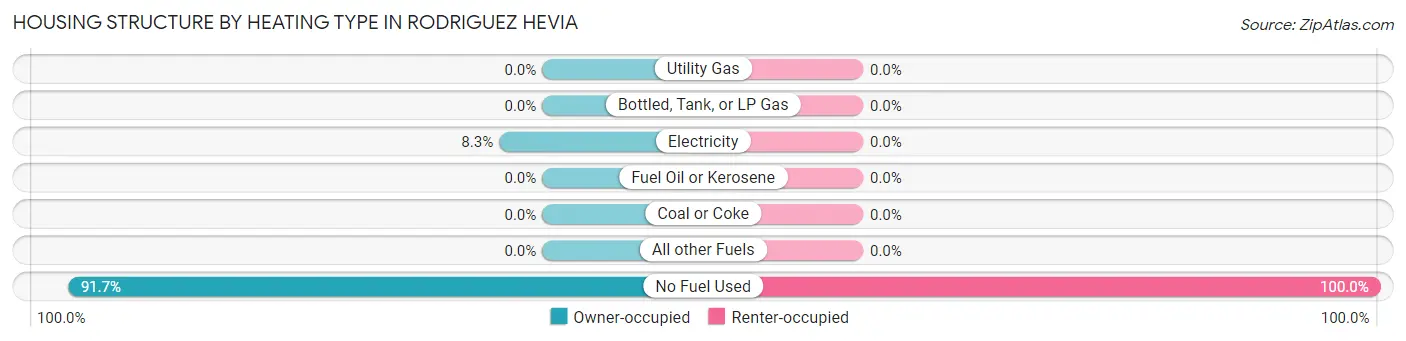
| Heating Type | Owner-occupied | Renter-occupied |
| Utility Gas | 0 (0.0%) | 0 (0.0%) |
| Bottled, Tank, or LP Gas | 0 (0.0%) | 0 (0.0%) |
| Electricity | 12 (8.3%) | 0 (0.0%) |
| Fuel Oil or Kerosene | 0 (0.0%) | 0 (0.0%) |
| Coal or Coke | 0 (0.0%) | 0 (0.0%) |
| All other Fuels | 0 (0.0%) | 0 (0.0%) |
| No Fuel Used | 132 (91.7%) | 34 (100.0%) |
| Total | 144 (100.0%) | 34 (100.0%) |
Household Vehicle Usage in Rodriguez Hevia
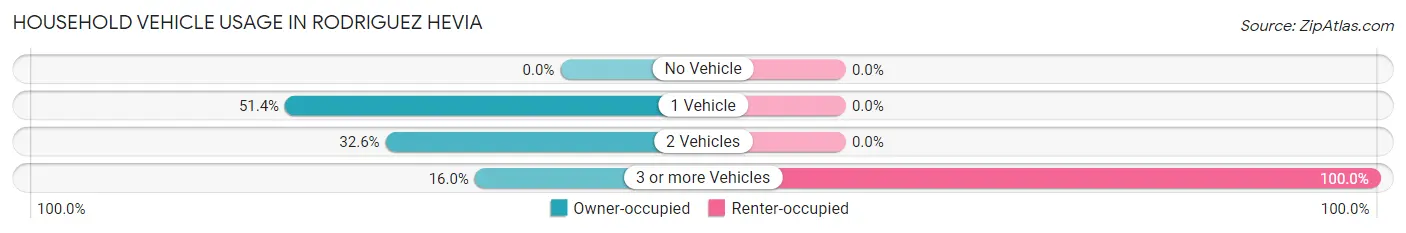
| Vehicles per Household | Owner-occupied | Renter-occupied |
| No Vehicle | 0 (0.0%) | 0 (0.0%) |
| 1 Vehicle | 74 (51.4%) | 0 (0.0%) |
| 2 Vehicles | 47 (32.6%) | 0 (0.0%) |
| 3 or more Vehicles | 23 (16.0%) | 34 (100.0%) |
| Total | 144 (100.0%) | 34 (100.0%) |
Real Estate & Mortgages in Rodriguez Hevia
Real Estate and Mortgage Overview in Rodriguez Hevia
| Characteristic | Without Mortgage | With Mortgage |
| Housing Units | 97 | 47 |
| Median Property Value | $106,100 | $0 |
| Median Household Income | - | - |
| Monthly Housing Costs | $183 | $0 |
| Real Estate Taxes | - | - |
Property Value by Mortgage Status in Rodriguez Hevia
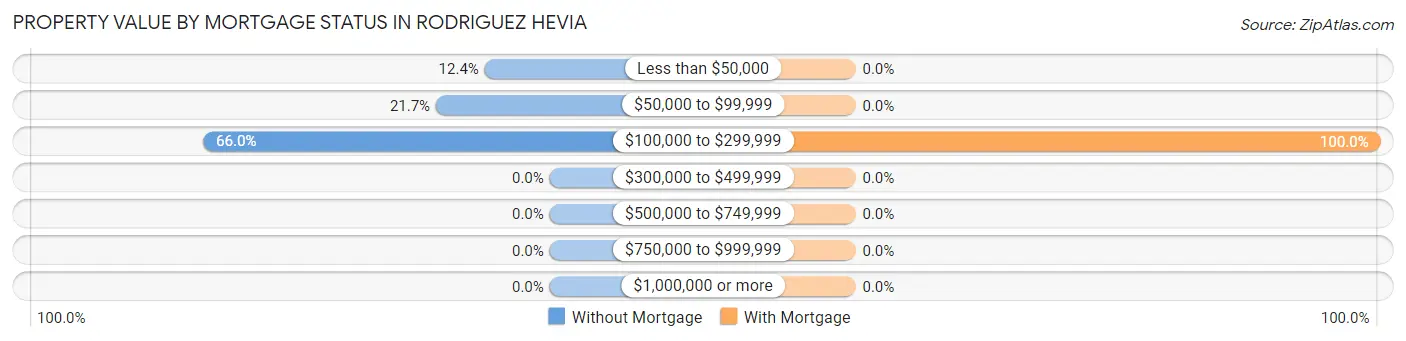
| Property Value | Without Mortgage | With Mortgage |
| Less than $50,000 | 12 (12.4%) | 0 (0.0%) |
| $50,000 to $99,999 | 21 (21.6%) | 0 (0.0%) |
| $100,000 to $299,999 | 64 (66.0%) | 47 (100.0%) |
| $300,000 to $499,999 | 0 (0.0%) | 0 (0.0%) |
| $500,000 to $749,999 | 0 (0.0%) | 0 (0.0%) |
| $750,000 to $999,999 | 0 (0.0%) | 0 (0.0%) |
| $1,000,000 or more | 0 (0.0%) | 0 (0.0%) |
| Total | 97 (100.0%) | 47 (100.0%) |
Household Income by Mortgage Status in Rodriguez Hevia
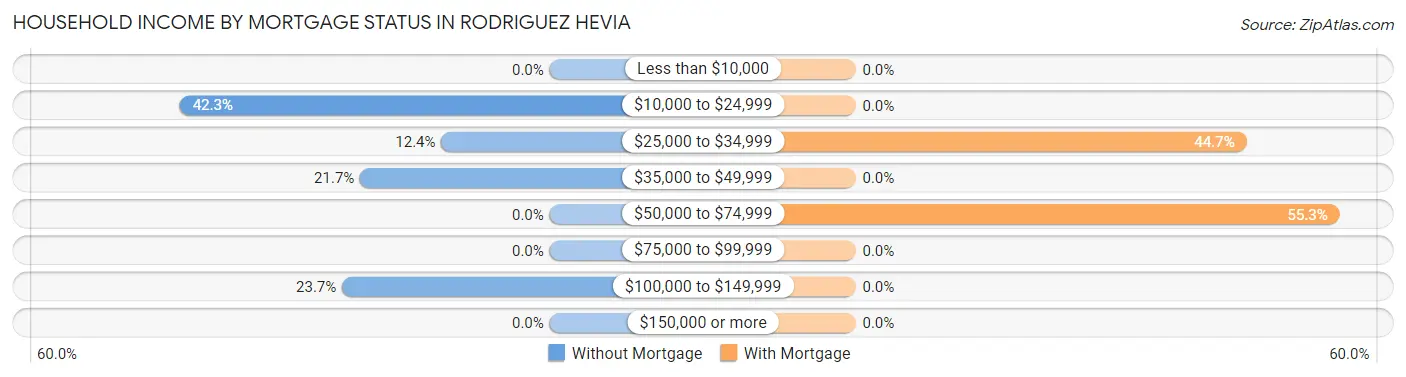
| Household Income | Without Mortgage | With Mortgage |
| Less than $10,000 | 0 (0.0%) | 0 (0.0%) |
| $10,000 to $24,999 | 41 (42.3%) | 0 (0.0%) |
| $25,000 to $34,999 | 12 (12.4%) | 21 (44.7%) |
| $35,000 to $49,999 | 21 (21.6%) | 0 (0.0%) |
| $50,000 to $74,999 | 0 (0.0%) | 26 (55.3%) |
| $75,000 to $99,999 | 0 (0.0%) | 0 (0.0%) |
| $100,000 to $149,999 | 23 (23.7%) | 0 (0.0%) |
| $150,000 or more | 0 (0.0%) | 0 (0.0%) |
| Total | 97 (100.0%) | 47 (100.0%) |
Property Value to Household Income Ratio in Rodriguez Hevia
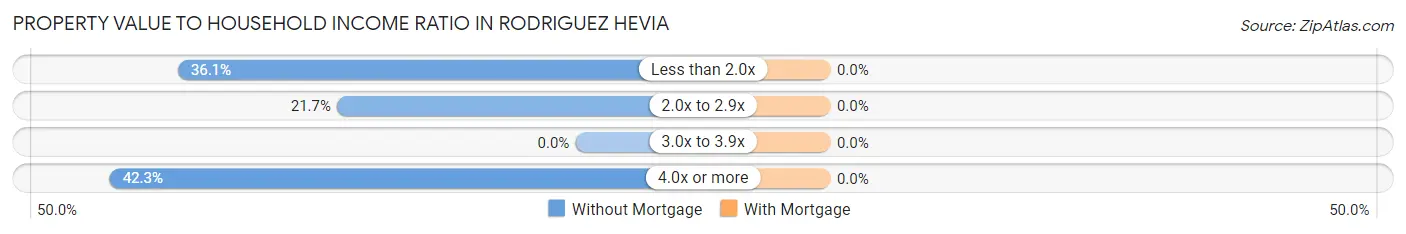
| Value-to-Income Ratio | Without Mortgage | With Mortgage |
| Less than 2.0x | 35 (36.1%) | 0 (0.0%) |
| 2.0x to 2.9x | 21 (21.6%) | 0 (0.0%) |
| 3.0x to 3.9x | 0 (0.0%) | 0 (0.0%) |
| 4.0x or more | 41 (42.3%) | 0 (0.0%) |
| Total | 97 (100.0%) | 47 (100.0%) |
Real Estate Taxes by Mortgage Status in Rodriguez Hevia
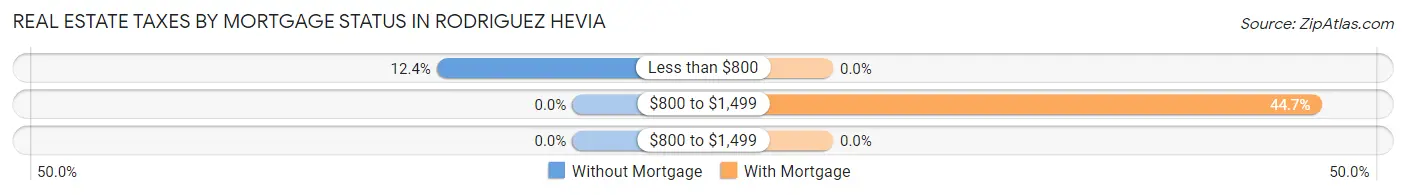
| Property Taxes | Without Mortgage | With Mortgage |
| Less than $800 | 12 (12.4%) | 0 (0.0%) |
| $800 to $1,499 | 0 (0.0%) | 21 (44.7%) |
| $800 to $1,499 | 0 (0.0%) | 0 (0.0%) |
| Total | 97 (100.0%) | 47 (100.0%) |
Health & Disability in Rodriguez Hevia
Health Insurance Coverage by Age in Rodriguez Hevia
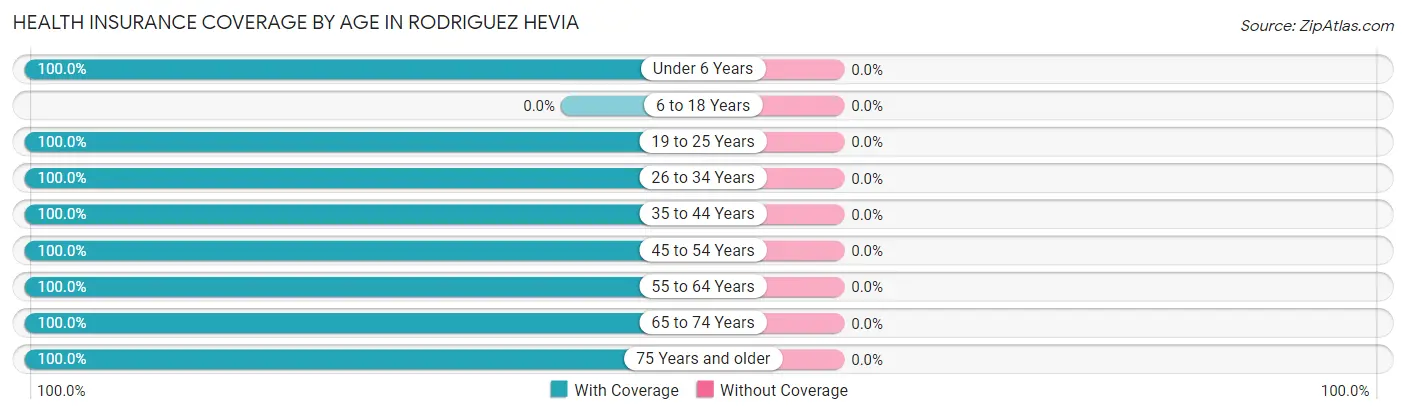
| Age Bracket | With Coverage | Without Coverage |
| Under 6 Years | 31 (100.0%) | 0 (0.0%) |
| 6 to 18 Years | 0 (0.0%) | 0 (0.0%) |
| 19 to 25 Years | 152 (100.0%) | 0 (0.0%) |
| 26 to 34 Years | 94 (100.0%) | 0 (0.0%) |
| 35 to 44 Years | 85 (100.0%) | 0 (0.0%) |
| 45 to 54 Years | 119 (100.0%) | 0 (0.0%) |
| 55 to 64 Years | 17 (100.0%) | 0 (0.0%) |
| 65 to 74 Years | 42 (100.0%) | 0 (0.0%) |
| 75 Years and older | 51 (100.0%) | 0 (0.0%) |
| Total | 591 (100.0%) | 0 (0.0%) |
Health Insurance Coverage by Citizenship Status in Rodriguez Hevia
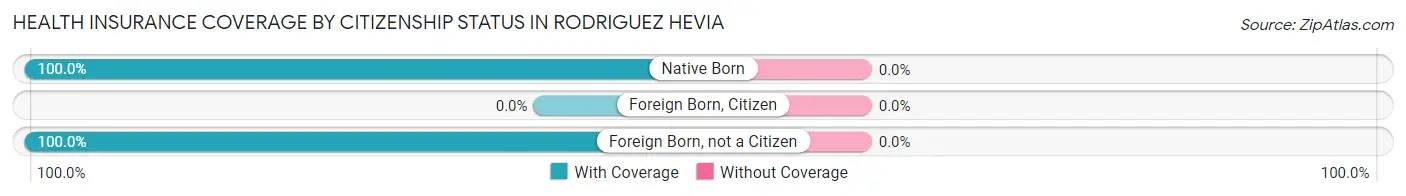
| Citizenship Status | With Coverage | Without Coverage |
| Native Born | 31 (100.0%) | 0 (0.0%) |
| Foreign Born, Citizen | 0 (0.0%) | 0 (0.0%) |
| Foreign Born, not a Citizen | 152 (100.0%) | 0 (0.0%) |
Health Insurance Coverage by Household Income in Rodriguez Hevia
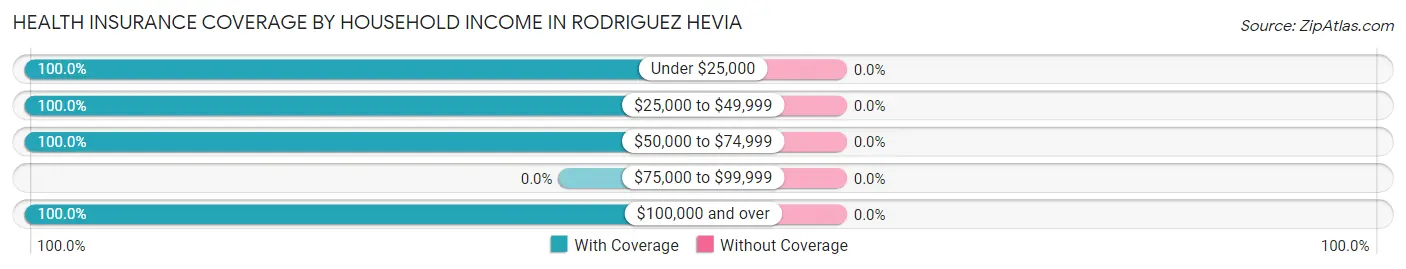
| Household Income | With Coverage | Without Coverage |
| Under $25,000 | 133 (100.0%) | 0 (0.0%) |
| $25,000 to $49,999 | 176 (100.0%) | 0 (0.0%) |
| $50,000 to $74,999 | 183 (100.0%) | 0 (0.0%) |
| $75,000 to $99,999 | 0 (0.0%) | 0 (0.0%) |
| $100,000 and over | 99 (100.0%) | 0 (0.0%) |
Public vs Private Health Insurance Coverage by Age in Rodriguez Hevia
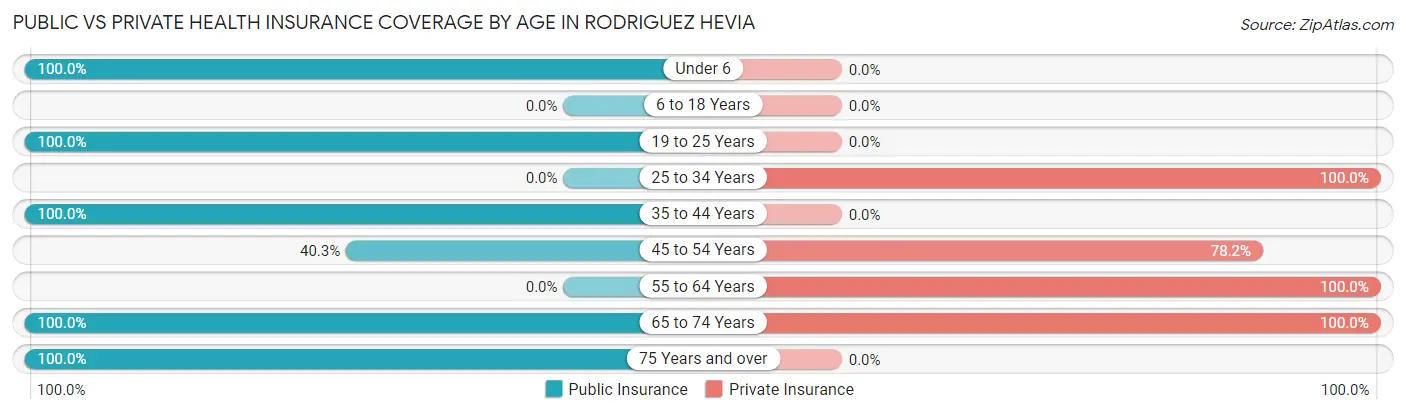
| Age Bracket | Public Insurance | Private Insurance |
| Under 6 | 31 (100.0%) | 0 (0.0%) |
| 6 to 18 Years | 0 (0.0%) | 0 (0.0%) |
| 19 to 25 Years | 152 (100.0%) | 0 (0.0%) |
| 25 to 34 Years | 0 (0.0%) | 94 (100.0%) |
| 35 to 44 Years | 85 (100.0%) | 0 (0.0%) |
| 45 to 54 Years | 48 (40.3%) | 93 (78.1%) |
| 55 to 64 Years | 0 (0.0%) | 17 (100.0%) |
| 65 to 74 Years | 42 (100.0%) | 42 (100.0%) |
| 75 Years and over | 51 (100.0%) | 0 (0.0%) |
| Total | 409 (69.2%) | 246 (41.6%) |
Disability Status by Sex by Age in Rodriguez Hevia
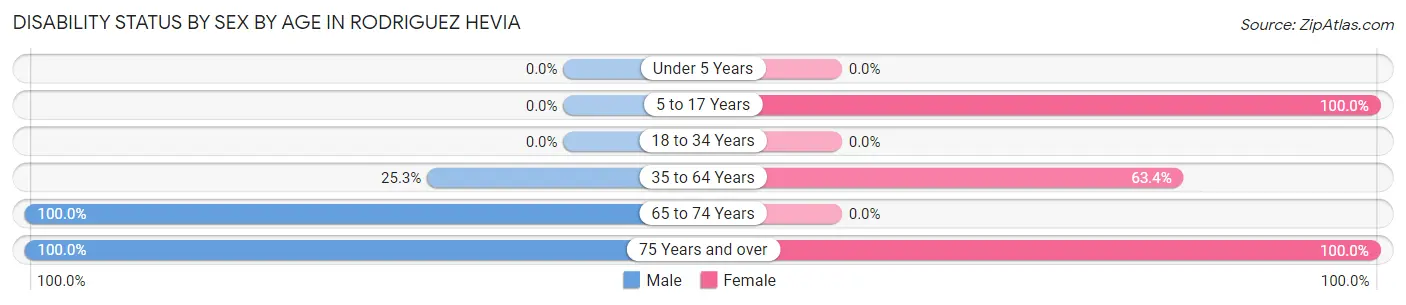
| Age Bracket | Male | Female |
| Under 5 Years | 0 (0.0%) | 0 (0.0%) |
| 5 to 17 Years | 0 (0.0%) | 31 (100.0%) |
| 18 to 34 Years | 0 (0.0%) | 0 (0.0%) |
| 35 to 64 Years | 22 (25.3%) | 85 (63.4%) |
| 65 to 74 Years | 42 (100.0%) | 0 (0.0%) |
| 75 Years and over | 18 (100.0%) | 33 (100.0%) |
Disability Class by Sex by Age in Rodriguez Hevia
Disability Class: Hearing Difficulty
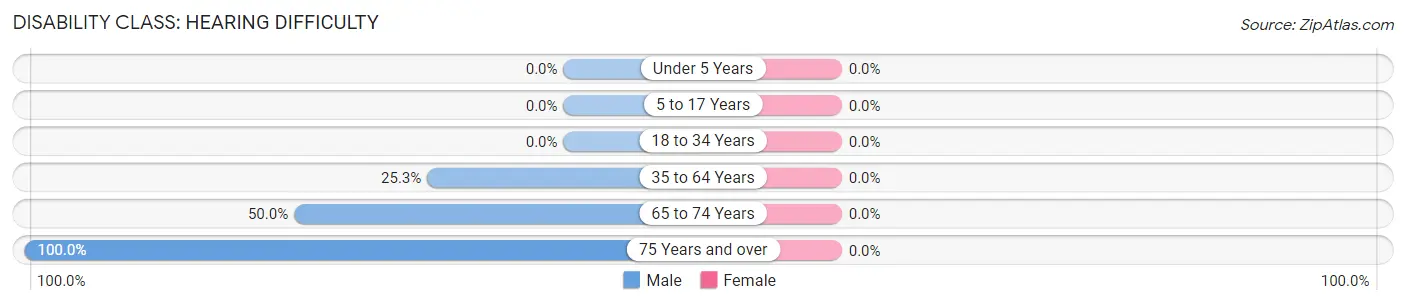
| Age Bracket | Male | Female |
| Under 5 Years | 0 (0.0%) | 0 (0.0%) |
| 5 to 17 Years | 0 (0.0%) | 0 (0.0%) |
| 18 to 34 Years | 0 (0.0%) | 0 (0.0%) |
| 35 to 64 Years | 22 (25.3%) | 0 (0.0%) |
| 65 to 74 Years | 21 (50.0%) | 0 (0.0%) |
| 75 Years and over | 18 (100.0%) | 0 (0.0%) |
Disability Class: Vision Difficulty
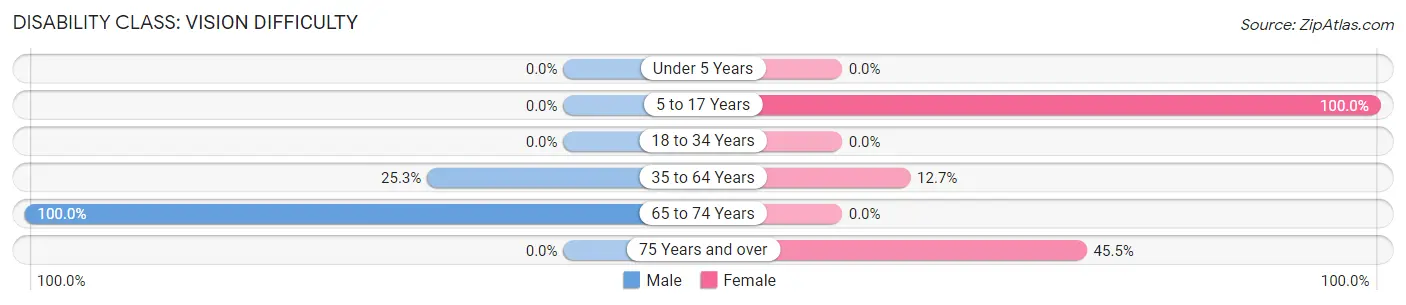
| Age Bracket | Male | Female |
| Under 5 Years | 0 (0.0%) | 0 (0.0%) |
| 5 to 17 Years | 0 (0.0%) | 31 (100.0%) |
| 18 to 34 Years | 0 (0.0%) | 0 (0.0%) |
| 35 to 64 Years | 22 (25.3%) | 17 (12.7%) |
| 65 to 74 Years | 42 (100.0%) | 0 (0.0%) |
| 75 Years and over | 0 (0.0%) | 15 (45.5%) |
Disability Class: Cognitive Difficulty
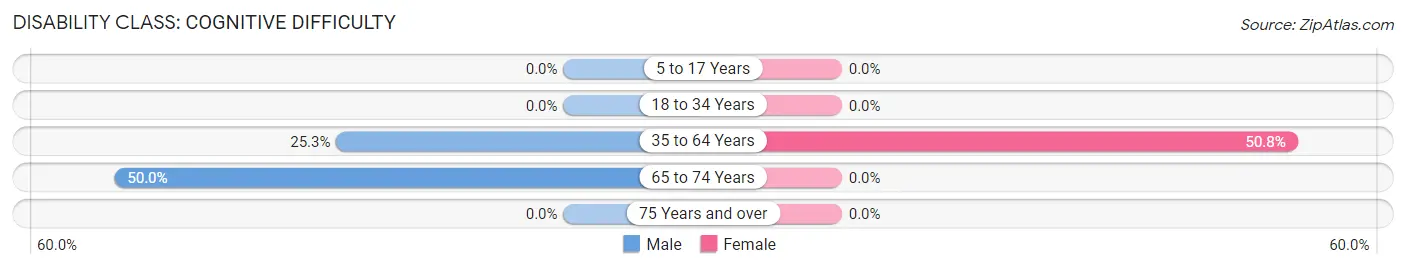
| Age Bracket | Male | Female |
| 5 to 17 Years | 0 (0.0%) | 0 (0.0%) |
| 18 to 34 Years | 0 (0.0%) | 0 (0.0%) |
| 35 to 64 Years | 22 (25.3%) | 68 (50.7%) |
| 65 to 74 Years | 21 (50.0%) | 0 (0.0%) |
| 75 Years and over | 0 (0.0%) | 0 (0.0%) |
Disability Class: Ambulatory Difficulty
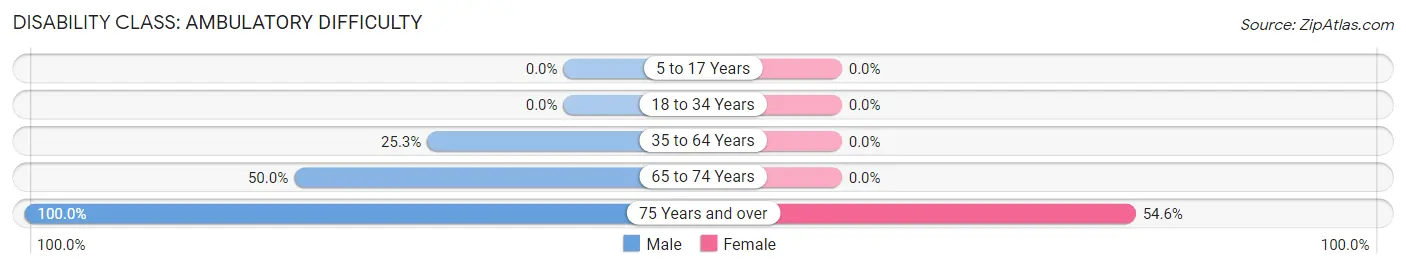
| Age Bracket | Male | Female |
| 5 to 17 Years | 0 (0.0%) | 0 (0.0%) |
| 18 to 34 Years | 0 (0.0%) | 0 (0.0%) |
| 35 to 64 Years | 22 (25.3%) | 0 (0.0%) |
| 65 to 74 Years | 21 (50.0%) | 0 (0.0%) |
| 75 Years and over | 18 (100.0%) | 18 (54.5%) |
Disability Class: Self-Care Difficulty
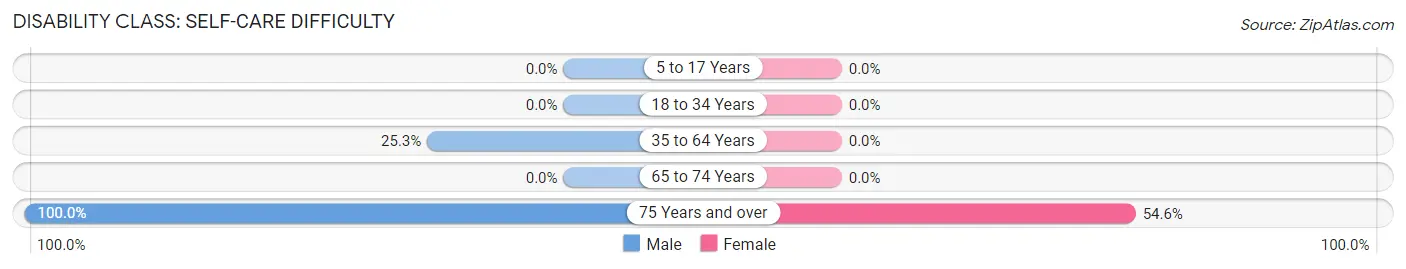
| Age Bracket | Male | Female |
| 5 to 17 Years | 0 (0.0%) | 0 (0.0%) |
| 18 to 34 Years | 0 (0.0%) | 0 (0.0%) |
| 35 to 64 Years | 22 (25.3%) | 0 (0.0%) |
| 65 to 74 Years | 0 (0.0%) | 0 (0.0%) |
| 75 Years and over | 18 (100.0%) | 18 (54.5%) |
Technology Access in Rodriguez Hevia
Computing Device Access in Rodriguez Hevia
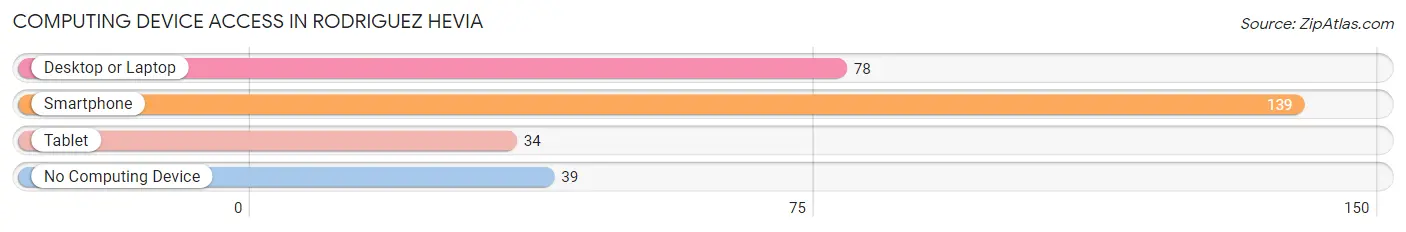
| Device Type | # Households | % Households |
| Desktop or Laptop | 78 | 43.8% |
| Smartphone | 139 | 78.1% |
| Tablet | 34 | 19.1% |
| No Computing Device | 39 | 21.9% |
| Total | 178 | 100.0% |
Internet Access in Rodriguez Hevia
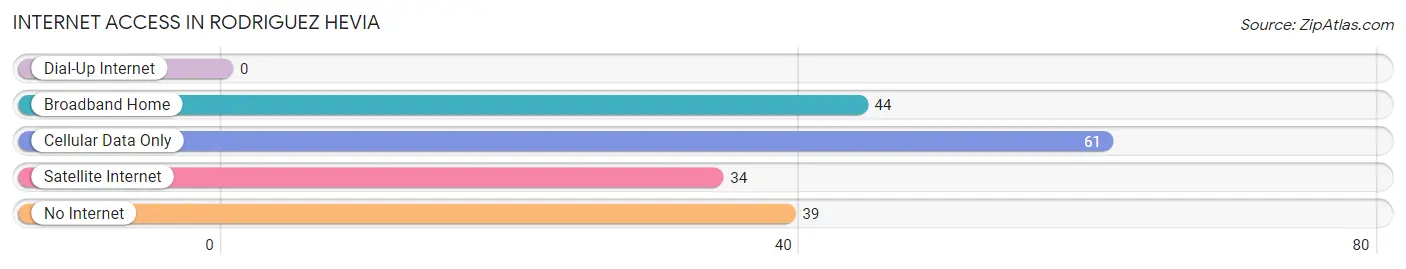
| Internet Type | # Households | % Households |
| Dial-Up Internet | 0 | 0.0% |
| Broadband Home | 44 | 24.7% |
| Cellular Data Only | 61 | 34.3% |
| Satellite Internet | 34 | 19.1% |
| No Internet | 39 | 21.9% |
| Total | 178 | 100.0% |
Rodriguez Hevia Summary
PR History
Puerto Rico is a Caribbean island located in the northeastern Caribbean Sea, east of the Dominican Republic and west of the Virgin Islands. It is the smallest of the Greater Antilles and is the easternmost island of the West Indies. Puerto Rico has a long and rich history, beginning with its first inhabitants, the Taíno Indians, who arrived on the island around 1000 A.D. The Taíno were a peaceful people who lived in small villages and were skilled farmers and fishermen.
In 1493, Christopher Columbus arrived in Puerto Rico and claimed the island for Spain. The Spanish began to colonize the island and brought with them African slaves to work the plantations. The Spanish also introduced Catholicism to the island, which remains the predominant religion today.
In 1898, the Spanish-American War ended with the Treaty of Paris, which ceded Puerto Rico to the United States. The island became a U.S. territory and was granted U.S. citizenship in 1917. In 1952, Puerto Rico became a self-governing commonwealth of the United States.
Since then, Puerto Rico has experienced a period of rapid economic growth and development. The island has become a major tourist destination, with its beautiful beaches, vibrant culture, and unique cuisine.
Geography
Puerto Rico is an archipelago located in the northeastern Caribbean Sea, east of the Dominican Republic and west of the Virgin Islands. It is the smallest of the Greater Antilles and is the easternmost island of the West Indies. The main island of Puerto Rico is approximately 100 miles long and 35 miles wide, with a total area of 3,515 square miles.
The island is divided into 78 municipalities, each with its own government. The capital and largest city is San Juan, located on the northern coast. Other major cities include Ponce, Mayagüez, and Arecibo.
The terrain of Puerto Rico is mostly mountainous, with the highest peak, Cerro de Punta, reaching 4,390 feet. The climate is tropical, with temperatures ranging from the mid-70s to the mid-80s year-round.
Economy
Puerto Rico has a diversified economy, with a mix of agriculture, manufacturing, and services. The island’s main industries are pharmaceuticals, electronics, and tourism.
Agriculture is an important part of the economy, with the main crops being sugarcane, coffee, and bananas. Manufacturing is also a major industry, with the main products being chemicals, electronics, and textiles.
The service sector is the largest part of the economy, accounting for over 70% of GDP. Tourism is the main component of the service sector, with over 4 million visitors to the island each year.
Demographics
Puerto Rico has a population of 3.2 million people, with the majority of the population living on the main island. The population is largely of Spanish and African descent, with smaller numbers of Taino Indians, Europeans, and Asians.
The official language of Puerto Rico is Spanish, although English is also widely spoken. The majority of the population is Roman Catholic, with smaller numbers of Protestants and other religions.
Conclusion
Puerto Rico is a Caribbean island with a long and rich history. It is a self-governing commonwealth of the United States, with a diversified economy and a population of 3.2 million people. The island is divided into 78 municipalities, each with its own government. The main industries are pharmaceuticals, electronics, and tourism, and the official language is Spanish. Puerto Rico is a vibrant and beautiful island with a unique culture and cuisine.
Common Questions
What is Per Capita Income in Rodriguez Hevia?
Per Capita income in Rodriguez Hevia is $16,080.
What is the Median Family Income in Rodriguez Hevia?
Median Family Income in Rodriguez Hevia is $43,068.
What is the Median Household income in Rodriguez Hevia?
Median Household Income in Rodriguez Hevia is $43,298.
What is Inequality or Gini Index in Rodriguez Hevia?
Inequality or Gini Index in Rodriguez Hevia is 0.37.
What is the Total Population of Rodriguez Hevia?
Total Population of Rodriguez Hevia is 591.
What is the Total Male Population of Rodriguez Hevia?
Total Male Population of Rodriguez Hevia is 232.
What is the Total Female Population of Rodriguez Hevia?
Total Female Population of Rodriguez Hevia is 359.
What is the Ratio of Males per 100 Females in Rodriguez Hevia?
There are 64.62 Males per 100 Females in Rodriguez Hevia.
What is the Ratio of Females per 100 Males in Rodriguez Hevia?
There are 154.74 Females per 100 Males in Rodriguez Hevia.
What is the Median Population Age in Rodriguez Hevia?
Median Population Age in Rodriguez Hevia is 42.3 Years.
What is the Average Family Size in Rodriguez Hevia
Average Family Size in Rodriguez Hevia is 3.9 People.
What is the Average Household Size in Rodriguez Hevia
Average Household Size in Rodriguez Hevia is 3.3 People.
How Large is the Labor Force in Rodriguez Hevia?
There are 337 People in the Labor Forcein in Rodriguez Hevia.
What is the Percentage of People in the Labor Force in Rodriguez Hevia?
60.2% of People are in the Labor Force in Rodriguez Hevia.
What is the Unemployment Rate in Rodriguez Hevia?
Unemployment Rate in Rodriguez Hevia is 4.2%.