Tallaboa, PR Map & Demographics
Tallaboa Map
Tallaboa Overview
$23,963
PER CAPITA INCOME
$36,985
AVG FAMILY INCOME
$29,500
AVG HOUSEHOLD INCOME
16.6%
WAGE / INCOME GAP [ % ]
83.4¢/ $1
WAGE / INCOME GAP [ $ ]
$5,577
FAMILY INCOME DEFICIT
0.66
INEQUALITY / GINI INDEX
1,022
TOTAL POPULATION
444
MALE POPULATION
578
FEMALE POPULATION
76.82
MALES / 100 FEMALES
130.18
FEMALES / 100 MALES
49.7
MEDIAN AGE
3.5
AVG FAMILY SIZE
3.1
AVG HOUSEHOLD SIZE
271
LABOR FORCE [ PEOPLE ]
30.6%
PERCENT IN LABOR FORCE
5.9%
UNEMPLOYMENT RATE
Income in Tallaboa
Income Overview in Tallaboa
Per Capita Income in Tallaboa is $23,963, while median incomes of families and households are $36,985 and $29,500 respectively.
| Characteristic | Number | Measure |
| Per Capita Income | 1,022 | $23,963 |
| Median Family Income | 269 | $36,985 |
| Mean Family Income | 269 | $79,520 |
| Median Household Income | 326 | $29,500 |
| Mean Household Income | 326 | $68,317 |
| Income Deficit | 269 | $5,577 |
| Wage / Income Gap (%) | 1,022 | 16.57% |
| Wage / Income Gap ($) | 1,022 | 83.43¢ per $1 |
| Gini / Inequality Index | 1,022 | 0.66 |
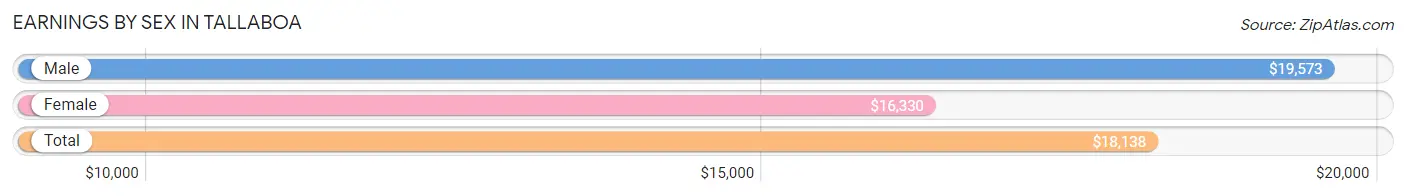
Earnings by Sex in Tallaboa
Average Earnings in Tallaboa are $18,138, $19,573 for men and $16,330 for women, a difference of 16.6%.
| Sex | Number | Average Earnings |
| Male | 152 (54.3%) | $19,573 |
| Female | 128 (45.7%) | $16,330 |
| Total | 280 (100.0%) | $18,138 |
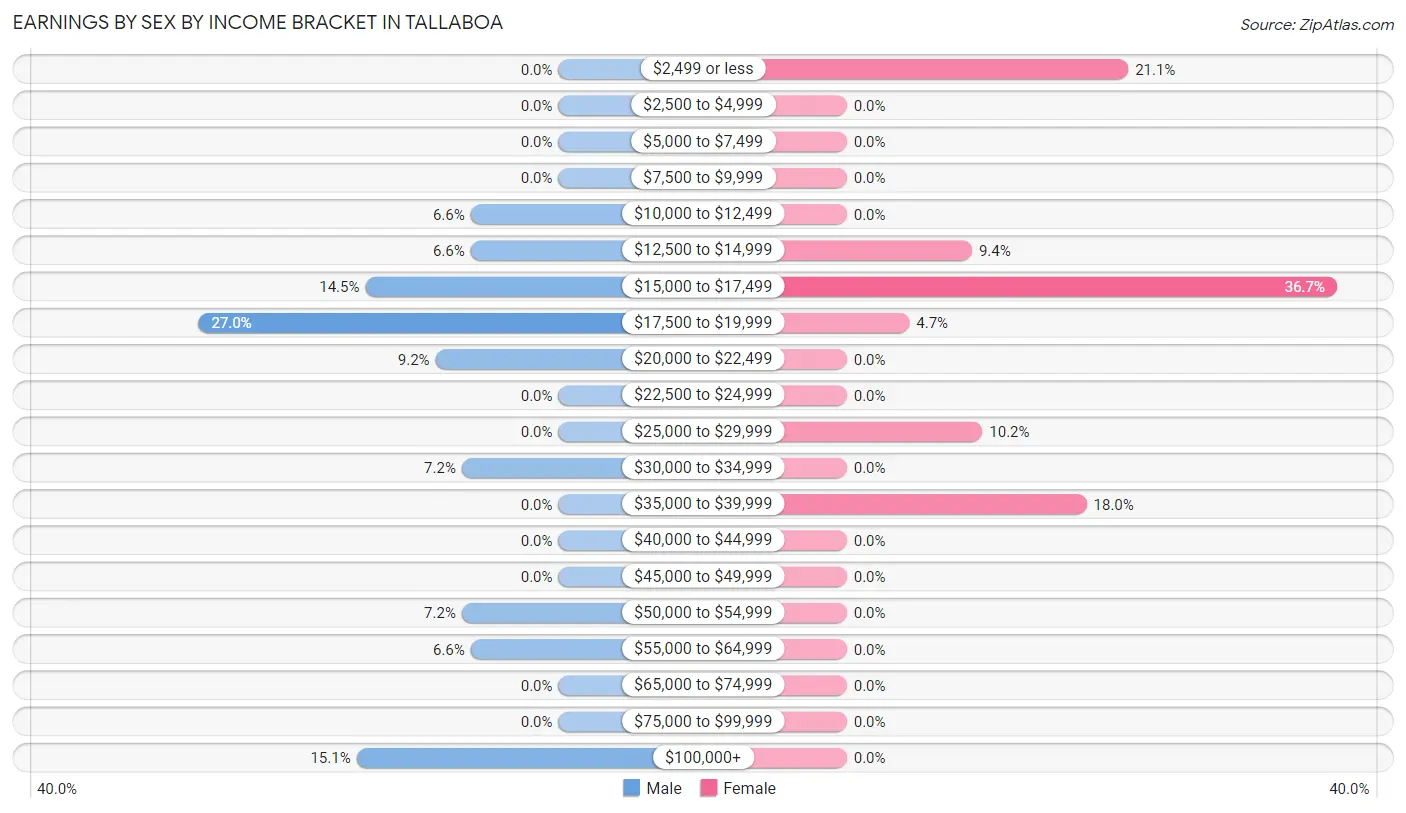
Earnings by Sex by Income Bracket in Tallaboa
The most common earnings brackets in Tallaboa are $17,500 to $19,999 for men (41 | 27.0%) and $15,000 to $17,499 for women (47 | 36.7%).
| Income | Male | Female |
| $2,499 or less | 0 (0.0%) | 27 (21.1%) |
| $2,500 to $4,999 | 0 (0.0%) | 0 (0.0%) |
| $5,000 to $7,499 | 0 (0.0%) | 0 (0.0%) |
| $7,500 to $9,999 | 0 (0.0%) | 0 (0.0%) |
| $10,000 to $12,499 | 10 (6.6%) | 0 (0.0%) |
| $12,500 to $14,999 | 10 (6.6%) | 12 (9.4%) |
| $15,000 to $17,499 | 22 (14.5%) | 47 (36.7%) |
| $17,500 to $19,999 | 41 (27.0%) | 6 (4.7%) |
| $20,000 to $22,499 | 14 (9.2%) | 0 (0.0%) |
| $22,500 to $24,999 | 0 (0.0%) | 0 (0.0%) |
| $25,000 to $29,999 | 0 (0.0%) | 13 (10.2%) |
| $30,000 to $34,999 | 11 (7.2%) | 0 (0.0%) |
| $35,000 to $39,999 | 0 (0.0%) | 23 (18.0%) |
| $40,000 to $44,999 | 0 (0.0%) | 0 (0.0%) |
| $45,000 to $49,999 | 0 (0.0%) | 0 (0.0%) |
| $50,000 to $54,999 | 11 (7.2%) | 0 (0.0%) |
| $55,000 to $64,999 | 10 (6.6%) | 0 (0.0%) |
| $65,000 to $74,999 | 0 (0.0%) | 0 (0.0%) |
| $75,000 to $99,999 | 0 (0.0%) | 0 (0.0%) |
| $100,000+ | 23 (15.1%) | 0 (0.0%) |
| Total | 152 (100.0%) | 128 (100.0%) |
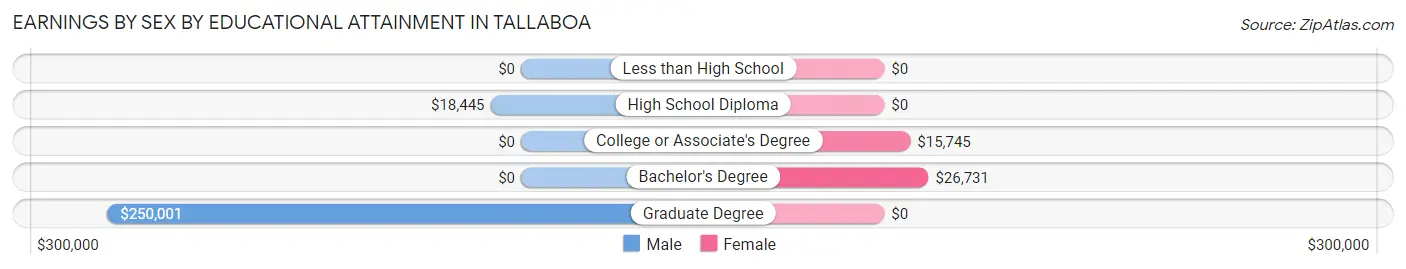
Earnings by Sex by Educational Attainment in Tallaboa
Average earnings in Tallaboa are $19,573 for men and $16,330 for women, a difference of 16.6%. Men with an educational attainment of graduate degree enjoy the highest average annual earnings of $250,001, while those with high school diploma education earn the least with $18,445. Women with an educational attainment of bachelor's degree earn the most with the average annual earnings of $26,731, while those with college or associate's degree education have the smallest earnings of $15,745.
| Educational Attainment | Male Income | Female Income |
| Less than High School | - | - |
| High School Diploma | $18,445 | $0 |
| College or Associate's Degree | - | - |
| Bachelor's Degree | - | - |
| Graduate Degree | $250,001 | $0 |
| Total | $19,573 | $16,330 |
Family Income in Tallaboa
Family Income Brackets in Tallaboa
According to the Tallaboa family income data, there are 82 families falling into the $35,000 to $49,999 income range, which is the most common income bracket and makes up 30.5% of all families.
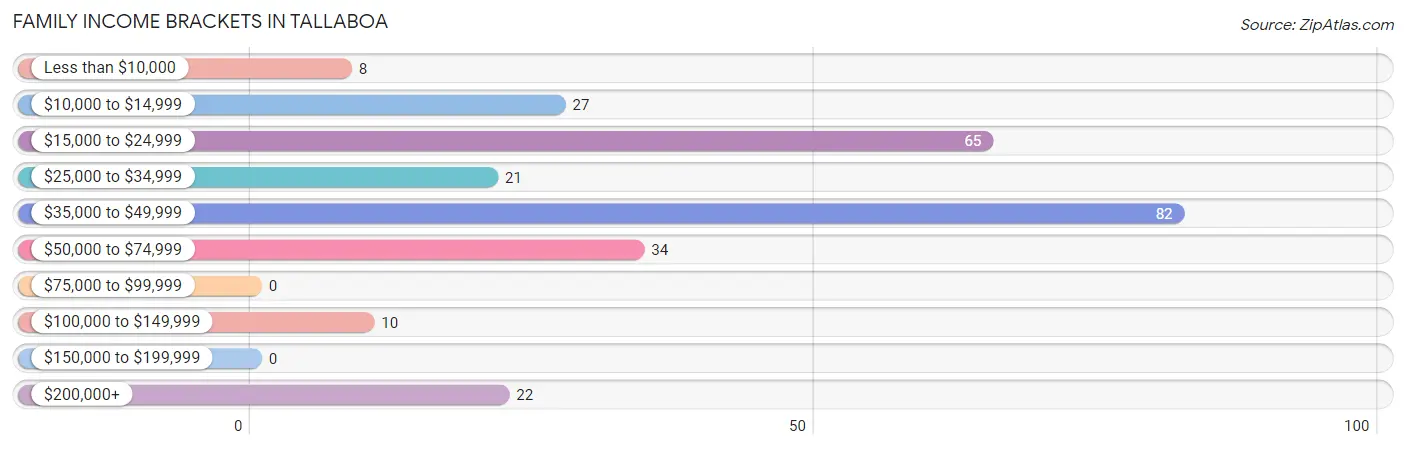
| Income Bracket | # Families | % Families |
| Less than $10,000 | 8 | 3.0% |
| $10,000 to $14,999 | 27 | 10.0% |
| $15,000 to $24,999 | 65 | 24.2% |
| $25,000 to $34,999 | 21 | 7.8% |
| $35,000 to $49,999 | 82 | 30.5% |
| $50,000 to $74,999 | 34 | 12.6% |
| $75,000 to $99,999 | 0 | 0.0% |
| $100,000 to $149,999 | 10 | 3.7% |
| $150,000 to $199,999 | 0 | 0.0% |
| $200,000+ | 22 | 8.2% |
Family Income by Famaliy Size in Tallaboa
4-person families (56 | 20.8%) account for the highest median family income in Tallaboa with $40,132 per family, while 4-person families (56 | 20.8%) have the highest median income of $10,033 per family member.
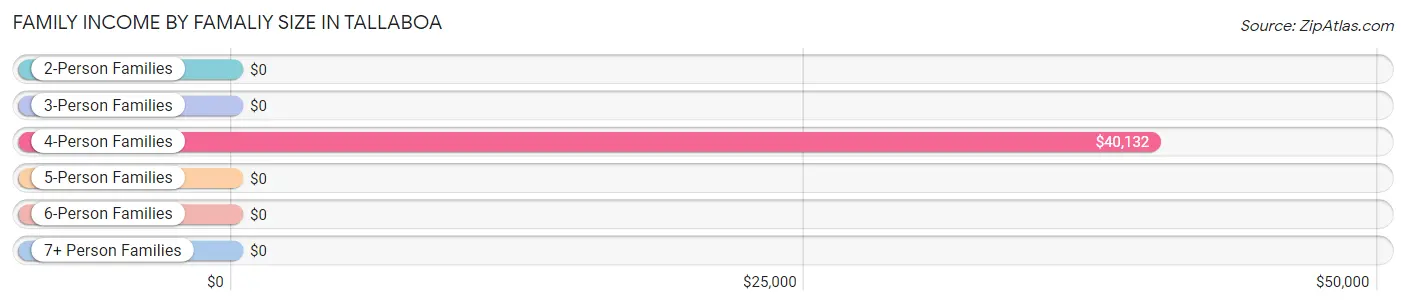
| Income Bracket | # Families | Median Income |
| 2-Person Families | 138 (51.3%) | $0 |
| 3-Person Families | 63 (23.4%) | $0 |
| 4-Person Families | 56 (20.8%) | $40,132 |
| 5-Person Families | 12 (4.5%) | $0 |
| 6-Person Families | 0 (0.0%) | $0 |
| 7+ Person Families | 0 (0.0%) | $0 |
| Total | 269 (100.0%) | $36,985 |
Family Income by Number of Earners in Tallaboa
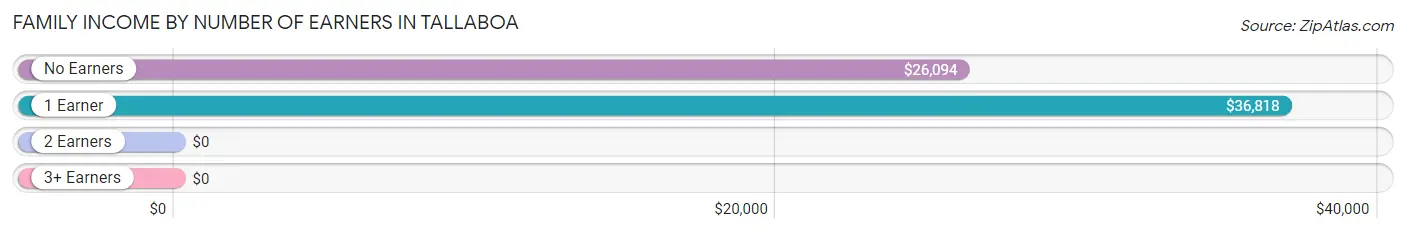
| Number of Earners | # Families | Median Income |
| No Earners | 114 (42.4%) | $26,094 |
| 1 Earner | 100 (37.2%) | $36,818 |
| 2 Earners | 55 (20.4%) | $0 |
| 3+ Earners | 0 (0.0%) | $0 |
| Total | 269 (100.0%) | $36,985 |
Household Income in Tallaboa
Household Income Brackets in Tallaboa
With 90 households falling in the category, the $35,000 to $49,999 income range is the most frequent in Tallaboa, accounting for 27.6% of all households.
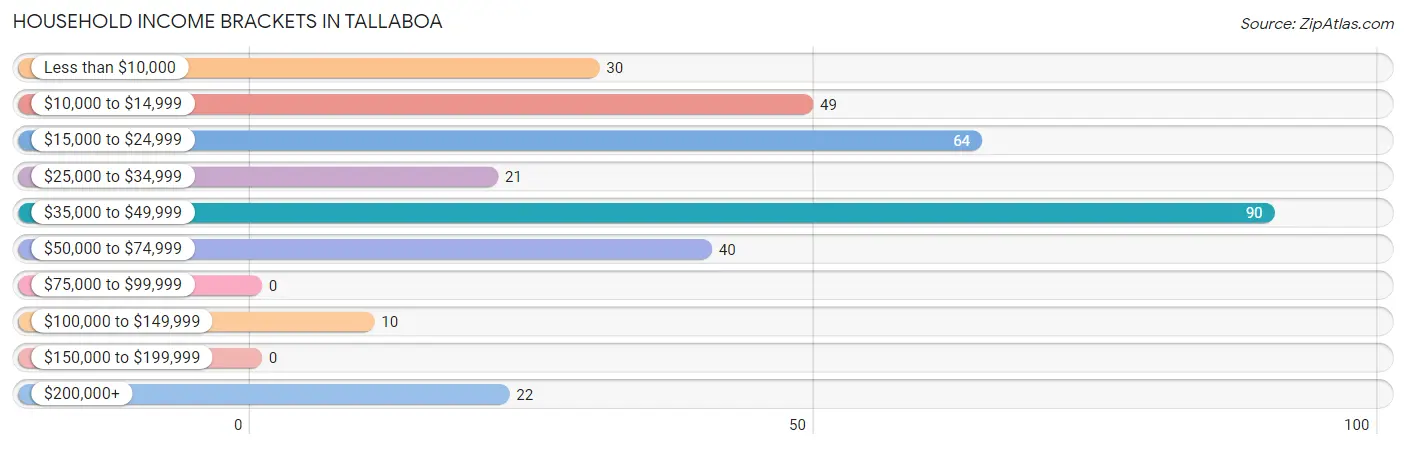
| Income Bracket | # Households | % Households |
| Less than $10,000 | 30 | 9.2% |
| $10,000 to $14,999 | 49 | 15.0% |
| $15,000 to $24,999 | 64 | 19.6% |
| $25,000 to $34,999 | 21 | 6.4% |
| $35,000 to $49,999 | 90 | 27.6% |
| $50,000 to $74,999 | 40 | 12.3% |
| $75,000 to $99,999 | 0 | 0.0% |
| $100,000 to $149,999 | 10 | 3.1% |
| $150,000 to $199,999 | 0 | 0.0% |
| $200,000+ | 22 | 6.7% |
Household Income by Householder Age in Tallaboa
The median household income in Tallaboa is $29,500, with the highest median household income of $40,395 found in the 45 to 64 years age bracket for the primary householder. A total of 150 households (46.0%) fall into this category.
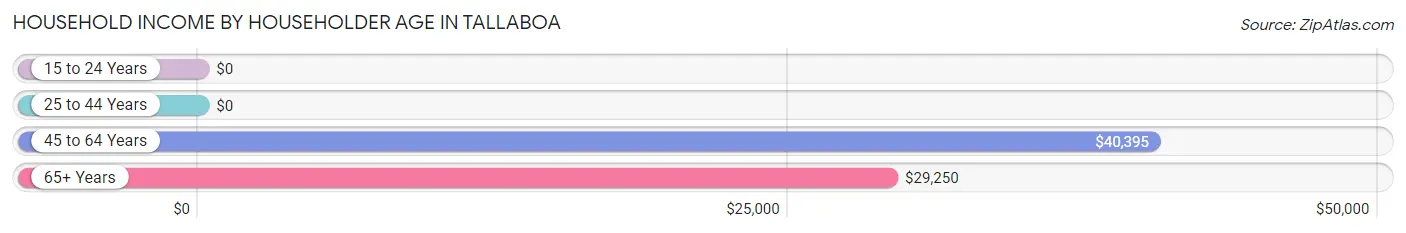
| Income Bracket | # Households | Median Income |
| 15 to 24 Years | 0 (0.0%) | $0 |
| 25 to 44 Years | 55 (16.9%) | $0 |
| 45 to 64 Years | 150 (46.0%) | $40,395 |
| 65+ Years | 121 (37.1%) | $29,250 |
| Total | 326 (100.0%) | $29,500 |
Poverty in Tallaboa
Income Below Poverty by Sex and Age in Tallaboa
With 52.9% poverty level for males and 26.8% for females among the residents of Tallaboa, 25 to 34 year old males and 16 and 17 year old females are the most vulnerable to poverty, with 10 males (100.0%) and 23 females (60.5%) in their respective age groups living below the poverty level.
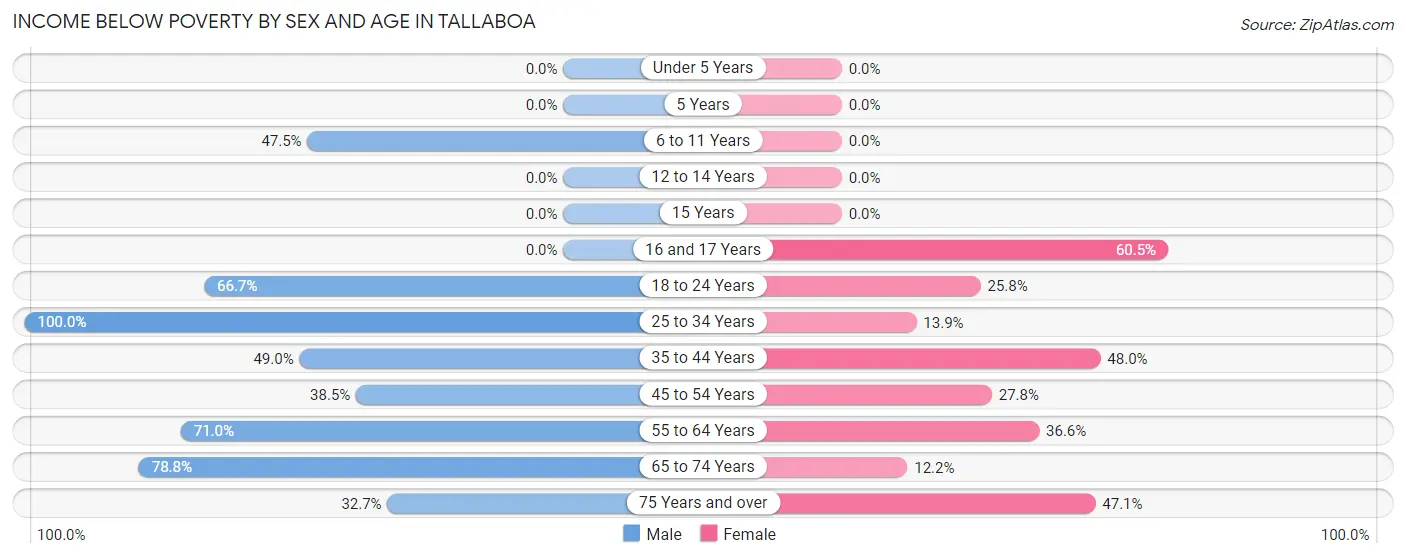
| Age Bracket | Male | Female |
| Under 5 Years | 0 (0.0%) | 0 (0.0%) |
| 5 Years | 0 (0.0%) | 0 (0.0%) |
| 6 to 11 Years | 19 (47.5%) | 0 (0.0%) |
| 12 to 14 Years | 0 (0.0%) | 0 (0.0%) |
| 15 Years | 0 (0.0%) | 0 (0.0%) |
| 16 and 17 Years | 0 (0.0%) | 23 (60.5%) |
| 18 to 24 Years | 34 (66.7%) | 17 (25.8%) |
| 25 to 34 Years | 10 (100.0%) | 9 (13.9%) |
| 35 to 44 Years | 24 (49.0%) | 12 (48.0%) |
| 45 to 54 Years | 35 (38.5%) | 27 (27.8%) |
| 55 to 64 Years | 71 (71.0%) | 26 (36.6%) |
| 65 to 74 Years | 26 (78.8%) | 9 (12.2%) |
| 75 Years and over | 16 (32.7%) | 32 (47.1%) |
| Total | 235 (52.9%) | 155 (26.8%) |
Income Above Poverty by Sex and Age in Tallaboa
According to the poverty statistics in Tallaboa, males aged under 5 years and females aged under 5 years are the age groups that are most secure financially, with 100.0% of males and 100.0% of females in these age groups living above the poverty line.
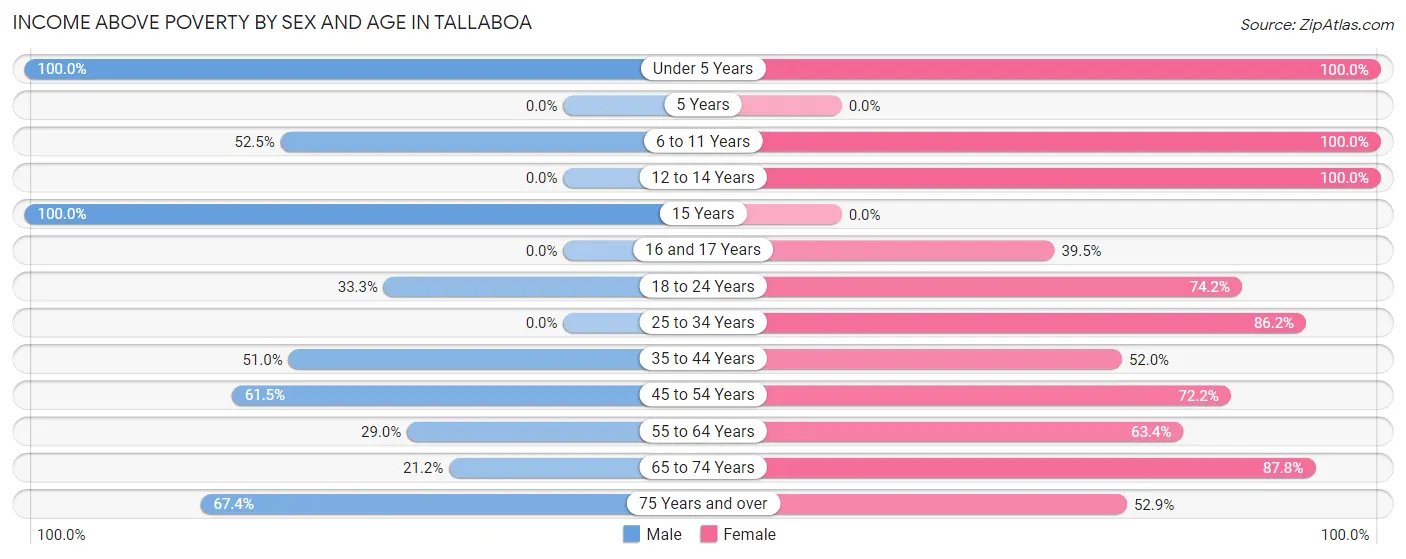
| Age Bracket | Male | Female |
| Under 5 Years | 10 (100.0%) | 18 (100.0%) |
| 5 Years | 0 (0.0%) | 0 (0.0%) |
| 6 to 11 Years | 21 (52.5%) | 33 (100.0%) |
| 12 to 14 Years | 0 (0.0%) | 23 (100.0%) |
| 15 Years | 11 (100.0%) | 0 (0.0%) |
| 16 and 17 Years | 0 (0.0%) | 15 (39.5%) |
| 18 to 24 Years | 17 (33.3%) | 49 (74.2%) |
| 25 to 34 Years | 0 (0.0%) | 56 (86.2%) |
| 35 to 44 Years | 25 (51.0%) | 13 (52.0%) |
| 45 to 54 Years | 56 (61.5%) | 70 (72.2%) |
| 55 to 64 Years | 29 (29.0%) | 45 (63.4%) |
| 65 to 74 Years | 7 (21.2%) | 65 (87.8%) |
| 75 Years and over | 33 (67.3%) | 36 (52.9%) |
| Total | 209 (47.1%) | 423 (73.2%) |
Income Below Poverty Among Married-Couple Families in Tallaboa
The poverty statistics for married-couple families in Tallaboa show that 38.1% or 53 of the total 139 families live below the poverty line. Families with 1 or 2 children have the highest poverty rate of 69.4%, comprising of 25 families. On the other hand, families with 3 or 4 children have the lowest poverty rate of 0.0%, which includes 0 families.
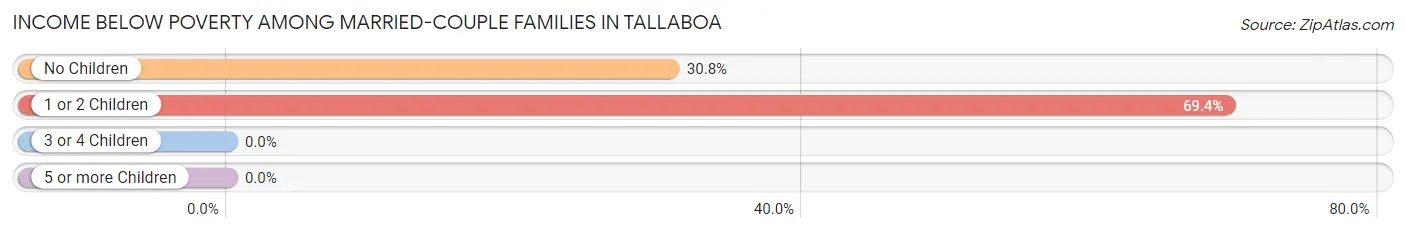
| Children | Above Poverty | Below Poverty |
| No Children | 63 (69.2%) | 28 (30.8%) |
| 1 or 2 Children | 11 (30.6%) | 25 (69.4%) |
| 3 or 4 Children | 12 (100.0%) | 0 (0.0%) |
| 5 or more Children | 0 (0.0%) | 0 (0.0%) |
| Total | 86 (61.9%) | 53 (38.1%) |
Income Below Poverty Among Single-Parent Households in Tallaboa
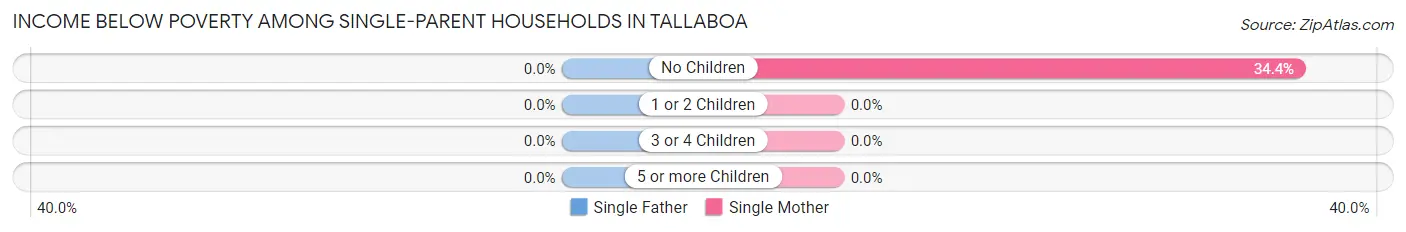
| Children | Single Father | Single Mother |
| No Children | 0 (0.0%) | 31 (34.4%) |
| 1 or 2 Children | 0 (0.0%) | 0 (0.0%) |
| 3 or 4 Children | 0 (0.0%) | 0 (0.0%) |
| 5 or more Children | 0 (0.0%) | 0 (0.0%) |
| Total | 0 (0.0%) | 31 (28.4%) |
Income Below Poverty Among Married-Couple vs Single-Parent Households in Tallaboa
The poverty data for Tallaboa shows that 53 of the married-couple family households (38.1%) and 31 of the single-parent households (23.8%) are living below the poverty level. Within the married-couple family households, those with 1 or 2 children have the highest poverty rate, with 25 households (69.4%) falling below the poverty line. Among the single-parent households, those with no children have the highest poverty rate, with 31 household (32.0%) living below poverty.
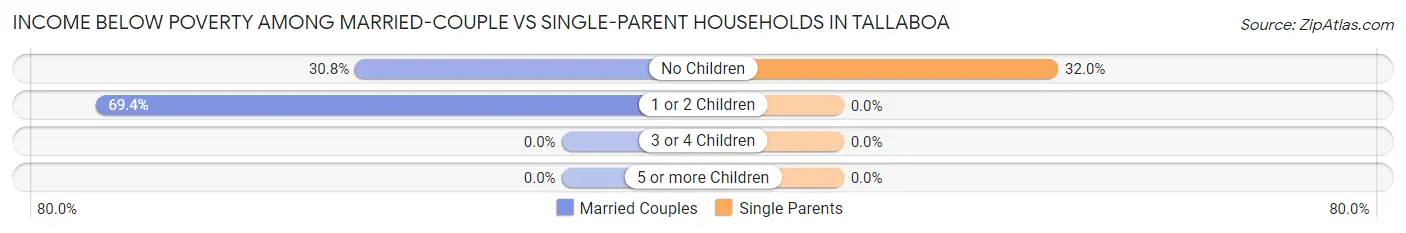
| Children | Married-Couple Families | Single-Parent Households |
| No Children | 28 (30.8%) | 31 (32.0%) |
| 1 or 2 Children | 25 (69.4%) | 0 (0.0%) |
| 3 or 4 Children | 0 (0.0%) | 0 (0.0%) |
| 5 or more Children | 0 (0.0%) | 0 (0.0%) |
| Total | 53 (38.1%) | 31 (23.8%) |
Race in Tallaboa
The most populous races in Tallaboa are Hispanic or Latino (1,022 | 100.0%), White / Caucasian (599 | 58.6%), and Some other Race (307 | 30.0%).
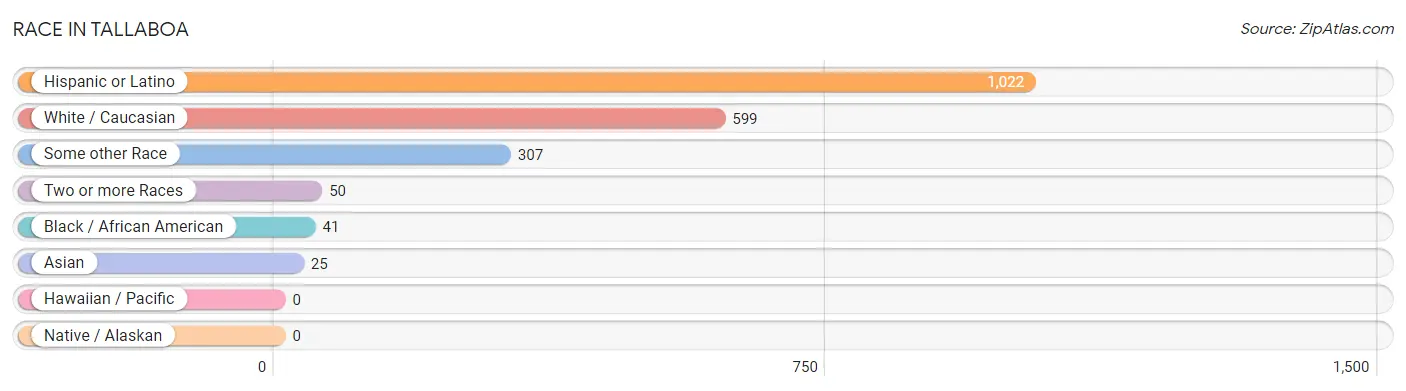
| Race | # Population | % Population |
| Asian | 25 | 2.5% |
| Black / African American | 41 | 4.0% |
| Hawaiian / Pacific | 0 | 0.0% |
| Hispanic or Latino | 1,022 | 100.0% |
| Native / Alaskan | 0 | 0.0% |
| White / Caucasian | 599 | 58.6% |
| Two or more Races | 50 | 4.9% |
| Some other Race | 307 | 30.0% |
| Total | 1,022 | 100.0% |
Ancestry in Tallaboa
The most populous ancestries reported in Tallaboa are Puerto Rican (1,011 | 98.9%), Thai (25 | 2.5%), and Cuban (11 | 1.1%), together accounting for 102.4% of all Tallaboa residents.
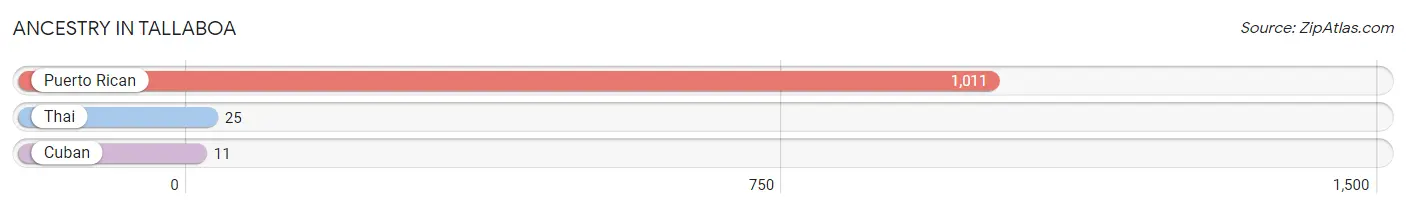
| Ancestry | # Population | % Population |
| Cuban | 11 | 1.1% |
| Puerto Rican | 1,011 | 98.9% |
| Thai | 25 | 2.5% | View All 3 Rows |
Immigrants in Tallaboa

| Immigration Origin | # Population | % Population | View All 0 Rows |
Sex and Age in Tallaboa
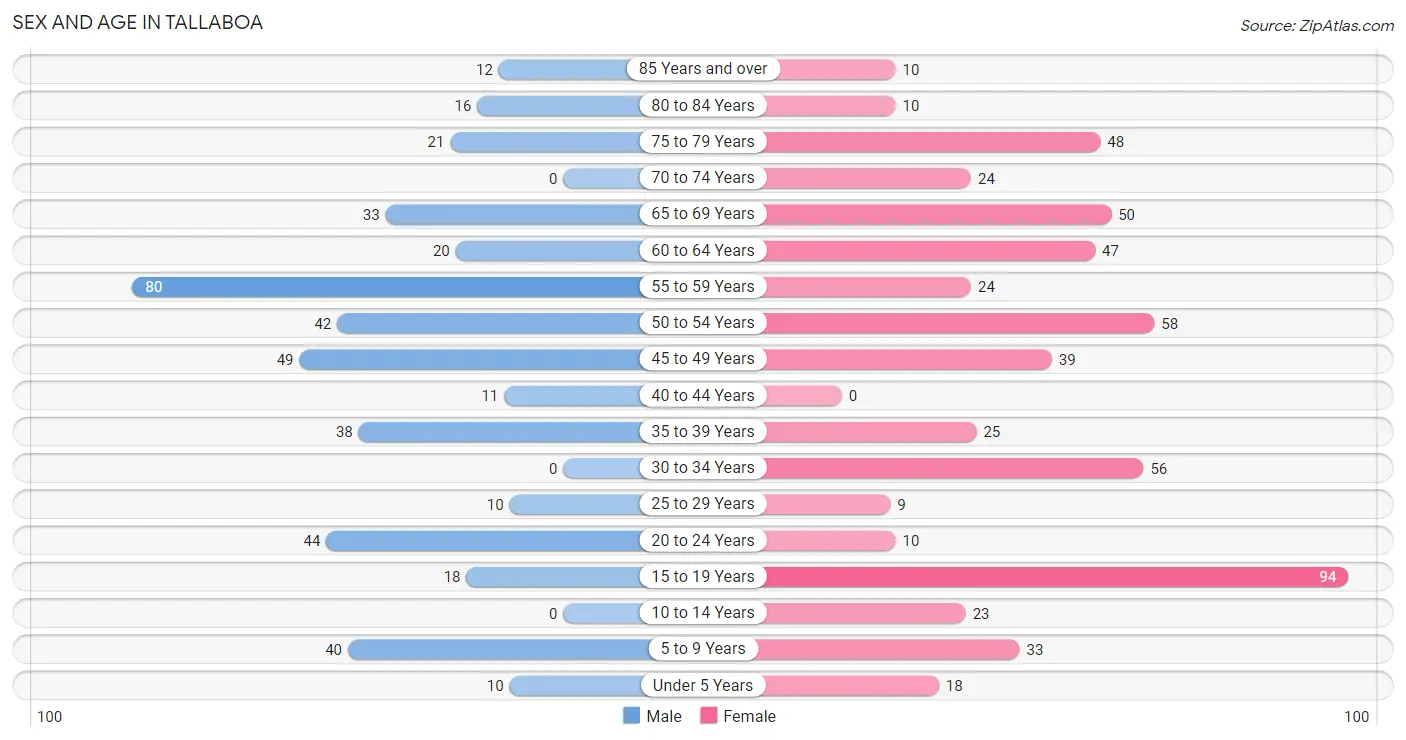
Sex and Age in Tallaboa
The most populous age groups in Tallaboa are 55 to 59 Years (80 | 18.0%) for men and 15 to 19 Years (94 | 16.3%) for women.
| Age Bracket | Male | Female |
| Under 5 Years | 10 (2.2%) | 18 (3.1%) |
| 5 to 9 Years | 40 (9.0%) | 33 (5.7%) |
| 10 to 14 Years | 0 (0.0%) | 23 (4.0%) |
| 15 to 19 Years | 18 (4.1%) | 94 (16.3%) |
| 20 to 24 Years | 44 (9.9%) | 10 (1.7%) |
| 25 to 29 Years | 10 (2.2%) | 9 (1.6%) |
| 30 to 34 Years | 0 (0.0%) | 56 (9.7%) |
| 35 to 39 Years | 38 (8.6%) | 25 (4.3%) |
| 40 to 44 Years | 11 (2.5%) | 0 (0.0%) |
| 45 to 49 Years | 49 (11.0%) | 39 (6.8%) |
| 50 to 54 Years | 42 (9.5%) | 58 (10.0%) |
| 55 to 59 Years | 80 (18.0%) | 24 (4.2%) |
| 60 to 64 Years | 20 (4.5%) | 47 (8.1%) |
| 65 to 69 Years | 33 (7.4%) | 50 (8.6%) |
| 70 to 74 Years | 0 (0.0%) | 24 (4.2%) |
| 75 to 79 Years | 21 (4.7%) | 48 (8.3%) |
| 80 to 84 Years | 16 (3.6%) | 10 (1.7%) |
| 85 Years and over | 12 (2.7%) | 10 (1.7%) |
| Total | 444 (100.0%) | 578 (100.0%) |
Families and Households in Tallaboa
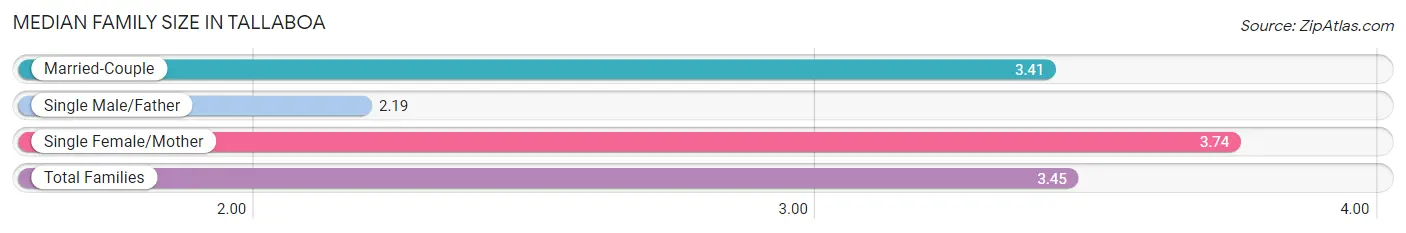
Median Family Size in Tallaboa
The median family size in Tallaboa is 3.45 persons per family, with single female/mother families (109 | 40.5%) accounting for the largest median family size of 3.74 persons per family. On the other hand, single male/father families (21 | 7.8%) represent the smallest median family size with 2.19 persons per family.
| Family Type | # Families | Family Size |
| Married-Couple | 139 (51.7%) | 3.41 |
| Single Male/Father | 21 (7.8%) | 2.19 |
| Single Female/Mother | 109 (40.5%) | 3.74 |
| Total Families | 269 (100.0%) | 3.45 |
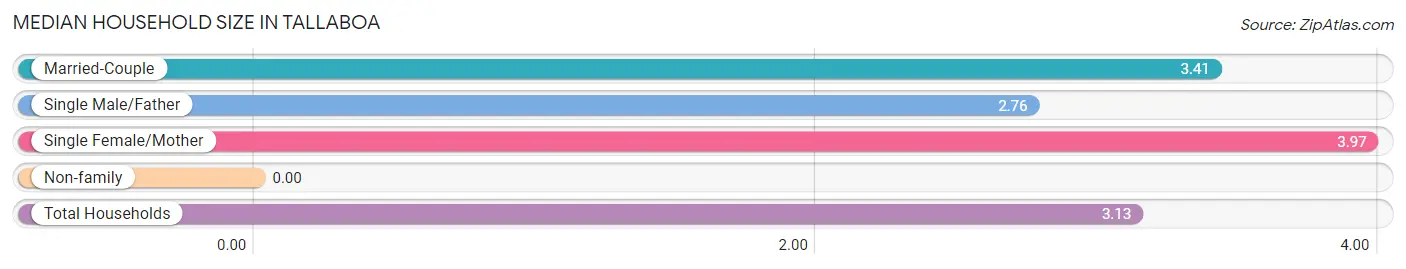
Median Household Size in Tallaboa
| Household Type | # Households | Household Size |
| Married-Couple | 139 (42.6%) | 3.41 |
| Single Male/Father | 21 (6.4%) | 2.76 |
| Single Female/Mother | 109 (33.4%) | 3.97 |
| Non-family | 57 (17.5%) | - |
| Total Households | 326 (100.0%) | 3.13 |
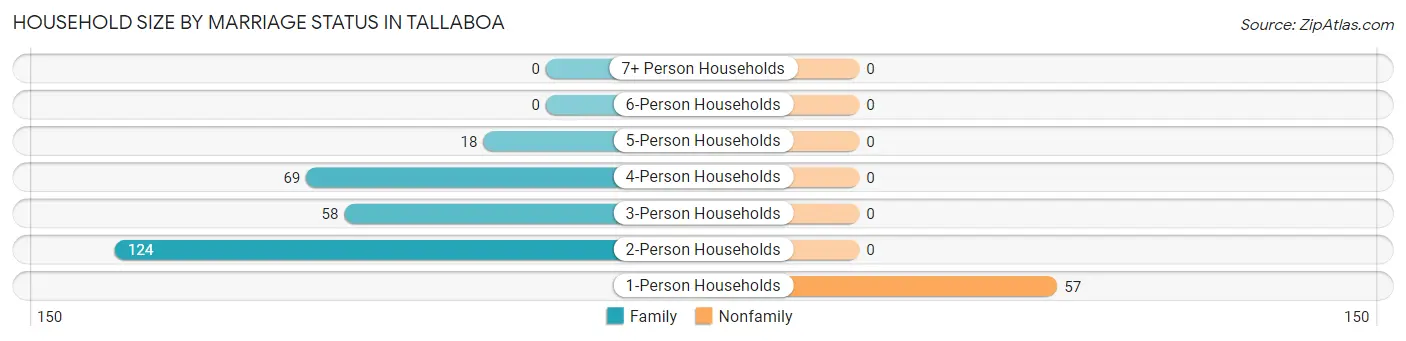
Household Size by Marriage Status in Tallaboa
Out of a total of 326 households in Tallaboa, 269 (82.5%) are family households, while 57 (17.5%) are nonfamily households. The most numerous type of family households are 2-person households, comprising 124, and the most common type of nonfamily households are 1-person households, comprising 57.
| Household Size | Family Households | Nonfamily Households |
| 1-Person Households | - | 57 (17.5%) |
| 2-Person Households | 124 (38.0%) | 0 (0.0%) |
| 3-Person Households | 58 (17.8%) | 0 (0.0%) |
| 4-Person Households | 69 (21.2%) | 0 (0.0%) |
| 5-Person Households | 18 (5.5%) | 0 (0.0%) |
| 6-Person Households | 0 (0.0%) | 0 (0.0%) |
| 7+ Person Households | 0 (0.0%) | 0 (0.0%) |
| Total | 269 (82.5%) | 57 (17.5%) |
Female Fertility in Tallaboa
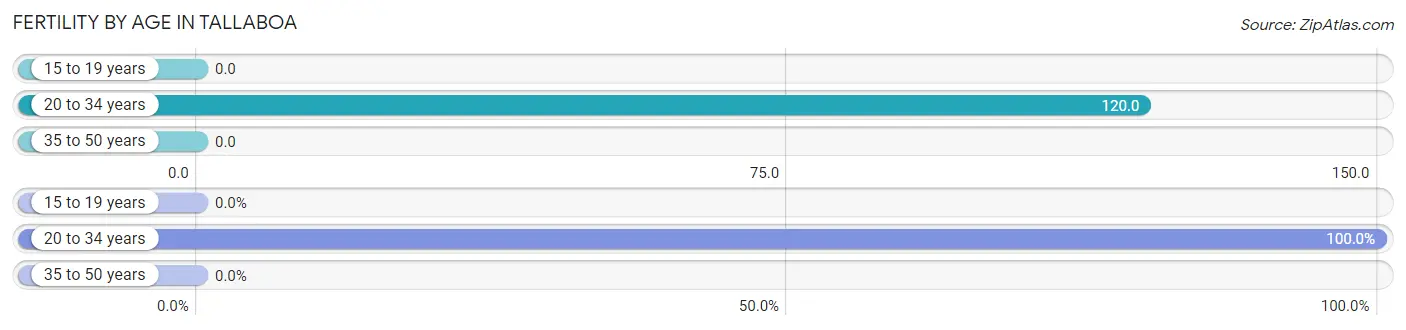
Fertility by Age in Tallaboa
Average fertility rate in Tallaboa is 34.0 births per 1,000 women. Women in the age bracket of 20 to 34 years have the highest fertility rate with 120.0 births per 1,000 women. Women in the age bracket of 20 to 34 years acount for 100.0% of all women with births.
| Age Bracket | Women with Births | Births / 1,000 Women |
| 15 to 19 years | 0 (0.0%) | 0.0 |
| 20 to 34 years | 9 (100.0%) | 120.0 |
| 35 to 50 years | 0 (0.0%) | 0.0 |
| Total | 9 (100.0%) | 34.0 |
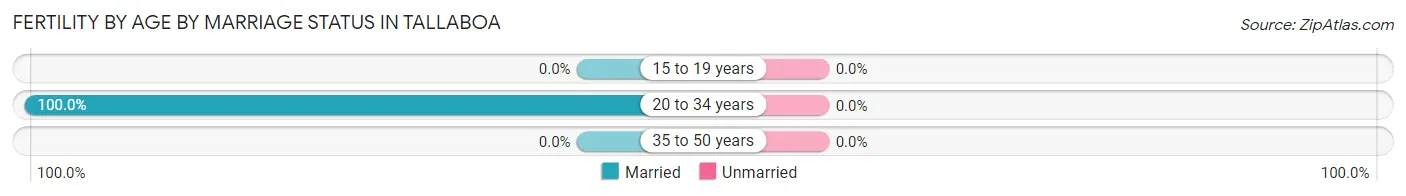
Fertility by Age by Marriage Status in Tallaboa
| Age Bracket | Married | Unmarried |
| 15 to 19 years | 0 (0.0%) | 0 (0.0%) |
| 20 to 34 years | 9 (100.0%) | 0 (0.0%) |
| 35 to 50 years | 0 (0.0%) | 0 (0.0%) |
| Total | 9 (100.0%) | 0 (0.0%) |
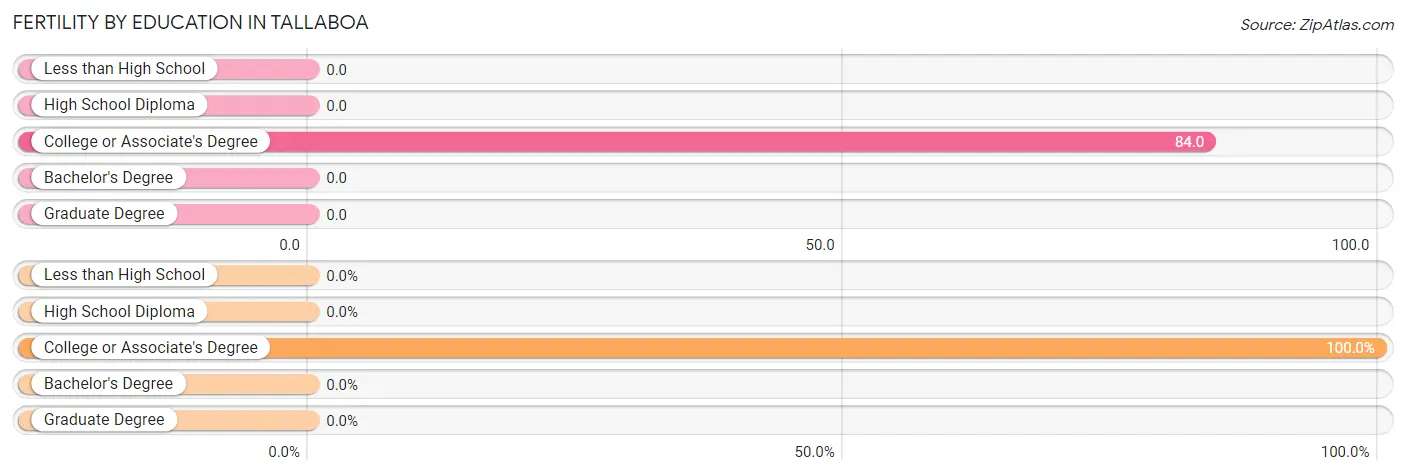
Fertility by Education in Tallaboa
| Educational Attainment | Women with Births | Births / 1,000 Women |
| Less than High School | 0 (0.0%) | 0.0 |
| High School Diploma | 0 (0.0%) | 0.0 |
| College or Associate's Degree | 9 (100.0%) | 84.0 |
| Bachelor's Degree | 0 (0.0%) | 0.0 |
| Graduate Degree | 0 (0.0%) | 0.0 |
| Total | 9 (100.0%) | 34.0 |
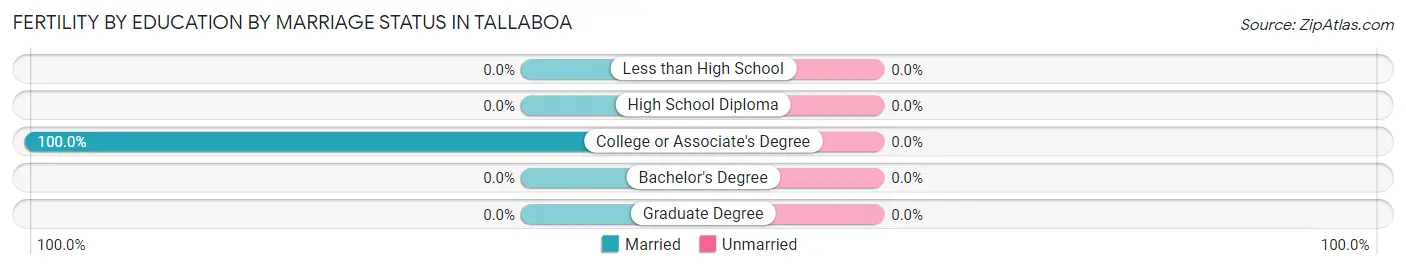
Fertility by Education by Marriage Status in Tallaboa
| Educational Attainment | Married | Unmarried |
| Less than High School | 0 (0.0%) | 0 (0.0%) |
| High School Diploma | 0 (0.0%) | 0 (0.0%) |
| College or Associate's Degree | 9 (100.0%) | 0 (0.0%) |
| Bachelor's Degree | 0 (0.0%) | 0 (0.0%) |
| Graduate Degree | 0 (0.0%) | 0 (0.0%) |
| Total | 9 (100.0%) | 0 (0.0%) |
Employment Characteristics in Tallaboa
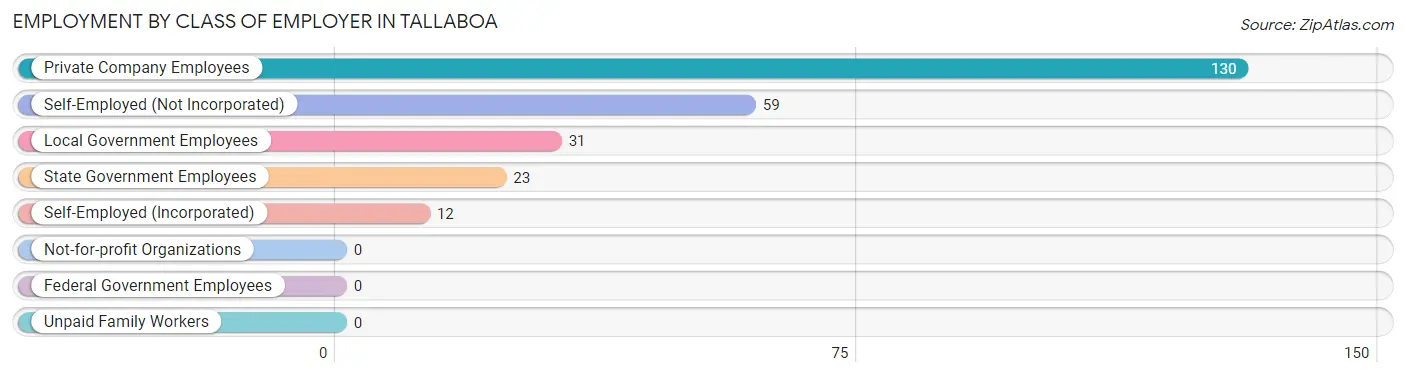
Employment by Class of Employer in Tallaboa
Among the 255 employed individuals in Tallaboa, private company employees (130 | 51.0%), self-employed (not incorporated) (59 | 23.1%), and local government employees (31 | 12.2%) make up the most common classes of employment.
| Employer Class | # Employees | % Employees |
| Private Company Employees | 130 | 51.0% |
| Self-Employed (Incorporated) | 12 | 4.7% |
| Self-Employed (Not Incorporated) | 59 | 23.1% |
| Not-for-profit Organizations | 0 | 0.0% |
| Local Government Employees | 31 | 12.2% |
| State Government Employees | 23 | 9.0% |
| Federal Government Employees | 0 | 0.0% |
| Unpaid Family Workers | 0 | 0.0% |
| Total | 255 | 100.0% |
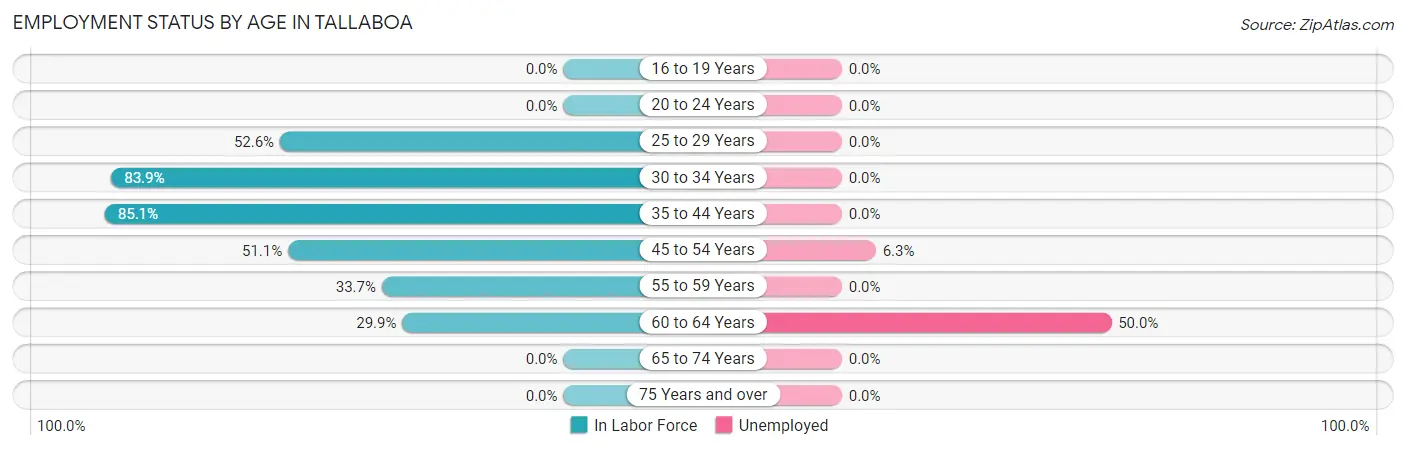
Employment Status by Age in Tallaboa
According to the labor force statistics for Tallaboa, out of the total population over 16 years of age (887), 30.6% or 271 individuals are in the labor force, with 5.9% or 16 of them unemployed. The age group with the highest labor force participation rate is 35 to 44 years, with 85.1% or 63 individuals in the labor force. Within the labor force, the 60 to 64 years age range has the highest percentage of unemployed individuals, with 50.0% or 10 of them being unemployed.
| Age Bracket | In Labor Force | Unemployed |
| 16 to 19 Years | 0 (0.0%) | 0 (0.0%) |
| 20 to 24 Years | 0 (0.0%) | 0 (0.0%) |
| 25 to 29 Years | 10 (52.6%) | 0 (0.0%) |
| 30 to 34 Years | 47 (83.9%) | 0 (0.0%) |
| 35 to 44 Years | 63 (85.1%) | 0 (0.0%) |
| 45 to 54 Years | 96 (51.1%) | 6 (6.3%) |
| 55 to 59 Years | 35 (33.7%) | 0 (0.0%) |
| 60 to 64 Years | 20 (29.9%) | 10 (50.0%) |
| 65 to 74 Years | 0 (0.0%) | 0 (0.0%) |
| 75 Years and over | 0 (0.0%) | 0 (0.0%) |
| Total | 271 (30.6%) | 16 (5.9%) |
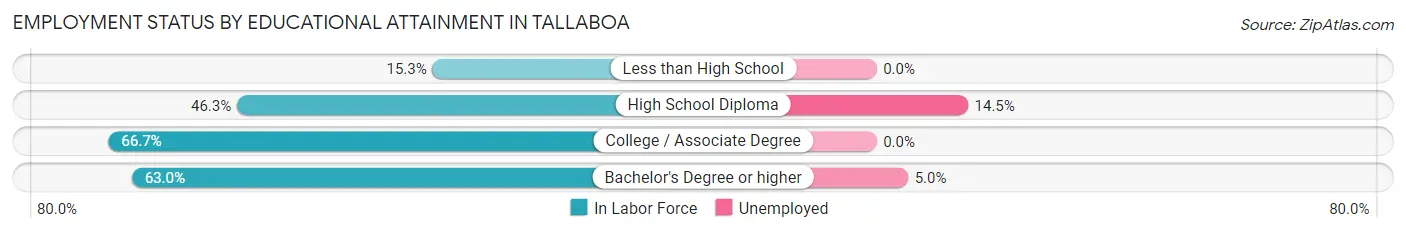
Employment Status by Educational Attainment in Tallaboa
According to labor force statistics for Tallaboa, 53.3% of individuals (271) out of the total population between 25 and 64 years of age (508) are in the labor force, with 5.9% or 16 of them being unemployed. The group with the highest labor force participation rate are those with the educational attainment of college / associate degree, with 66.7% or 72 individuals in the labor force. Within the labor force, individuals with high school diploma education have the highest percentage of unemployment, with 14.5% or 10 of them being unemployed.
| Educational Attainment | In Labor Force | Unemployed |
| Less than High School | 9 (15.3%) | 0 (0.0%) |
| High School Diploma | 69 (46.3%) | 22 (14.5%) |
| College / Associate Degree | 72 (66.7%) | 0 (0.0%) |
| Bachelor's Degree or higher | 121 (63.0%) | 10 (5.0%) |
| Total | 271 (53.3%) | 30 (5.9%) |
Employment Occupations by Sex in Tallaboa
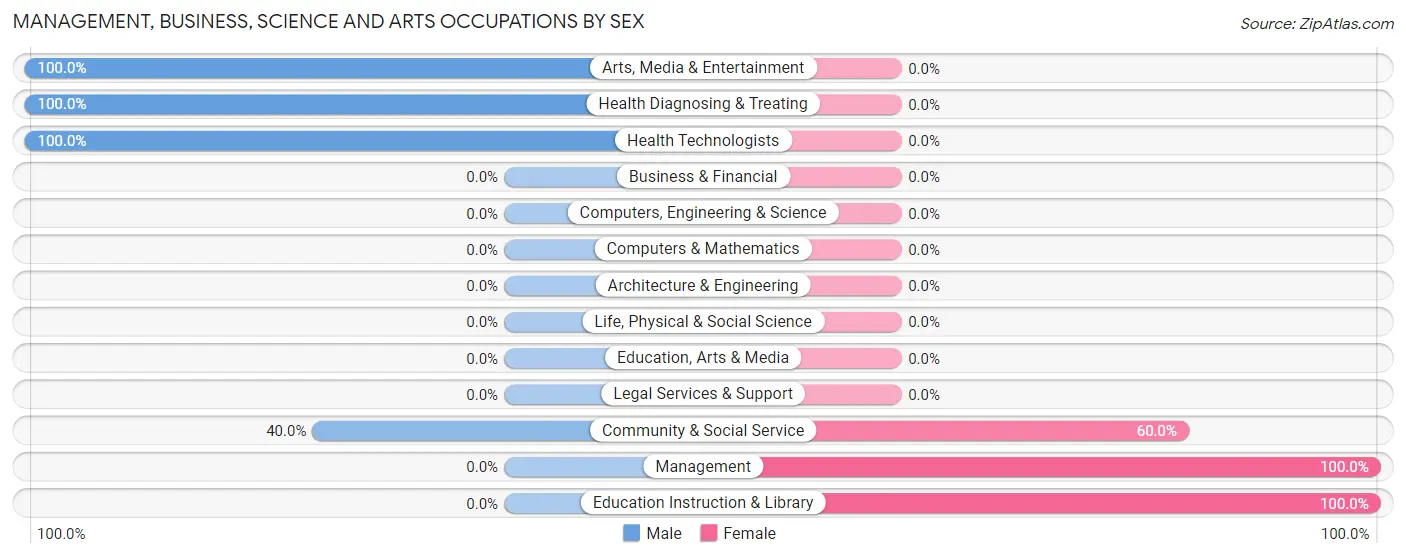
Management, Business, Science and Arts Occupations
The most common Management, Business, Science and Arts occupations in Tallaboa are Community & Social Service (25 | 9.8%), Health Diagnosing & Treating (23 | 9.0%), Health Technologists (23 | 9.0%), Education Instruction & Library (15 | 5.9%), and Management (13 | 5.1%).
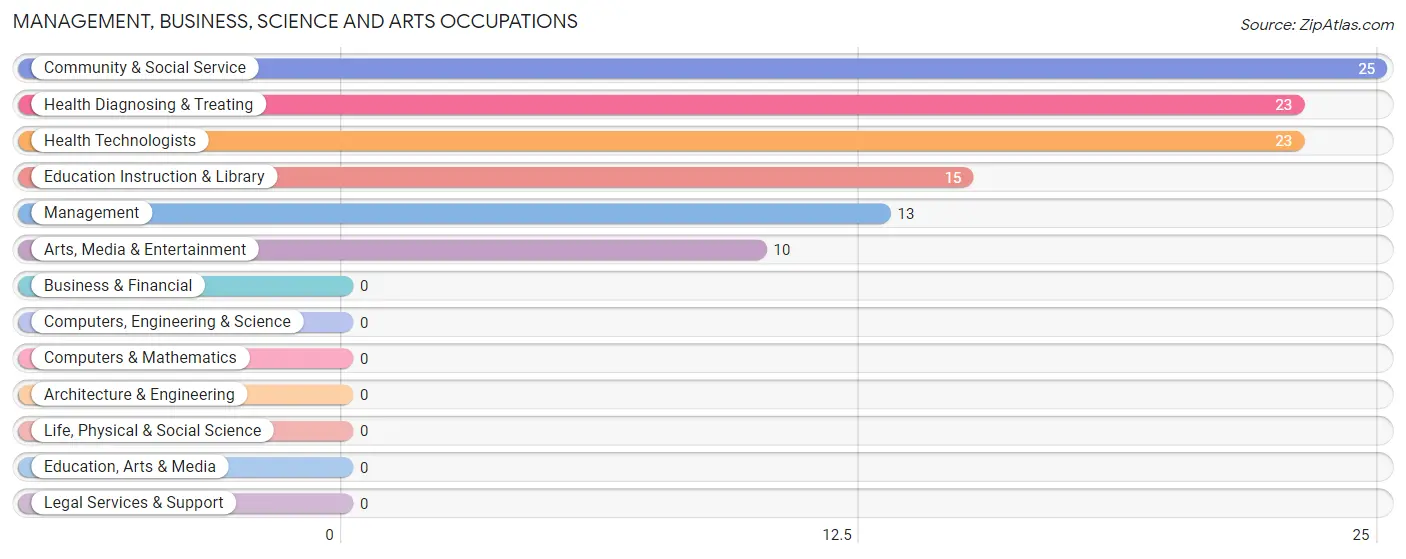
Management, Business, Science and Arts Occupations by Sex
Within the Management, Business, Science and Arts occupations in Tallaboa, the most male-oriented occupations are Arts, Media & Entertainment (100.0%), Health Diagnosing & Treating (100.0%), and Health Technologists (100.0%), while the most female-oriented occupations are Management (100.0%), Education Instruction & Library (100.0%), and Community & Social Service (60.0%).
| Occupation | Male | Female |
| Management | 0 (0.0%) | 13 (100.0%) |
| Business & Financial | 0 (0.0%) | 0 (0.0%) |
| Computers, Engineering & Science | 0 (0.0%) | 0 (0.0%) |
| Computers & Mathematics | 0 (0.0%) | 0 (0.0%) |
| Architecture & Engineering | 0 (0.0%) | 0 (0.0%) |
| Life, Physical & Social Science | 0 (0.0%) | 0 (0.0%) |
| Community & Social Service | 10 (40.0%) | 15 (60.0%) |
| Education, Arts & Media | 0 (0.0%) | 0 (0.0%) |
| Legal Services & Support | 0 (0.0%) | 0 (0.0%) |
| Education Instruction & Library | 0 (0.0%) | 15 (100.0%) |
| Arts, Media & Entertainment | 10 (100.0%) | 0 (0.0%) |
| Health Diagnosing & Treating | 23 (100.0%) | 0 (0.0%) |
| Health Technologists | 23 (100.0%) | 0 (0.0%) |
| Total (Category) | 33 (54.1%) | 28 (45.9%) |
| Total (Overall) | 152 (59.6%) | 103 (40.4%) |
Services Occupations
The most common Services occupations in Tallaboa are , and Healthcare Support (8 | 3.1%).
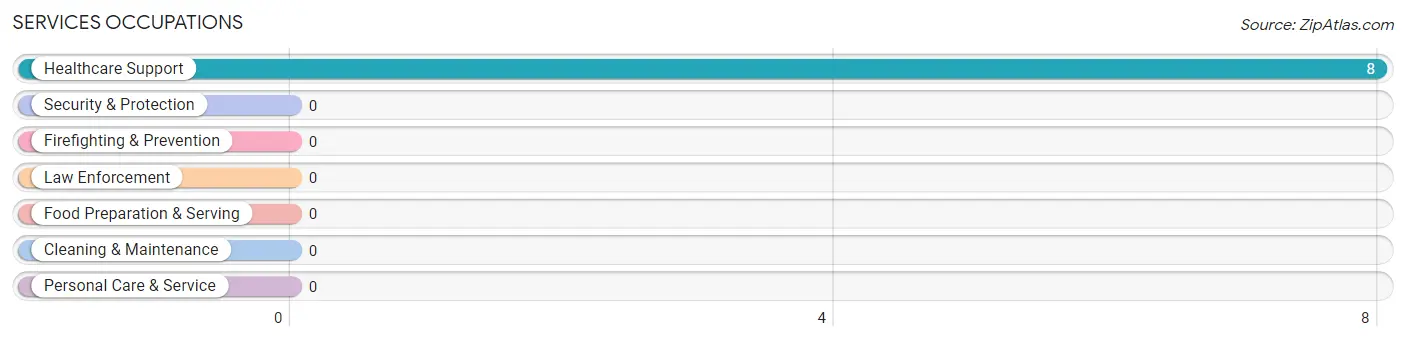
Services Occupations by Sex
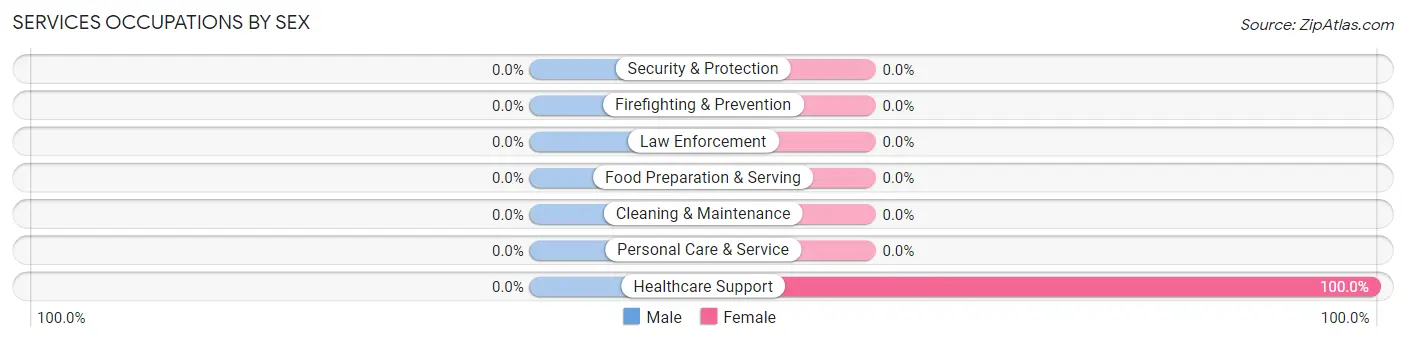
| Occupation | Male | Female |
| Healthcare Support | 0 (0.0%) | 8 (100.0%) |
| Security & Protection | 0 (0.0%) | 0 (0.0%) |
| Firefighting & Prevention | 0 (0.0%) | 0 (0.0%) |
| Law Enforcement | 0 (0.0%) | 0 (0.0%) |
| Food Preparation & Serving | 0 (0.0%) | 0 (0.0%) |
| Cleaning & Maintenance | 0 (0.0%) | 0 (0.0%) |
| Personal Care & Service | 0 (0.0%) | 0 (0.0%) |
| Total (Category) | 0 (0.0%) | 8 (100.0%) |
| Total (Overall) | 152 (59.6%) | 103 (40.4%) |
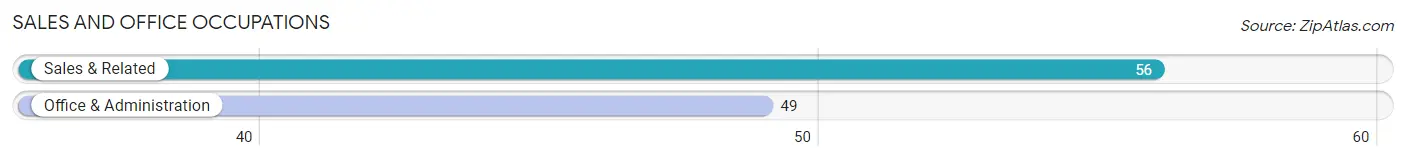
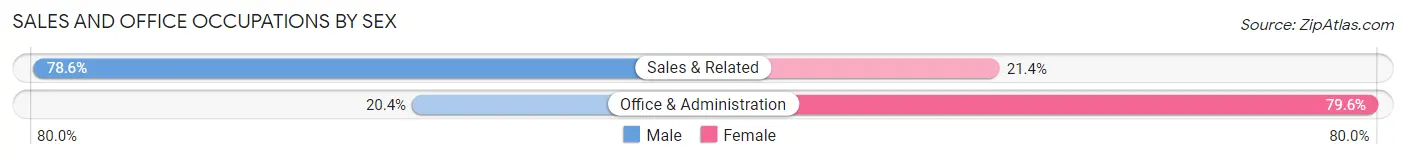
Sales and Office Occupations
The most common Sales and Office occupations in Tallaboa are Sales & Related (56 | 22.0%), and Office & Administration (49 | 19.2%).
Sales and Office Occupations by Sex
| Occupation | Male | Female |
| Sales & Related | 44 (78.6%) | 12 (21.4%) |
| Office & Administration | 10 (20.4%) | 39 (79.6%) |
| Total (Category) | 54 (51.4%) | 51 (48.6%) |
| Total (Overall) | 152 (59.6%) | 103 (40.4%) |
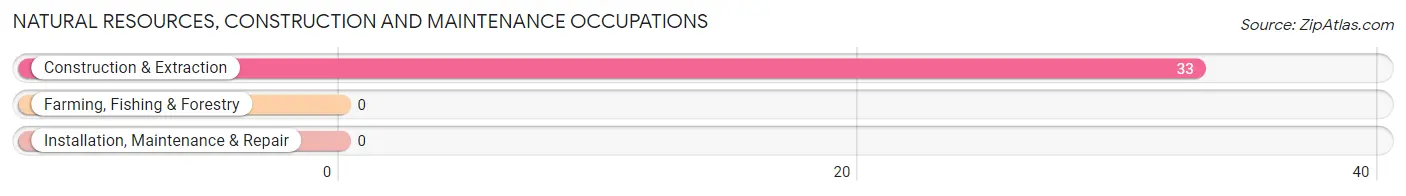
Natural Resources, Construction and Maintenance Occupations
The most common Natural Resources, Construction and Maintenance occupations in Tallaboa are , and Construction & Extraction (33 | 12.9%).
Natural Resources, Construction and Maintenance Occupations by Sex
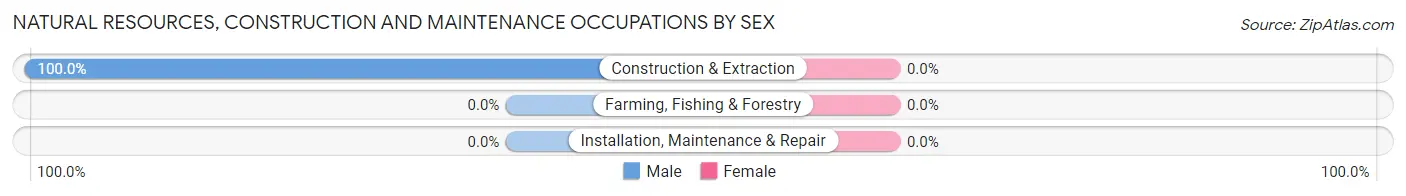
| Occupation | Male | Female |
| Farming, Fishing & Forestry | 0 (0.0%) | 0 (0.0%) |
| Construction & Extraction | 33 (100.0%) | 0 (0.0%) |
| Installation, Maintenance & Repair | 0 (0.0%) | 0 (0.0%) |
| Total (Category) | 33 (100.0%) | 0 (0.0%) |
| Total (Overall) | 152 (59.6%) | 103 (40.4%) |
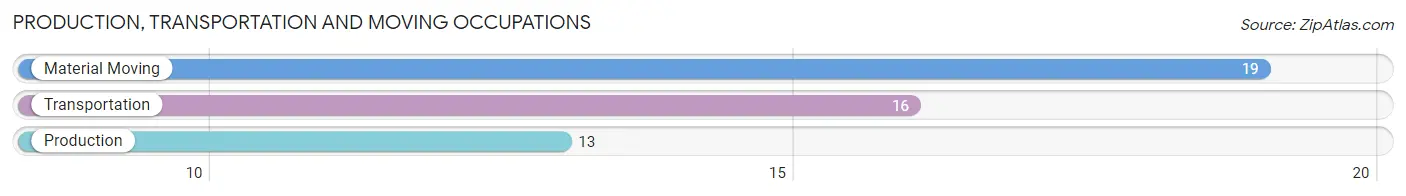
Production, Transportation and Moving Occupations
The most common Production, Transportation and Moving occupations in Tallaboa are Material Moving (19 | 7.4%), Transportation (16 | 6.3%), and Production (13 | 5.1%).
Production, Transportation and Moving Occupations by Sex
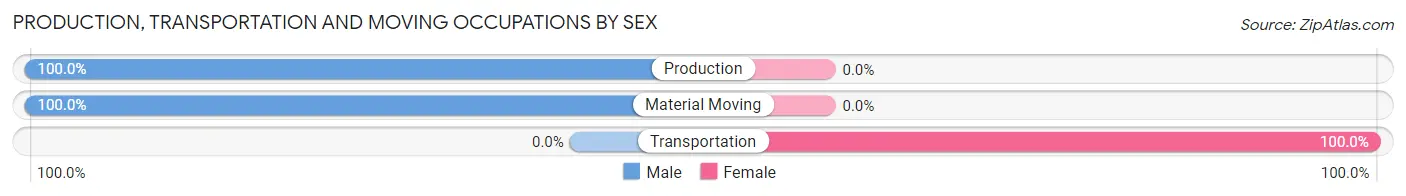
| Occupation | Male | Female |
| Production | 13 (100.0%) | 0 (0.0%) |
| Transportation | 0 (0.0%) | 16 (100.0%) |
| Material Moving | 19 (100.0%) | 0 (0.0%) |
| Total (Category) | 32 (66.7%) | 16 (33.3%) |
| Total (Overall) | 152 (59.6%) | 103 (40.4%) |
Employment Industries by Sex in Tallaboa
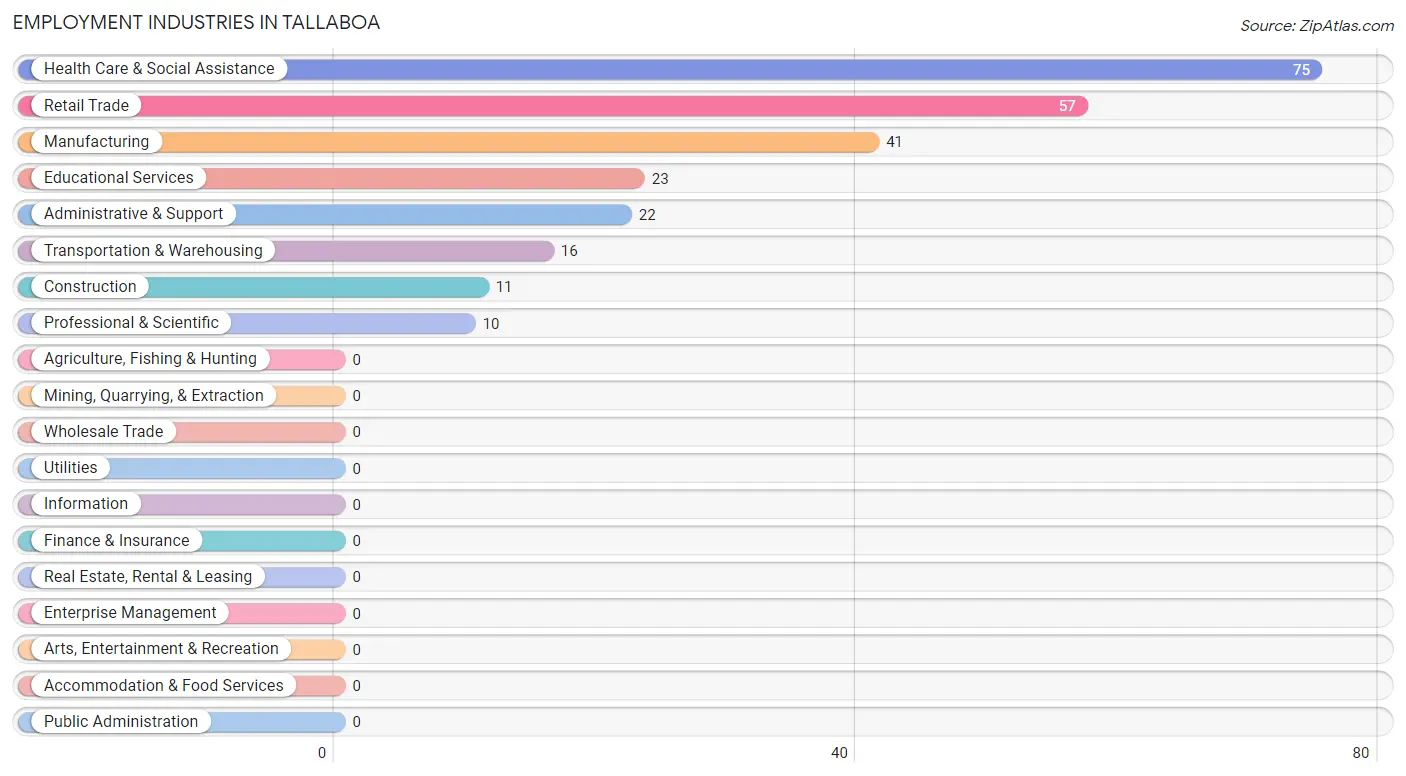
Employment Industries in Tallaboa
The major employment industries in Tallaboa include Health Care & Social Assistance (75 | 29.4%), Retail Trade (57 | 22.4%), Manufacturing (41 | 16.1%), Educational Services (23 | 9.0%), and Administrative & Support (22 | 8.6%).
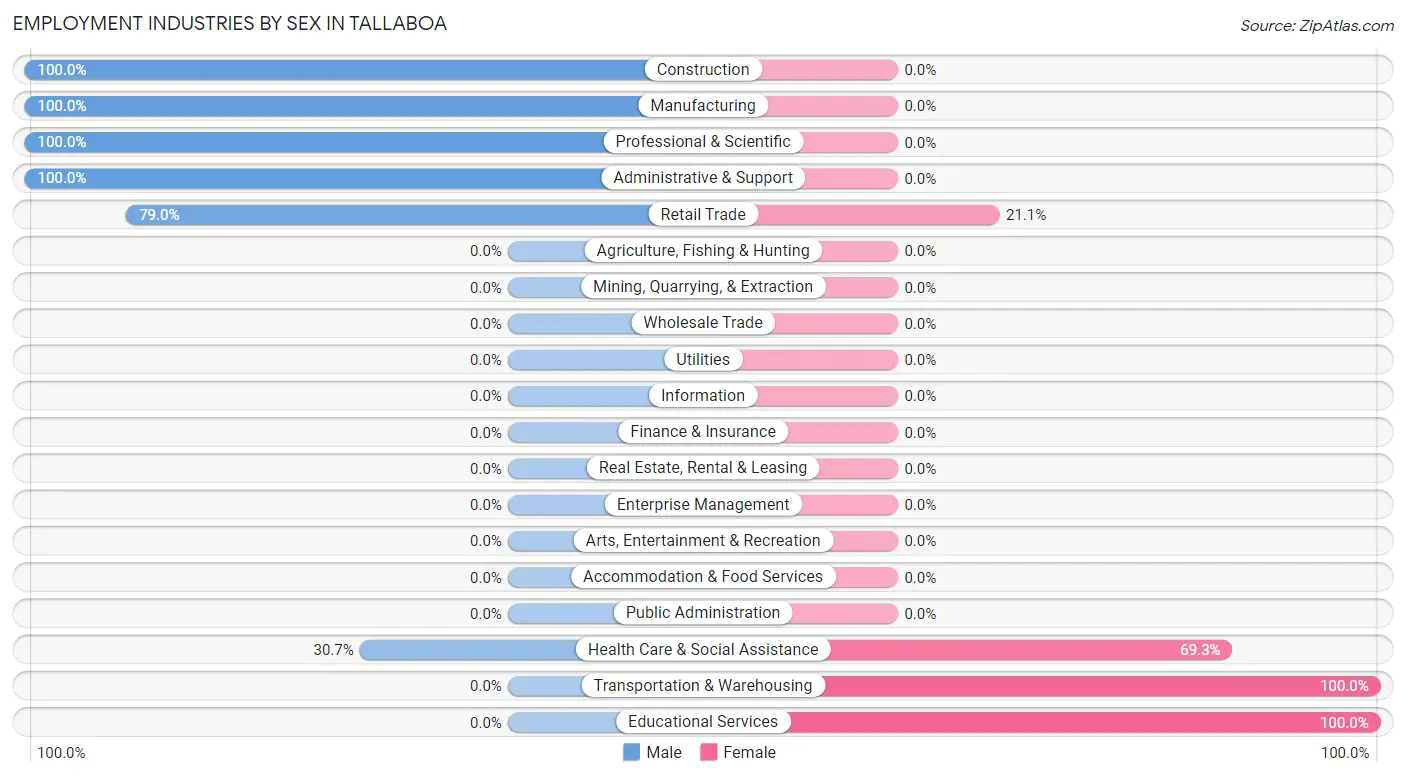
Employment Industries by Sex in Tallaboa
The Tallaboa industries that see more men than women are Construction (100.0%), Manufacturing (100.0%), and Professional & Scientific (100.0%), whereas the industries that tend to have a higher number of women are Transportation & Warehousing (100.0%), Educational Services (100.0%), and Health Care & Social Assistance (69.3%).
| Industry | Male | Female |
| Agriculture, Fishing & Hunting | 0 (0.0%) | 0 (0.0%) |
| Mining, Quarrying, & Extraction | 0 (0.0%) | 0 (0.0%) |
| Construction | 11 (100.0%) | 0 (0.0%) |
| Manufacturing | 41 (100.0%) | 0 (0.0%) |
| Wholesale Trade | 0 (0.0%) | 0 (0.0%) |
| Retail Trade | 45 (78.9%) | 12 (21.0%) |
| Transportation & Warehousing | 0 (0.0%) | 16 (100.0%) |
| Utilities | 0 (0.0%) | 0 (0.0%) |
| Information | 0 (0.0%) | 0 (0.0%) |
| Finance & Insurance | 0 (0.0%) | 0 (0.0%) |
| Real Estate, Rental & Leasing | 0 (0.0%) | 0 (0.0%) |
| Professional & Scientific | 10 (100.0%) | 0 (0.0%) |
| Enterprise Management | 0 (0.0%) | 0 (0.0%) |
| Administrative & Support | 22 (100.0%) | 0 (0.0%) |
| Educational Services | 0 (0.0%) | 23 (100.0%) |
| Health Care & Social Assistance | 23 (30.7%) | 52 (69.3%) |
| Arts, Entertainment & Recreation | 0 (0.0%) | 0 (0.0%) |
| Accommodation & Food Services | 0 (0.0%) | 0 (0.0%) |
| Public Administration | 0 (0.0%) | 0 (0.0%) |
| Total | 152 (59.6%) | 103 (40.4%) |
Education in Tallaboa
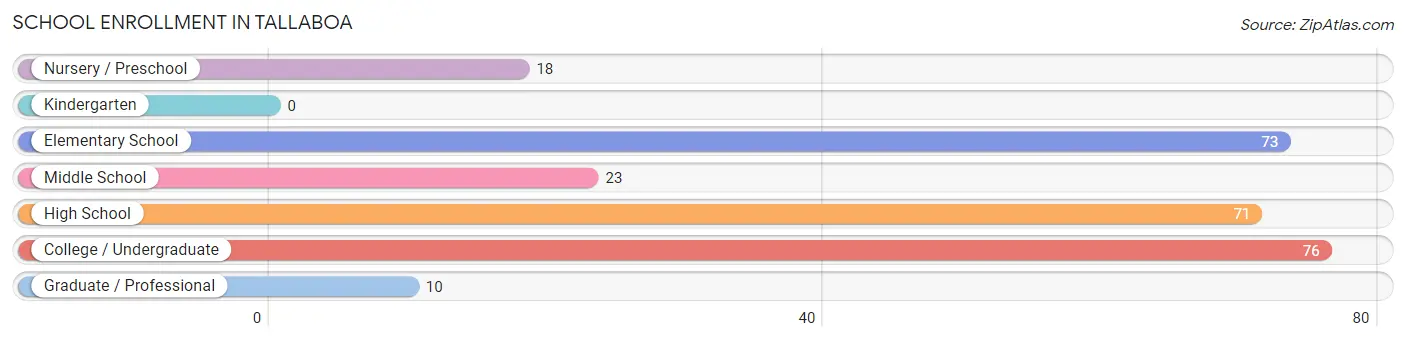
School Enrollment in Tallaboa
The most common levels of schooling among the 271 students in Tallaboa are college / undergraduate (76 | 28.0%), elementary school (73 | 26.9%), and high school (71 | 26.2%).
| School Level | # Students | % Students |
| Nursery / Preschool | 18 | 6.6% |
| Kindergarten | 0 | 0.0% |
| Elementary School | 73 | 26.9% |
| Middle School | 23 | 8.5% |
| High School | 71 | 26.2% |
| College / Undergraduate | 76 | 28.0% |
| Graduate / Professional | 10 | 3.7% |
| Total | 271 | 100.0% |
School Enrollment by Age by Funding Source in Tallaboa
Out of a total of 271 students who are enrolled in schools in Tallaboa, 148 (54.6%) attend a private institution, while the remaining 123 (45.4%) are enrolled in public schools. The age group of 3 to 4 year olds has the highest likelihood of being enrolled in private schools, with 18 (100.0% in the age bracket) enrolled. Conversely, the age group of 10 to 14 year olds has the lowest likelihood of being enrolled in a private school, with 23 (100.0% in the age bracket) attending a public institution.
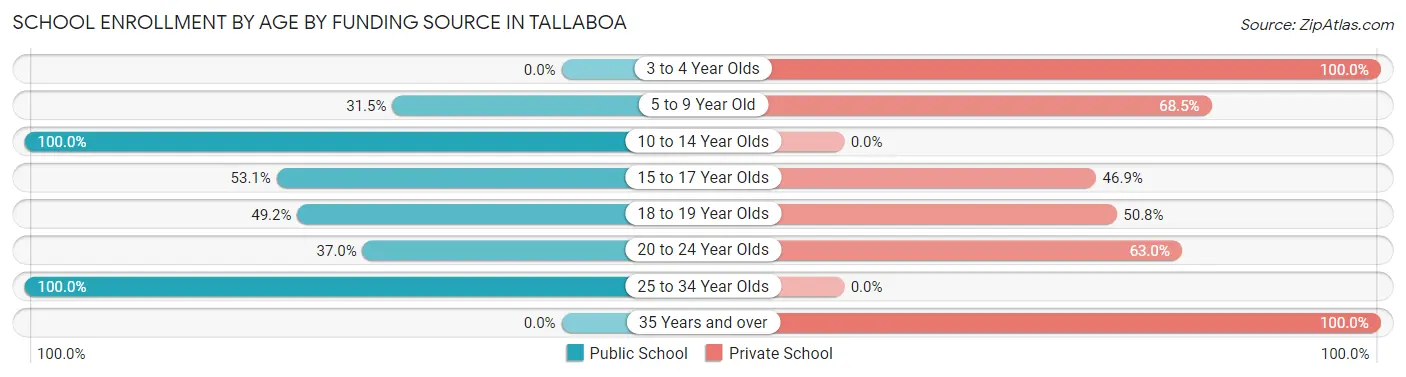
| Age Bracket | Public School | Private School |
| 3 to 4 Year Olds | 0 (0.0%) | 18 (100.0%) |
| 5 to 9 Year Old | 23 (31.5%) | 50 (68.5%) |
| 10 to 14 Year Olds | 23 (100.0%) | 0 (0.0%) |
| 15 to 17 Year Olds | 26 (53.1%) | 23 (46.9%) |
| 18 to 19 Year Olds | 31 (49.2%) | 32 (50.8%) |
| 20 to 24 Year Olds | 10 (37.0%) | 17 (63.0%) |
| 25 to 34 Year Olds | 10 (100.0%) | 0 (0.0%) |
| 35 Years and over | 0 (0.0%) | 8 (100.0%) |
| Total | 123 (45.4%) | 148 (54.6%) |
Educational Attainment by Field of Study in Tallaboa
Education (56 | 25.5%), business (52 | 23.6%), science & technology (33 | 15.0%), bio, nature & agricultural (32 | 14.5%), and psychology (18 | 8.2%) are the most common fields of study among 220 individuals in Tallaboa who have obtained a bachelor's degree or higher.
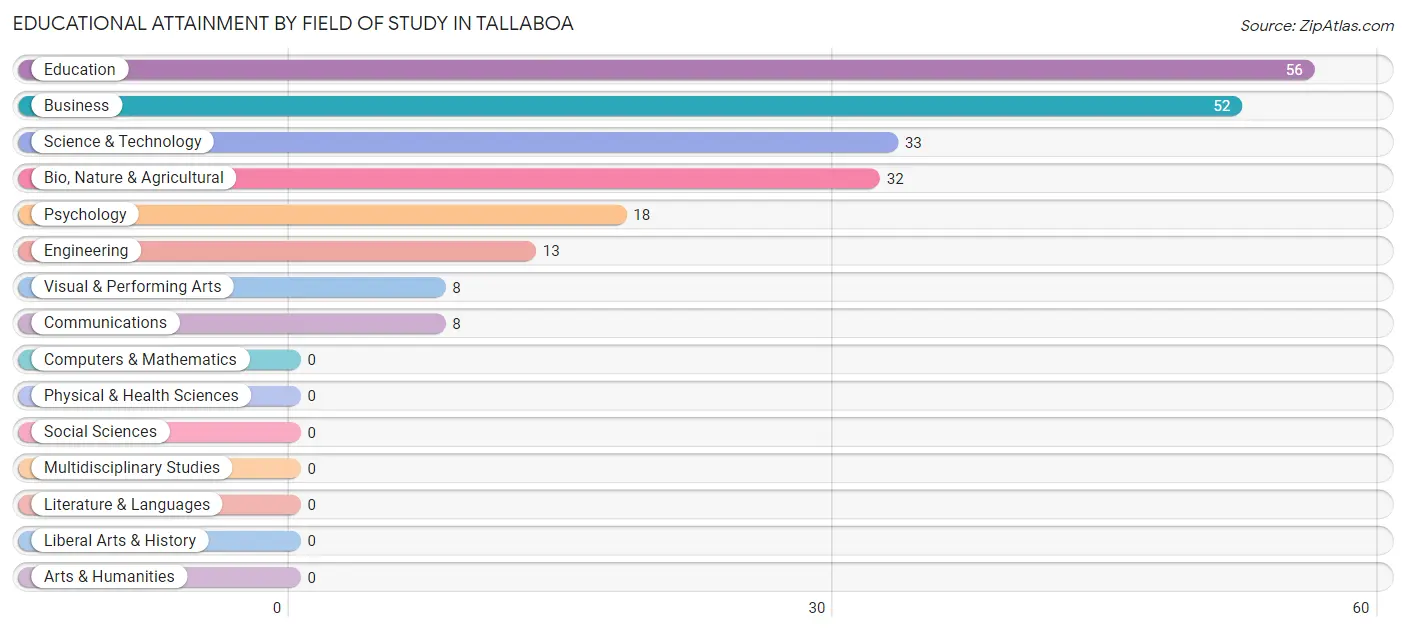
| Field of Study | # Graduates | % Graduates |
| Computers & Mathematics | 0 | 0.0% |
| Bio, Nature & Agricultural | 32 | 14.5% |
| Physical & Health Sciences | 0 | 0.0% |
| Psychology | 18 | 8.2% |
| Social Sciences | 0 | 0.0% |
| Engineering | 13 | 5.9% |
| Multidisciplinary Studies | 0 | 0.0% |
| Science & Technology | 33 | 15.0% |
| Business | 52 | 23.6% |
| Education | 56 | 25.5% |
| Literature & Languages | 0 | 0.0% |
| Liberal Arts & History | 0 | 0.0% |
| Visual & Performing Arts | 8 | 3.6% |
| Communications | 8 | 3.6% |
| Arts & Humanities | 0 | 0.0% |
| Total | 220 | 100.0% |
Transportation & Commute in Tallaboa
Vehicle Availability by Sex in Tallaboa
The most prevalent vehicle ownership categories in Tallaboa are males with 2 vehicles (80, accounting for 52.6%) and females with 2 vehicles (88, making up 77.7%).
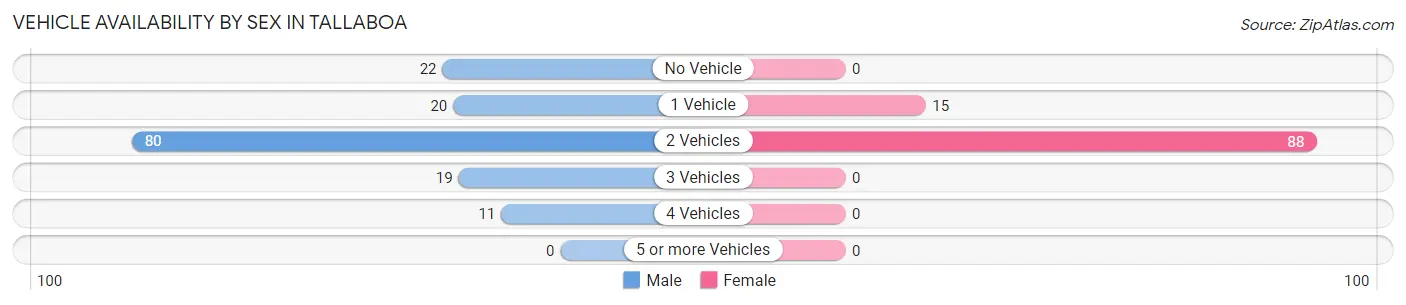
| Vehicles Available | Male | Female |
| No Vehicle | 22 (14.5%) | 0 (0.0%) |
| 1 Vehicle | 20 (13.2%) | 15 (14.6%) |
| 2 Vehicles | 80 (52.6%) | 88 (85.4%) |
| 3 Vehicles | 19 (12.5%) | 0 (0.0%) |
| 4 Vehicles | 11 (7.2%) | 0 (0.0%) |
| 5 or more Vehicles | 0 (0.0%) | 0 (0.0%) |
| Total | 152 (100.0%) | 103 (100.0%) |
Commute Time in Tallaboa
The most frequently occuring commute durations in Tallaboa are 15 to 19 minutes (93 commuters, 36.5%), 10 to 14 minutes (39 commuters, 15.3%), and 25 to 29 minutes (36 commuters, 14.1%).
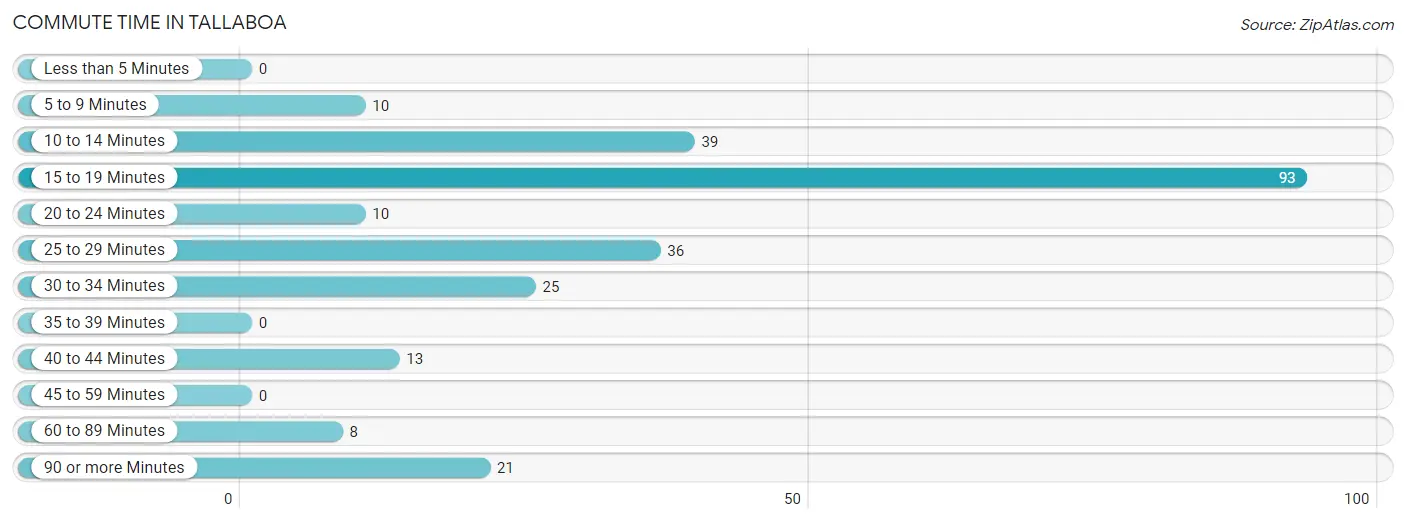
| Commute Time | # Commuters | % Commuters |
| Less than 5 Minutes | 0 | 0.0% |
| 5 to 9 Minutes | 10 | 3.9% |
| 10 to 14 Minutes | 39 | 15.3% |
| 15 to 19 Minutes | 93 | 36.5% |
| 20 to 24 Minutes | 10 | 3.9% |
| 25 to 29 Minutes | 36 | 14.1% |
| 30 to 34 Minutes | 25 | 9.8% |
| 35 to 39 Minutes | 0 | 0.0% |
| 40 to 44 Minutes | 13 | 5.1% |
| 45 to 59 Minutes | 0 | 0.0% |
| 60 to 89 Minutes | 8 | 3.1% |
| 90 or more Minutes | 21 | 8.2% |
Commute Time by Sex in Tallaboa
The most common commute times in Tallaboa are 15 to 19 minutes (66 commuters, 43.4%) for males and 10 to 14 minutes (39 commuters, 37.9%) for females.
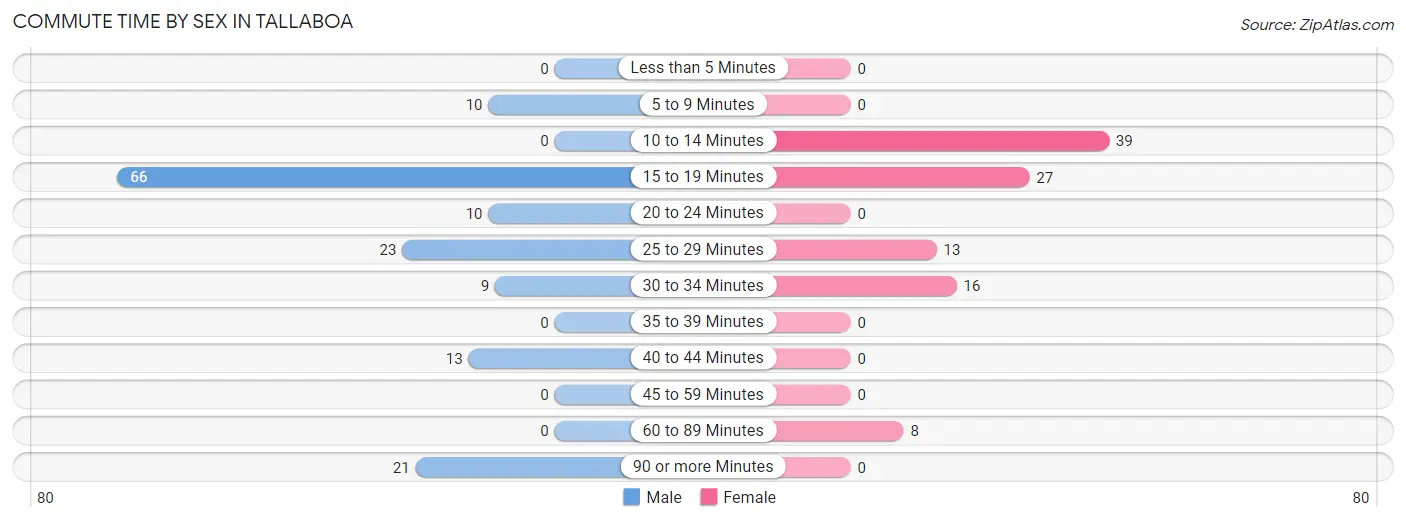
| Commute Time | Male | Female |
| Less than 5 Minutes | 0 (0.0%) | 0 (0.0%) |
| 5 to 9 Minutes | 10 (6.6%) | 0 (0.0%) |
| 10 to 14 Minutes | 0 (0.0%) | 39 (37.9%) |
| 15 to 19 Minutes | 66 (43.4%) | 27 (26.2%) |
| 20 to 24 Minutes | 10 (6.6%) | 0 (0.0%) |
| 25 to 29 Minutes | 23 (15.1%) | 13 (12.6%) |
| 30 to 34 Minutes | 9 (5.9%) | 16 (15.5%) |
| 35 to 39 Minutes | 0 (0.0%) | 0 (0.0%) |
| 40 to 44 Minutes | 13 (8.6%) | 0 (0.0%) |
| 45 to 59 Minutes | 0 (0.0%) | 0 (0.0%) |
| 60 to 89 Minutes | 0 (0.0%) | 8 (7.8%) |
| 90 or more Minutes | 21 (13.8%) | 0 (0.0%) |
Time of Departure to Work by Sex in Tallaboa
The most frequent times of departure to work in Tallaboa are 7:30 AM to 7:59 AM (63, 41.4%) for males and 7:00 AM to 7:29 AM (47, 45.6%) for females.
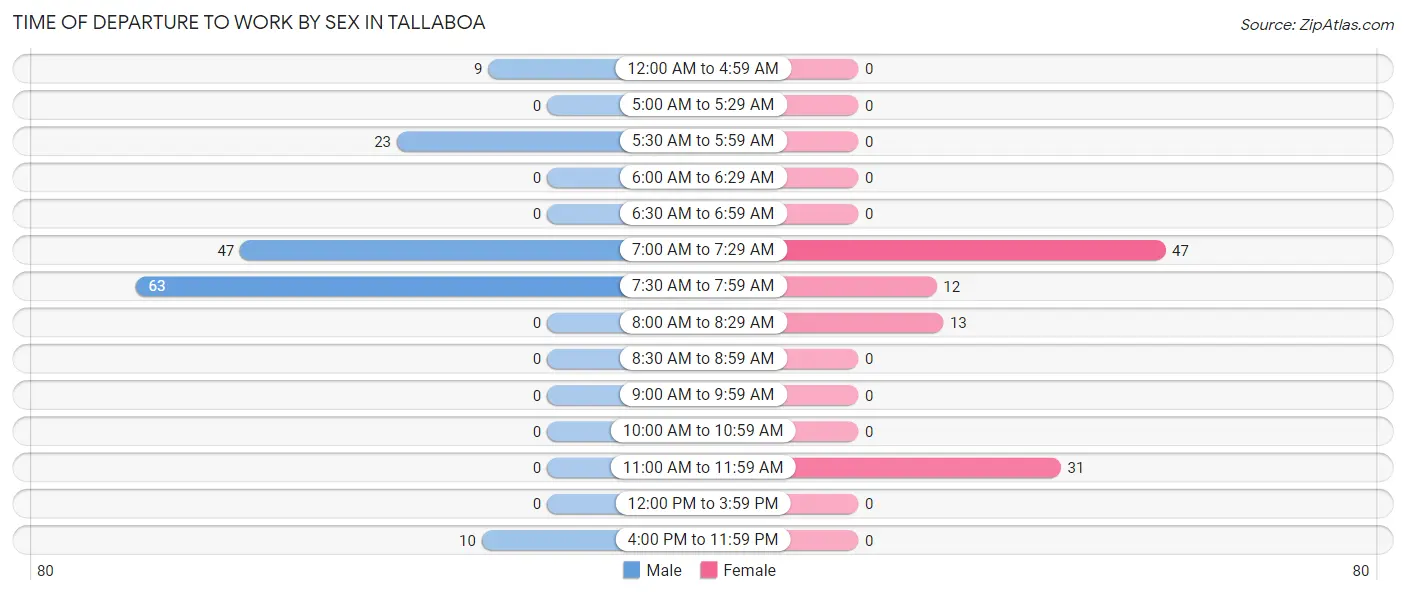
| Time of Departure | Male | Female |
| 12:00 AM to 4:59 AM | 9 (5.9%) | 0 (0.0%) |
| 5:00 AM to 5:29 AM | 0 (0.0%) | 0 (0.0%) |
| 5:30 AM to 5:59 AM | 23 (15.1%) | 0 (0.0%) |
| 6:00 AM to 6:29 AM | 0 (0.0%) | 0 (0.0%) |
| 6:30 AM to 6:59 AM | 0 (0.0%) | 0 (0.0%) |
| 7:00 AM to 7:29 AM | 47 (30.9%) | 47 (45.6%) |
| 7:30 AM to 7:59 AM | 63 (41.4%) | 12 (11.7%) |
| 8:00 AM to 8:29 AM | 0 (0.0%) | 13 (12.6%) |
| 8:30 AM to 8:59 AM | 0 (0.0%) | 0 (0.0%) |
| 9:00 AM to 9:59 AM | 0 (0.0%) | 0 (0.0%) |
| 10:00 AM to 10:59 AM | 0 (0.0%) | 0 (0.0%) |
| 11:00 AM to 11:59 AM | 0 (0.0%) | 31 (30.1%) |
| 12:00 PM to 3:59 PM | 0 (0.0%) | 0 (0.0%) |
| 4:00 PM to 11:59 PM | 10 (6.6%) | 0 (0.0%) |
| Total | 152 (100.0%) | 103 (100.0%) |
Housing Occupancy in Tallaboa
Occupancy by Ownership in Tallaboa
Of the total 326 dwellings in Tallaboa, owner-occupied units account for 253 (77.6%), while renter-occupied units make up 73 (22.4%).
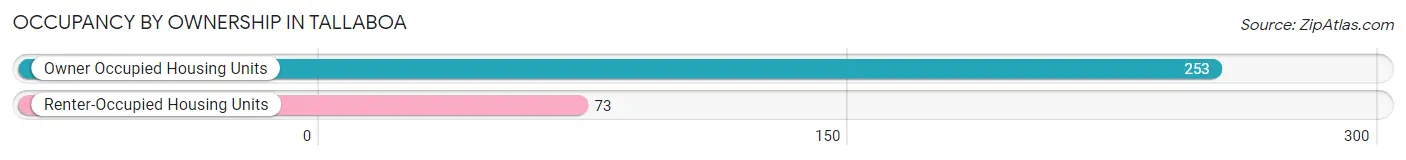
| Occupancy | # Housing Units | % Housing Units |
| Owner Occupied Housing Units | 253 | 77.6% |
| Renter-Occupied Housing Units | 73 | 22.4% |
| Total Occupied Housing Units | 326 | 100.0% |
Occupancy by Household Size in Tallaboa
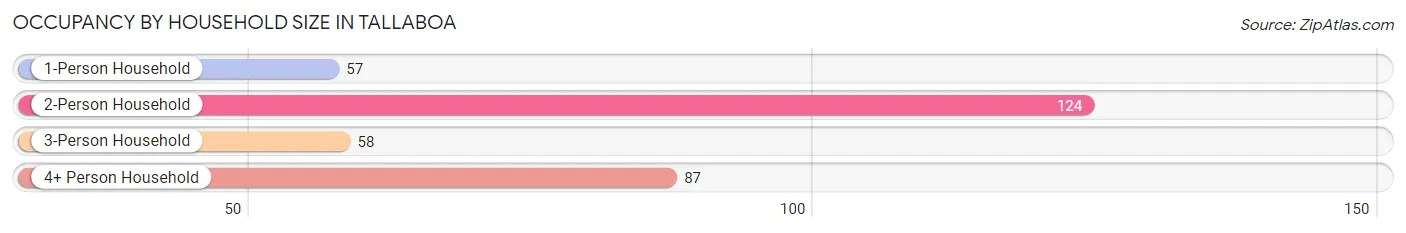
| Household Size | # Housing Units | % Housing Units |
| 1-Person Household | 57 | 17.5% |
| 2-Person Household | 124 | 38.0% |
| 3-Person Household | 58 | 17.8% |
| 4+ Person Household | 87 | 26.7% |
| Total Housing Units | 326 | 100.0% |
Occupancy by Ownership by Household Size in Tallaboa
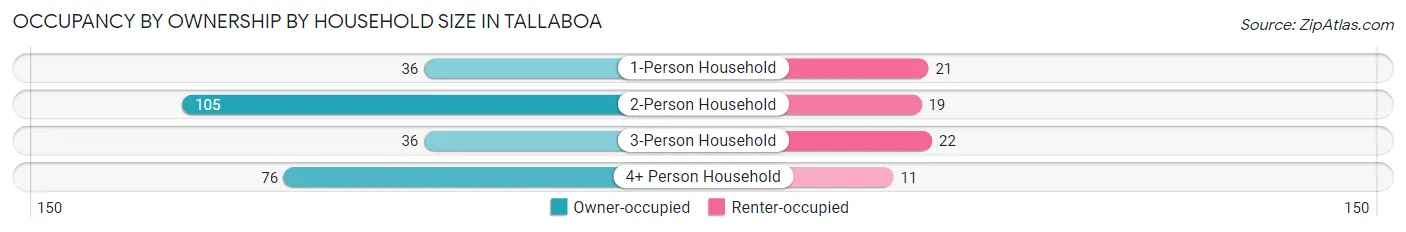
| Household Size | Owner-occupied | Renter-occupied |
| 1-Person Household | 36 (63.2%) | 21 (36.8%) |
| 2-Person Household | 105 (84.7%) | 19 (15.3%) |
| 3-Person Household | 36 (62.1%) | 22 (37.9%) |
| 4+ Person Household | 76 (87.4%) | 11 (12.6%) |
| Total Housing Units | 253 (77.6%) | 73 (22.4%) |
Occupancy by Educational Attainment in Tallaboa
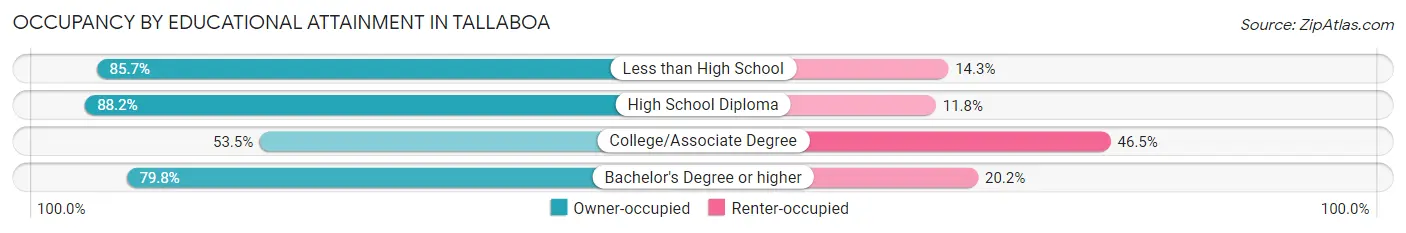
| Household Size | Owner-occupied | Renter-occupied |
| Less than High School | 54 (85.7%) | 9 (14.3%) |
| High School Diploma | 82 (88.2%) | 11 (11.8%) |
| College/Associate Degree | 38 (53.5%) | 33 (46.5%) |
| Bachelor's Degree or higher | 79 (79.8%) | 20 (20.2%) |
Occupancy by Age of Householder in Tallaboa
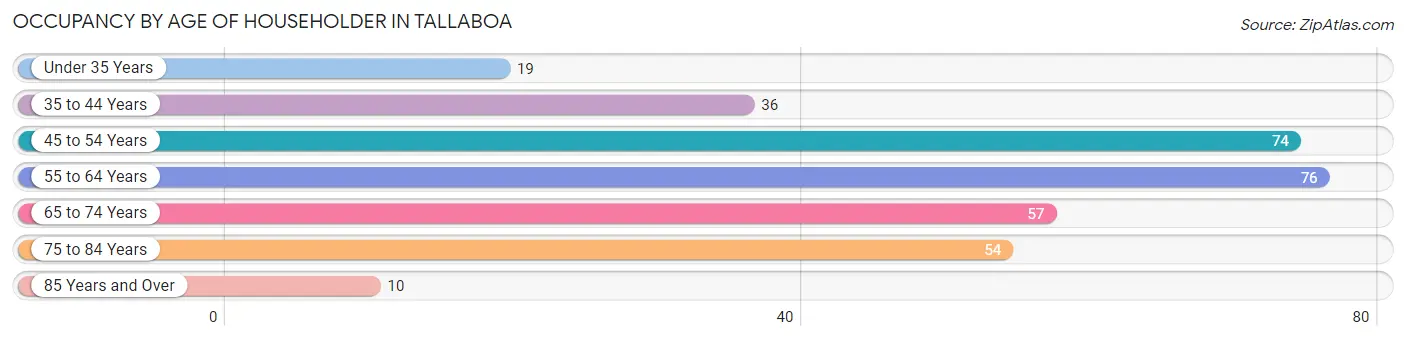
| Age Bracket | # Households | % Households |
| Under 35 Years | 19 | 5.8% |
| 35 to 44 Years | 36 | 11.0% |
| 45 to 54 Years | 74 | 22.7% |
| 55 to 64 Years | 76 | 23.3% |
| 65 to 74 Years | 57 | 17.5% |
| 75 to 84 Years | 54 | 16.6% |
| 85 Years and Over | 10 | 3.1% |
| Total | 326 | 100.0% |
Housing Finances in Tallaboa
Median Income by Occupancy in Tallaboa
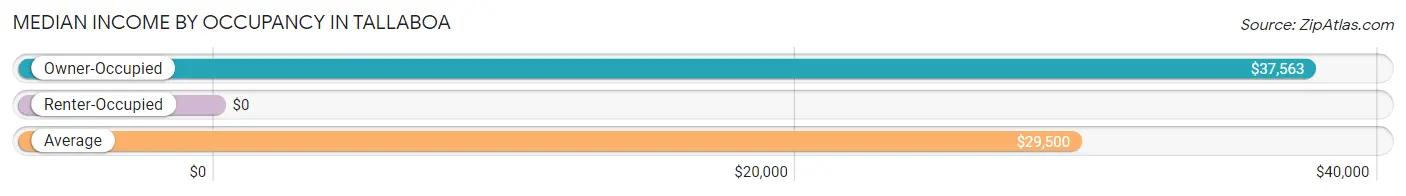
| Occupancy Type | # Households | Median Income |
| Owner-Occupied | 253 (77.6%) | $37,563 |
| Renter-Occupied | 73 (22.4%) | $0 |
| Average | 326 (100.0%) | $29,500 |
Occupancy by Householder Income Bracket in Tallaboa
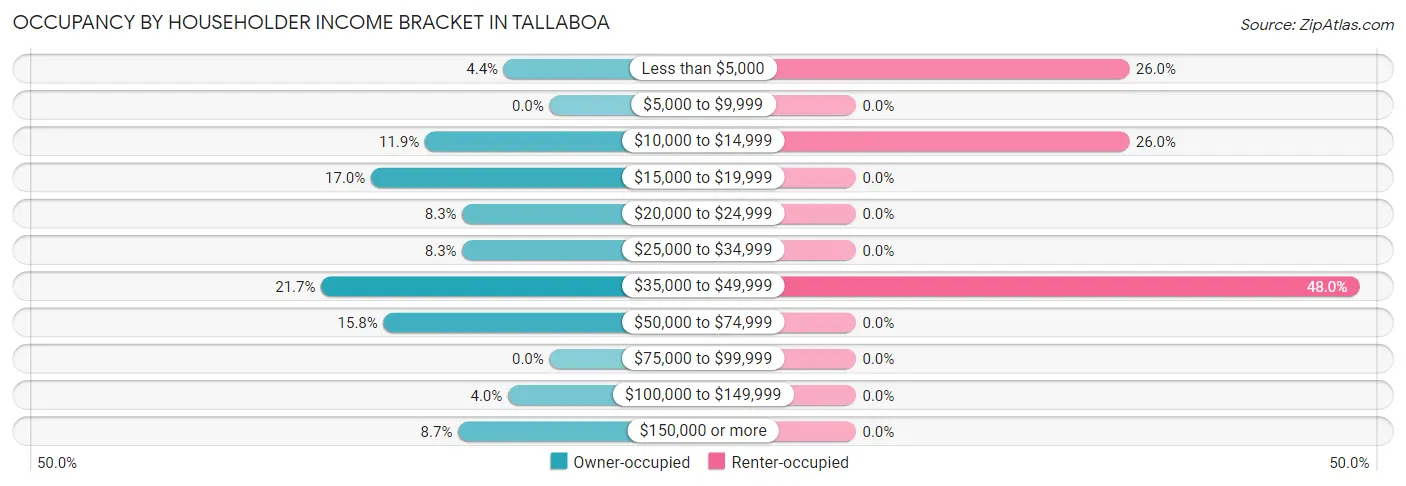
| Income Bracket | Owner-occupied | Renter-occupied |
| Less than $5,000 | 11 (4.3%) | 19 (26.0%) |
| $5,000 to $9,999 | 0 (0.0%) | 0 (0.0%) |
| $10,000 to $14,999 | 30 (11.9%) | 19 (26.0%) |
| $15,000 to $19,999 | 43 (17.0%) | 0 (0.0%) |
| $20,000 to $24,999 | 21 (8.3%) | 0 (0.0%) |
| $25,000 to $34,999 | 21 (8.3%) | 0 (0.0%) |
| $35,000 to $49,999 | 55 (21.7%) | 35 (47.9%) |
| $50,000 to $74,999 | 40 (15.8%) | 0 (0.0%) |
| $75,000 to $99,999 | 0 (0.0%) | 0 (0.0%) |
| $100,000 to $149,999 | 10 (4.0%) | 0 (0.0%) |
| $150,000 or more | 22 (8.7%) | 0 (0.0%) |
| Total | 253 (100.0%) | 73 (100.0%) |
Monthly Housing Cost Tiers in Tallaboa
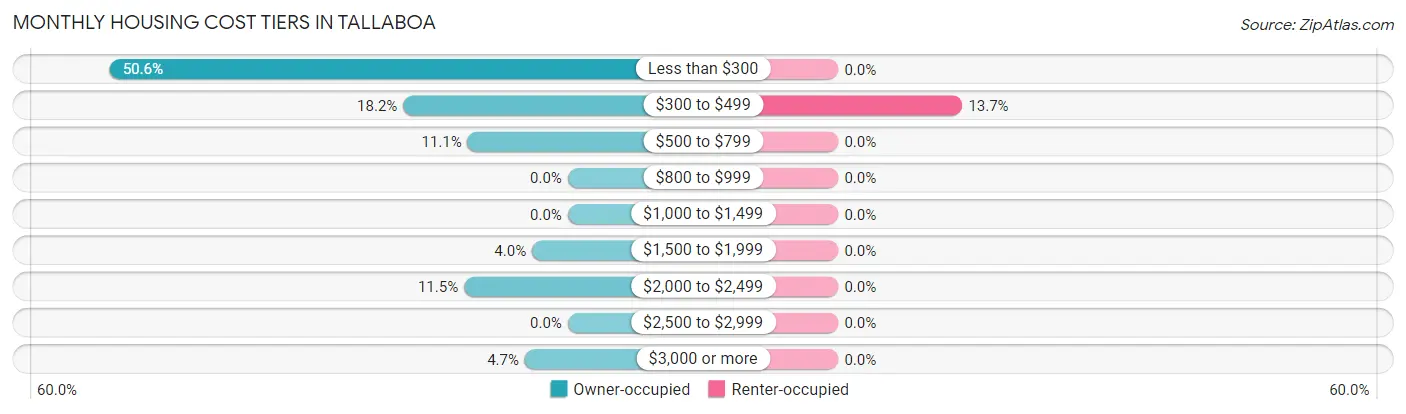
| Monthly Cost | Owner-occupied | Renter-occupied |
| Less than $300 | 128 (50.6%) | 0 (0.0%) |
| $300 to $499 | 46 (18.2%) | 10 (13.7%) |
| $500 to $799 | 28 (11.1%) | 0 (0.0%) |
| $800 to $999 | 0 (0.0%) | 0 (0.0%) |
| $1,000 to $1,499 | 0 (0.0%) | 0 (0.0%) |
| $1,500 to $1,999 | 10 (4.0%) | 0 (0.0%) |
| $2,000 to $2,499 | 29 (11.5%) | 0 (0.0%) |
| $2,500 to $2,999 | 0 (0.0%) | 0 (0.0%) |
| $3,000 or more | 12 (4.7%) | 0 (0.0%) |
| Total | 253 (100.0%) | 73 (100.0%) |
Physical Housing Characteristics in Tallaboa
Housing Structures in Tallaboa
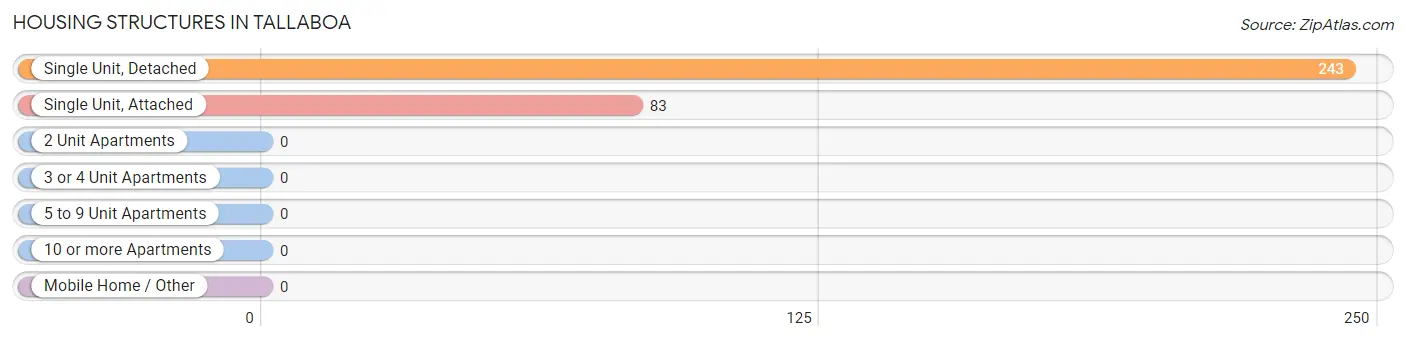
| Structure Type | # Housing Units | % Housing Units |
| Single Unit, Detached | 243 | 74.5% |
| Single Unit, Attached | 83 | 25.5% |
| 2 Unit Apartments | 0 | 0.0% |
| 3 or 4 Unit Apartments | 0 | 0.0% |
| 5 to 9 Unit Apartments | 0 | 0.0% |
| 10 or more Apartments | 0 | 0.0% |
| Mobile Home / Other | 0 | 0.0% |
| Total | 326 | 100.0% |
Housing Structures by Occupancy in Tallaboa
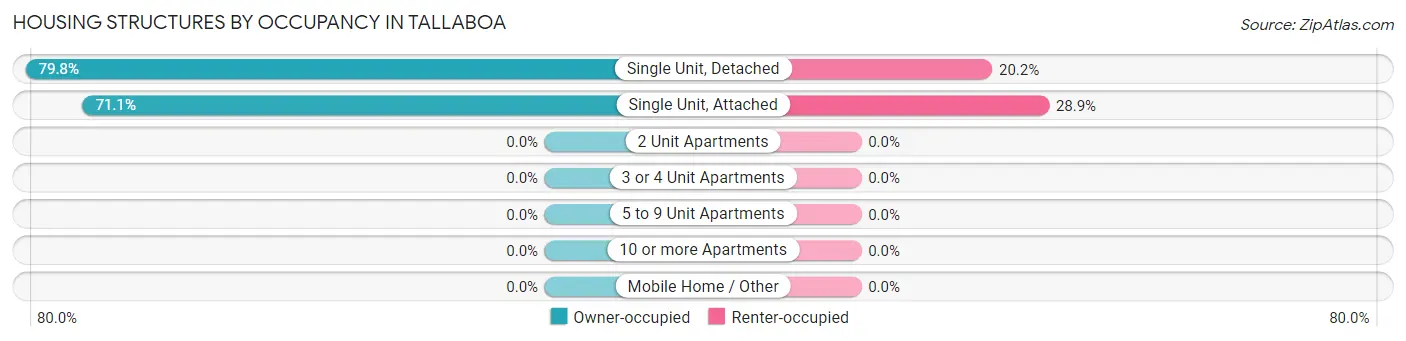
| Structure Type | Owner-occupied | Renter-occupied |
| Single Unit, Detached | 194 (79.8%) | 49 (20.2%) |
| Single Unit, Attached | 59 (71.1%) | 24 (28.9%) |
| 2 Unit Apartments | 0 (0.0%) | 0 (0.0%) |
| 3 or 4 Unit Apartments | 0 (0.0%) | 0 (0.0%) |
| 5 to 9 Unit Apartments | 0 (0.0%) | 0 (0.0%) |
| 10 or more Apartments | 0 (0.0%) | 0 (0.0%) |
| Mobile Home / Other | 0 (0.0%) | 0 (0.0%) |
| Total | 253 (77.6%) | 73 (22.4%) |
Housing Structures by Number of Rooms in Tallaboa
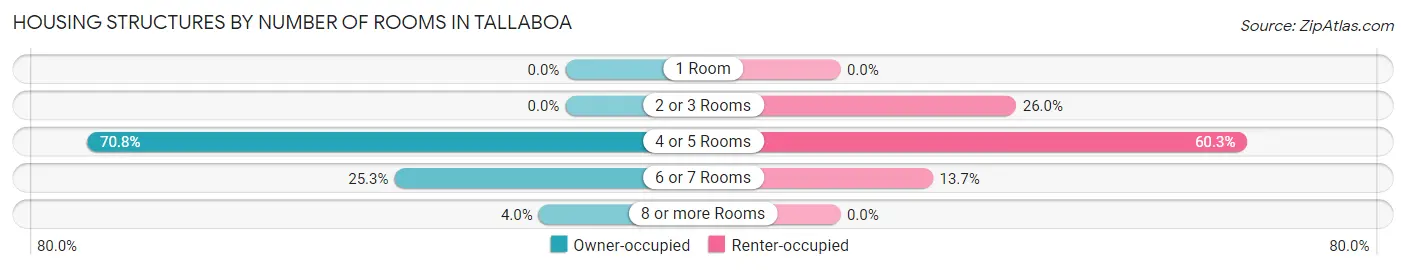
| Number of Rooms | Owner-occupied | Renter-occupied |
| 1 Room | 0 (0.0%) | 0 (0.0%) |
| 2 or 3 Rooms | 0 (0.0%) | 19 (26.0%) |
| 4 or 5 Rooms | 179 (70.8%) | 44 (60.3%) |
| 6 or 7 Rooms | 64 (25.3%) | 10 (13.7%) |
| 8 or more Rooms | 10 (4.0%) | 0 (0.0%) |
| Total | 253 (100.0%) | 73 (100.0%) |
Housing Structure by Heating Type in Tallaboa
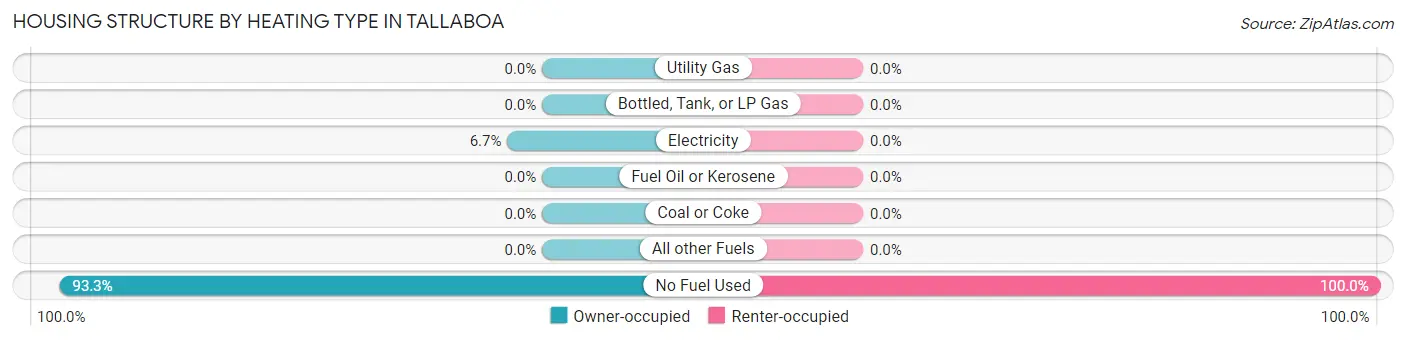
| Heating Type | Owner-occupied | Renter-occupied |
| Utility Gas | 0 (0.0%) | 0 (0.0%) |
| Bottled, Tank, or LP Gas | 0 (0.0%) | 0 (0.0%) |
| Electricity | 17 (6.7%) | 0 (0.0%) |
| Fuel Oil or Kerosene | 0 (0.0%) | 0 (0.0%) |
| Coal or Coke | 0 (0.0%) | 0 (0.0%) |
| All other Fuels | 0 (0.0%) | 0 (0.0%) |
| No Fuel Used | 236 (93.3%) | 73 (100.0%) |
| Total | 253 (100.0%) | 73 (100.0%) |
Household Vehicle Usage in Tallaboa
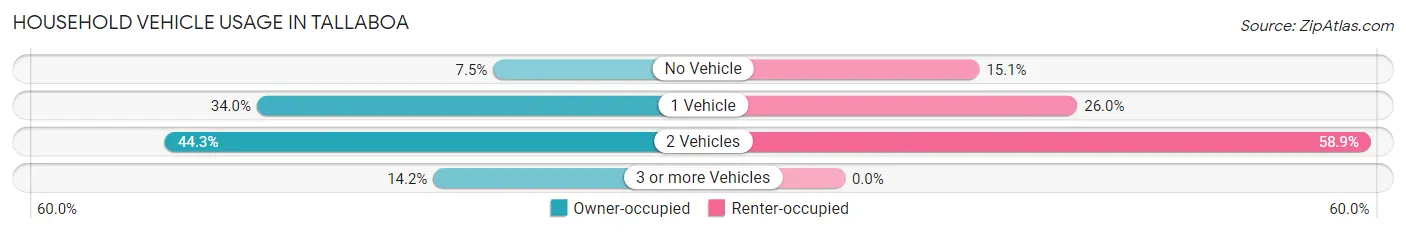
| Vehicles per Household | Owner-occupied | Renter-occupied |
| No Vehicle | 19 (7.5%) | 11 (15.1%) |
| 1 Vehicle | 86 (34.0%) | 19 (26.0%) |
| 2 Vehicles | 112 (44.3%) | 43 (58.9%) |
| 3 or more Vehicles | 36 (14.2%) | 0 (0.0%) |
| Total | 253 (100.0%) | 73 (100.0%) |
Real Estate & Mortgages in Tallaboa
Real Estate and Mortgage Overview in Tallaboa
| Characteristic | Without Mortgage | With Mortgage |
| Housing Units | 155 | 98 |
| Median Property Value | $108,600 | $0 |
| Median Household Income | $27,109 | $22 |
| Monthly Housing Costs | $194 | $12 |
| Real Estate Taxes | - | - |
Property Value by Mortgage Status in Tallaboa
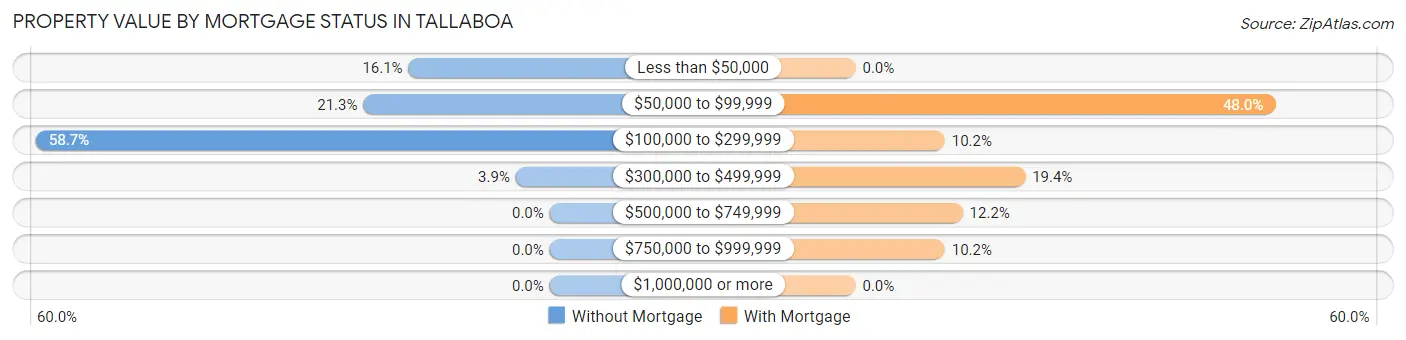
| Property Value | Without Mortgage | With Mortgage |
| Less than $50,000 | 25 (16.1%) | 0 (0.0%) |
| $50,000 to $99,999 | 33 (21.3%) | 47 (48.0%) |
| $100,000 to $299,999 | 91 (58.7%) | 10 (10.2%) |
| $300,000 to $499,999 | 6 (3.9%) | 19 (19.4%) |
| $500,000 to $749,999 | 0 (0.0%) | 12 (12.2%) |
| $750,000 to $999,999 | 0 (0.0%) | 10 (10.2%) |
| $1,000,000 or more | 0 (0.0%) | 0 (0.0%) |
| Total | 155 (100.0%) | 98 (100.0%) |
Household Income by Mortgage Status in Tallaboa
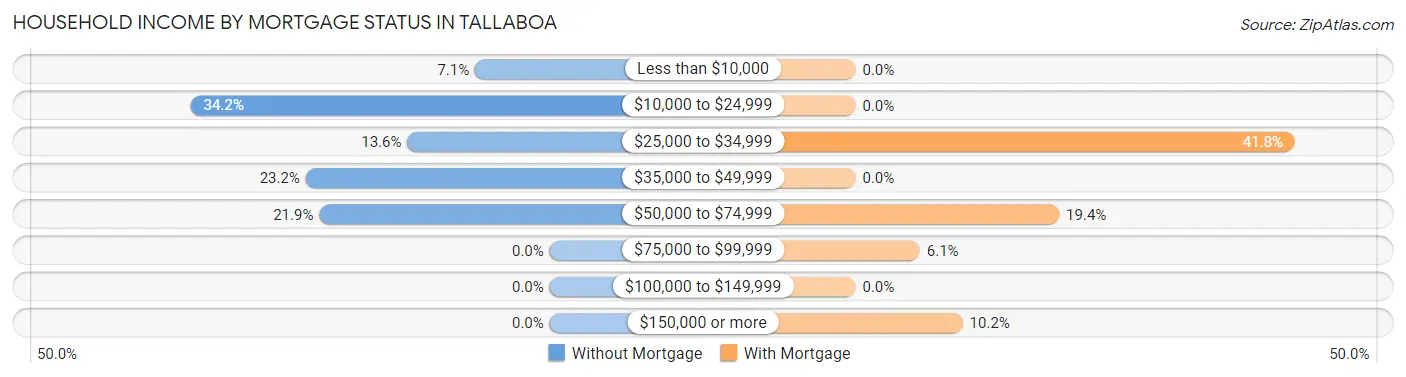
| Household Income | Without Mortgage | With Mortgage |
| Less than $10,000 | 11 (7.1%) | 0 (0.0%) |
| $10,000 to $24,999 | 53 (34.2%) | 0 (0.0%) |
| $25,000 to $34,999 | 21 (13.6%) | 41 (41.8%) |
| $35,000 to $49,999 | 36 (23.2%) | 0 (0.0%) |
| $50,000 to $74,999 | 34 (21.9%) | 19 (19.4%) |
| $75,000 to $99,999 | 0 (0.0%) | 6 (6.1%) |
| $100,000 to $149,999 | 0 (0.0%) | 0 (0.0%) |
| $150,000 or more | 0 (0.0%) | 10 (10.2%) |
| Total | 155 (100.0%) | 98 (100.0%) |
Property Value to Household Income Ratio in Tallaboa
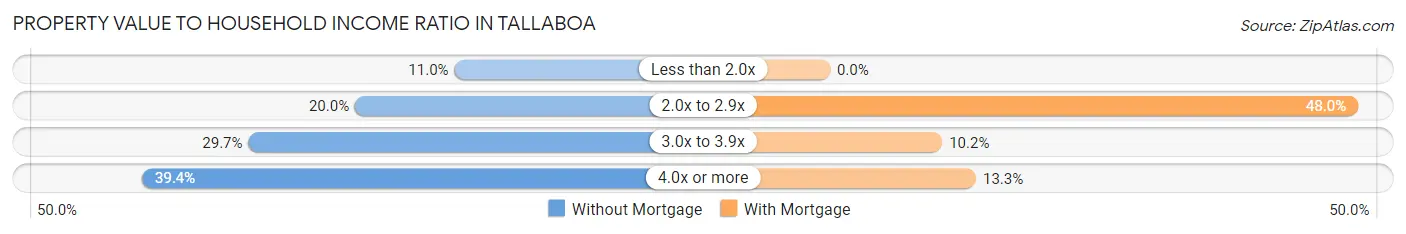
| Value-to-Income Ratio | Without Mortgage | With Mortgage |
| Less than 2.0x | 17 (11.0%) | 0 (0.0%) |
| 2.0x to 2.9x | 31 (20.0%) | 47 (48.0%) |
| 3.0x to 3.9x | 46 (29.7%) | 10 (10.2%) |
| 4.0x or more | 61 (39.4%) | 13 (13.3%) |
| Total | 155 (100.0%) | 98 (100.0%) |
Real Estate Taxes by Mortgage Status in Tallaboa
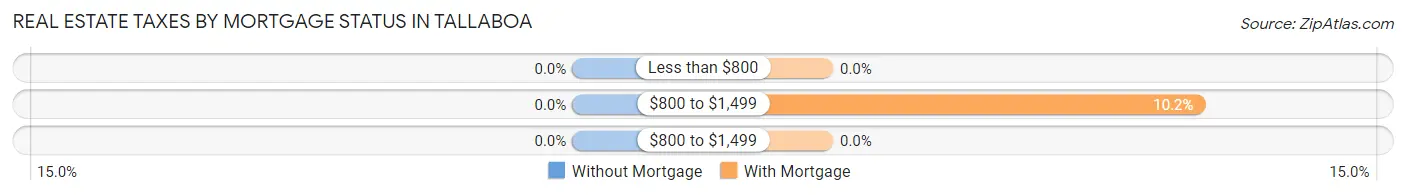
| Property Taxes | Without Mortgage | With Mortgage |
| Less than $800 | 0 (0.0%) | 0 (0.0%) |
| $800 to $1,499 | 0 (0.0%) | 10 (10.2%) |
| $800 to $1,499 | 0 (0.0%) | 0 (0.0%) |
| Total | 155 (100.0%) | 98 (100.0%) |
Health & Disability in Tallaboa
Health Insurance Coverage by Age in Tallaboa
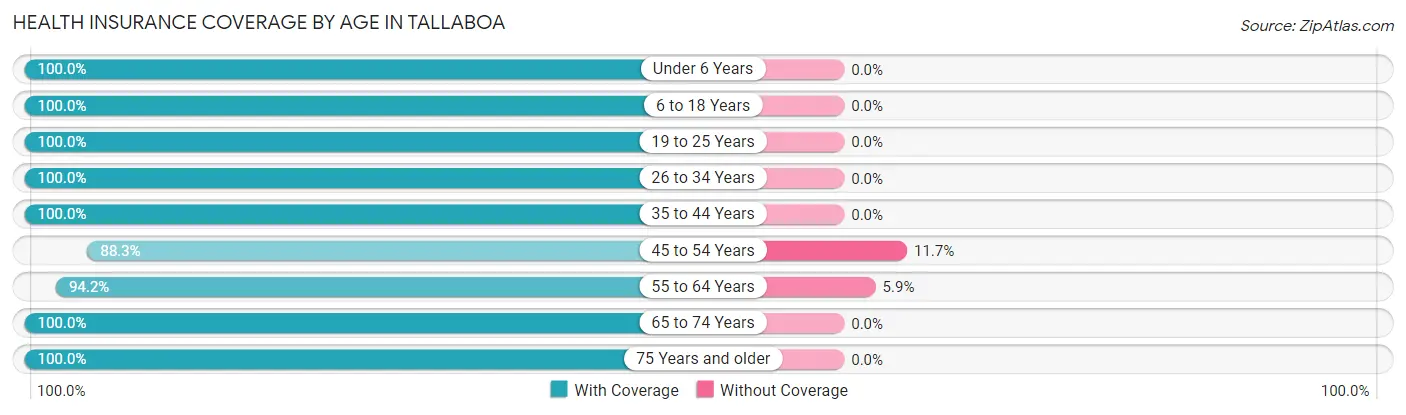
| Age Bracket | With Coverage | Without Coverage |
| Under 6 Years | 28 (100.0%) | 0 (0.0%) |
| 6 to 18 Years | 167 (100.0%) | 0 (0.0%) |
| 19 to 25 Years | 104 (100.0%) | 0 (0.0%) |
| 26 to 34 Years | 66 (100.0%) | 0 (0.0%) |
| 35 to 44 Years | 74 (100.0%) | 0 (0.0%) |
| 45 to 54 Years | 166 (88.3%) | 22 (11.7%) |
| 55 to 64 Years | 161 (94.2%) | 10 (5.9%) |
| 65 to 74 Years | 107 (100.0%) | 0 (0.0%) |
| 75 Years and older | 117 (100.0%) | 0 (0.0%) |
| Total | 990 (96.9%) | 32 (3.1%) |
Health Insurance Coverage by Citizenship Status in Tallaboa
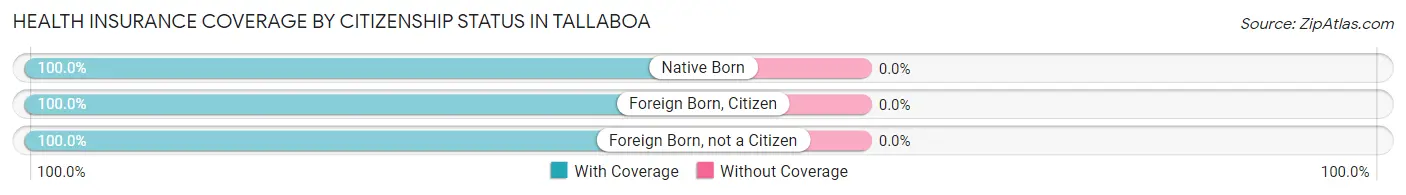
| Citizenship Status | With Coverage | Without Coverage |
| Native Born | 28 (100.0%) | 0 (0.0%) |
| Foreign Born, Citizen | 167 (100.0%) | 0 (0.0%) |
| Foreign Born, not a Citizen | 104 (100.0%) | 0 (0.0%) |
Health Insurance Coverage by Household Income in Tallaboa
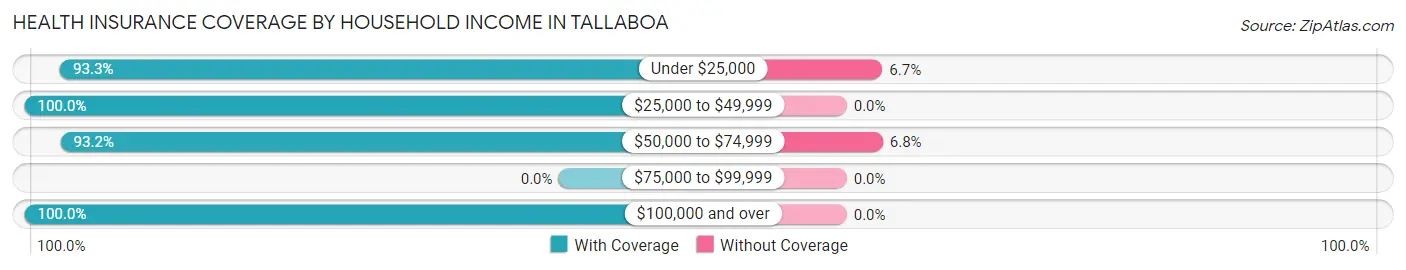
| Household Income | With Coverage | Without Coverage |
| Under $25,000 | 308 (93.3%) | 22 (6.7%) |
| $25,000 to $49,999 | 379 (100.0%) | 0 (0.0%) |
| $50,000 to $74,999 | 138 (93.2%) | 10 (6.8%) |
| $75,000 to $99,999 | 0 (0.0%) | 0 (0.0%) |
| $100,000 and over | 165 (100.0%) | 0 (0.0%) |
Public vs Private Health Insurance Coverage by Age in Tallaboa
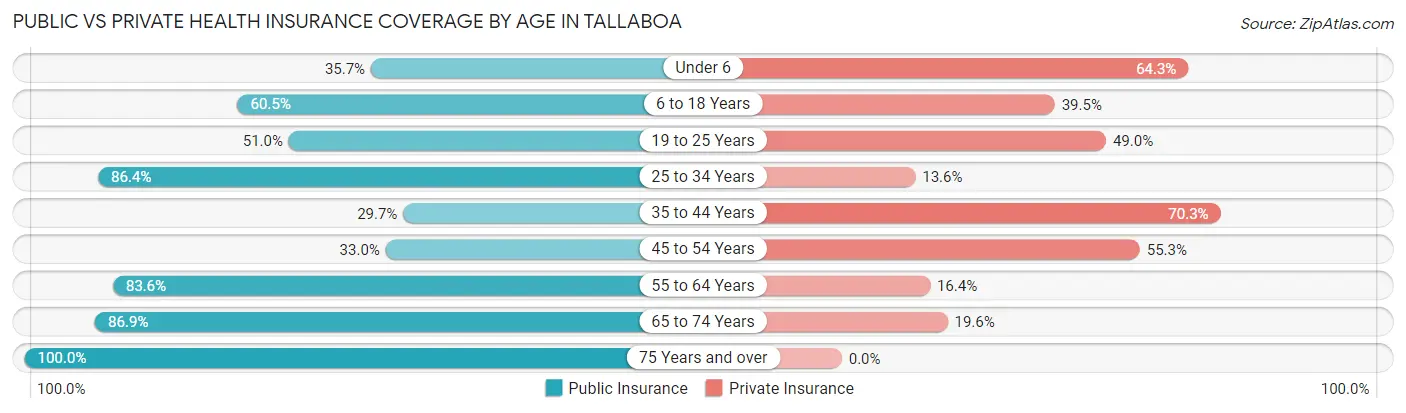
| Age Bracket | Public Insurance | Private Insurance |
| Under 6 | 10 (35.7%) | 18 (64.3%) |
| 6 to 18 Years | 101 (60.5%) | 66 (39.5%) |
| 19 to 25 Years | 53 (51.0%) | 51 (49.0%) |
| 25 to 34 Years | 57 (86.4%) | 9 (13.6%) |
| 35 to 44 Years | 22 (29.7%) | 52 (70.3%) |
| 45 to 54 Years | 62 (33.0%) | 104 (55.3%) |
| 55 to 64 Years | 143 (83.6%) | 28 (16.4%) |
| 65 to 74 Years | 93 (86.9%) | 21 (19.6%) |
| 75 Years and over | 117 (100.0%) | 0 (0.0%) |
| Total | 658 (64.4%) | 349 (34.2%) |
Disability Status by Sex by Age in Tallaboa
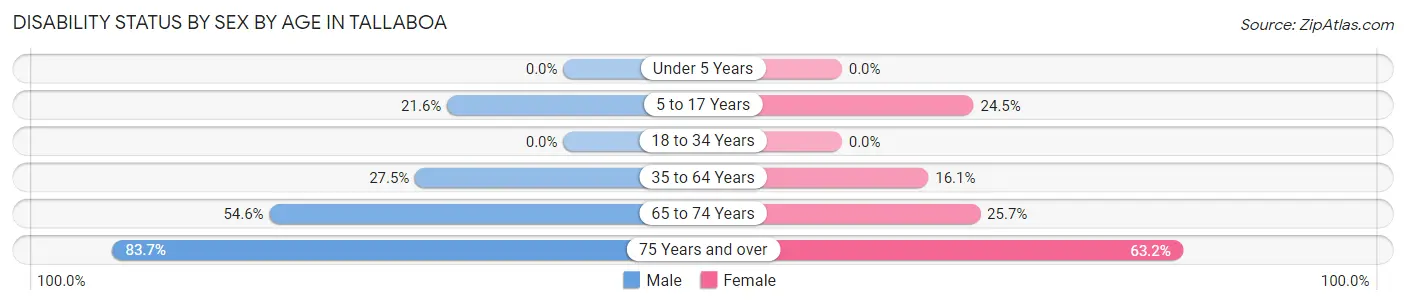
| Age Bracket | Male | Female |
| Under 5 Years | 0 (0.0%) | 0 (0.0%) |
| 5 to 17 Years | 11 (21.6%) | 23 (24.5%) |
| 18 to 34 Years | 0 (0.0%) | 0 (0.0%) |
| 35 to 64 Years | 66 (27.5%) | 31 (16.1%) |
| 65 to 74 Years | 18 (54.5%) | 19 (25.7%) |
| 75 Years and over | 41 (83.7%) | 43 (63.2%) |
Disability Class by Sex by Age in Tallaboa
Disability Class: Hearing Difficulty
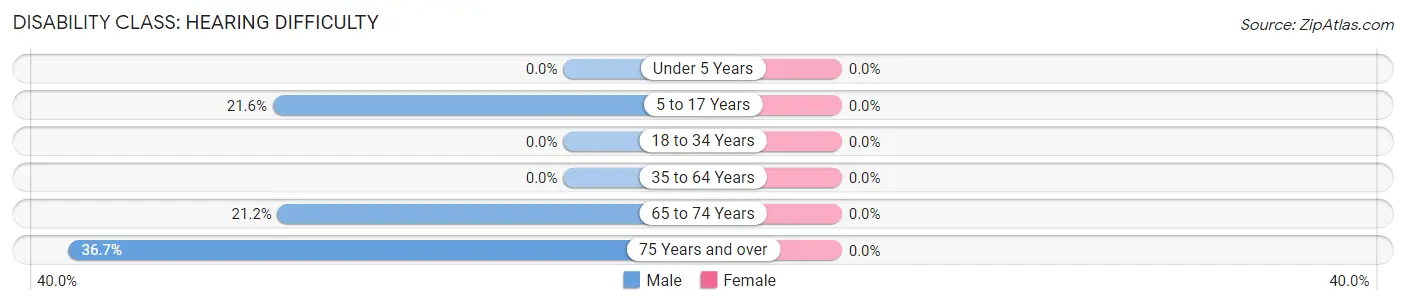
| Age Bracket | Male | Female |
| Under 5 Years | 0 (0.0%) | 0 (0.0%) |
| 5 to 17 Years | 11 (21.6%) | 0 (0.0%) |
| 18 to 34 Years | 0 (0.0%) | 0 (0.0%) |
| 35 to 64 Years | 0 (0.0%) | 0 (0.0%) |
| 65 to 74 Years | 7 (21.2%) | 0 (0.0%) |
| 75 Years and over | 18 (36.7%) | 0 (0.0%) |
Disability Class: Vision Difficulty
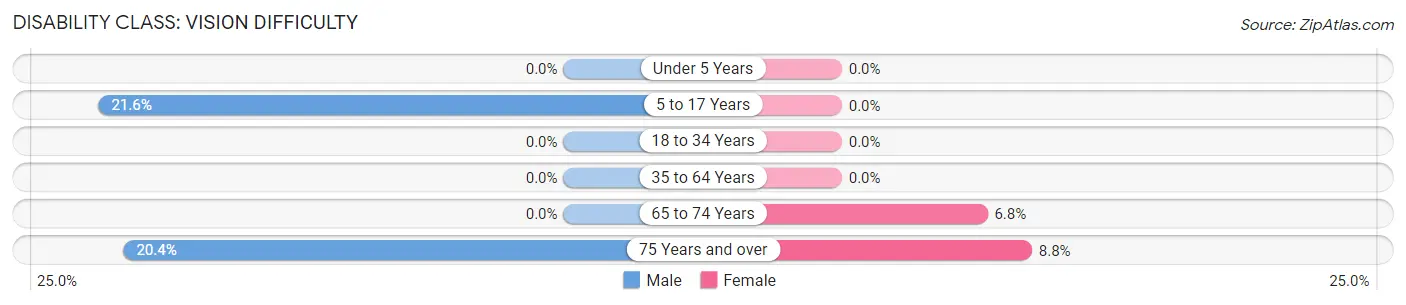
| Age Bracket | Male | Female |
| Under 5 Years | 0 (0.0%) | 0 (0.0%) |
| 5 to 17 Years | 11 (21.6%) | 0 (0.0%) |
| 18 to 34 Years | 0 (0.0%) | 0 (0.0%) |
| 35 to 64 Years | 0 (0.0%) | 0 (0.0%) |
| 65 to 74 Years | 0 (0.0%) | 5 (6.8%) |
| 75 Years and over | 10 (20.4%) | 6 (8.8%) |
Disability Class: Cognitive Difficulty
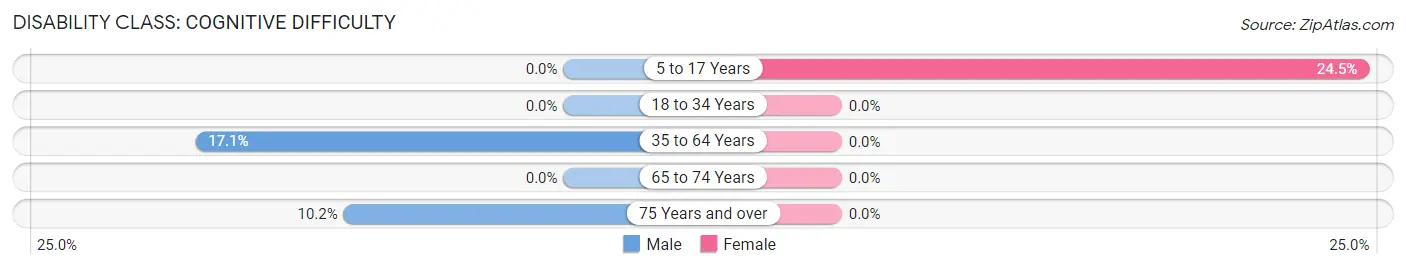
| Age Bracket | Male | Female |
| 5 to 17 Years | 0 (0.0%) | 23 (24.5%) |
| 18 to 34 Years | 0 (0.0%) | 0 (0.0%) |
| 35 to 64 Years | 41 (17.1%) | 0 (0.0%) |
| 65 to 74 Years | 0 (0.0%) | 0 (0.0%) |
| 75 Years and over | 5 (10.2%) | 0 (0.0%) |
Disability Class: Ambulatory Difficulty
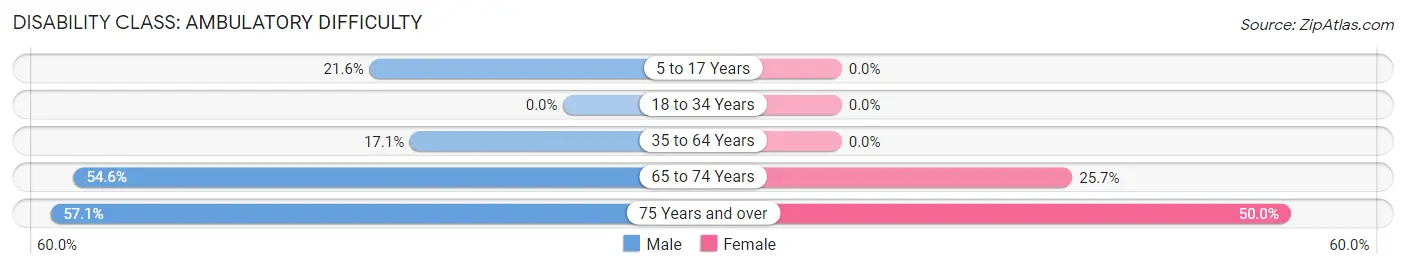
| Age Bracket | Male | Female |
| 5 to 17 Years | 11 (21.6%) | 0 (0.0%) |
| 18 to 34 Years | 0 (0.0%) | 0 (0.0%) |
| 35 to 64 Years | 41 (17.1%) | 0 (0.0%) |
| 65 to 74 Years | 18 (54.5%) | 19 (25.7%) |
| 75 Years and over | 28 (57.1%) | 34 (50.0%) |
Disability Class: Self-Care Difficulty
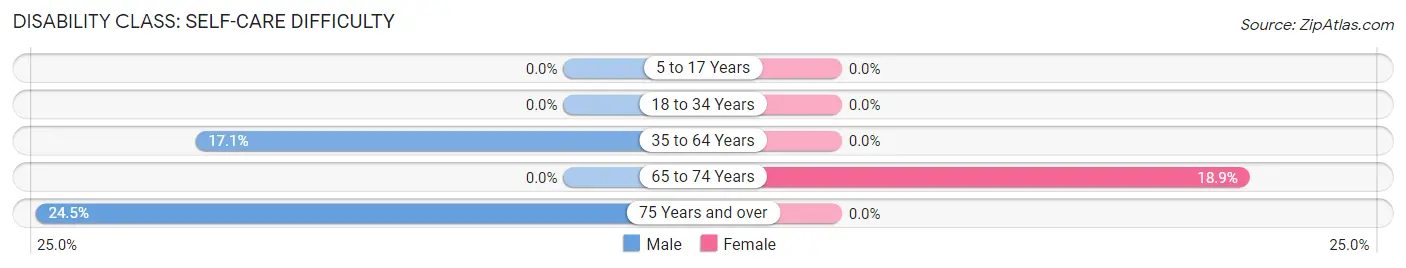
| Age Bracket | Male | Female |
| 5 to 17 Years | 0 (0.0%) | 0 (0.0%) |
| 18 to 34 Years | 0 (0.0%) | 0 (0.0%) |
| 35 to 64 Years | 41 (17.1%) | 0 (0.0%) |
| 65 to 74 Years | 0 (0.0%) | 14 (18.9%) |
| 75 Years and over | 12 (24.5%) | 0 (0.0%) |
Technology Access in Tallaboa
Computing Device Access in Tallaboa
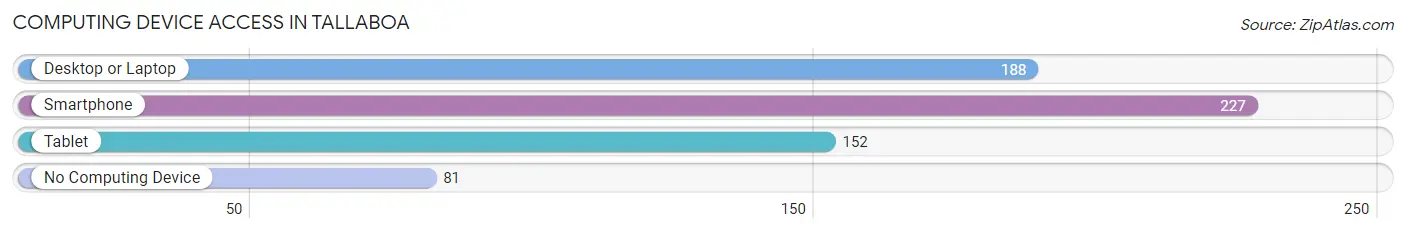
| Device Type | # Households | % Households |
| Desktop or Laptop | 188 | 57.7% |
| Smartphone | 227 | 69.6% |
| Tablet | 152 | 46.6% |
| No Computing Device | 81 | 24.8% |
| Total | 326 | 100.0% |
Internet Access in Tallaboa
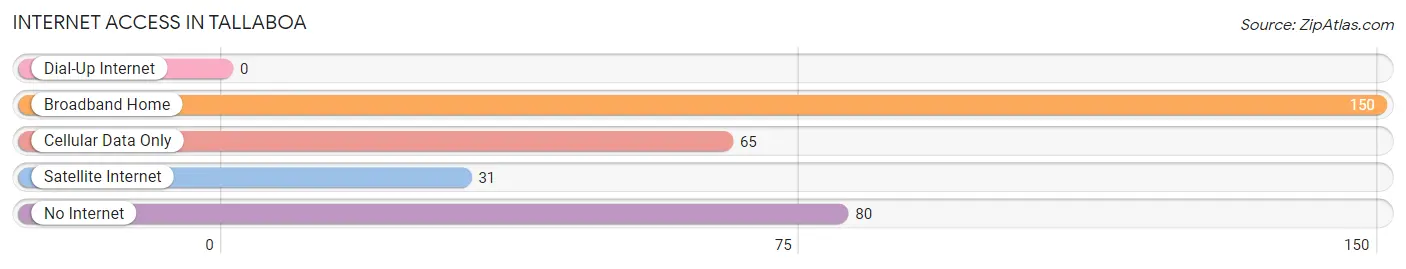
| Internet Type | # Households | % Households |
| Dial-Up Internet | 0 | 0.0% |
| Broadband Home | 150 | 46.0% |
| Cellular Data Only | 65 | 19.9% |
| Satellite Internet | 31 | 9.5% |
| No Internet | 80 | 24.5% |
| Total | 326 | 100.0% |
Tallaboa Summary
Tallaboa is a small municipality located in the central region of Puerto Rico. It is part of the Ponce Metropolitan Statistical Area and is located in the southern part of the island. The municipality has a population of approximately 5,000 people and covers an area of 8.3 square miles.
History
Tallaboa was founded in 1815 by Don Juan de la Cruz, a Spanish colonist. The name of the town is derived from the Taíno word “Tallaboa”, which means “place of the tall trees”. The town was originally a small agricultural community, with the main crops being coffee, sugar cane, and tobacco.
In the late 19th century, the town began to experience a period of economic growth due to the construction of the Ponce-San Juan railway line. This allowed for the transportation of goods and services to and from the town, which helped to stimulate the local economy.
In the early 20th century, Tallaboa experienced a period of decline due to the Great Depression. This caused many of the town’s residents to migrate to other parts of Puerto Rico and the United States in search of better economic opportunities.
Geography
Tallaboa is located in the central region of Puerto Rico, in the southern part of the island. The municipality is bordered by the municipalities of Juana Diaz to the north, Guayanilla to the east, and Ponce to the south. The town is situated in a valley surrounded by mountains, with the highest peak being Cerro de Punta at 1,945 feet.
The climate in Tallaboa is tropical, with temperatures ranging from the mid-70s to the mid-80s throughout the year. The town receives an average of 60 inches of rain per year, with the majority of the rainfall occurring during the months of May through October.
Economy
The economy of Tallaboa is largely based on agriculture, with the main crops being coffee, sugar cane, and tobacco. The town also has a small manufacturing sector, with the main products being furniture, clothing, and electronics.
The town also has a small tourism industry, with the main attractions being the nearby beaches and the historic town center.
Demographics
As of the 2010 census, the population of Tallaboa was 5,000. The majority of the population is of Hispanic or Latino descent, with the largest ethnic group being Puerto Ricans. The town also has a small population of African Americans, as well as a small population of non-Hispanic whites.
The median household income in Tallaboa is $17,000, which is lower than the national average. The town also has a high poverty rate, with approximately 40% of the population living below the poverty line.
Conclusion
Tallaboa is a small municipality located in the central region of Puerto Rico. The town has a population of approximately 5,000 people and covers an area of 8.3 square miles. The economy of Tallaboa is largely based on agriculture, with the main crops being coffee, sugar cane, and tobacco. The town also has a small manufacturing sector, with the main products being furniture, clothing, and electronics. The town also has a small tourism industry, with the main attractions being the nearby beaches and the historic town center. The majority of the population is of Hispanic or Latino descent, with the largest ethnic group being Puerto Ricans. The median household income in Tallaboa is $17,000, which is lower than the national average. The town also has a high poverty rate, with approximately 40% of the population living below the poverty line.
Common Questions
What is Per Capita Income in Tallaboa?
Per Capita income in Tallaboa is $23,963.
What is the Median Family Income in Tallaboa?
Median Family Income in Tallaboa is $36,985.
What is the Median Household income in Tallaboa?
Median Household Income in Tallaboa is $29,500.
What is Income or Wage Gap in Tallaboa?
Income or Wage Gap in Tallaboa is 16.6%.
Women in Tallaboa earn 83.4 cents for every dollar earned by a man.
What is Family Income Deficit in Tallaboa?
Family Income Deficit in Tallaboa is $5,577.
Families that are below poverty line in Tallaboa earn $5,577 less on average than the poverty threshold level.
What is Inequality or Gini Index in Tallaboa?
Inequality or Gini Index in Tallaboa is 0.66.
What is the Total Population of Tallaboa?
Total Population of Tallaboa is 1,022.
What is the Total Male Population of Tallaboa?
Total Male Population of Tallaboa is 444.
What is the Total Female Population of Tallaboa?
Total Female Population of Tallaboa is 578.
What is the Ratio of Males per 100 Females in Tallaboa?
There are 76.82 Males per 100 Females in Tallaboa.
What is the Ratio of Females per 100 Males in Tallaboa?
There are 130.18 Females per 100 Males in Tallaboa.
What is the Median Population Age in Tallaboa?
Median Population Age in Tallaboa is 49.7 Years.
What is the Average Family Size in Tallaboa
Average Family Size in Tallaboa is 3.5 People.
What is the Average Household Size in Tallaboa
Average Household Size in Tallaboa is 3.1 People.
How Large is the Labor Force in Tallaboa?
There are 271 People in the Labor Forcein in Tallaboa.
What is the Percentage of People in the Labor Force in Tallaboa?
30.6% of People are in the Labor Force in Tallaboa.
What is the Unemployment Rate in Tallaboa?
Unemployment Rate in Tallaboa is 5.9%.