Santa Clara, PR Map & Demographics
Santa Clara Map
Santa Clara Overview
$5,539
PER CAPITA INCOME
0.59
INEQUALITY / GINI INDEX
438
TOTAL POPULATION
239
MALE POPULATION
199
FEMALE POPULATION
120.10
MALES / 100 FEMALES
83.26
FEMALES / 100 MALES
58.8
MEDIAN AGE
2.9
AVG FAMILY SIZE
2.6
AVG HOUSEHOLD SIZE
52
LABOR FORCE [ PEOPLE ]
12.3%
PERCENT IN LABOR FORCE
25.0%
UNEMPLOYMENT RATE
Income in Santa Clara
Income Overview in Santa Clara
| Characteristic | Number | Measure |
| Per Capita Income | 438 | $5,539 |
| Median Family Income | 138 | $0 |
| Mean Family Income | 138 | $14,985 |
| Median Household Income | 169 | $0 |
| Mean Household Income | 169 | $12,236 |
| Income Deficit | 138 | $0 |
| Wage / Income Gap (%) | 438 | 0.00% |
| Wage / Income Gap ($) | 438 | 100.00¢ per $1 |
| Gini / Inequality Index | 438 | 0.59 |
Earnings by Sex in Santa Clara
| Sex | Number | Average Earnings |
| Male | 104 (81.2%) | $0 |
| Female | 24 (18.8%) | $0 |
| Total | 128 (100.0%) | $0 |
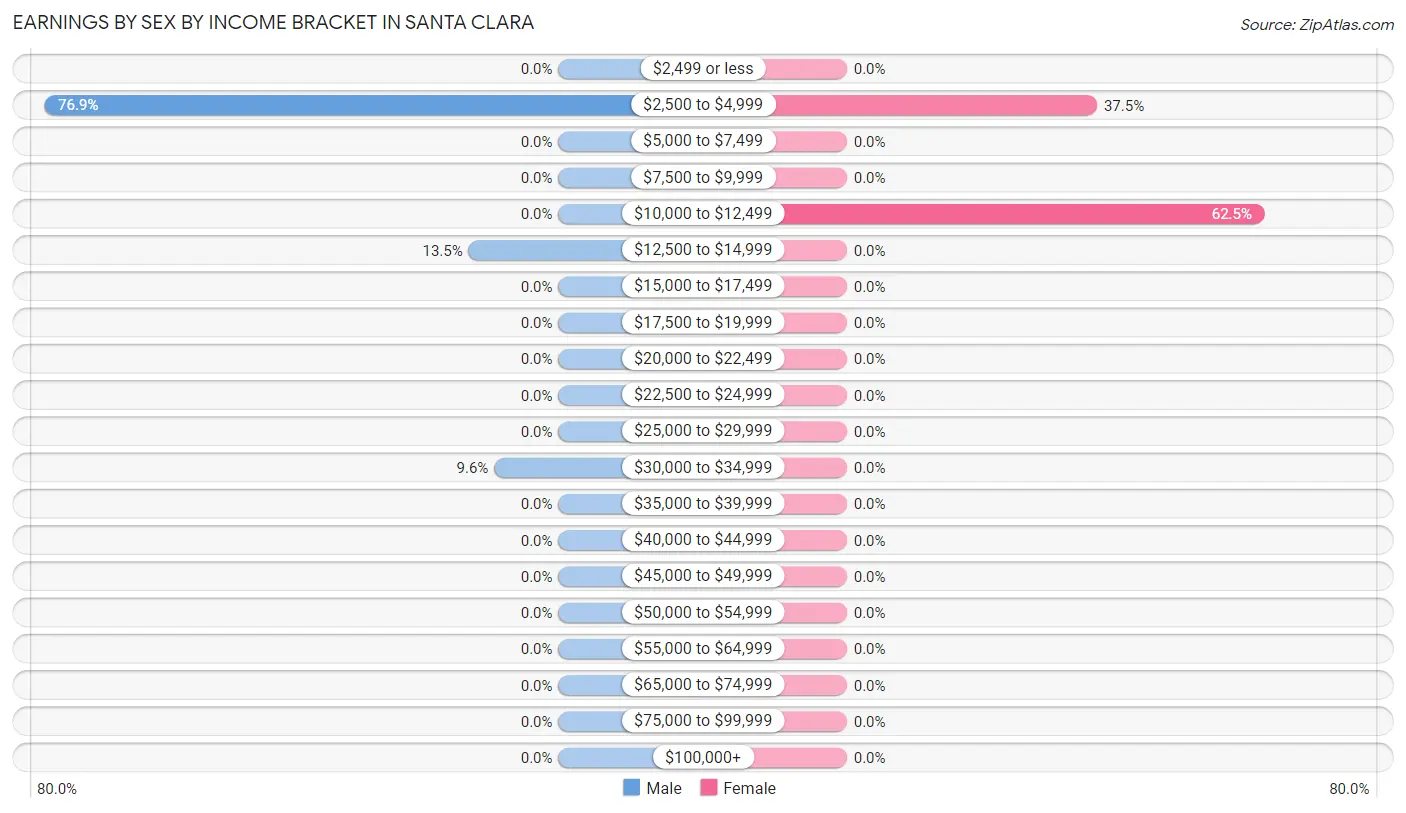
Earnings by Sex by Income Bracket in Santa Clara
The most common earnings brackets in Santa Clara are $2,500 to $4,999 for men (80 | 76.9%) and $10,000 to $12,499 for women (15 | 62.5%).
| Income | Male | Female |
| $2,499 or less | 0 (0.0%) | 0 (0.0%) |
| $2,500 to $4,999 | 80 (76.9%) | 9 (37.5%) |
| $5,000 to $7,499 | 0 (0.0%) | 0 (0.0%) |
| $7,500 to $9,999 | 0 (0.0%) | 0 (0.0%) |
| $10,000 to $12,499 | 0 (0.0%) | 15 (62.5%) |
| $12,500 to $14,999 | 14 (13.5%) | 0 (0.0%) |
| $15,000 to $17,499 | 0 (0.0%) | 0 (0.0%) |
| $17,500 to $19,999 | 0 (0.0%) | 0 (0.0%) |
| $20,000 to $22,499 | 0 (0.0%) | 0 (0.0%) |
| $22,500 to $24,999 | 0 (0.0%) | 0 (0.0%) |
| $25,000 to $29,999 | 0 (0.0%) | 0 (0.0%) |
| $30,000 to $34,999 | 10 (9.6%) | 0 (0.0%) |
| $35,000 to $39,999 | 0 (0.0%) | 0 (0.0%) |
| $40,000 to $44,999 | 0 (0.0%) | 0 (0.0%) |
| $45,000 to $49,999 | 0 (0.0%) | 0 (0.0%) |
| $50,000 to $54,999 | 0 (0.0%) | 0 (0.0%) |
| $55,000 to $64,999 | 0 (0.0%) | 0 (0.0%) |
| $65,000 to $74,999 | 0 (0.0%) | 0 (0.0%) |
| $75,000 to $99,999 | 0 (0.0%) | 0 (0.0%) |
| $100,000+ | 0 (0.0%) | 0 (0.0%) |
| Total | 104 (100.0%) | 24 (100.0%) |
Earnings by Sex by Educational Attainment in Santa Clara
| Educational Attainment | Male Income | Female Income |
| Less than High School | - | - |
| High School Diploma | - | - |
| College or Associate's Degree | - | - |
| Bachelor's Degree | - | - |
| Graduate Degree | - | - |
| Total | - | - |
Family Income in Santa Clara
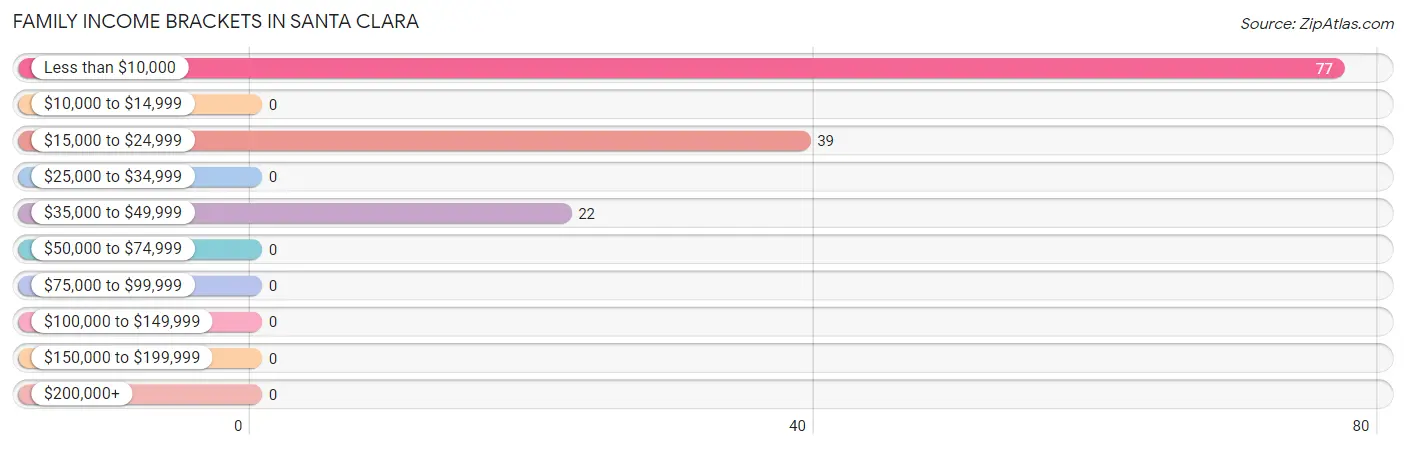
Family Income Brackets in Santa Clara
According to the Santa Clara family income data, there are 77 families falling into the less than $10,000 income range, which is the most common income bracket and makes up 55.8% of all families.
| Income Bracket | # Families | % Families |
| Less than $10,000 | 77 | 55.8% |
| $10,000 to $14,999 | 0 | 0.0% |
| $15,000 to $24,999 | 39 | 28.3% |
| $25,000 to $34,999 | 0 | 0.0% |
| $35,000 to $49,999 | 22 | 15.9% |
| $50,000 to $74,999 | 0 | 0.0% |
| $75,000 to $99,999 | 0 | 0.0% |
| $100,000 to $149,999 | 0 | 0.0% |
| $150,000 to $199,999 | 0 | 0.0% |
| $200,000+ | 0 | 0.0% |
Family Income by Famaliy Size in Santa Clara
| Income Bracket | # Families | Median Income |
| 2-Person Families | 95 (68.8%) | $0 |
| 3-Person Families | 35 (25.4%) | $0 |
| 4-Person Families | 8 (5.8%) | $0 |
| 5-Person Families | 0 (0.0%) | $0 |
| 6-Person Families | 0 (0.0%) | $0 |
| 7+ Person Families | 0 (0.0%) | $0 |
| Total | 138 (100.0%) | $0 |
Family Income by Number of Earners in Santa Clara
| Number of Earners | # Families | Median Income |
| No Earners | 77 (55.8%) | $0 |
| 1 Earner | 51 (37.0%) | $0 |
| 2 Earners | 10 (7.2%) | $0 |
| 3+ Earners | 0 (0.0%) | $0 |
| Total | 138 (100.0%) | $0 |
Household Income in Santa Clara
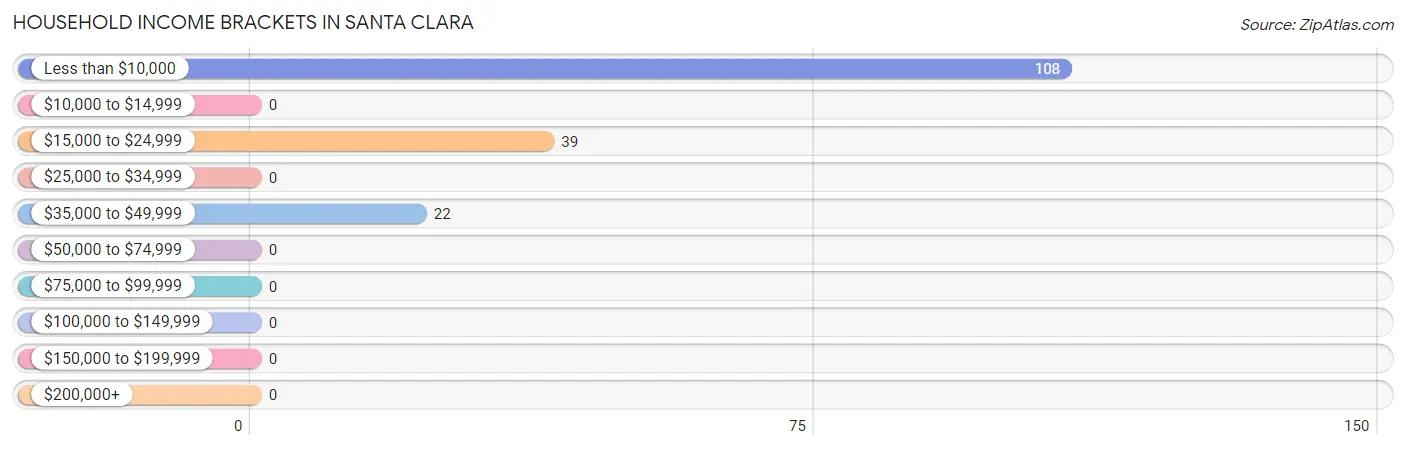
Household Income Brackets in Santa Clara
With 108 households falling in the category, the less than $10,000 income range is the most frequent in Santa Clara, accounting for 63.9% of all households.
| Income Bracket | # Households | % Households |
| Less than $10,000 | 108 | 63.9% |
| $10,000 to $14,999 | 0 | 0.0% |
| $15,000 to $24,999 | 39 | 23.1% |
| $25,000 to $34,999 | 0 | 0.0% |
| $35,000 to $49,999 | 22 | 13.0% |
| $50,000 to $74,999 | 0 | 0.0% |
| $75,000 to $99,999 | 0 | 0.0% |
| $100,000 to $149,999 | 0 | 0.0% |
| $150,000 to $199,999 | 0 | 0.0% |
| $200,000+ | 0 | 0.0% |
Household Income by Householder Age in Santa Clara
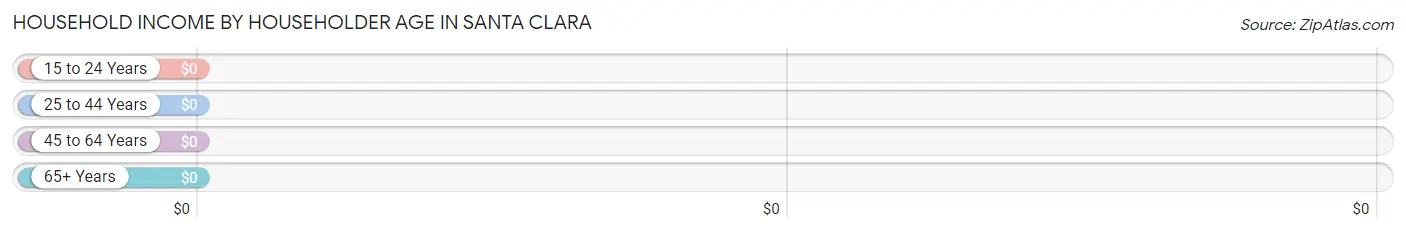
| Income Bracket | # Households | Median Income |
| 15 to 24 Years | 0 (0.0%) | $0 |
| 25 to 44 Years | 13 (7.7%) | $0 |
| 45 to 64 Years | 41 (24.3%) | $0 |
| 65+ Years | 115 (68.0%) | $0 |
| Total | 169 (100.0%) | $0 |
Poverty in Santa Clara
Income Below Poverty by Sex and Age in Santa Clara
With 73.5% poverty level for males and 51.8% for females among the residents of Santa Clara, 6 to 11 year old males and 18 to 24 year old females are the most vulnerable to poverty, with 13 males (100.0%) and 13 females (100.0%) in their respective age groups living below the poverty level.
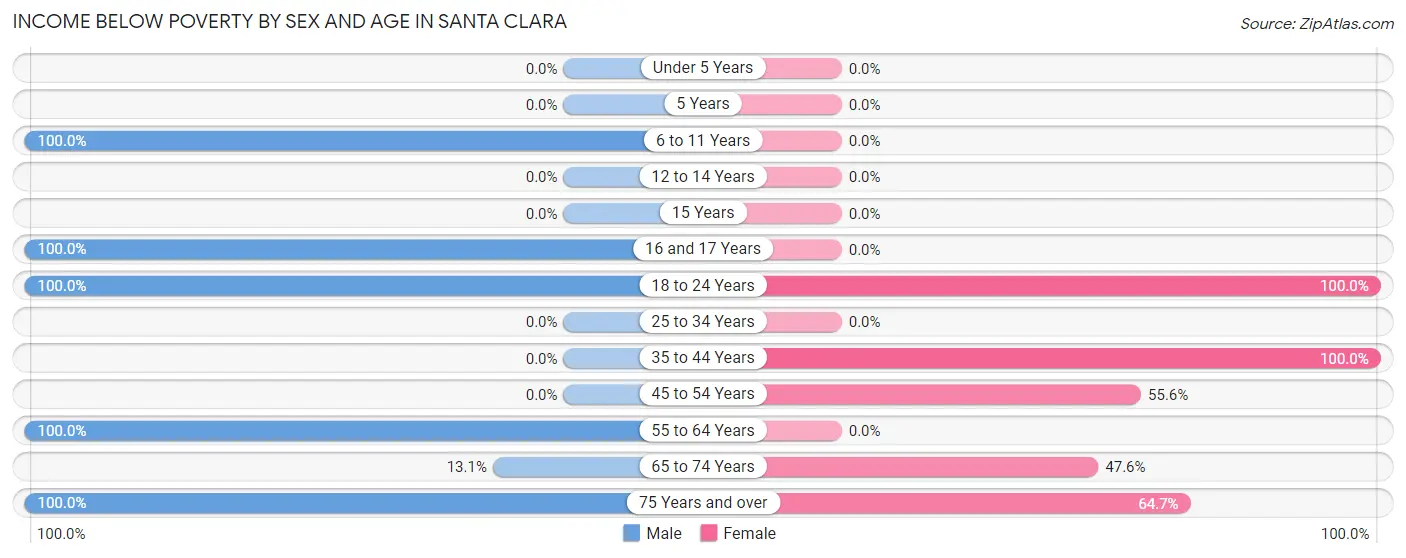
| Age Bracket | Male | Female |
| Under 5 Years | 0 (0.0%) | 0 (0.0%) |
| 5 Years | 0 (0.0%) | 0 (0.0%) |
| 6 to 11 Years | 13 (100.0%) | 0 (0.0%) |
| 12 to 14 Years | 0 (0.0%) | 0 (0.0%) |
| 15 Years | 0 (0.0%) | 0 (0.0%) |
| 16 and 17 Years | 12 (100.0%) | 0 (0.0%) |
| 18 to 24 Years | 80 (100.0%) | 13 (100.0%) |
| 25 to 34 Years | 0 (0.0%) | 0 (0.0%) |
| 35 to 44 Years | 0 (0.0%) | 13 (100.0%) |
| 45 to 54 Years | 0 (0.0%) | 15 (55.6%) |
| 55 to 64 Years | 45 (100.0%) | 0 (0.0%) |
| 65 to 74 Years | 8 (13.1%) | 40 (47.6%) |
| 75 Years and over | 17 (100.0%) | 22 (64.7%) |
| Total | 175 (73.5%) | 103 (51.8%) |
Income Above Poverty by Sex and Age in Santa Clara
According to the poverty statistics in Santa Clara, males aged 45 to 54 years and females aged 25 to 34 years are the age groups that are most secure financially, with 100.0% of males and 100.0% of females in these age groups living above the poverty line.
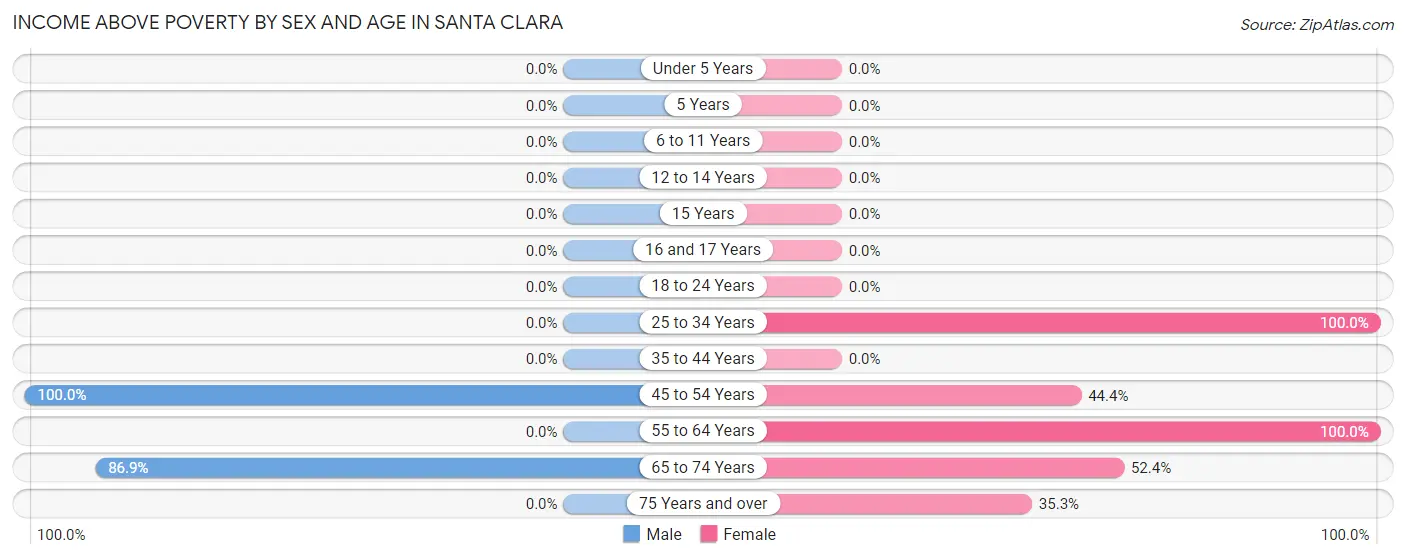
| Age Bracket | Male | Female |
| Under 5 Years | 0 (0.0%) | 0 (0.0%) |
| 5 Years | 0 (0.0%) | 0 (0.0%) |
| 6 to 11 Years | 0 (0.0%) | 0 (0.0%) |
| 12 to 14 Years | 0 (0.0%) | 0 (0.0%) |
| 15 Years | 0 (0.0%) | 0 (0.0%) |
| 16 and 17 Years | 0 (0.0%) | 0 (0.0%) |
| 18 to 24 Years | 0 (0.0%) | 0 (0.0%) |
| 25 to 34 Years | 0 (0.0%) | 15 (100.0%) |
| 35 to 44 Years | 0 (0.0%) | 0 (0.0%) |
| 45 to 54 Years | 10 (100.0%) | 12 (44.4%) |
| 55 to 64 Years | 0 (0.0%) | 13 (100.0%) |
| 65 to 74 Years | 53 (86.9%) | 44 (52.4%) |
| 75 Years and over | 0 (0.0%) | 12 (35.3%) |
| Total | 63 (26.5%) | 96 (48.2%) |
Income Below Poverty Among Married-Couple Families in Santa Clara
The poverty statistics for married-couple families in Santa Clara show that 33.8% or 25 of the total 74 families live below the poverty line. Families with no children have the highest poverty rate of 33.8%, comprising of 25 families. On the other hand, families with no children have the lowest poverty rate of 33.8%, which includes 25 families.
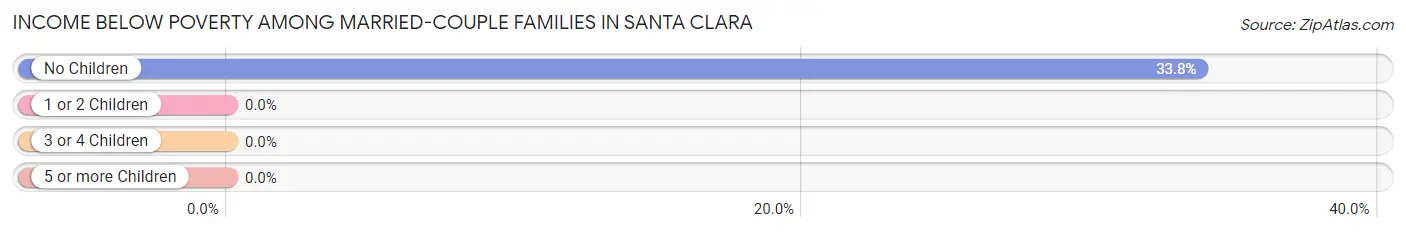
| Children | Above Poverty | Below Poverty |
| No Children | 49 (66.2%) | 25 (33.8%) |
| 1 or 2 Children | 0 (0.0%) | 0 (0.0%) |
| 3 or 4 Children | 0 (0.0%) | 0 (0.0%) |
| 5 or more Children | 0 (0.0%) | 0 (0.0%) |
| Total | 49 (66.2%) | 25 (33.8%) |
Income Below Poverty Among Single-Parent Households in Santa Clara
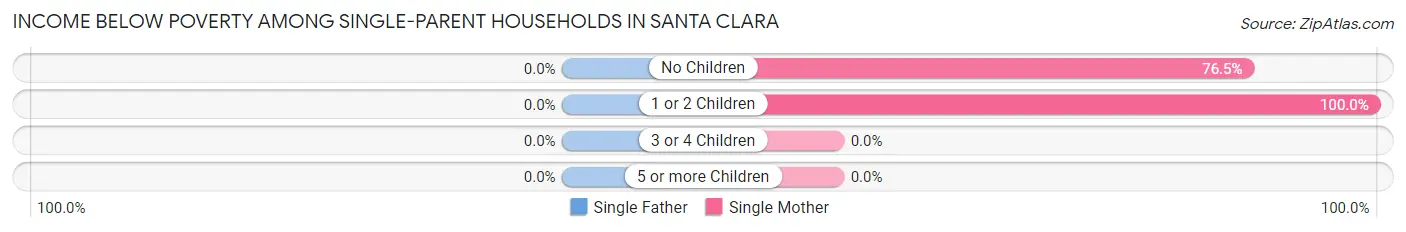
| Children | Single Father | Single Mother |
| No Children | 0 (0.0%) | 39 (76.5%) |
| 1 or 2 Children | 0 (0.0%) | 13 (100.0%) |
| 3 or 4 Children | 0 (0.0%) | 0 (0.0%) |
| 5 or more Children | 0 (0.0%) | 0 (0.0%) |
| Total | 0 (0.0%) | 52 (81.2%) |
Income Below Poverty Among Married-Couple vs Single-Parent Households in Santa Clara
The poverty data for Santa Clara shows that 25 of the married-couple family households (33.8%) and 52 of the single-parent households (81.2%) are living below the poverty level. Within the married-couple family households, those with no children have the highest poverty rate, with 25 households (33.8%) falling below the poverty line. Among the single-parent households, those with 1 or 2 children have the highest poverty rate, with 13 household (100.0%) living below poverty.
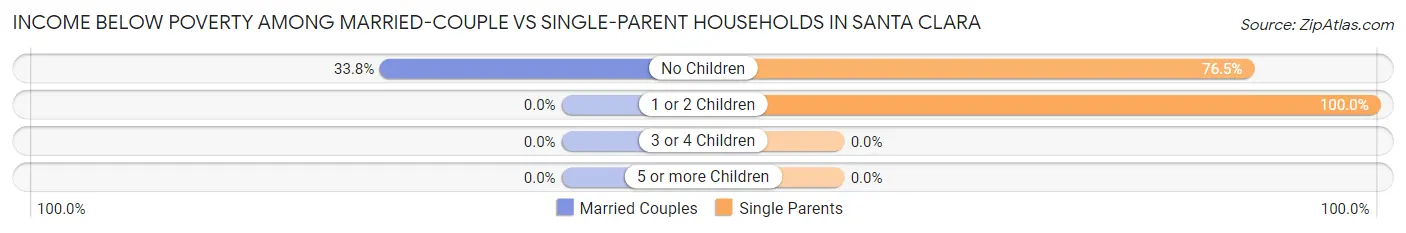
| Children | Married-Couple Families | Single-Parent Households |
| No Children | 25 (33.8%) | 39 (76.5%) |
| 1 or 2 Children | 0 (0.0%) | 13 (100.0%) |
| 3 or 4 Children | 0 (0.0%) | 0 (0.0%) |
| 5 or more Children | 0 (0.0%) | 0 (0.0%) |
| Total | 25 (33.8%) | 52 (81.2%) |
Race in Santa Clara
The most populous races in Santa Clara are Hispanic or Latino (438 | 100.0%), White / Caucasian (264 | 60.3%), and Some other Race (117 | 26.7%).
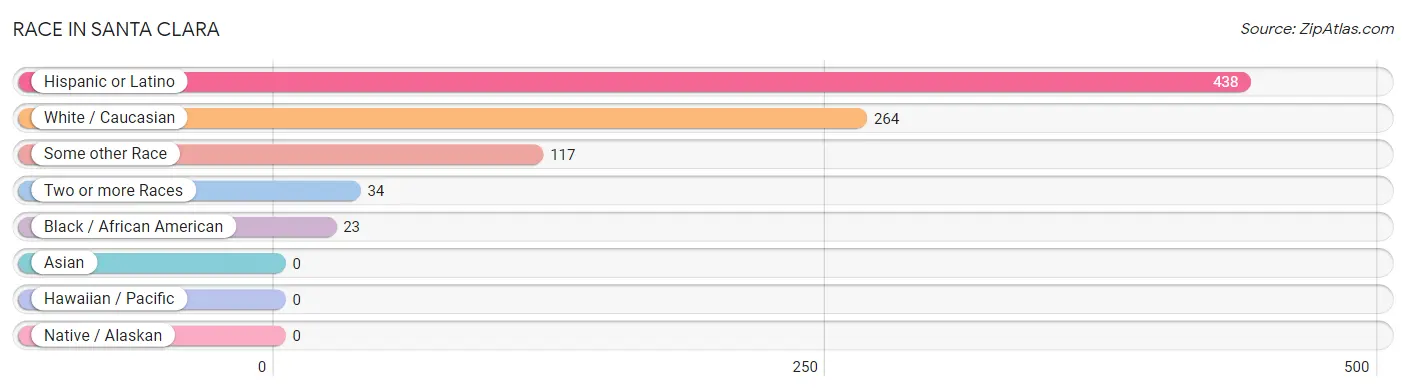
| Race | # Population | % Population |
| Asian | 0 | 0.0% |
| Black / African American | 23 | 5.2% |
| Hawaiian / Pacific | 0 | 0.0% |
| Hispanic or Latino | 438 | 100.0% |
| Native / Alaskan | 0 | 0.0% |
| White / Caucasian | 264 | 60.3% |
| Two or more Races | 34 | 7.8% |
| Some other Race | 117 | 26.7% |
| Total | 438 | 100.0% |
Ancestry in Santa Clara
The most populous ancestries reported in Santa Clara are Puerto Rican (438 | 100.0%), and American (22 | 5.0%), together accounting for 105.0% of all Santa Clara residents.
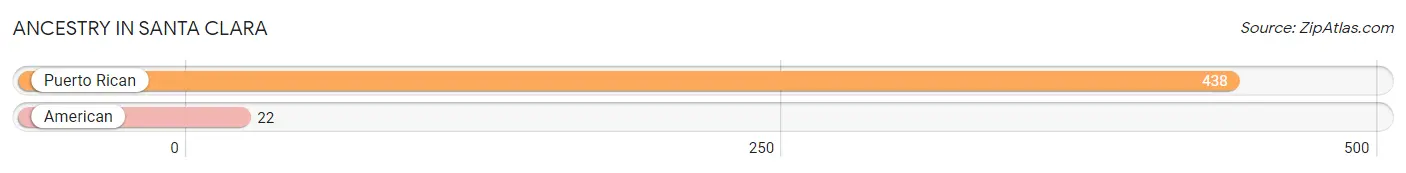
| Ancestry | # Population | % Population |
| American | 22 | 5.0% |
| Puerto Rican | 438 | 100.0% | View All 2 Rows |
Immigrants in Santa Clara

| Immigration Origin | # Population | % Population | View All 0 Rows |
Sex and Age in Santa Clara
Sex and Age in Santa Clara
The most populous age groups in Santa Clara are 20 to 24 Years (80 | 33.5%) for men and 65 to 69 Years (55 | 27.6%) for women.
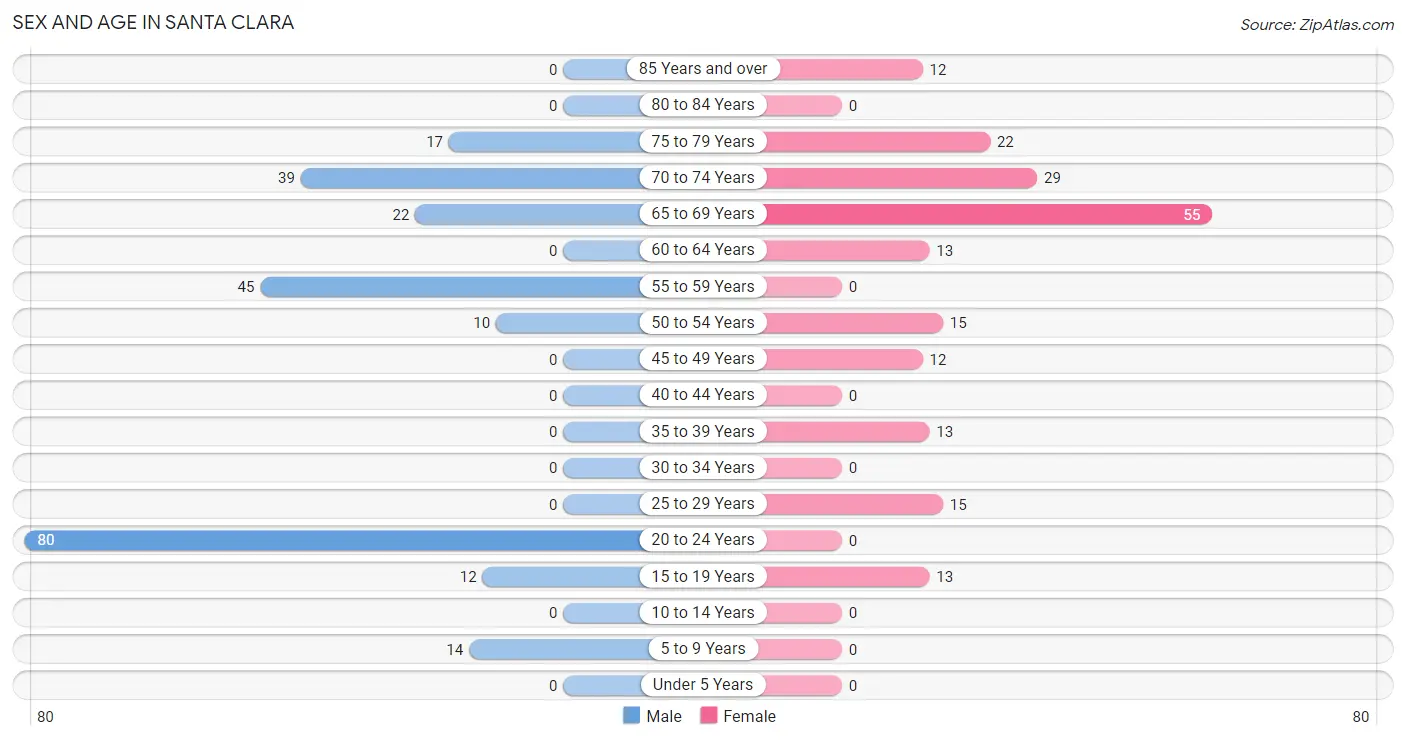
| Age Bracket | Male | Female |
| Under 5 Years | 0 (0.0%) | 0 (0.0%) |
| 5 to 9 Years | 14 (5.9%) | 0 (0.0%) |
| 10 to 14 Years | 0 (0.0%) | 0 (0.0%) |
| 15 to 19 Years | 12 (5.0%) | 13 (6.5%) |
| 20 to 24 Years | 80 (33.5%) | 0 (0.0%) |
| 25 to 29 Years | 0 (0.0%) | 15 (7.5%) |
| 30 to 34 Years | 0 (0.0%) | 0 (0.0%) |
| 35 to 39 Years | 0 (0.0%) | 13 (6.5%) |
| 40 to 44 Years | 0 (0.0%) | 0 (0.0%) |
| 45 to 49 Years | 0 (0.0%) | 12 (6.0%) |
| 50 to 54 Years | 10 (4.2%) | 15 (7.5%) |
| 55 to 59 Years | 45 (18.8%) | 0 (0.0%) |
| 60 to 64 Years | 0 (0.0%) | 13 (6.5%) |
| 65 to 69 Years | 22 (9.2%) | 55 (27.6%) |
| 70 to 74 Years | 39 (16.3%) | 29 (14.6%) |
| 75 to 79 Years | 17 (7.1%) | 22 (11.1%) |
| 80 to 84 Years | 0 (0.0%) | 0 (0.0%) |
| 85 Years and over | 0 (0.0%) | 12 (6.0%) |
| Total | 239 (100.0%) | 199 (100.0%) |
Families and Households in Santa Clara
Median Family Size in Santa Clara
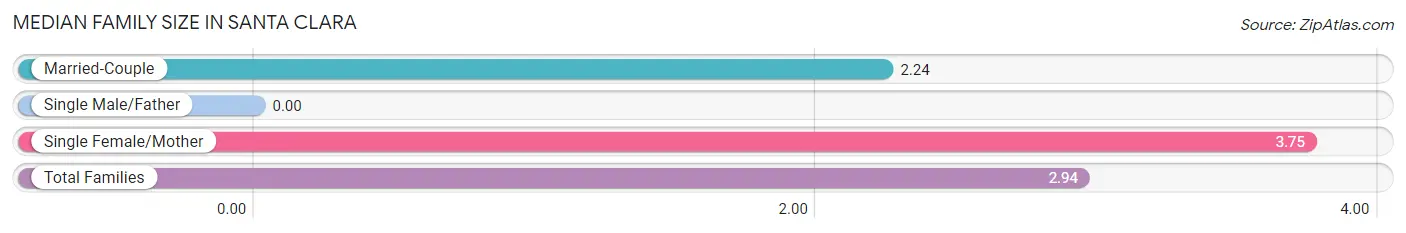
| Family Type | # Families | Family Size |
| Married-Couple | 74 (53.6%) | 2.24 |
| Single Male/Father | 0 (0.0%) | - |
| Single Female/Mother | 64 (46.4%) | 3.75 |
| Total Families | 138 (100.0%) | 2.94 |
Median Household Size in Santa Clara
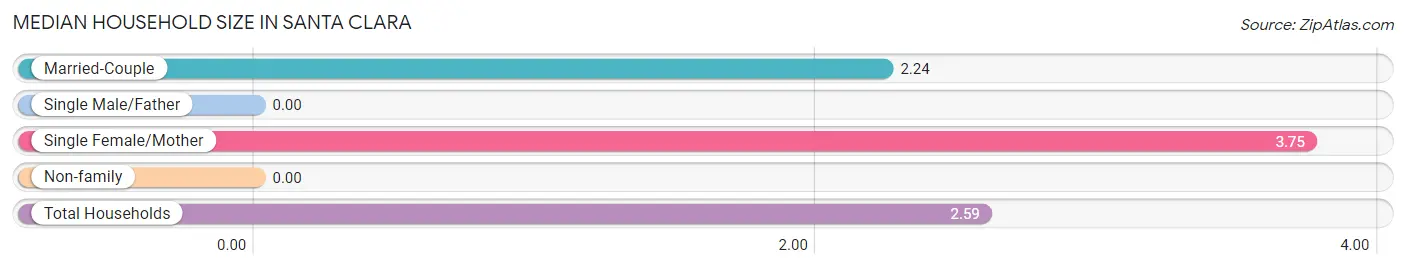
| Household Type | # Households | Household Size |
| Married-Couple | 74 (43.8%) | 2.24 |
| Single Male/Father | 0 (0.0%) | - |
| Single Female/Mother | 64 (37.9%) | 3.75 |
| Non-family | 31 (18.3%) | - |
| Total Households | 169 (100.0%) | 2.59 |
Household Size by Marriage Status in Santa Clara
Out of a total of 169 households in Santa Clara, 138 (81.7%) are family households, while 31 (18.3%) are nonfamily households. The most numerous type of family households are 2-person households, comprising 95, and the most common type of nonfamily households are 1-person households, comprising 31.
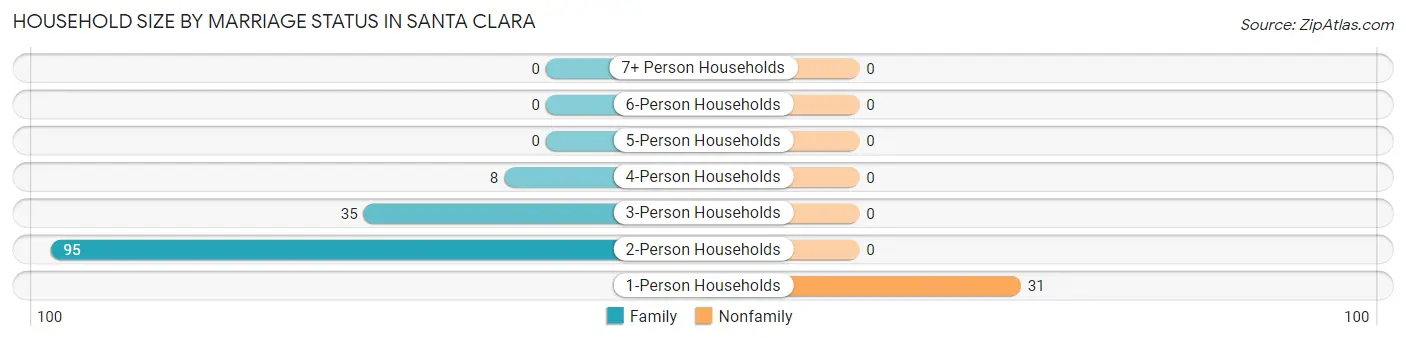
| Household Size | Family Households | Nonfamily Households |
| 1-Person Households | - | 31 (18.3%) |
| 2-Person Households | 95 (56.2%) | 0 (0.0%) |
| 3-Person Households | 35 (20.7%) | 0 (0.0%) |
| 4-Person Households | 8 (4.7%) | 0 (0.0%) |
| 5-Person Households | 0 (0.0%) | 0 (0.0%) |
| 6-Person Households | 0 (0.0%) | 0 (0.0%) |
| 7+ Person Households | 0 (0.0%) | 0 (0.0%) |
| Total | 138 (81.7%) | 31 (18.3%) |
Female Fertility in Santa Clara
Fertility by Age in Santa Clara
| Age Bracket | Women with Births | Births / 1,000 Women |
| 15 to 19 years | 0 (0.0%) | 0.0 |
| 20 to 34 years | 0 (0.0%) | 0.0 |
| 35 to 50 years | 0 (0.0%) | 0.0 |
| Total | 0 (0.0%) | 0.0 |
Fertility by Age by Marriage Status in Santa Clara
| Age Bracket | Married | Unmarried |
| 15 to 19 years | 0 (0.0%) | 0 (0.0%) |
| 20 to 34 years | 0 (0.0%) | 0 (0.0%) |
| 35 to 50 years | 0 (0.0%) | 0 (0.0%) |
| Total | 0 (0.0%) | 0 (0.0%) |
Fertility by Education in Santa Clara
| Educational Attainment | Women with Births | Births / 1,000 Women |
| Less than High School | 0 (0.0%) | 0.0 |
| High School Diploma | 0 (0.0%) | 0.0 |
| College or Associate's Degree | 0 (0.0%) | 0.0 |
| Bachelor's Degree | 0 (0.0%) | 0.0 |
| Graduate Degree | 0 (0.0%) | 0.0 |
| Total | 0 (0.0%) | 0.0 |
Fertility by Education by Marriage Status in Santa Clara
| Educational Attainment | Married | Unmarried |
| Less than High School | 0 (0.0%) | 0 (0.0%) |
| High School Diploma | 0 (0.0%) | 0 (0.0%) |
| College or Associate's Degree | 0 (0.0%) | 0 (0.0%) |
| Bachelor's Degree | 0 (0.0%) | 0 (0.0%) |
| Graduate Degree | 0 (0.0%) | 0 (0.0%) |
| Total | 0 (0.0%) | 0 (0.0%) |
Employment Characteristics in Santa Clara
Employment by Class of Employer in Santa Clara
Among the 39 employed individuals in Santa Clara, private company employees (29 | 74.4%), and local government employees (10 | 25.6%) make up the most common classes of employment.
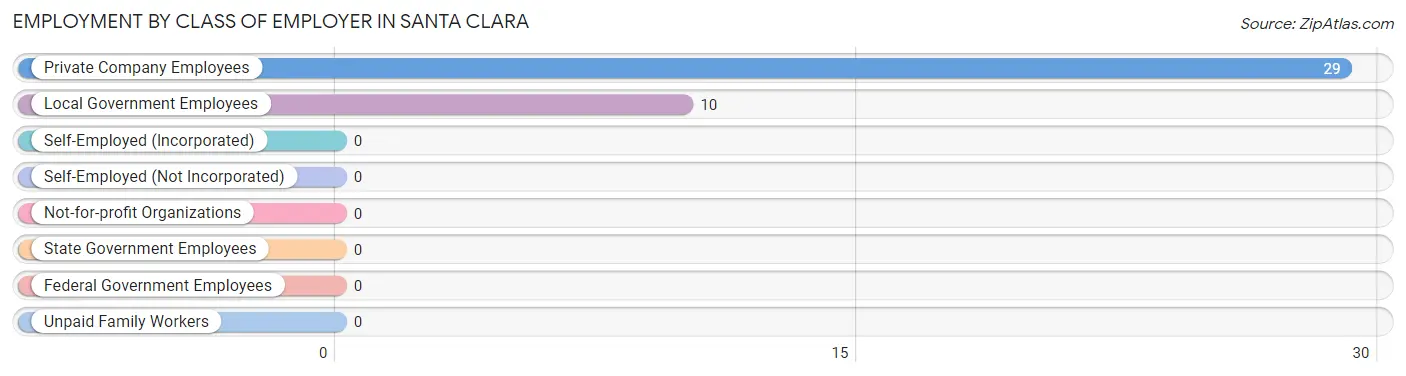
| Employer Class | # Employees | % Employees |
| Private Company Employees | 29 | 74.4% |
| Self-Employed (Incorporated) | 0 | 0.0% |
| Self-Employed (Not Incorporated) | 0 | 0.0% |
| Not-for-profit Organizations | 0 | 0.0% |
| Local Government Employees | 10 | 25.6% |
| State Government Employees | 0 | 0.0% |
| Federal Government Employees | 0 | 0.0% |
| Unpaid Family Workers | 0 | 0.0% |
| Total | 39 | 100.0% |
Employment Status by Age in Santa Clara
According to the labor force statistics for Santa Clara, out of the total population over 16 years of age (424), 12.3% or 52 individuals are in the labor force, with 25.0% or 13 of them unemployed. The age group with the highest labor force participation rate is 25 to 29 years, with 100.0% or 15 individuals in the labor force. Within the labor force, the 35 to 44 years age range has the highest percentage of unemployed individuals, with 100.0% or 13 of them being unemployed.
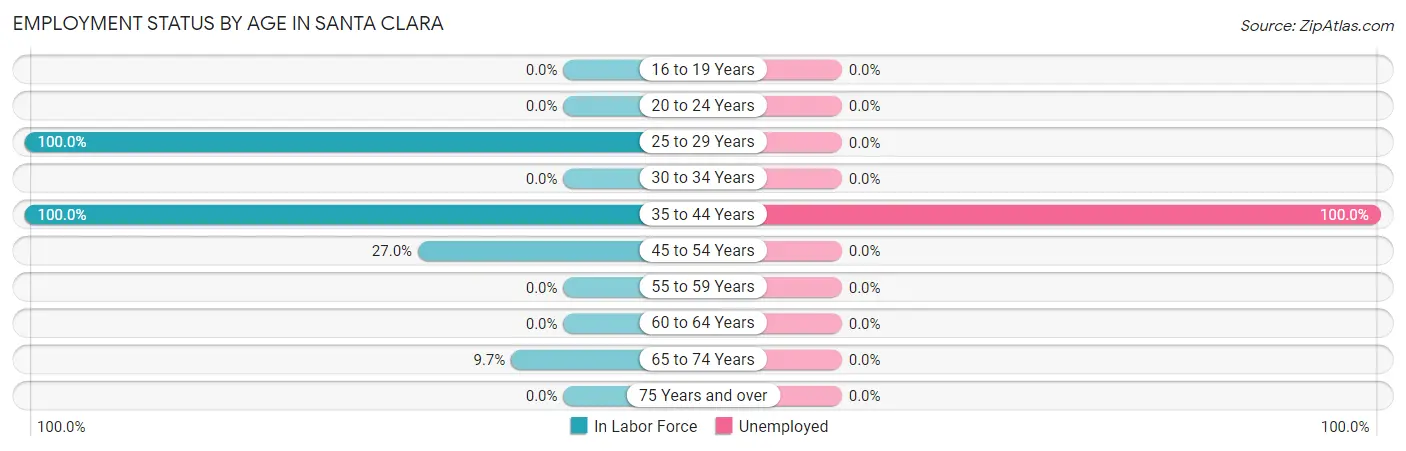
| Age Bracket | In Labor Force | Unemployed |
| 16 to 19 Years | 0 (0.0%) | 0 (0.0%) |
| 20 to 24 Years | 0 (0.0%) | 0 (0.0%) |
| 25 to 29 Years | 15 (100.0%) | 0 (0.0%) |
| 30 to 34 Years | 0 (0.0%) | 0 (0.0%) |
| 35 to 44 Years | 13 (100.0%) | 13 (100.0%) |
| 45 to 54 Years | 10 (27.0%) | 0 (0.0%) |
| 55 to 59 Years | 0 (0.0%) | 0 (0.0%) |
| 60 to 64 Years | 0 (0.0%) | 0 (0.0%) |
| 65 to 74 Years | 14 (9.7%) | 0 (0.0%) |
| 75 Years and over | 0 (0.0%) | 0 (0.0%) |
| Total | 52 (12.3%) | 13 (25.0%) |
Employment Status by Educational Attainment in Santa Clara
According to labor force statistics for Santa Clara, 30.9% of individuals (38) out of the total population between 25 and 64 years of age (123) are in the labor force, with 34.2% or 13 of them being unemployed. The group with the highest labor force participation rate are those with the educational attainment of college / associate degree, with 100.0% or 10 individuals in the labor force. Within the labor force, individuals with bachelor's degree or higher education have the highest percentage of unemployment, with 100.0% or 13 of them being unemployed.
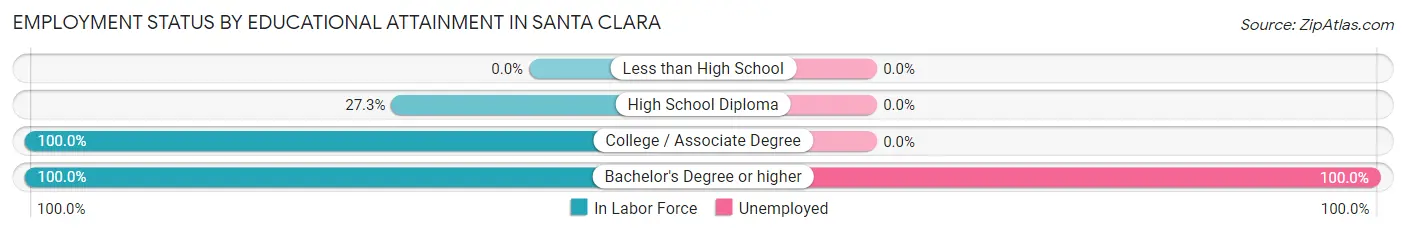
| Educational Attainment | In Labor Force | Unemployed |
| Less than High School | 0 (0.0%) | 0 (0.0%) |
| High School Diploma | 15 (27.3%) | 0 (0.0%) |
| College / Associate Degree | 10 (100.0%) | 0 (0.0%) |
| Bachelor's Degree or higher | 13 (100.0%) | 13 (100.0%) |
| Total | 38 (30.9%) | 42 (34.2%) |
Employment Occupations by Sex in Santa Clara
Management, Business, Science and Arts Occupations
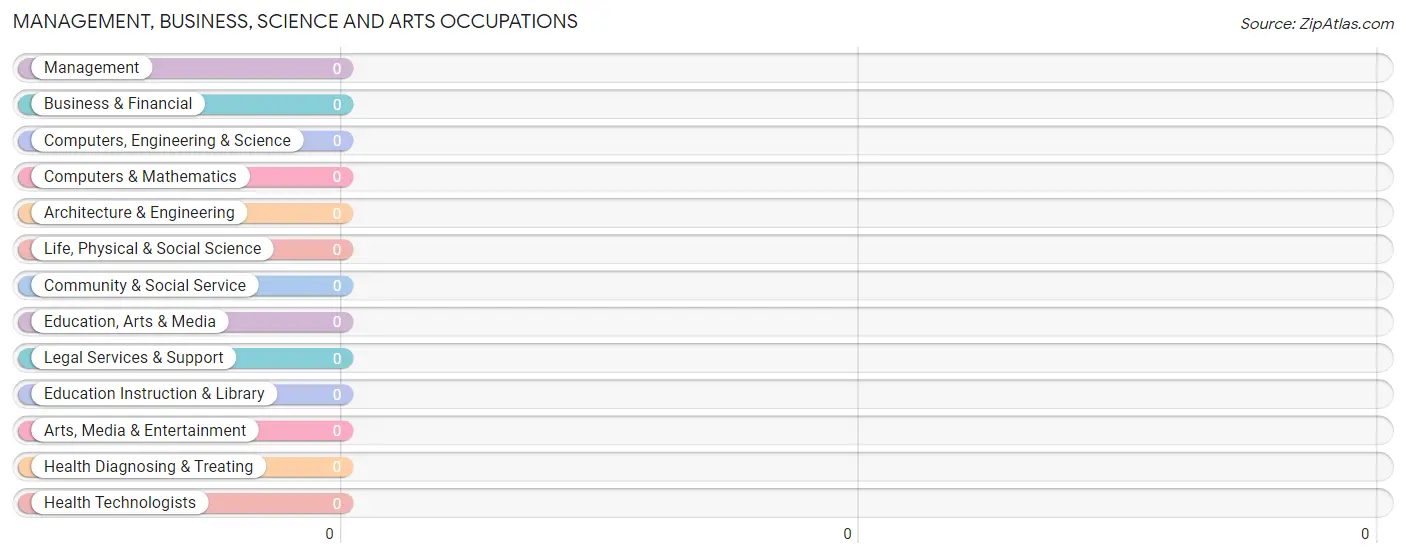
Management, Business, Science and Arts Occupations by Sex
| Occupation | Male | Female |
| Management | 0 (0.0%) | 0 (0.0%) |
| Business & Financial | 0 (0.0%) | 0 (0.0%) |
| Computers, Engineering & Science | 0 (0.0%) | 0 (0.0%) |
| Computers & Mathematics | 0 (0.0%) | 0 (0.0%) |
| Architecture & Engineering | 0 (0.0%) | 0 (0.0%) |
| Life, Physical & Social Science | 0 (0.0%) | 0 (0.0%) |
| Community & Social Service | 0 (0.0%) | 0 (0.0%) |
| Education, Arts & Media | 0 (0.0%) | 0 (0.0%) |
| Legal Services & Support | 0 (0.0%) | 0 (0.0%) |
| Education Instruction & Library | 0 (0.0%) | 0 (0.0%) |
| Arts, Media & Entertainment | 0 (0.0%) | 0 (0.0%) |
| Health Diagnosing & Treating | 0 (0.0%) | 0 (0.0%) |
| Health Technologists | 0 (0.0%) | 0 (0.0%) |
| Total (Category) | 0 (0.0%) | 0 (0.0%) |
| Total (Overall) | 24 (61.5%) | 15 (38.5%) |
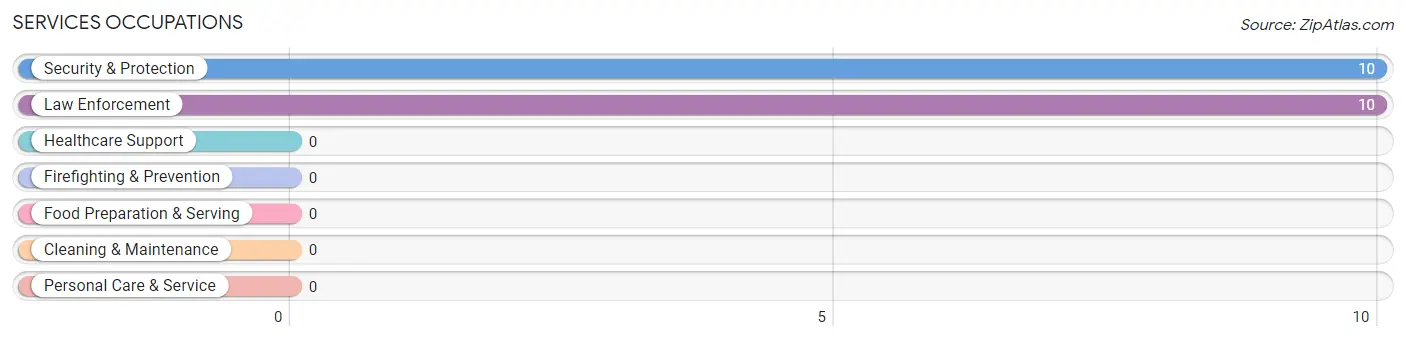
Services Occupations
The most common Services occupations in Santa Clara are Security & Protection (10 | 25.6%), and Law Enforcement (10 | 25.6%).
Services Occupations by Sex
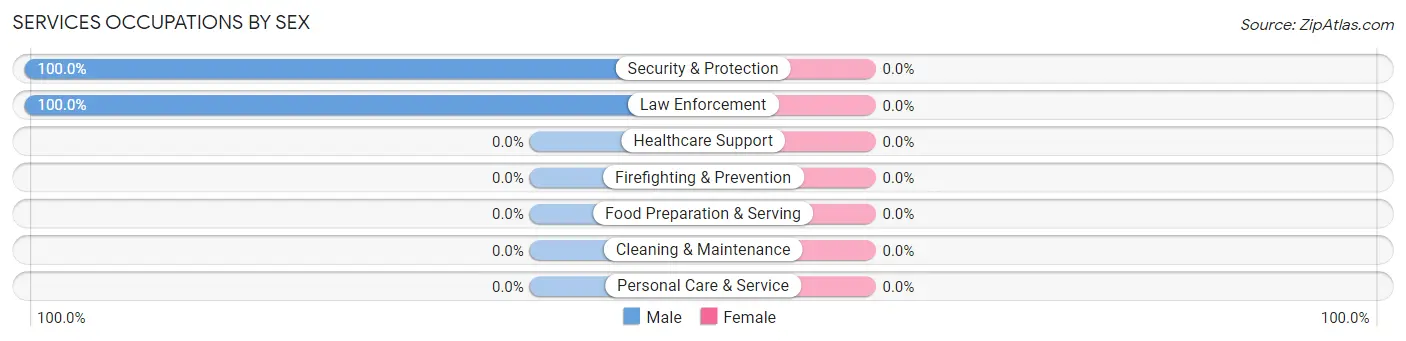
| Occupation | Male | Female |
| Healthcare Support | 0 (0.0%) | 0 (0.0%) |
| Security & Protection | 10 (100.0%) | 0 (0.0%) |
| Firefighting & Prevention | 0 (0.0%) | 0 (0.0%) |
| Law Enforcement | 10 (100.0%) | 0 (0.0%) |
| Food Preparation & Serving | 0 (0.0%) | 0 (0.0%) |
| Cleaning & Maintenance | 0 (0.0%) | 0 (0.0%) |
| Personal Care & Service | 0 (0.0%) | 0 (0.0%) |
| Total (Category) | 10 (100.0%) | 0 (0.0%) |
| Total (Overall) | 24 (61.5%) | 15 (38.5%) |
Sales and Office Occupations
The most common Sales and Office occupations in Santa Clara are , and Sales & Related (15 | 38.5%).
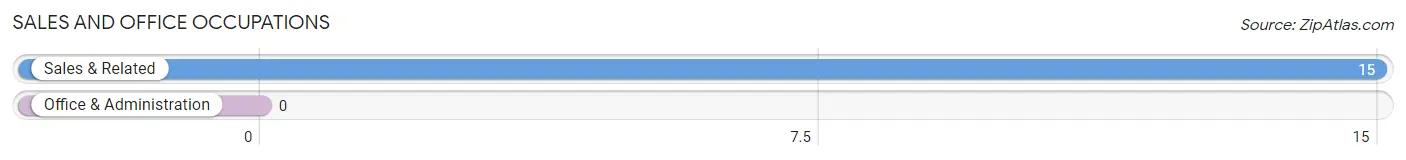
Sales and Office Occupations by Sex
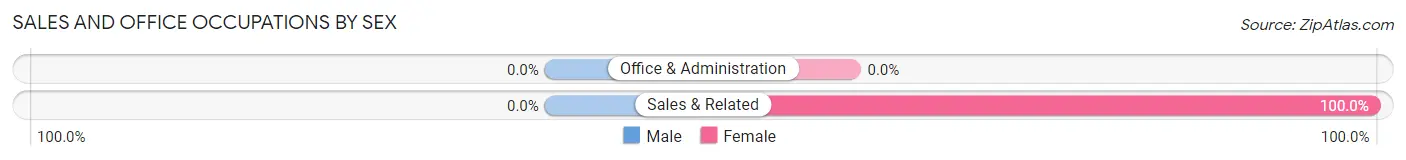
| Occupation | Male | Female |
| Sales & Related | 0 (0.0%) | 15 (100.0%) |
| Office & Administration | 0 (0.0%) | 0 (0.0%) |
| Total (Category) | 0 (0.0%) | 15 (100.0%) |
| Total (Overall) | 24 (61.5%) | 15 (38.5%) |
Natural Resources, Construction and Maintenance Occupations
The most common Natural Resources, Construction and Maintenance occupations in Santa Clara are , and Construction & Extraction (14 | 35.9%).
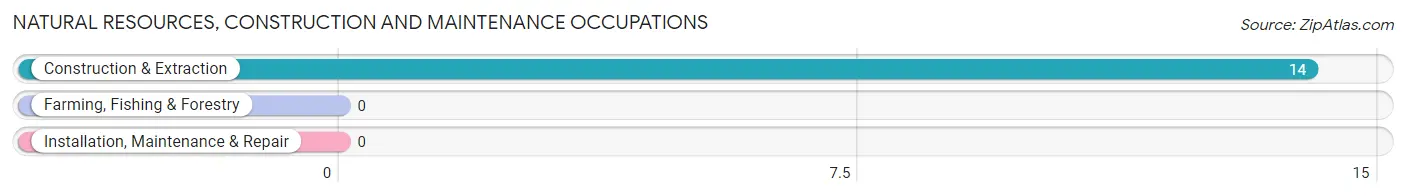
Natural Resources, Construction and Maintenance Occupations by Sex
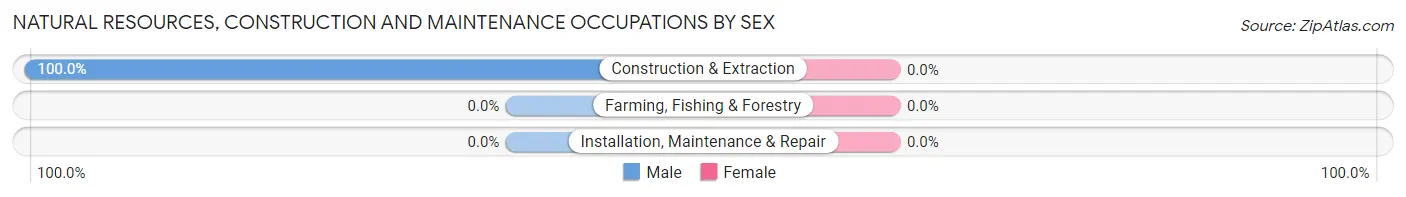
| Occupation | Male | Female |
| Farming, Fishing & Forestry | 0 (0.0%) | 0 (0.0%) |
| Construction & Extraction | 14 (100.0%) | 0 (0.0%) |
| Installation, Maintenance & Repair | 0 (0.0%) | 0 (0.0%) |
| Total (Category) | 14 (100.0%) | 0 (0.0%) |
| Total (Overall) | 24 (61.5%) | 15 (38.5%) |
Production, Transportation and Moving Occupations
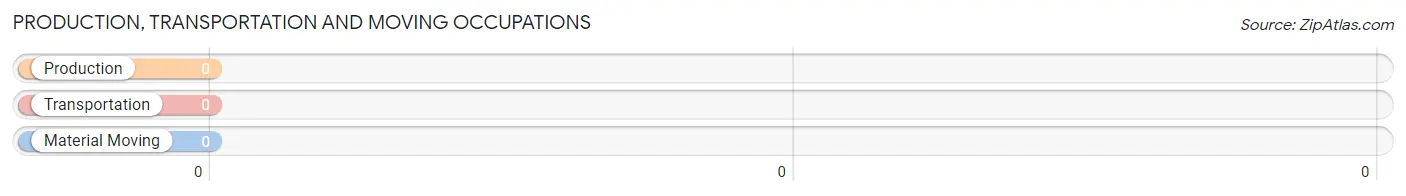
Production, Transportation and Moving Occupations by Sex
| Occupation | Male | Female |
| Production | 0 (0.0%) | 0 (0.0%) |
| Transportation | 0 (0.0%) | 0 (0.0%) |
| Material Moving | 0 (0.0%) | 0 (0.0%) |
| Total (Category) | 0 (0.0%) | 0 (0.0%) |
| Total (Overall) | 24 (61.5%) | 15 (38.5%) |
Employment Industries by Sex in Santa Clara
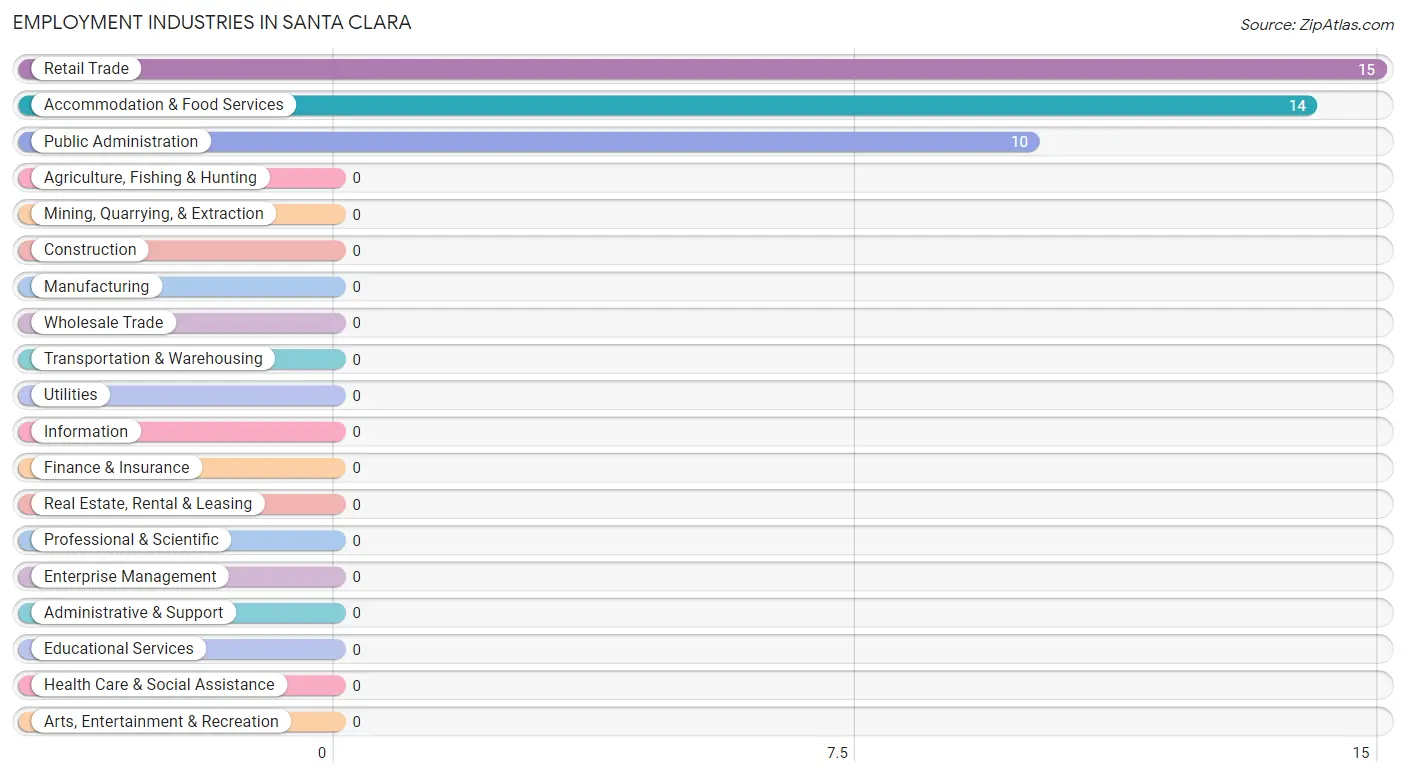
Employment Industries in Santa Clara
The major employment industries in Santa Clara include Retail Trade (15 | 38.5%), Accommodation & Food Services (14 | 35.9%), and Public Administration (10 | 25.6%).
Employment Industries by Sex in Santa Clara
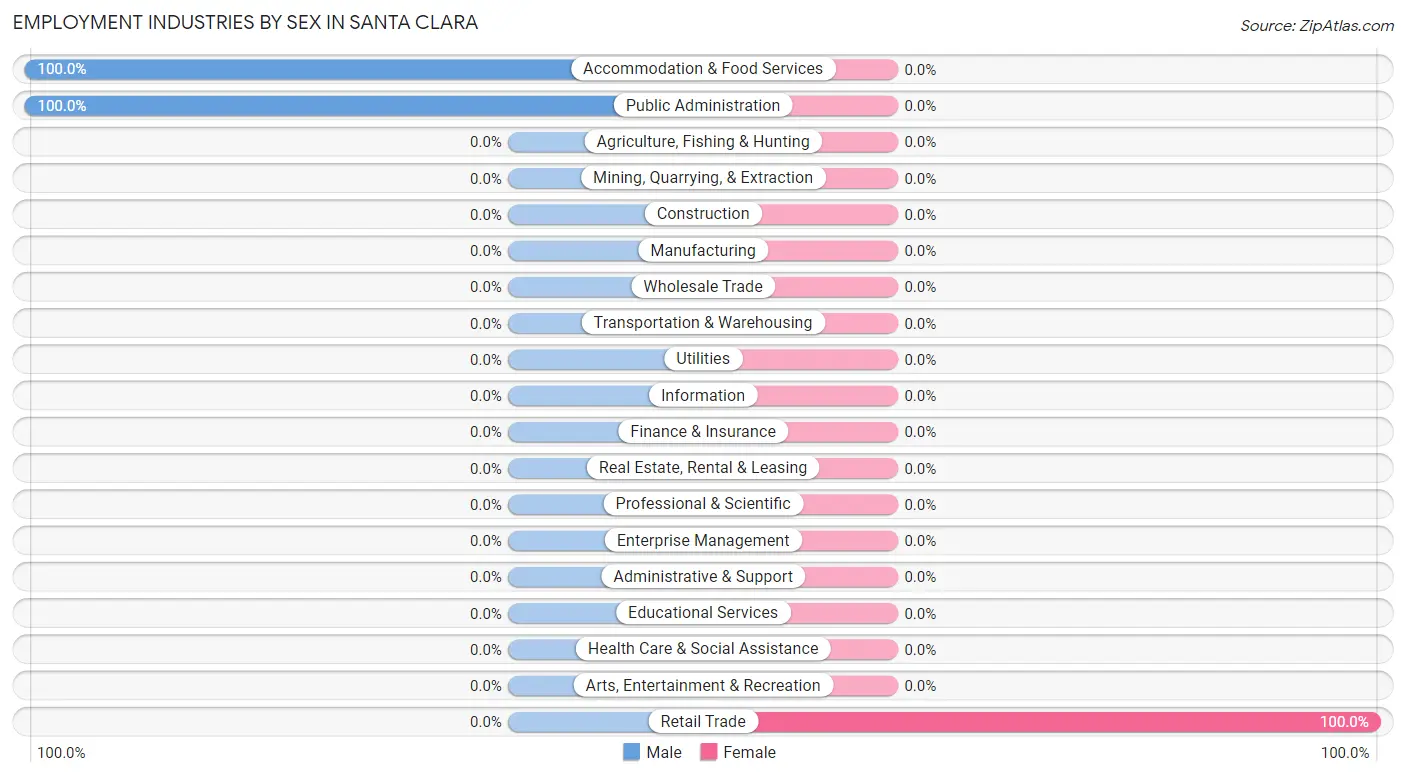
| Industry | Male | Female |
| Agriculture, Fishing & Hunting | 0 (0.0%) | 0 (0.0%) |
| Mining, Quarrying, & Extraction | 0 (0.0%) | 0 (0.0%) |
| Construction | 0 (0.0%) | 0 (0.0%) |
| Manufacturing | 0 (0.0%) | 0 (0.0%) |
| Wholesale Trade | 0 (0.0%) | 0 (0.0%) |
| Retail Trade | 0 (0.0%) | 15 (100.0%) |
| Transportation & Warehousing | 0 (0.0%) | 0 (0.0%) |
| Utilities | 0 (0.0%) | 0 (0.0%) |
| Information | 0 (0.0%) | 0 (0.0%) |
| Finance & Insurance | 0 (0.0%) | 0 (0.0%) |
| Real Estate, Rental & Leasing | 0 (0.0%) | 0 (0.0%) |
| Professional & Scientific | 0 (0.0%) | 0 (0.0%) |
| Enterprise Management | 0 (0.0%) | 0 (0.0%) |
| Administrative & Support | 0 (0.0%) | 0 (0.0%) |
| Educational Services | 0 (0.0%) | 0 (0.0%) |
| Health Care & Social Assistance | 0 (0.0%) | 0 (0.0%) |
| Arts, Entertainment & Recreation | 0 (0.0%) | 0 (0.0%) |
| Accommodation & Food Services | 14 (100.0%) | 0 (0.0%) |
| Public Administration | 10 (100.0%) | 0 (0.0%) |
| Total | 24 (61.5%) | 15 (38.5%) |
Education in Santa Clara
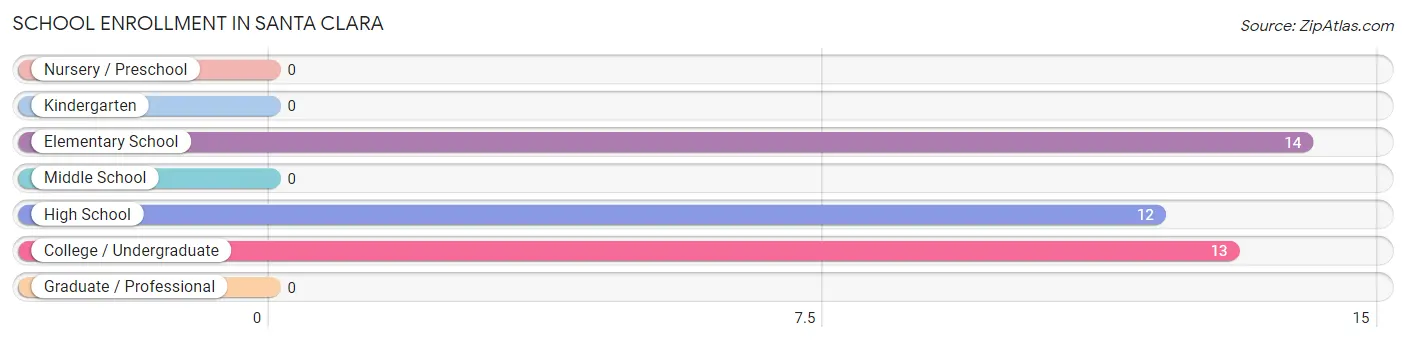
School Enrollment in Santa Clara
The most common levels of schooling among the 39 students in Santa Clara are elementary school (14 | 35.9%), college / undergraduate (13 | 33.3%), and high school (12 | 30.8%).
| School Level | # Students | % Students |
| Nursery / Preschool | 0 | 0.0% |
| Kindergarten | 0 | 0.0% |
| Elementary School | 14 | 35.9% |
| Middle School | 0 | 0.0% |
| High School | 12 | 30.8% |
| College / Undergraduate | 13 | 33.3% |
| Graduate / Professional | 0 | 0.0% |
| Total | 39 | 100.0% |
School Enrollment by Age by Funding Source in Santa Clara
Out of a total of 39 students who are enrolled in schools in Santa Clara, 13 (33.3%) attend a private institution, while the remaining 26 (66.7%) are enrolled in public schools. The age group of 35 years and over has the highest likelihood of being enrolled in private schools, with 13 (100.0% in the age bracket) enrolled. Conversely, the age group of 5 to 9 year old has the lowest likelihood of being enrolled in a private school, with 14 (100.0% in the age bracket) attending a public institution.
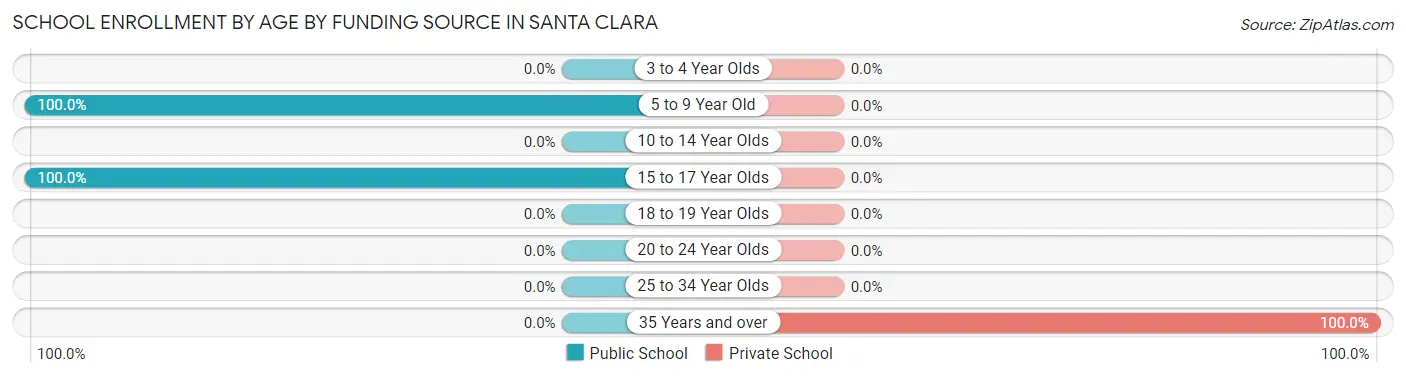
| Age Bracket | Public School | Private School |
| 3 to 4 Year Olds | 0 (0.0%) | 0 (0.0%) |
| 5 to 9 Year Old | 14 (100.0%) | 0 (0.0%) |
| 10 to 14 Year Olds | 0 (0.0%) | 0 (0.0%) |
| 15 to 17 Year Olds | 12 (100.0%) | 0 (0.0%) |
| 18 to 19 Year Olds | 0 (0.0%) | 0 (0.0%) |
| 20 to 24 Year Olds | 0 (0.0%) | 0 (0.0%) |
| 25 to 34 Year Olds | 0 (0.0%) | 0 (0.0%) |
| 35 Years and over | 0 (0.0%) | 13 (100.0%) |
| Total | 26 (66.7%) | 13 (33.3%) |
Educational Attainment by Field of Study in Santa Clara
Science & technology (13 | 59.1%), and education (9 | 40.9%) are the most common fields of study among 22 individuals in Santa Clara who have obtained a bachelor's degree or higher.
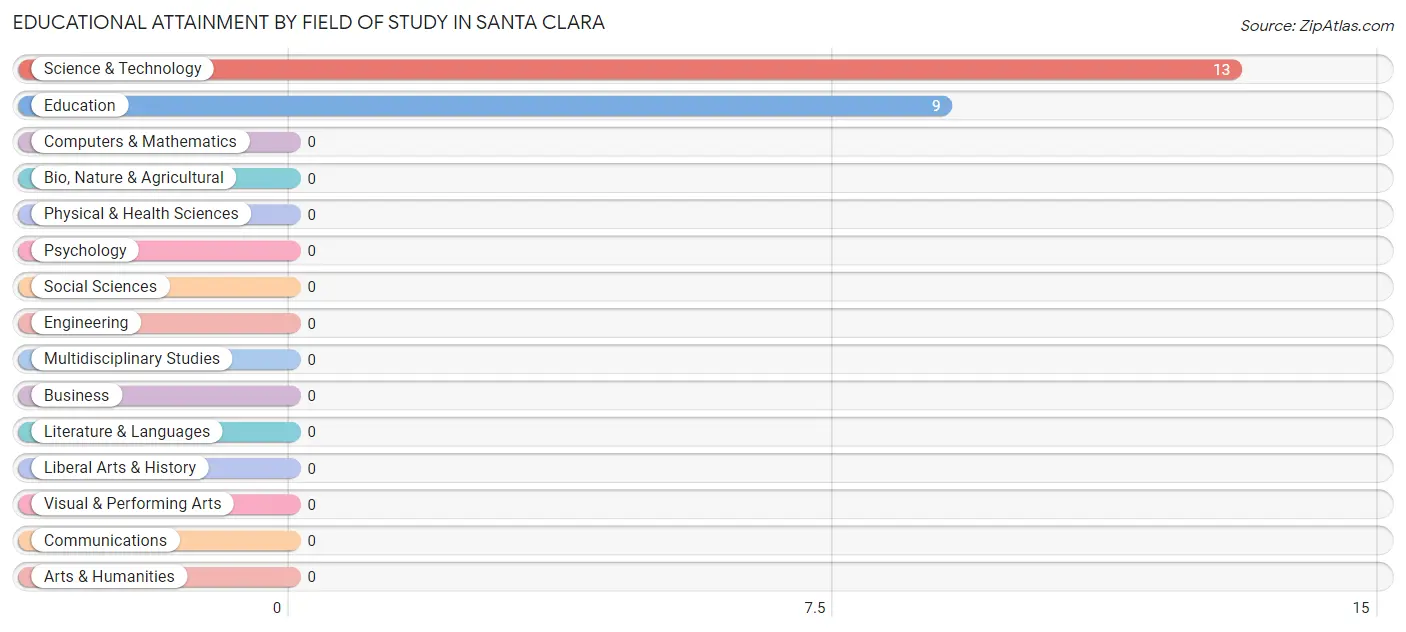
| Field of Study | # Graduates | % Graduates |
| Computers & Mathematics | 0 | 0.0% |
| Bio, Nature & Agricultural | 0 | 0.0% |
| Physical & Health Sciences | 0 | 0.0% |
| Psychology | 0 | 0.0% |
| Social Sciences | 0 | 0.0% |
| Engineering | 0 | 0.0% |
| Multidisciplinary Studies | 0 | 0.0% |
| Science & Technology | 13 | 59.1% |
| Business | 0 | 0.0% |
| Education | 9 | 40.9% |
| Literature & Languages | 0 | 0.0% |
| Liberal Arts & History | 0 | 0.0% |
| Visual & Performing Arts | 0 | 0.0% |
| Communications | 0 | 0.0% |
| Arts & Humanities | 0 | 0.0% |
| Total | 22 | 100.0% |
Transportation & Commute in Santa Clara
Vehicle Availability by Sex in Santa Clara
The most prevalent vehicle ownership categories in Santa Clara are males with 2 vehicles (24, accounting for 100.0%) and females with 2 vehicles (15, making up 160.0%).
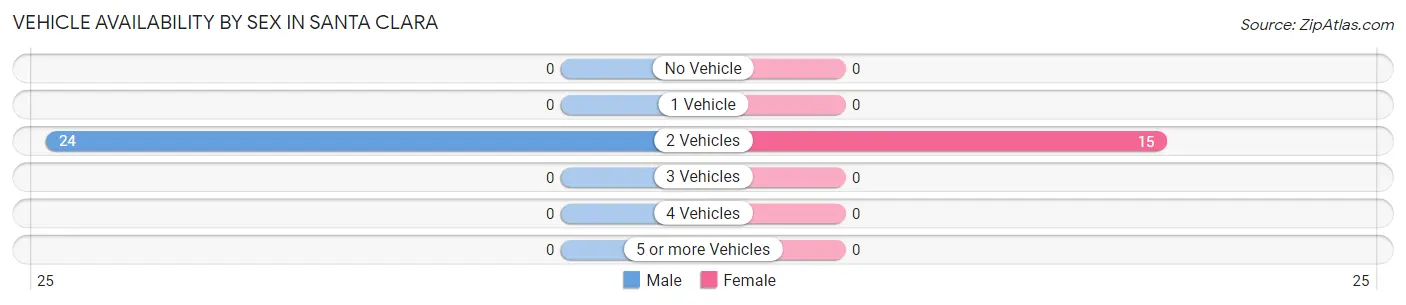
| Vehicles Available | Male | Female |
| No Vehicle | 0 (0.0%) | 0 (0.0%) |
| 1 Vehicle | 0 (0.0%) | 0 (0.0%) |
| 2 Vehicles | 24 (100.0%) | 15 (100.0%) |
| 3 Vehicles | 0 (0.0%) | 0 (0.0%) |
| 4 Vehicles | 0 (0.0%) | 0 (0.0%) |
| 5 or more Vehicles | 0 (0.0%) | 0 (0.0%) |
| Total | 24 (100.0%) | 15 (100.0%) |
Commute Time in Santa Clara
The most frequently occuring commute durations in Santa Clara are 30 to 34 minutes (15 commuters, 38.5%), 45 to 59 minutes (14 commuters, 35.9%), and 35 to 39 minutes (10 commuters, 25.6%).
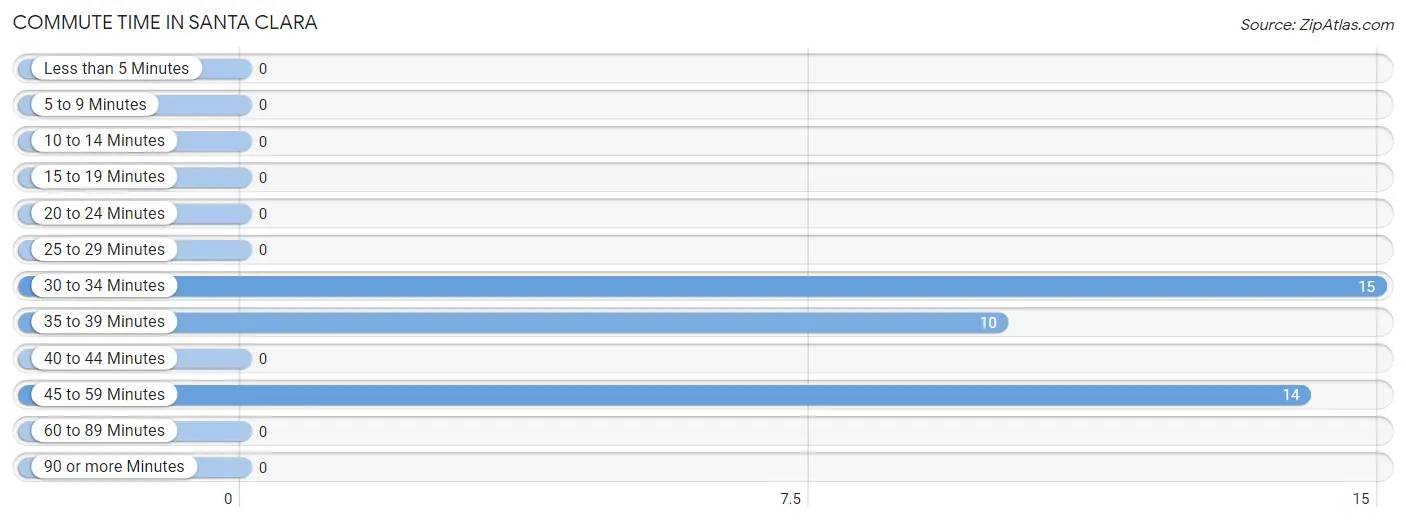
| Commute Time | # Commuters | % Commuters |
| Less than 5 Minutes | 0 | 0.0% |
| 5 to 9 Minutes | 0 | 0.0% |
| 10 to 14 Minutes | 0 | 0.0% |
| 15 to 19 Minutes | 0 | 0.0% |
| 20 to 24 Minutes | 0 | 0.0% |
| 25 to 29 Minutes | 0 | 0.0% |
| 30 to 34 Minutes | 15 | 38.5% |
| 35 to 39 Minutes | 10 | 25.6% |
| 40 to 44 Minutes | 0 | 0.0% |
| 45 to 59 Minutes | 14 | 35.9% |
| 60 to 89 Minutes | 0 | 0.0% |
| 90 or more Minutes | 0 | 0.0% |
Commute Time by Sex in Santa Clara
The most common commute times in Santa Clara are 45 to 59 minutes (14 commuters, 58.3%) for males and 30 to 34 minutes (15 commuters, 100.0%) for females.
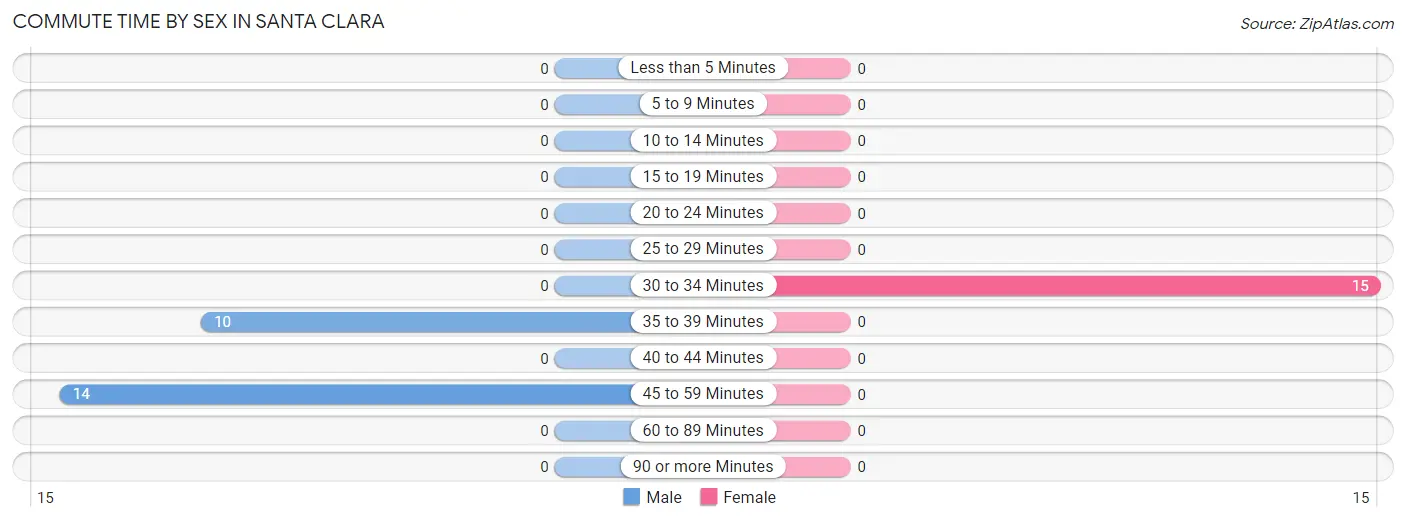
| Commute Time | Male | Female |
| Less than 5 Minutes | 0 (0.0%) | 0 (0.0%) |
| 5 to 9 Minutes | 0 (0.0%) | 0 (0.0%) |
| 10 to 14 Minutes | 0 (0.0%) | 0 (0.0%) |
| 15 to 19 Minutes | 0 (0.0%) | 0 (0.0%) |
| 20 to 24 Minutes | 0 (0.0%) | 0 (0.0%) |
| 25 to 29 Minutes | 0 (0.0%) | 0 (0.0%) |
| 30 to 34 Minutes | 0 (0.0%) | 15 (100.0%) |
| 35 to 39 Minutes | 10 (41.7%) | 0 (0.0%) |
| 40 to 44 Minutes | 0 (0.0%) | 0 (0.0%) |
| 45 to 59 Minutes | 14 (58.3%) | 0 (0.0%) |
| 60 to 89 Minutes | 0 (0.0%) | 0 (0.0%) |
| 90 or more Minutes | 0 (0.0%) | 0 (0.0%) |
Time of Departure to Work by Sex in Santa Clara
The most frequent times of departure to work in Santa Clara are 5:30 AM to 5:59 AM (14, 58.3%) for males and 7:00 AM to 7:29 AM (15, 100.0%) for females.
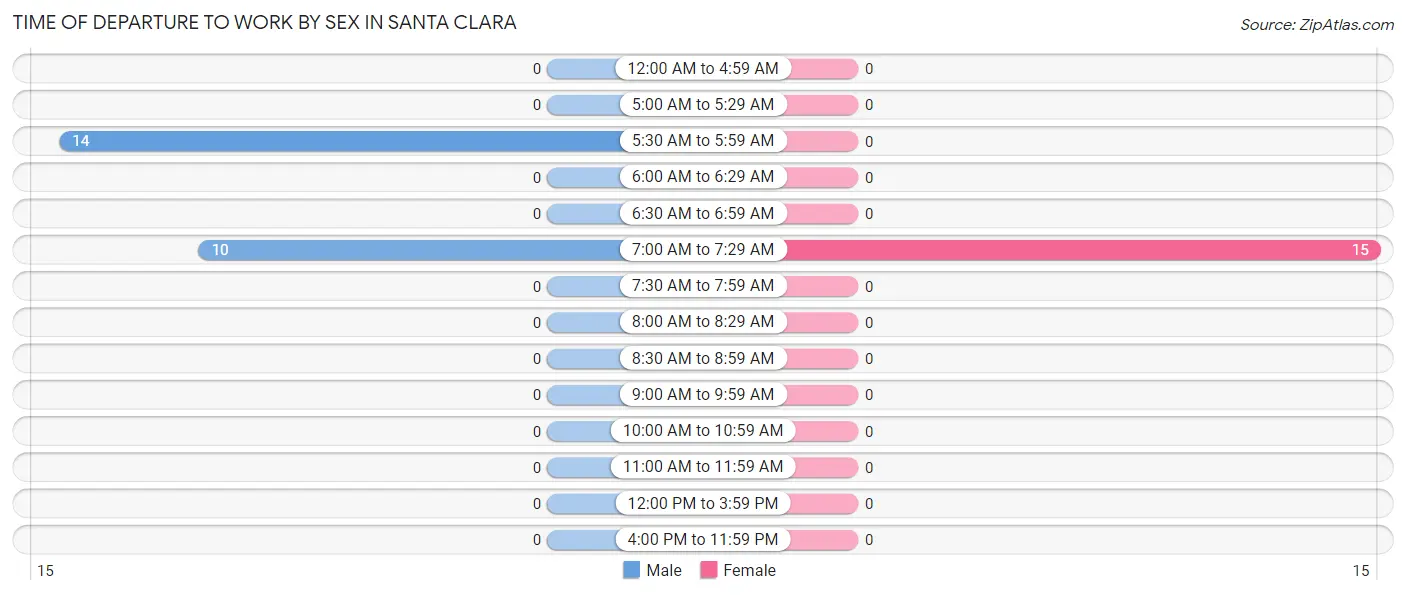
| Time of Departure | Male | Female |
| 12:00 AM to 4:59 AM | 0 (0.0%) | 0 (0.0%) |
| 5:00 AM to 5:29 AM | 0 (0.0%) | 0 (0.0%) |
| 5:30 AM to 5:59 AM | 14 (58.3%) | 0 (0.0%) |
| 6:00 AM to 6:29 AM | 0 (0.0%) | 0 (0.0%) |
| 6:30 AM to 6:59 AM | 0 (0.0%) | 0 (0.0%) |
| 7:00 AM to 7:29 AM | 10 (41.7%) | 15 (100.0%) |
| 7:30 AM to 7:59 AM | 0 (0.0%) | 0 (0.0%) |
| 8:00 AM to 8:29 AM | 0 (0.0%) | 0 (0.0%) |
| 8:30 AM to 8:59 AM | 0 (0.0%) | 0 (0.0%) |
| 9:00 AM to 9:59 AM | 0 (0.0%) | 0 (0.0%) |
| 10:00 AM to 10:59 AM | 0 (0.0%) | 0 (0.0%) |
| 11:00 AM to 11:59 AM | 0 (0.0%) | 0 (0.0%) |
| 12:00 PM to 3:59 PM | 0 (0.0%) | 0 (0.0%) |
| 4:00 PM to 11:59 PM | 0 (0.0%) | 0 (0.0%) |
| Total | 24 (100.0%) | 15 (100.0%) |
Housing Occupancy in Santa Clara
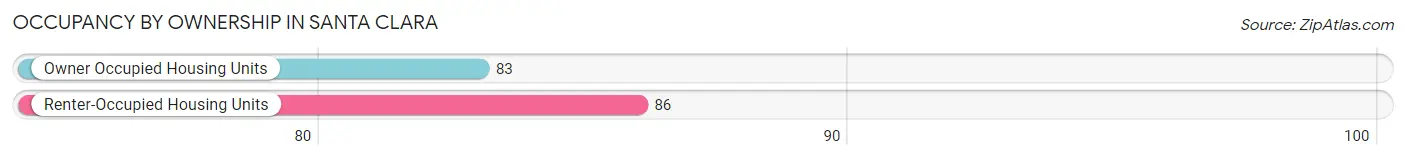
Occupancy by Ownership in Santa Clara
Of the total 169 dwellings in Santa Clara, owner-occupied units account for 83 (49.1%), while renter-occupied units make up 86 (50.9%).
| Occupancy | # Housing Units | % Housing Units |
| Owner Occupied Housing Units | 83 | 49.1% |
| Renter-Occupied Housing Units | 86 | 50.9% |
| Total Occupied Housing Units | 169 | 100.0% |
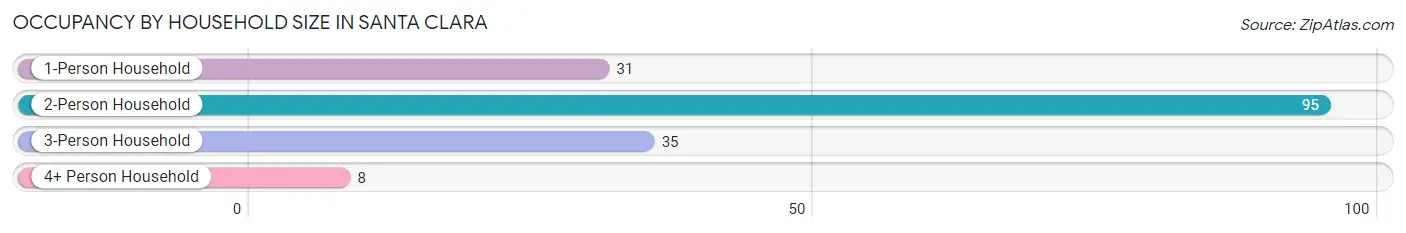
Occupancy by Household Size in Santa Clara
| Household Size | # Housing Units | % Housing Units |
| 1-Person Household | 31 | 18.3% |
| 2-Person Household | 95 | 56.2% |
| 3-Person Household | 35 | 20.7% |
| 4+ Person Household | 8 | 4.7% |
| Total Housing Units | 169 | 100.0% |
Occupancy by Ownership by Household Size in Santa Clara
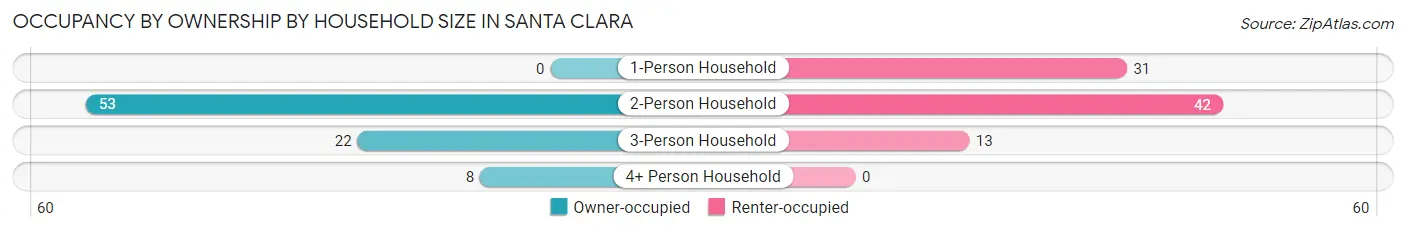
| Household Size | Owner-occupied | Renter-occupied |
| 1-Person Household | 0 (0.0%) | 31 (100.0%) |
| 2-Person Household | 53 (55.8%) | 42 (44.2%) |
| 3-Person Household | 22 (62.9%) | 13 (37.1%) |
| 4+ Person Household | 8 (100.0%) | 0 (0.0%) |
| Total Housing Units | 83 (49.1%) | 86 (50.9%) |
Occupancy by Educational Attainment in Santa Clara
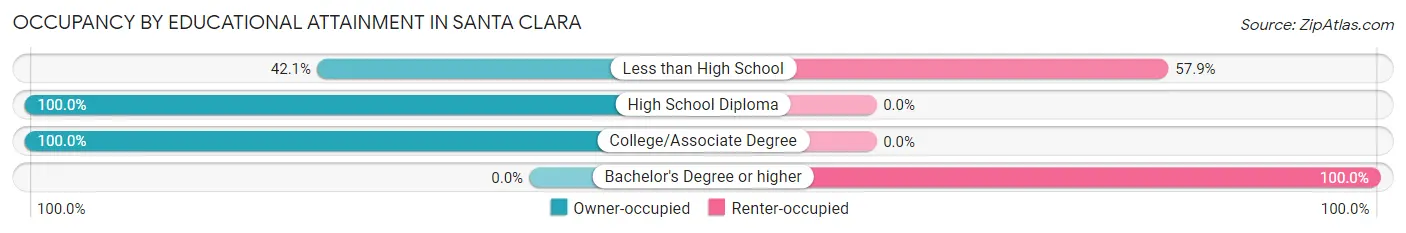
| Household Size | Owner-occupied | Renter-occupied |
| Less than High School | 53 (42.1%) | 73 (57.9%) |
| High School Diploma | 20 (100.0%) | 0 (0.0%) |
| College/Associate Degree | 10 (100.0%) | 0 (0.0%) |
| Bachelor's Degree or higher | 0 (0.0%) | 13 (100.0%) |
Occupancy by Age of Householder in Santa Clara
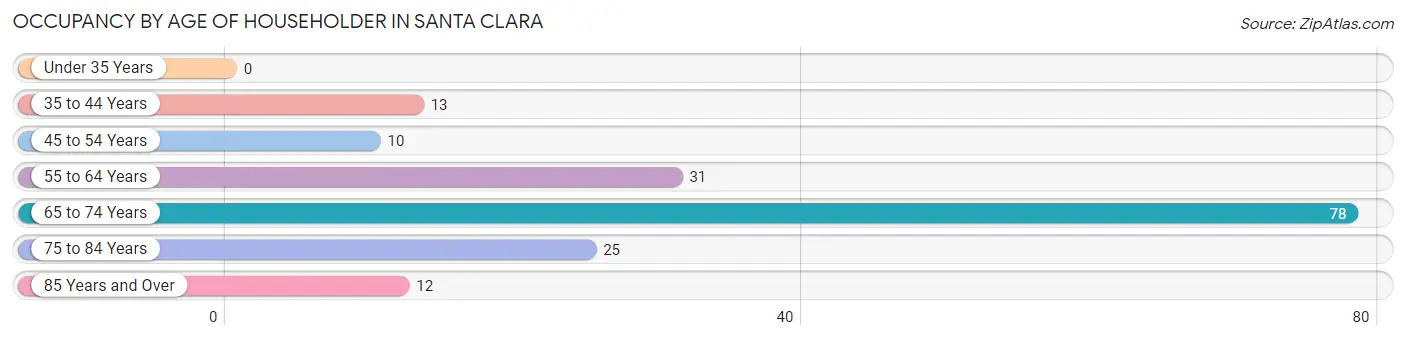
| Age Bracket | # Households | % Households |
| Under 35 Years | 0 | 0.0% |
| 35 to 44 Years | 13 | 7.7% |
| 45 to 54 Years | 10 | 5.9% |
| 55 to 64 Years | 31 | 18.3% |
| 65 to 74 Years | 78 | 46.2% |
| 75 to 84 Years | 25 | 14.8% |
| 85 Years and Over | 12 | 7.1% |
| Total | 169 | 100.0% |
Housing Finances in Santa Clara
Median Income by Occupancy in Santa Clara
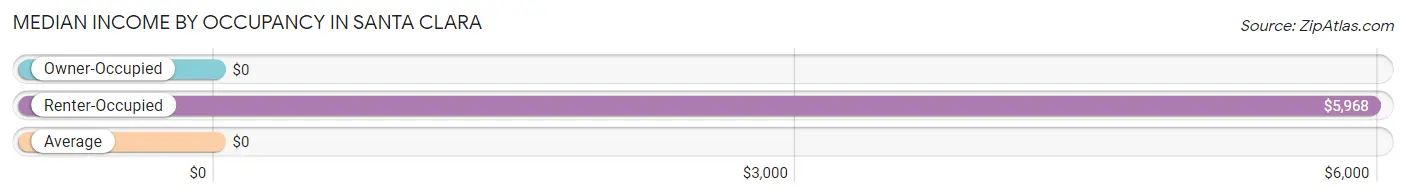
| Occupancy Type | # Households | Median Income |
| Owner-Occupied | 83 (49.1%) | $0 |
| Renter-Occupied | 86 (50.9%) | $5,968 |
| Average | 169 (100.0%) | $0 |
Occupancy by Householder Income Bracket in Santa Clara
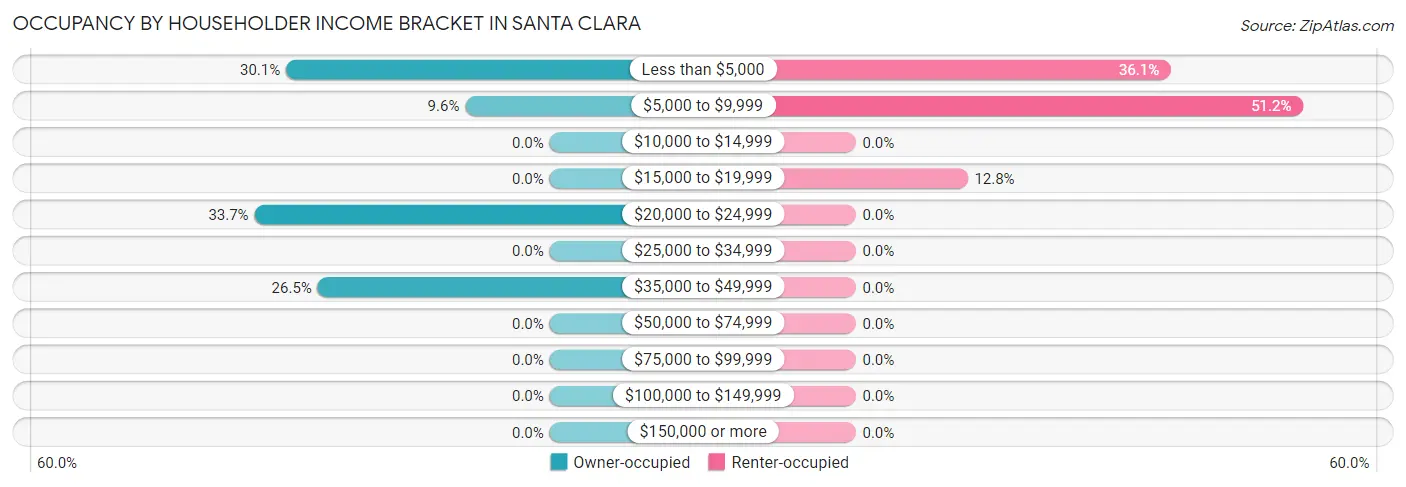
| Income Bracket | Owner-occupied | Renter-occupied |
| Less than $5,000 | 25 (30.1%) | 31 (36.0%) |
| $5,000 to $9,999 | 8 (9.6%) | 44 (51.2%) |
| $10,000 to $14,999 | 0 (0.0%) | 0 (0.0%) |
| $15,000 to $19,999 | 0 (0.0%) | 11 (12.8%) |
| $20,000 to $24,999 | 28 (33.7%) | 0 (0.0%) |
| $25,000 to $34,999 | 0 (0.0%) | 0 (0.0%) |
| $35,000 to $49,999 | 22 (26.5%) | 0 (0.0%) |
| $50,000 to $74,999 | 0 (0.0%) | 0 (0.0%) |
| $75,000 to $99,999 | 0 (0.0%) | 0 (0.0%) |
| $100,000 to $149,999 | 0 (0.0%) | 0 (0.0%) |
| $150,000 or more | 0 (0.0%) | 0 (0.0%) |
| Total | 83 (100.0%) | 86 (100.0%) |
Monthly Housing Cost Tiers in Santa Clara
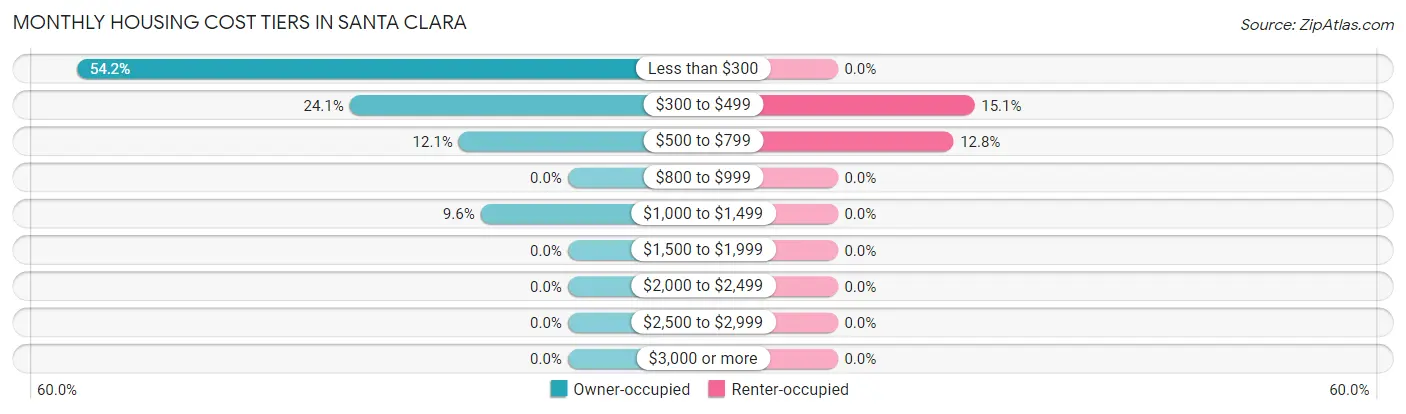
| Monthly Cost | Owner-occupied | Renter-occupied |
| Less than $300 | 45 (54.2%) | 0 (0.0%) |
| $300 to $499 | 20 (24.1%) | 13 (15.1%) |
| $500 to $799 | 10 (12.0%) | 11 (12.8%) |
| $800 to $999 | 0 (0.0%) | 0 (0.0%) |
| $1,000 to $1,499 | 8 (9.6%) | 0 (0.0%) |
| $1,500 to $1,999 | 0 (0.0%) | 0 (0.0%) |
| $2,000 to $2,499 | 0 (0.0%) | 0 (0.0%) |
| $2,500 to $2,999 | 0 (0.0%) | 0 (0.0%) |
| $3,000 or more | 0 (0.0%) | 0 (0.0%) |
| Total | 83 (100.0%) | 86 (100.0%) |
Physical Housing Characteristics in Santa Clara
Housing Structures in Santa Clara
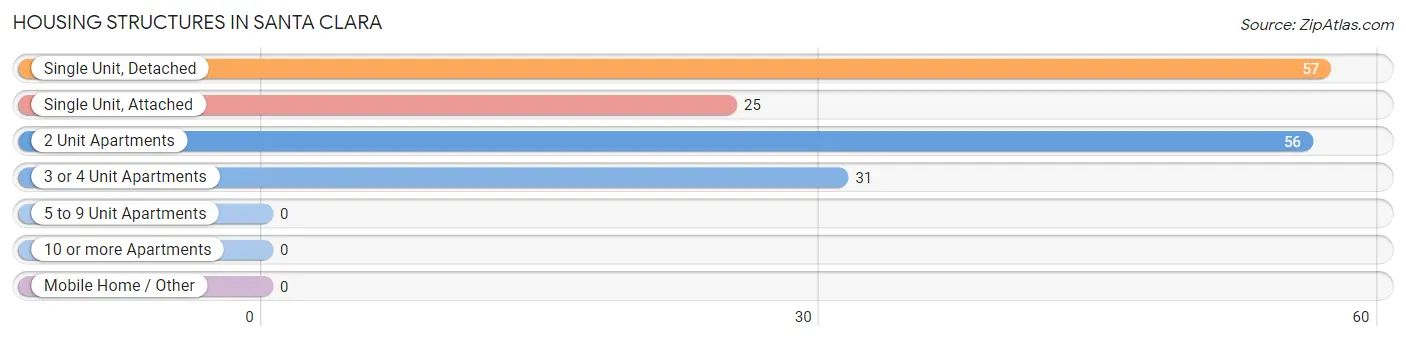
| Structure Type | # Housing Units | % Housing Units |
| Single Unit, Detached | 57 | 33.7% |
| Single Unit, Attached | 25 | 14.8% |
| 2 Unit Apartments | 56 | 33.1% |
| 3 or 4 Unit Apartments | 31 | 18.3% |
| 5 to 9 Unit Apartments | 0 | 0.0% |
| 10 or more Apartments | 0 | 0.0% |
| Mobile Home / Other | 0 | 0.0% |
| Total | 169 | 100.0% |
Housing Structures by Occupancy in Santa Clara
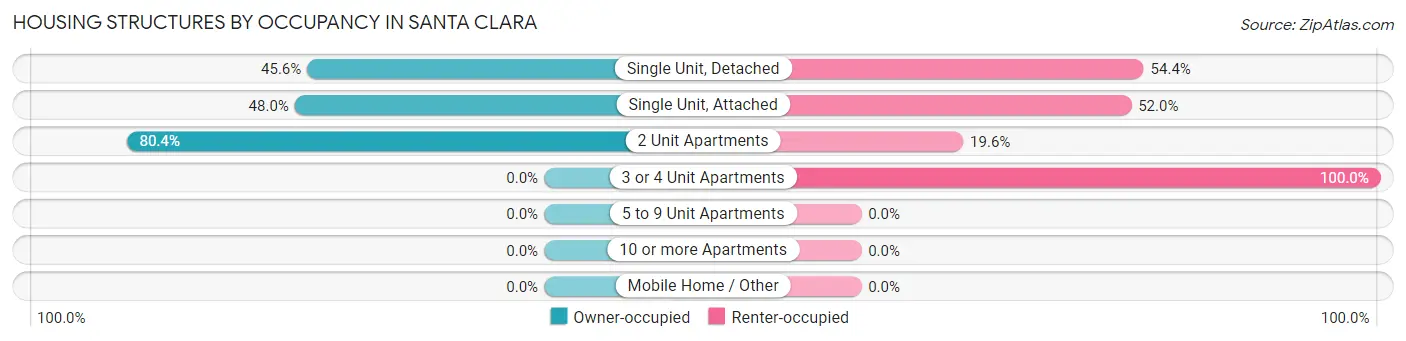
| Structure Type | Owner-occupied | Renter-occupied |
| Single Unit, Detached | 26 (45.6%) | 31 (54.4%) |
| Single Unit, Attached | 12 (48.0%) | 13 (52.0%) |
| 2 Unit Apartments | 45 (80.4%) | 11 (19.6%) |
| 3 or 4 Unit Apartments | 0 (0.0%) | 31 (100.0%) |
| 5 to 9 Unit Apartments | 0 (0.0%) | 0 (0.0%) |
| 10 or more Apartments | 0 (0.0%) | 0 (0.0%) |
| Mobile Home / Other | 0 (0.0%) | 0 (0.0%) |
| Total | 83 (49.1%) | 86 (50.9%) |
Housing Structures by Number of Rooms in Santa Clara
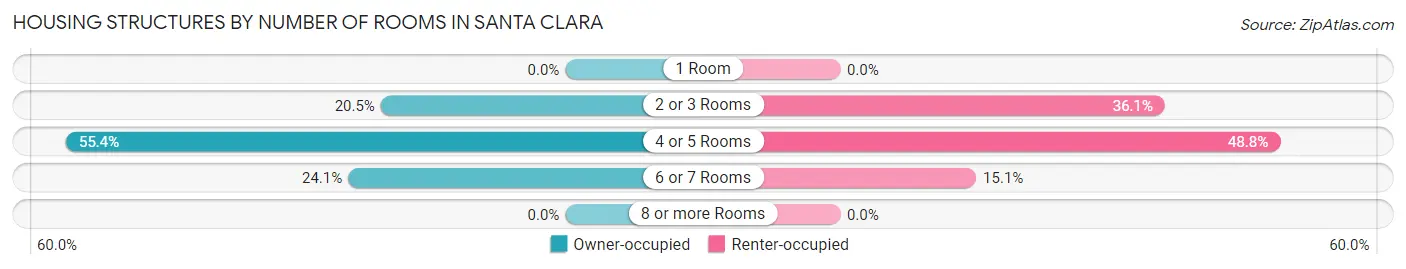
| Number of Rooms | Owner-occupied | Renter-occupied |
| 1 Room | 0 (0.0%) | 0 (0.0%) |
| 2 or 3 Rooms | 17 (20.5%) | 31 (36.0%) |
| 4 or 5 Rooms | 46 (55.4%) | 42 (48.8%) |
| 6 or 7 Rooms | 20 (24.1%) | 13 (15.1%) |
| 8 or more Rooms | 0 (0.0%) | 0 (0.0%) |
| Total | 83 (100.0%) | 86 (100.0%) |
Housing Structure by Heating Type in Santa Clara
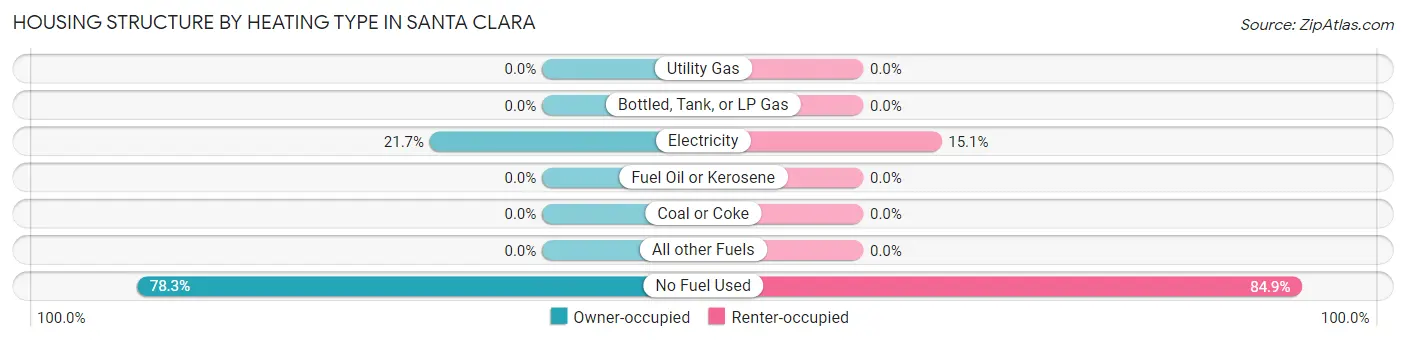
| Heating Type | Owner-occupied | Renter-occupied |
| Utility Gas | 0 (0.0%) | 0 (0.0%) |
| Bottled, Tank, or LP Gas | 0 (0.0%) | 0 (0.0%) |
| Electricity | 18 (21.7%) | 13 (15.1%) |
| Fuel Oil or Kerosene | 0 (0.0%) | 0 (0.0%) |
| Coal or Coke | 0 (0.0%) | 0 (0.0%) |
| All other Fuels | 0 (0.0%) | 0 (0.0%) |
| No Fuel Used | 65 (78.3%) | 73 (84.9%) |
| Total | 83 (100.0%) | 86 (100.0%) |
Household Vehicle Usage in Santa Clara
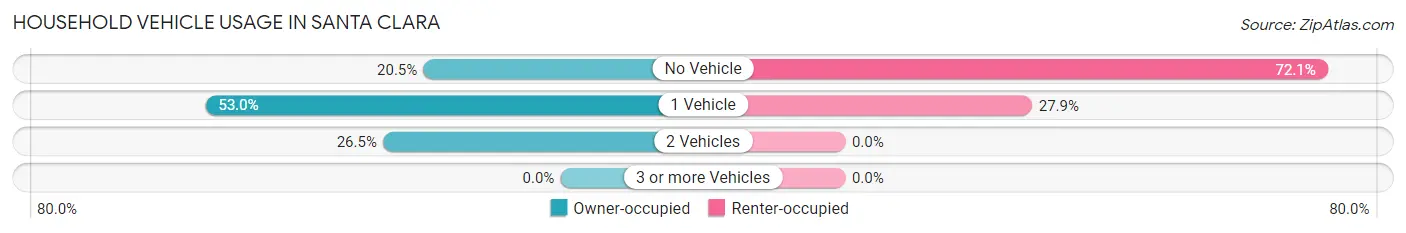
| Vehicles per Household | Owner-occupied | Renter-occupied |
| No Vehicle | 17 (20.5%) | 62 (72.1%) |
| 1 Vehicle | 44 (53.0%) | 24 (27.9%) |
| 2 Vehicles | 22 (26.5%) | 0 (0.0%) |
| 3 or more Vehicles | 0 (0.0%) | 0 (0.0%) |
| Total | 83 (100.0%) | 86 (100.0%) |
Real Estate & Mortgages in Santa Clara
Real Estate and Mortgage Overview in Santa Clara
| Characteristic | Without Mortgage | With Mortgage |
| Housing Units | 65 | 18 |
| Median Property Value | $136,200 | $0 |
| Median Household Income | - | - |
| Monthly Housing Costs | $213 | $0 |
| Real Estate Taxes | - | - |
Property Value by Mortgage Status in Santa Clara
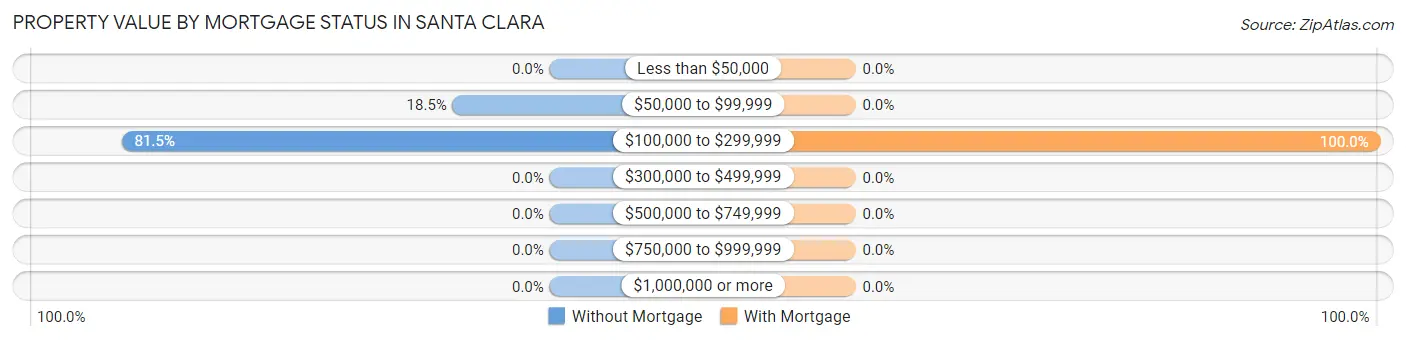
| Property Value | Without Mortgage | With Mortgage |
| Less than $50,000 | 0 (0.0%) | 0 (0.0%) |
| $50,000 to $99,999 | 12 (18.5%) | 0 (0.0%) |
| $100,000 to $299,999 | 53 (81.5%) | 18 (100.0%) |
| $300,000 to $499,999 | 0 (0.0%) | 0 (0.0%) |
| $500,000 to $749,999 | 0 (0.0%) | 0 (0.0%) |
| $750,000 to $999,999 | 0 (0.0%) | 0 (0.0%) |
| $1,000,000 or more | 0 (0.0%) | 0 (0.0%) |
| Total | 65 (100.0%) | 18 (100.0%) |
Household Income by Mortgage Status in Santa Clara
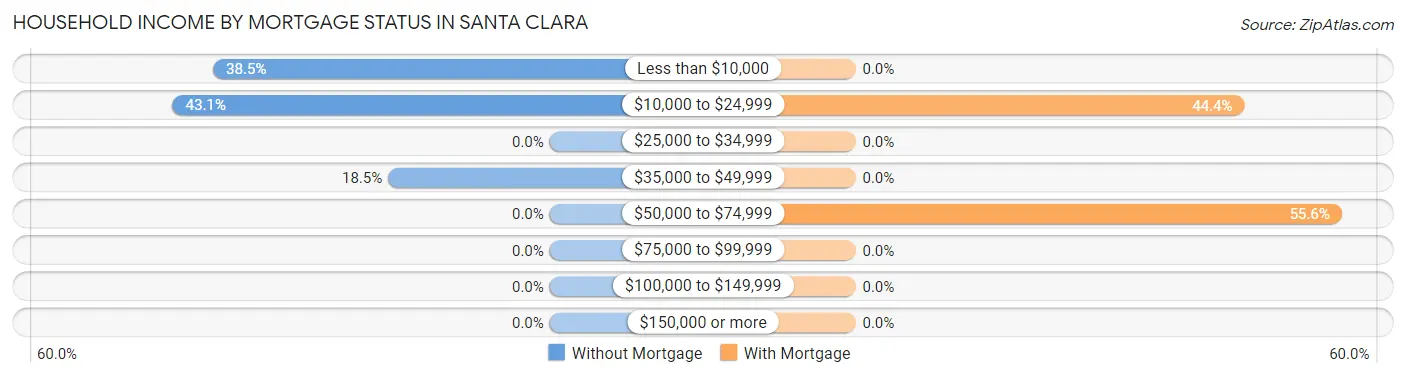
| Household Income | Without Mortgage | With Mortgage |
| Less than $10,000 | 25 (38.5%) | 0 (0.0%) |
| $10,000 to $24,999 | 28 (43.1%) | 8 (44.4%) |
| $25,000 to $34,999 | 0 (0.0%) | 0 (0.0%) |
| $35,000 to $49,999 | 12 (18.5%) | 0 (0.0%) |
| $50,000 to $74,999 | 0 (0.0%) | 10 (55.6%) |
| $75,000 to $99,999 | 0 (0.0%) | 0 (0.0%) |
| $100,000 to $149,999 | 0 (0.0%) | 0 (0.0%) |
| $150,000 or more | 0 (0.0%) | 0 (0.0%) |
| Total | 65 (100.0%) | 18 (100.0%) |
Property Value to Household Income Ratio in Santa Clara
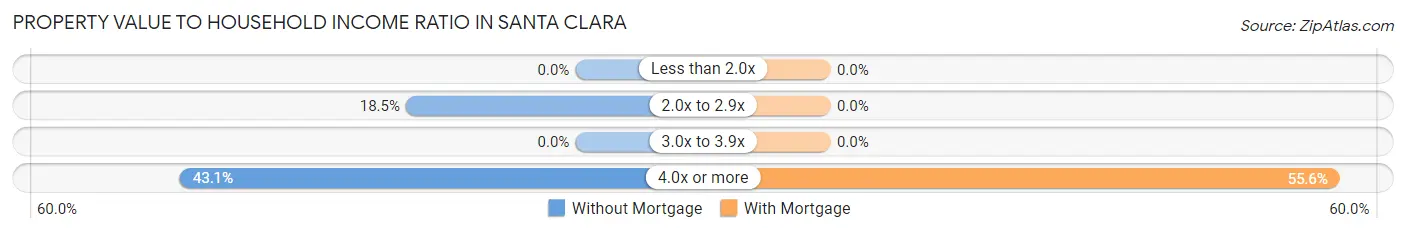
| Value-to-Income Ratio | Without Mortgage | With Mortgage |
| Less than 2.0x | 0 (0.0%) | 0 (0.0%) |
| 2.0x to 2.9x | 12 (18.5%) | 0 (0.0%) |
| 3.0x to 3.9x | 0 (0.0%) | 0 (0.0%) |
| 4.0x or more | 28 (43.1%) | 10 (55.6%) |
| Total | 65 (100.0%) | 18 (100.0%) |
Real Estate Taxes by Mortgage Status in Santa Clara
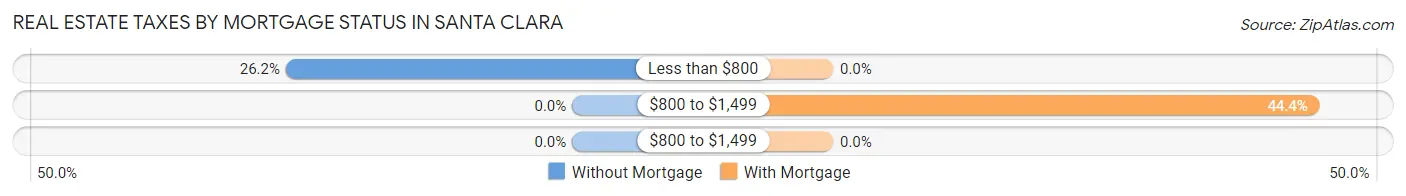
| Property Taxes | Without Mortgage | With Mortgage |
| Less than $800 | 17 (26.2%) | 0 (0.0%) |
| $800 to $1,499 | 0 (0.0%) | 8 (44.4%) |
| $800 to $1,499 | 0 (0.0%) | 0 (0.0%) |
| Total | 65 (100.0%) | 18 (100.0%) |
Health & Disability in Santa Clara
Health Insurance Coverage by Age in Santa Clara
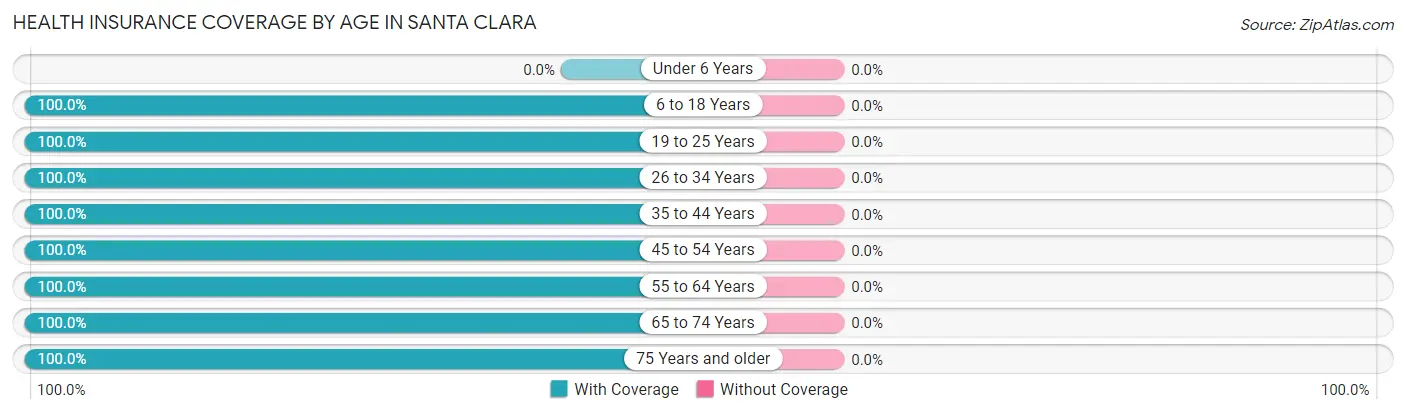
| Age Bracket | With Coverage | Without Coverage |
| Under 6 Years | 0 (0.0%) | 0 (0.0%) |
| 6 to 18 Years | 25 (100.0%) | 0 (0.0%) |
| 19 to 25 Years | 93 (100.0%) | 0 (0.0%) |
| 26 to 34 Years | 15 (100.0%) | 0 (0.0%) |
| 35 to 44 Years | 13 (100.0%) | 0 (0.0%) |
| 45 to 54 Years | 37 (100.0%) | 0 (0.0%) |
| 55 to 64 Years | 58 (100.0%) | 0 (0.0%) |
| 65 to 74 Years | 145 (100.0%) | 0 (0.0%) |
| 75 Years and older | 51 (100.0%) | 0 (0.0%) |
| Total | 437 (100.0%) | 0 (0.0%) |
Health Insurance Coverage by Citizenship Status in Santa Clara
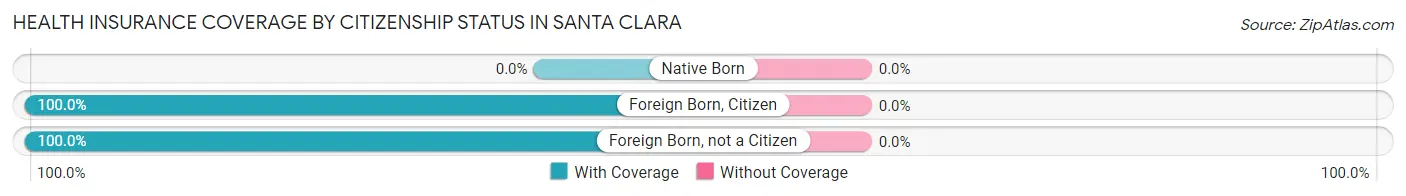
| Citizenship Status | With Coverage | Without Coverage |
| Native Born | 0 (0.0%) | 0 (0.0%) |
| Foreign Born, Citizen | 25 (100.0%) | 0 (0.0%) |
| Foreign Born, not a Citizen | 93 (100.0%) | 0 (0.0%) |
Health Insurance Coverage by Household Income in Santa Clara
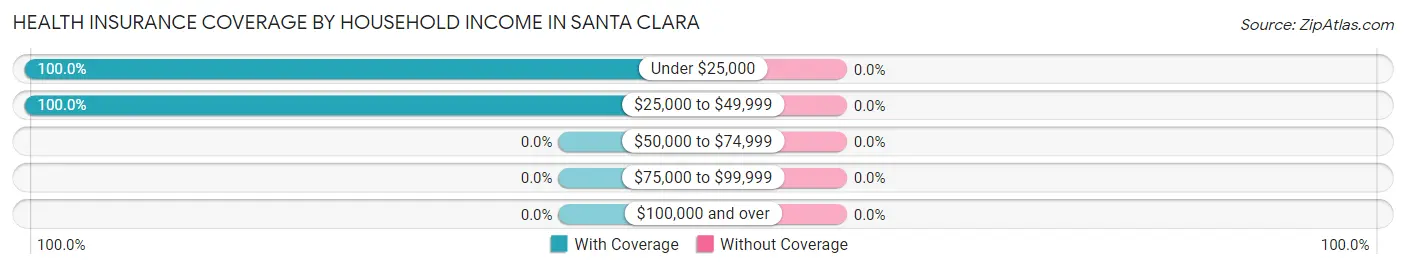
| Household Income | With Coverage | Without Coverage |
| Under $25,000 | 359 (100.0%) | 0 (0.0%) |
| $25,000 to $49,999 | 78 (100.0%) | 0 (0.0%) |
| $50,000 to $74,999 | 0 (0.0%) | 0 (0.0%) |
| $75,000 to $99,999 | 0 (0.0%) | 0 (0.0%) |
| $100,000 and over | 0 (0.0%) | 0 (0.0%) |
Public vs Private Health Insurance Coverage by Age in Santa Clara
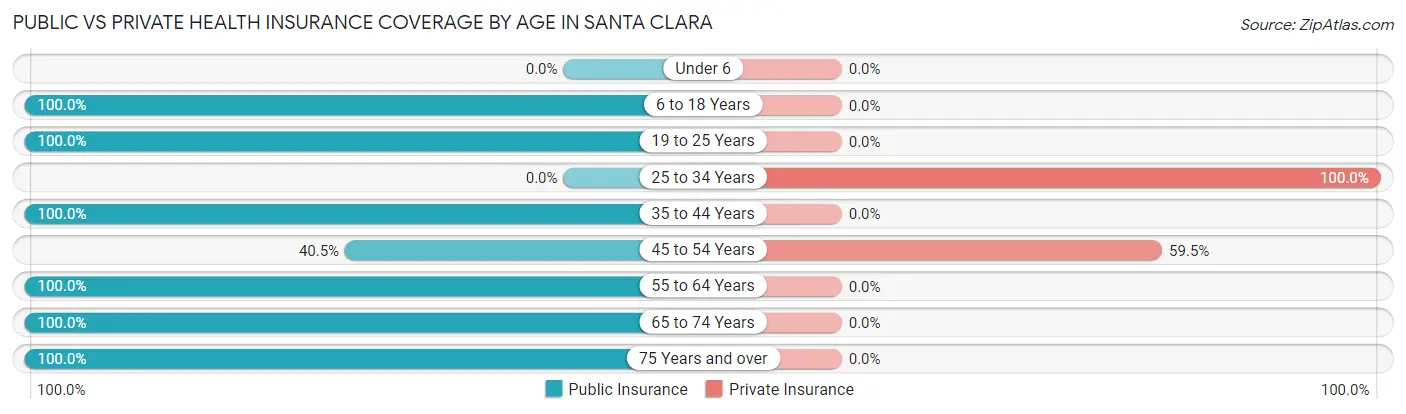
| Age Bracket | Public Insurance | Private Insurance |
| Under 6 | 0 (0.0%) | 0 (0.0%) |
| 6 to 18 Years | 25 (100.0%) | 0 (0.0%) |
| 19 to 25 Years | 93 (100.0%) | 0 (0.0%) |
| 25 to 34 Years | 0 (0.0%) | 15 (100.0%) |
| 35 to 44 Years | 13 (100.0%) | 0 (0.0%) |
| 45 to 54 Years | 15 (40.5%) | 22 (59.5%) |
| 55 to 64 Years | 58 (100.0%) | 0 (0.0%) |
| 65 to 74 Years | 145 (100.0%) | 0 (0.0%) |
| 75 Years and over | 51 (100.0%) | 0 (0.0%) |
| Total | 400 (91.5%) | 37 (8.5%) |
Disability Status by Sex by Age in Santa Clara
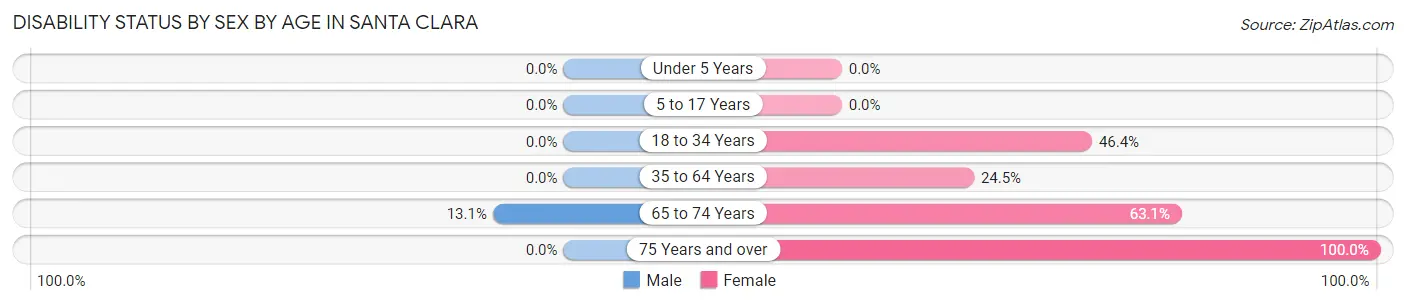
| Age Bracket | Male | Female |
| Under 5 Years | 0 (0.0%) | 0 (0.0%) |
| 5 to 17 Years | 0 (0.0%) | 0 (0.0%) |
| 18 to 34 Years | 0 (0.0%) | 13 (46.4%) |
| 35 to 64 Years | 0 (0.0%) | 13 (24.5%) |
| 65 to 74 Years | 8 (13.1%) | 53 (63.1%) |
| 75 Years and over | 0 (0.0%) | 34 (100.0%) |
Disability Class by Sex by Age in Santa Clara
Disability Class: Hearing Difficulty
| Age Bracket | Male | Female |
| Under 5 Years | 0 (0.0%) | 0 (0.0%) |
| 5 to 17 Years | 0 (0.0%) | 0 (0.0%) |
| 18 to 34 Years | 0 (0.0%) | 0 (0.0%) |
| 35 to 64 Years | 0 (0.0%) | 0 (0.0%) |
| 65 to 74 Years | 0 (0.0%) | 0 (0.0%) |
| 75 Years and over | 0 (0.0%) | 0 (0.0%) |
Disability Class: Vision Difficulty
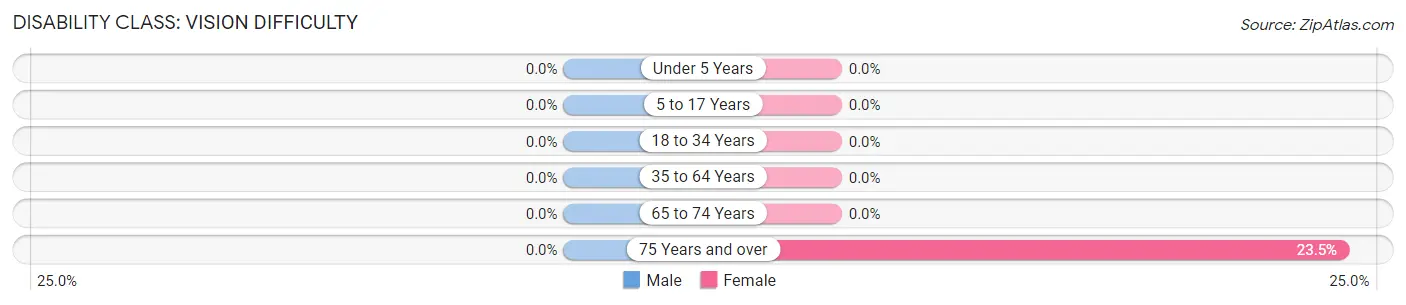
| Age Bracket | Male | Female |
| Under 5 Years | 0 (0.0%) | 0 (0.0%) |
| 5 to 17 Years | 0 (0.0%) | 0 (0.0%) |
| 18 to 34 Years | 0 (0.0%) | 0 (0.0%) |
| 35 to 64 Years | 0 (0.0%) | 0 (0.0%) |
| 65 to 74 Years | 0 (0.0%) | 0 (0.0%) |
| 75 Years and over | 0 (0.0%) | 8 (23.5%) |
Disability Class: Cognitive Difficulty
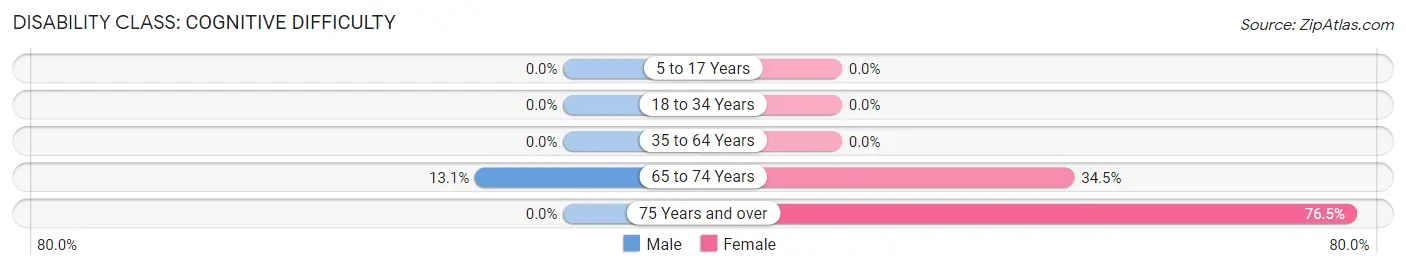
| Age Bracket | Male | Female |
| 5 to 17 Years | 0 (0.0%) | 0 (0.0%) |
| 18 to 34 Years | 0 (0.0%) | 0 (0.0%) |
| 35 to 64 Years | 0 (0.0%) | 0 (0.0%) |
| 65 to 74 Years | 8 (13.1%) | 29 (34.5%) |
| 75 Years and over | 0 (0.0%) | 26 (76.5%) |
Disability Class: Ambulatory Difficulty
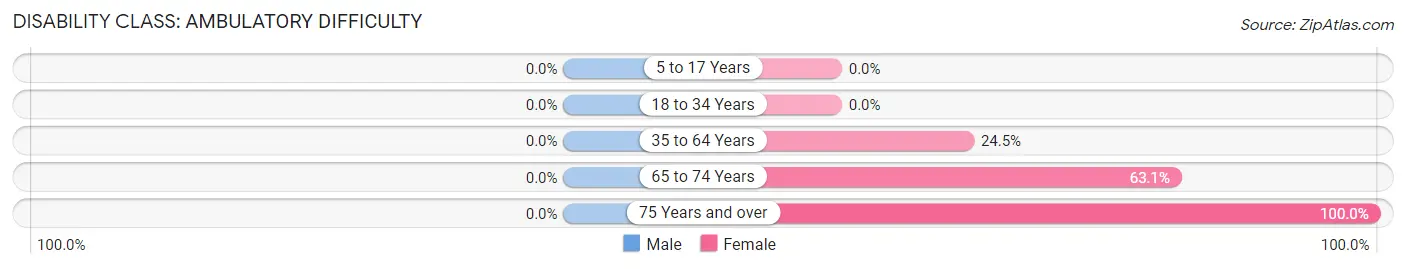
| Age Bracket | Male | Female |
| 5 to 17 Years | 0 (0.0%) | 0 (0.0%) |
| 18 to 34 Years | 0 (0.0%) | 0 (0.0%) |
| 35 to 64 Years | 0 (0.0%) | 13 (24.5%) |
| 65 to 74 Years | 0 (0.0%) | 53 (63.1%) |
| 75 Years and over | 0 (0.0%) | 34 (100.0%) |
Disability Class: Self-Care Difficulty
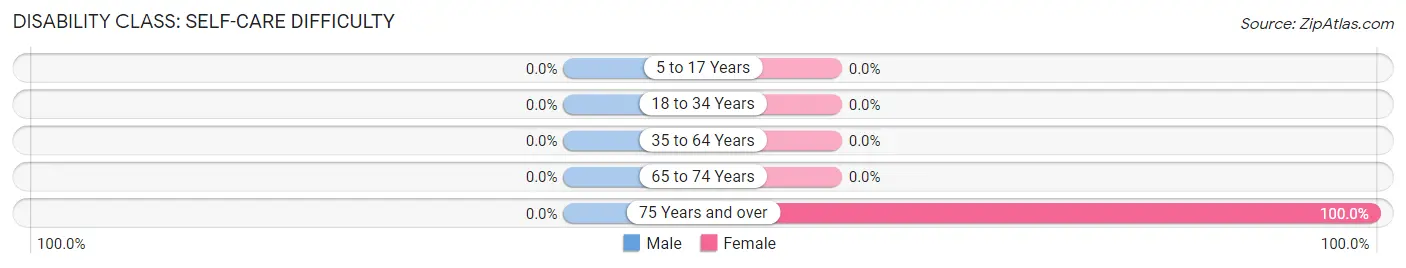
| Age Bracket | Male | Female |
| 5 to 17 Years | 0 (0.0%) | 0 (0.0%) |
| 18 to 34 Years | 0 (0.0%) | 0 (0.0%) |
| 35 to 64 Years | 0 (0.0%) | 0 (0.0%) |
| 65 to 74 Years | 0 (0.0%) | 0 (0.0%) |
| 75 Years and over | 0 (0.0%) | 34 (100.0%) |
Technology Access in Santa Clara
Computing Device Access in Santa Clara
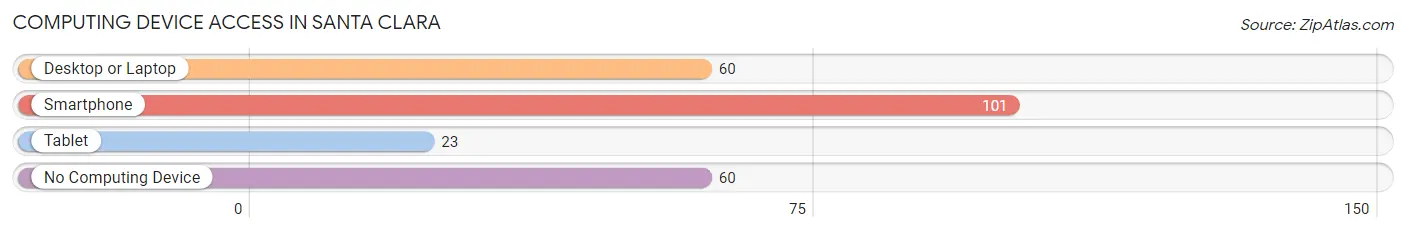
| Device Type | # Households | % Households |
| Desktop or Laptop | 60 | 35.5% |
| Smartphone | 101 | 59.8% |
| Tablet | 23 | 13.6% |
| No Computing Device | 60 | 35.5% |
| Total | 169 | 100.0% |
Internet Access in Santa Clara
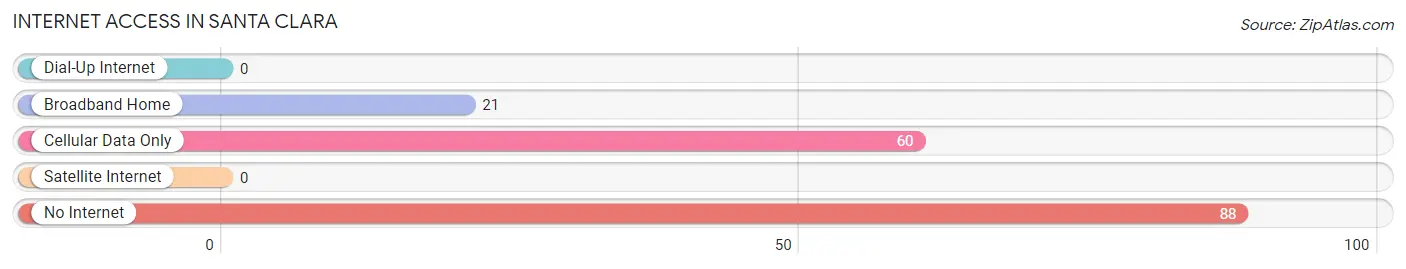
| Internet Type | # Households | % Households |
| Dial-Up Internet | 0 | 0.0% |
| Broadband Home | 21 | 12.4% |
| Cellular Data Only | 60 | 35.5% |
| Satellite Internet | 0 | 0.0% |
| No Internet | 88 | 52.1% |
| Total | 169 | 100.0% |
Santa Clara Summary
Santa Clara is a municipality located in the central region of Puerto Rico. It is part of the Ponce Metropolitan Statistical Area. The town is located in the southern coast of the island, south of Adjuntas and Jayuya; east of Juana Díaz; and west of Villalba and Coamo. Santa Clara has a total area of 28.2 square miles (73 km2).
History
Santa Clara was founded in 1739 by Don Juan de la Cruz. The town was named after Saint Clare of Assisi, the patron saint of the town. Santa Clara was originally part of the municipality of Coamo, but it was separated in 1831.
Geography
Santa Clara is located in the central region of Puerto Rico. It is part of the Ponce Metropolitan Statistical Area. The town is located in the southern coast of the island, south of Adjuntas and Jayuya; east of Juana Díaz; and west of Villalba and Coamo. Santa Clara has a total area of 28.2 square miles (73 km2).
The terrain of Santa Clara is mostly mountainous, with some flat areas. The highest point is Cerro de Santa Clara, which is 1,890 feet (576 m) above sea level. The town is located in the Cordillera Central mountain range.
Economy
The economy of Santa Clara is mainly based on agriculture. The main crops are coffee, plantains, bananas, and yams. The town also has some small industries, such as furniture and clothing manufacturing.
Demographics
As of the 2010 census, Santa Clara had a population of 11,845. The population density was 418.3 people per square mile (161.3/km2). The racial makeup of the town was 79.2% White, 0.7% African American, 0.3% Native American, 0.2% Asian, 0.1% Pacific Islander, 17.7% from other races, and 1.9% from two or more races. Hispanic or Latino of any race were 99.2% of the population.
The median income for a household in Santa Clara was $14,945, and the median income for a family was $17,945. About 32.3% of the population was below the poverty line.
Common Questions
What is Per Capita Income in Santa Clara?
Per Capita income in Santa Clara is $5,539.
What is Inequality or Gini Index in Santa Clara?
Inequality or Gini Index in Santa Clara is 0.59.
What is the Total Population of Santa Clara?
Total Population of Santa Clara is 438.
What is the Total Male Population of Santa Clara?
Total Male Population of Santa Clara is 239.
What is the Total Female Population of Santa Clara?
Total Female Population of Santa Clara is 199.
What is the Ratio of Males per 100 Females in Santa Clara?
There are 120.10 Males per 100 Females in Santa Clara.
What is the Ratio of Females per 100 Males in Santa Clara?
There are 83.26 Females per 100 Males in Santa Clara.
What is the Median Population Age in Santa Clara?
Median Population Age in Santa Clara is 58.8 Years.
What is the Average Family Size in Santa Clara
Average Family Size in Santa Clara is 2.9 People.
What is the Average Household Size in Santa Clara
Average Household Size in Santa Clara is 2.6 People.
How Large is the Labor Force in Santa Clara?
There are 52 People in the Labor Forcein in Santa Clara.
What is the Percentage of People in the Labor Force in Santa Clara?
12.3% of People are in the Labor Force in Santa Clara.
What is the Unemployment Rate in Santa Clara?
Unemployment Rate in Santa Clara is 25.0%.