Palo Seco, PR Map & Demographics
Palo Seco Map
Palo Seco Overview
$8,735
PER CAPITA INCOME
$18,529
AVG FAMILY INCOME
$19,118
AVG HOUSEHOLD INCOME
11.5%
WAGE / INCOME GAP [ % ]
88.5¢/ $1
WAGE / INCOME GAP [ $ ]
0.39
INEQUALITY / GINI INDEX
795
TOTAL POPULATION
420
MALE POPULATION
375
FEMALE POPULATION
112.00
MALES / 100 FEMALES
89.29
FEMALES / 100 MALES
34.5
MEDIAN AGE
3.1
AVG FAMILY SIZE
2.5
AVG HOUSEHOLD SIZE
315
LABOR FORCE [ PEOPLE ]
52.2%
PERCENT IN LABOR FORCE
22.9%
UNEMPLOYMENT RATE
Income in Palo Seco
Income Overview in Palo Seco
Per Capita Income in Palo Seco is $8,735, while median incomes of families and households are $18,529 and $19,118 respectively.
| Characteristic | Number | Measure |
| Per Capita Income | 795 | $8,735 |
| Median Family Income | 208 | $18,529 |
| Mean Family Income | 208 | $18,811 |
| Median Household Income | 324 | $19,118 |
| Mean Household Income | 324 | $19,965 |
| Income Deficit | 208 | $0 |
| Wage / Income Gap (%) | 795 | 11.54% |
| Wage / Income Gap ($) | 795 | 88.46¢ per $1 |
| Gini / Inequality Index | 795 | 0.39 |
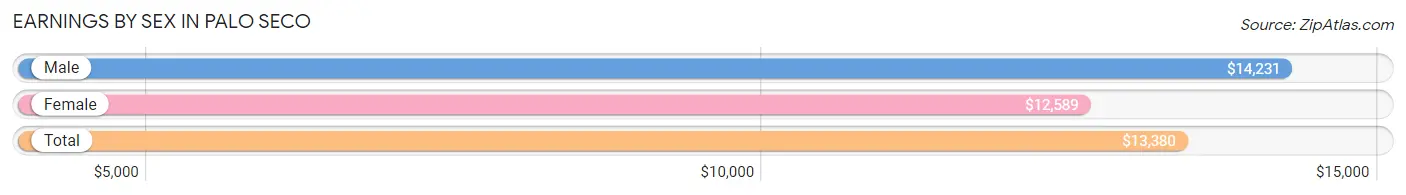
Earnings by Sex in Palo Seco
Average Earnings in Palo Seco are $13,380, $14,231 for men and $12,589 for women, a difference of 11.5%.
| Sex | Number | Average Earnings |
| Male | 196 (66.4%) | $14,231 |
| Female | 99 (33.6%) | $12,589 |
| Total | 295 (100.0%) | $13,380 |
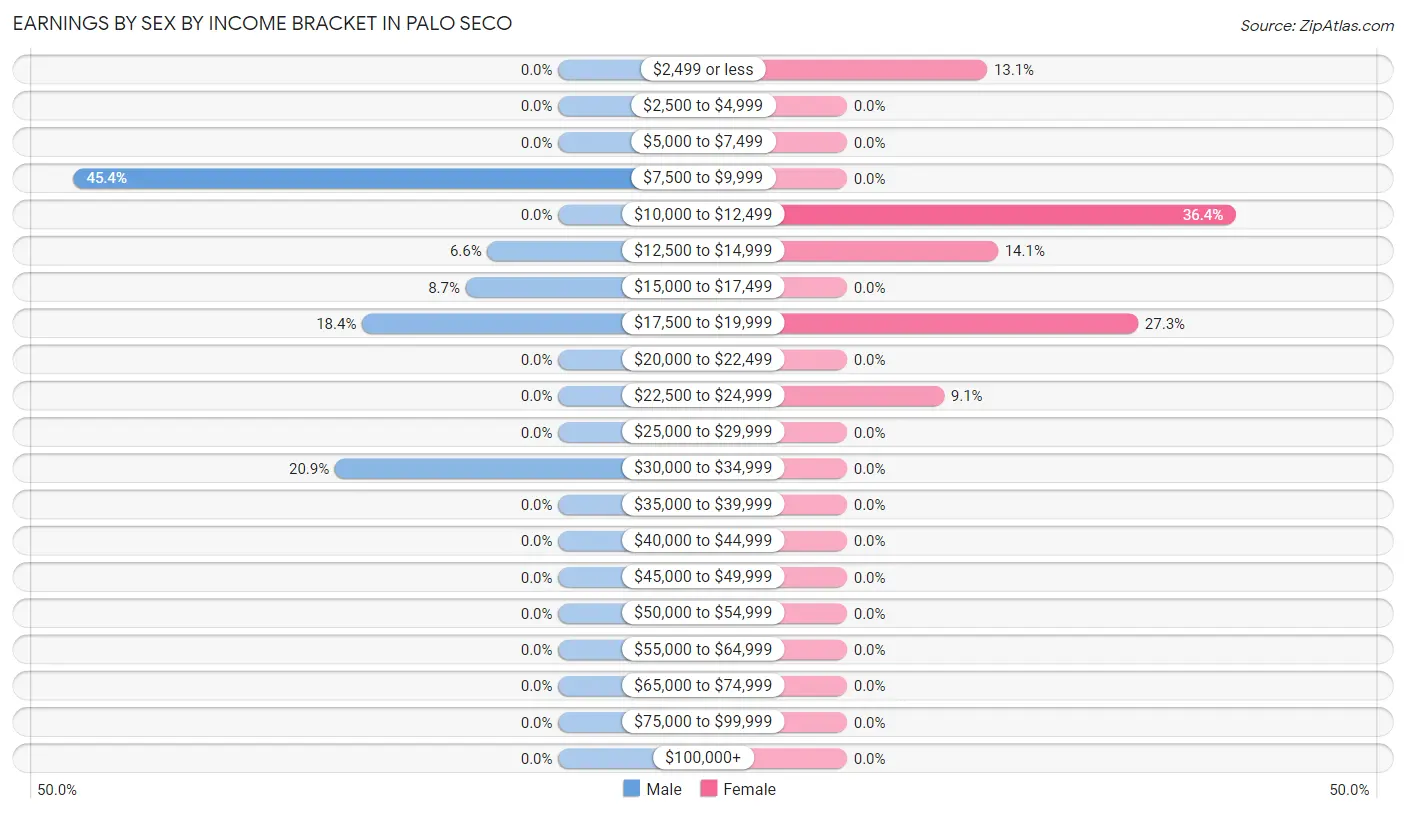
Earnings by Sex by Income Bracket in Palo Seco
The most common earnings brackets in Palo Seco are $7,500 to $9,999 for men (89 | 45.4%) and $10,000 to $12,499 for women (36 | 36.4%).
| Income | Male | Female |
| $2,499 or less | 0 (0.0%) | 13 (13.1%) |
| $2,500 to $4,999 | 0 (0.0%) | 0 (0.0%) |
| $5,000 to $7,499 | 0 (0.0%) | 0 (0.0%) |
| $7,500 to $9,999 | 89 (45.4%) | 0 (0.0%) |
| $10,000 to $12,499 | 0 (0.0%) | 36 (36.4%) |
| $12,500 to $14,999 | 13 (6.6%) | 14 (14.1%) |
| $15,000 to $17,499 | 17 (8.7%) | 0 (0.0%) |
| $17,500 to $19,999 | 36 (18.4%) | 27 (27.3%) |
| $20,000 to $22,499 | 0 (0.0%) | 0 (0.0%) |
| $22,500 to $24,999 | 0 (0.0%) | 9 (9.1%) |
| $25,000 to $29,999 | 0 (0.0%) | 0 (0.0%) |
| $30,000 to $34,999 | 41 (20.9%) | 0 (0.0%) |
| $35,000 to $39,999 | 0 (0.0%) | 0 (0.0%) |
| $40,000 to $44,999 | 0 (0.0%) | 0 (0.0%) |
| $45,000 to $49,999 | 0 (0.0%) | 0 (0.0%) |
| $50,000 to $54,999 | 0 (0.0%) | 0 (0.0%) |
| $55,000 to $64,999 | 0 (0.0%) | 0 (0.0%) |
| $65,000 to $74,999 | 0 (0.0%) | 0 (0.0%) |
| $75,000 to $99,999 | 0 (0.0%) | 0 (0.0%) |
| $100,000+ | 0 (0.0%) | 0 (0.0%) |
| Total | 196 (100.0%) | 99 (100.0%) |
Earnings by Sex by Educational Attainment in Palo Seco
| Educational Attainment | Male Income | Female Income |
| Less than High School | - | - |
| High School Diploma | - | - |
| College or Associate's Degree | - | - |
| Bachelor's Degree | - | - |
| Graduate Degree | - | - |
| Total | $13,173 | $12,589 |
Family Income in Palo Seco
Family Income Brackets in Palo Seco
According to the Palo Seco family income data, there are 90 families falling into the less than $10,000 income range, which is the most common income bracket and makes up 43.3% of all families.
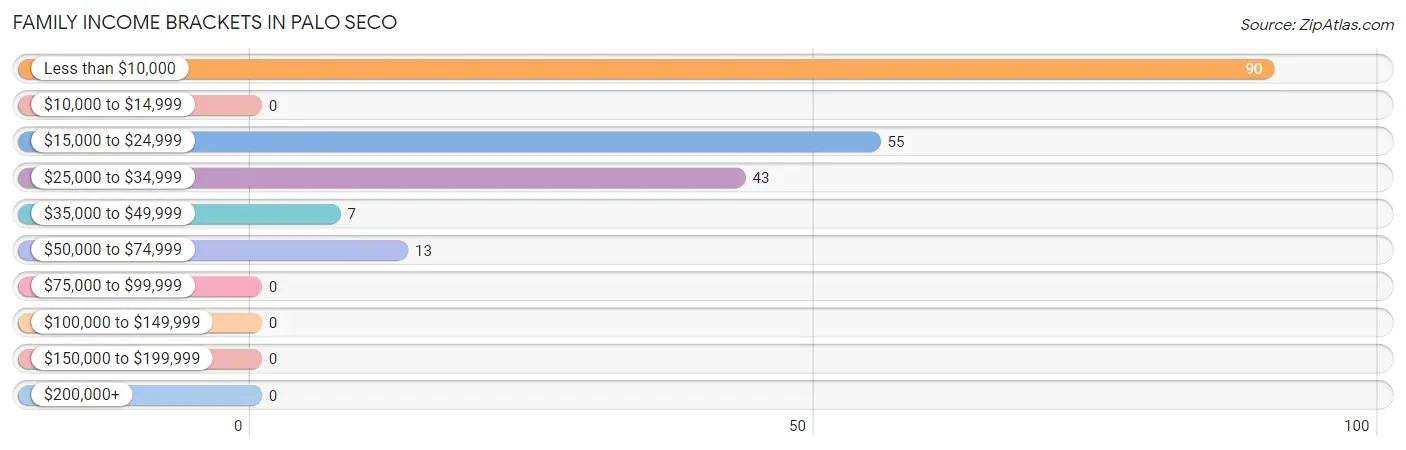
| Income Bracket | # Families | % Families |
| Less than $10,000 | 90 | 43.3% |
| $10,000 to $14,999 | 0 | 0.0% |
| $15,000 to $24,999 | 55 | 26.4% |
| $25,000 to $34,999 | 43 | 20.7% |
| $35,000 to $49,999 | 7 | 3.4% |
| $50,000 to $74,999 | 13 | 6.3% |
| $75,000 to $99,999 | 0 | 0.0% |
| $100,000 to $149,999 | 0 | 0.0% |
| $150,000 to $199,999 | 0 | 0.0% |
| $200,000+ | 0 | 0.0% |
Family Income by Famaliy Size in Palo Seco
4-person families (45 | 21.6%) account for the highest median family income in Palo Seco with $31,016 per family, while 4-person families (45 | 21.6%) have the highest median income of $7,754 per family member.
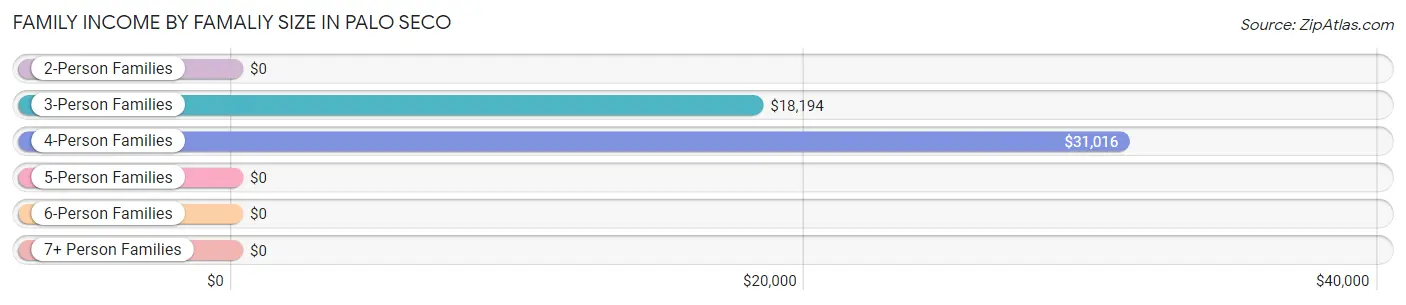
| Income Bracket | # Families | Median Income |
| 2-Person Families | 88 (42.3%) | $0 |
| 3-Person Families | 68 (32.7%) | $18,194 |
| 4-Person Families | 45 (21.6%) | $31,016 |
| 5-Person Families | 0 (0.0%) | $0 |
| 6-Person Families | 0 (0.0%) | $0 |
| 7+ Person Families | 7 (3.4%) | $0 |
| Total | 208 (100.0%) | $18,529 |
Family Income by Number of Earners in Palo Seco
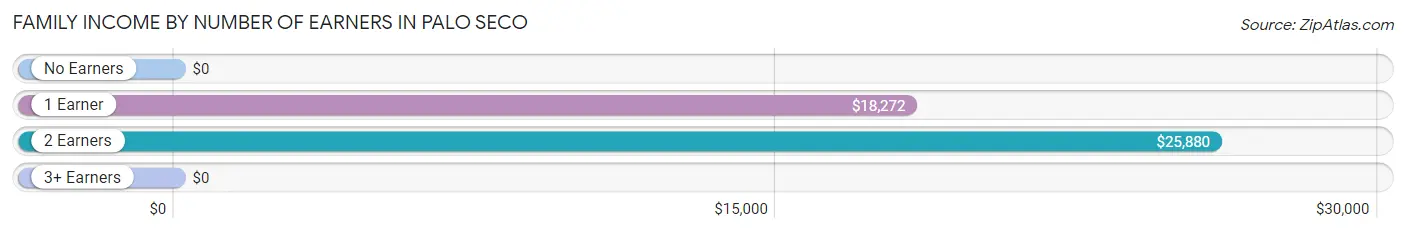
| Number of Earners | # Families | Median Income |
| No Earners | 61 (29.3%) | $0 |
| 1 Earner | 79 (38.0%) | $18,272 |
| 2 Earners | 61 (29.3%) | $25,880 |
| 3+ Earners | 7 (3.4%) | $0 |
| Total | 208 (100.0%) | $18,529 |
Household Income in Palo Seco
Household Income Brackets in Palo Seco
With 110 households falling in the category, the less than $10,000 income range is the most frequent in Palo Seco, accounting for 34.0% of all households.
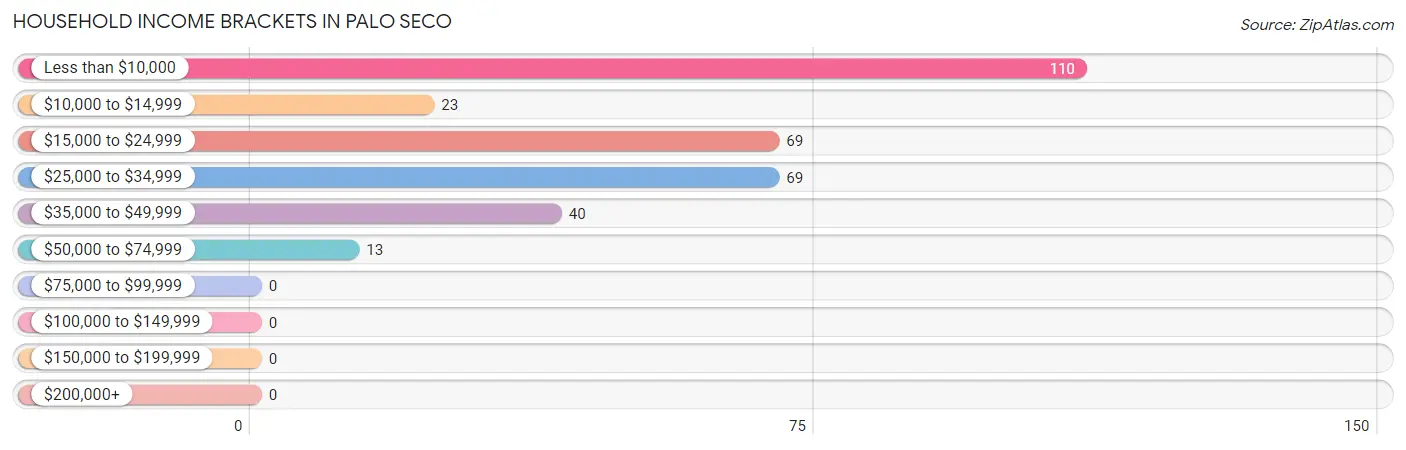
| Income Bracket | # Households | % Households |
| Less than $10,000 | 110 | 34.0% |
| $10,000 to $14,999 | 23 | 7.1% |
| $15,000 to $24,999 | 69 | 21.3% |
| $25,000 to $34,999 | 69 | 21.3% |
| $35,000 to $49,999 | 40 | 12.3% |
| $50,000 to $74,999 | 13 | 4.0% |
| $75,000 to $99,999 | 0 | 0.0% |
| $100,000 to $149,999 | 0 | 0.0% |
| $150,000 to $199,999 | 0 | 0.0% |
| $200,000+ | 0 | 0.0% |
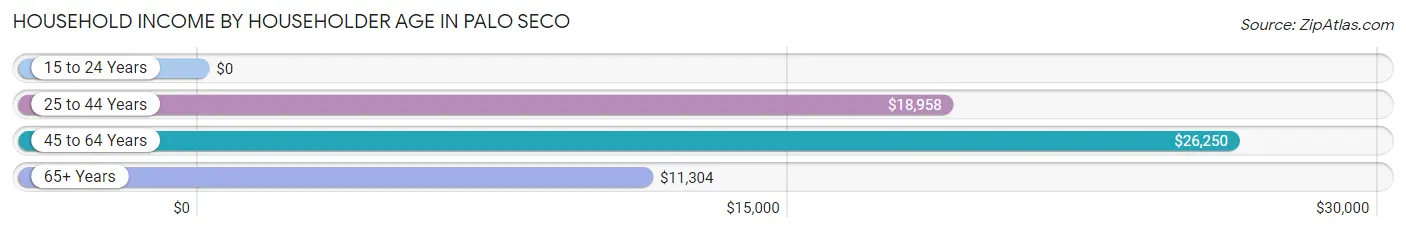
Household Income by Householder Age in Palo Seco
The median household income in Palo Seco is $19,118, with the highest median household income of $26,250 found in the 45 to 64 years age bracket for the primary householder. A total of 59 households (18.2%) fall into this category.
| Income Bracket | # Households | Median Income |
| 15 to 24 Years | 0 (0.0%) | $0 |
| 25 to 44 Years | 149 (46.0%) | $18,958 |
| 45 to 64 Years | 59 (18.2%) | $26,250 |
| 65+ Years | 116 (35.8%) | $11,304 |
| Total | 324 (100.0%) | $19,118 |
Poverty in Palo Seco
Income Below Poverty by Sex and Age in Palo Seco
With 60.2% poverty level for males and 77.6% for females among the residents of Palo Seco, under 5 year old males and under 5 year old females are the most vulnerable to poverty, with 33 males (100.0%) and 40 females (100.0%) in their respective age groups living below the poverty level.
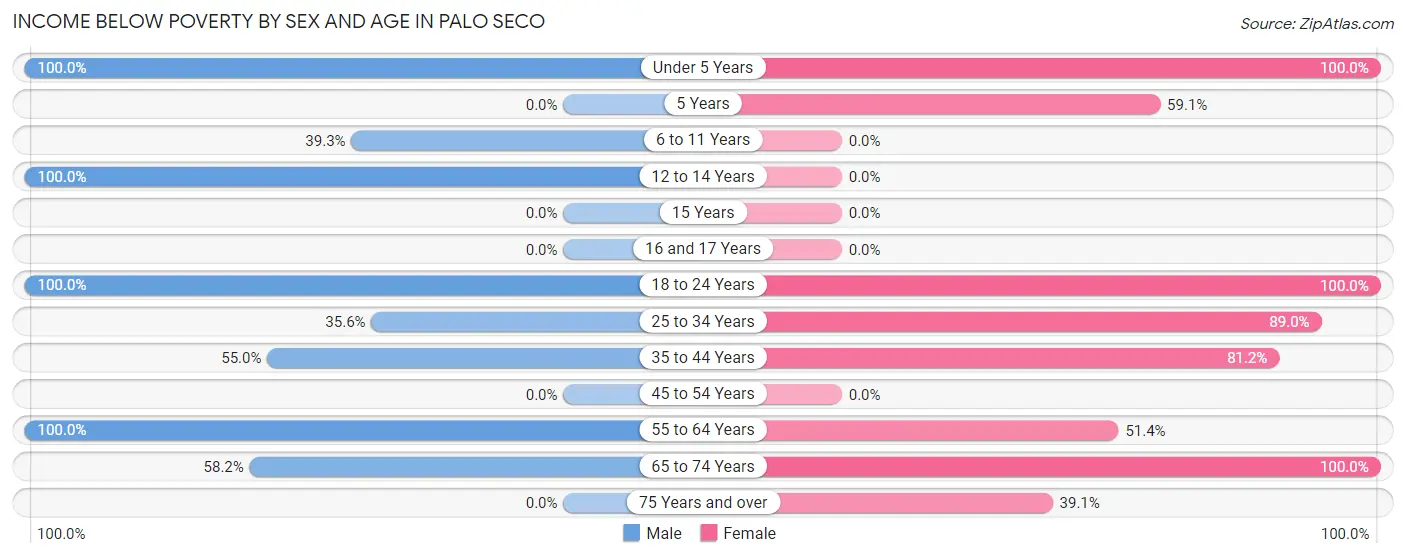
| Age Bracket | Male | Female |
| Under 5 Years | 33 (100.0%) | 40 (100.0%) |
| 5 Years | 0 (0.0%) | 13 (59.1%) |
| 6 to 11 Years | 24 (39.3%) | 0 (0.0%) |
| 12 to 14 Years | 35 (100.0%) | 0 (0.0%) |
| 15 Years | 0 (0.0%) | 0 (0.0%) |
| 16 and 17 Years | 0 (0.0%) | 0 (0.0%) |
| 18 to 24 Years | 11 (100.0%) | 35 (100.0%) |
| 25 to 34 Years | 31 (35.6%) | 73 (89.0%) |
| 35 to 44 Years | 50 (54.9%) | 69 (81.2%) |
| 45 to 54 Years | 0 (0.0%) | 0 (0.0%) |
| 55 to 64 Years | 23 (100.0%) | 38 (51.3%) |
| 65 to 74 Years | 46 (58.2%) | 14 (100.0%) |
| 75 Years and over | 0 (0.0%) | 9 (39.1%) |
| Total | 253 (60.2%) | 291 (77.6%) |
Income Above Poverty by Sex and Age in Palo Seco
According to the poverty statistics in Palo Seco, males aged 25 to 34 years and females aged 75 years and over are the age groups that are most secure financially, with 64.4% of males and 60.9% of females in these age groups living above the poverty line.
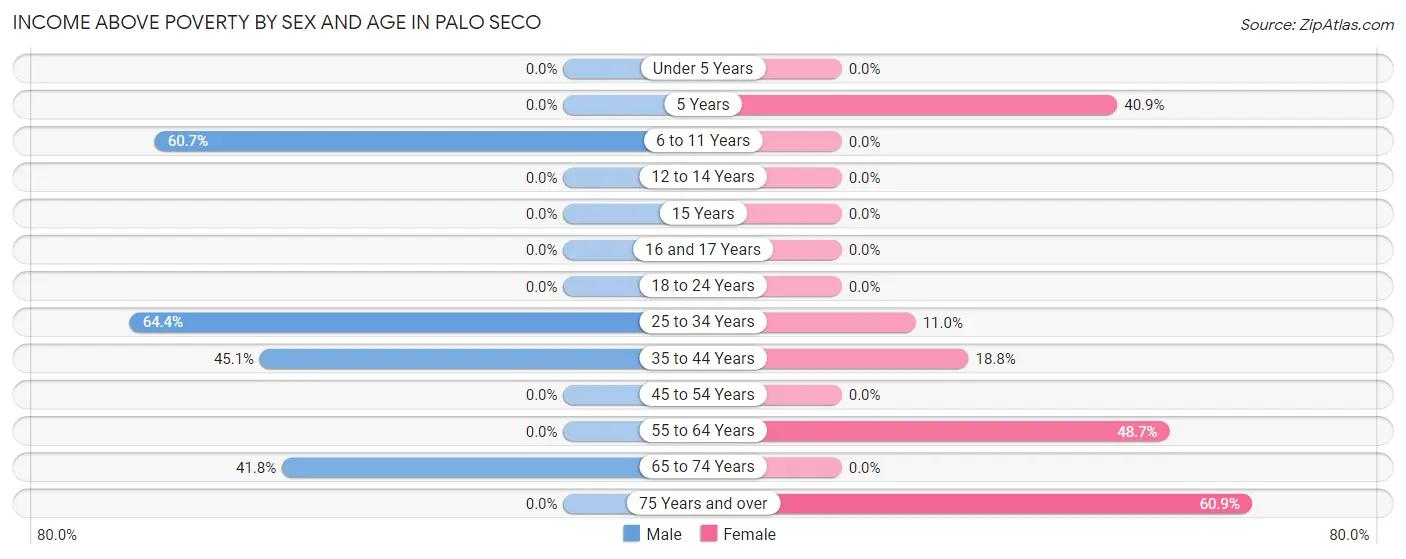
| Age Bracket | Male | Female |
| Under 5 Years | 0 (0.0%) | 0 (0.0%) |
| 5 Years | 0 (0.0%) | 9 (40.9%) |
| 6 to 11 Years | 37 (60.7%) | 0 (0.0%) |
| 12 to 14 Years | 0 (0.0%) | 0 (0.0%) |
| 15 Years | 0 (0.0%) | 0 (0.0%) |
| 16 and 17 Years | 0 (0.0%) | 0 (0.0%) |
| 18 to 24 Years | 0 (0.0%) | 0 (0.0%) |
| 25 to 34 Years | 56 (64.4%) | 9 (11.0%) |
| 35 to 44 Years | 41 (45.1%) | 16 (18.8%) |
| 45 to 54 Years | 0 (0.0%) | 0 (0.0%) |
| 55 to 64 Years | 0 (0.0%) | 36 (48.6%) |
| 65 to 74 Years | 33 (41.8%) | 0 (0.0%) |
| 75 Years and over | 0 (0.0%) | 14 (60.9%) |
| Total | 167 (39.8%) | 84 (22.4%) |
Income Below Poverty Among Married-Couple Families in Palo Seco
The poverty statistics for married-couple families in Palo Seco show that 70.7% or 70 of the total 99 families live below the poverty line. Families with no children have the highest poverty rate of 100.0%, comprising of 42 families. On the other hand, families with 1 or 2 children have the lowest poverty rate of 49.1%, which includes 28 families.
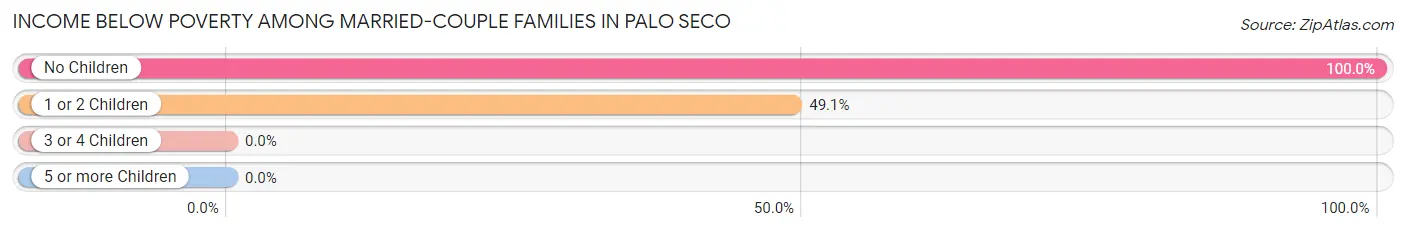
| Children | Above Poverty | Below Poverty |
| No Children | 0 (0.0%) | 42 (100.0%) |
| 1 or 2 Children | 29 (50.9%) | 28 (49.1%) |
| 3 or 4 Children | 0 (0.0%) | 0 (0.0%) |
| 5 or more Children | 0 (0.0%) | 0 (0.0%) |
| Total | 29 (29.3%) | 70 (70.7%) |
Income Below Poverty Among Single-Parent Households in Palo Seco
According to the poverty data in Palo Seco, 100.0% or 47 single-father households and 56.5% or 35 single-mother households are living below the poverty line. Among single-father households, those with 1 or 2 children have the highest poverty rate, with 47 households (100.0%) experiencing poverty. Likewise, among single-mother households, those with 1 or 2 children have the highest poverty rate, with 35 households (100.0%) falling below the poverty line.
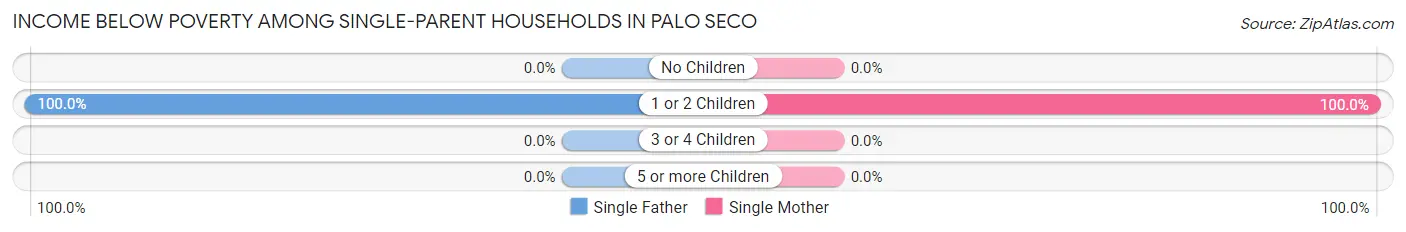
| Children | Single Father | Single Mother |
| No Children | 0 (0.0%) | 0 (0.0%) |
| 1 or 2 Children | 47 (100.0%) | 35 (100.0%) |
| 3 or 4 Children | 0 (0.0%) | 0 (0.0%) |
| 5 or more Children | 0 (0.0%) | 0 (0.0%) |
| Total | 47 (100.0%) | 35 (56.5%) |
Income Below Poverty Among Married-Couple vs Single-Parent Households in Palo Seco
The poverty data for Palo Seco shows that 70 of the married-couple family households (70.7%) and 82 of the single-parent households (75.2%) are living below the poverty level. Within the married-couple family households, those with no children have the highest poverty rate, with 42 households (100.0%) falling below the poverty line. Among the single-parent households, those with 1 or 2 children have the highest poverty rate, with 82 household (100.0%) living below poverty.
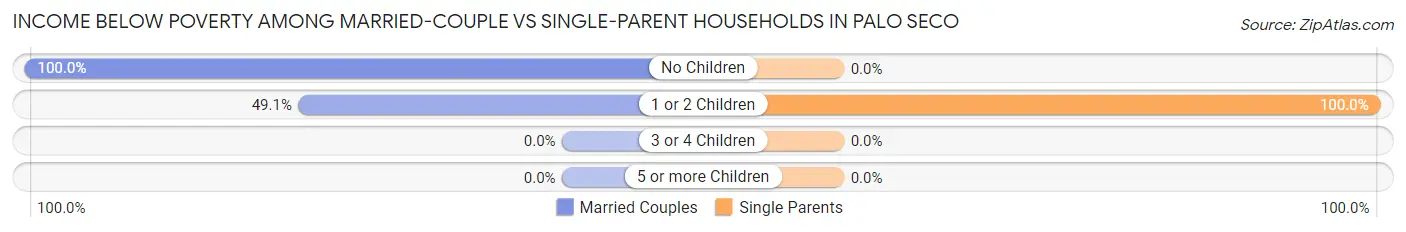
| Children | Married-Couple Families | Single-Parent Households |
| No Children | 42 (100.0%) | 0 (0.0%) |
| 1 or 2 Children | 28 (49.1%) | 82 (100.0%) |
| 3 or 4 Children | 0 (0.0%) | 0 (0.0%) |
| 5 or more Children | 0 (0.0%) | 0 (0.0%) |
| Total | 70 (70.7%) | 82 (75.2%) |
Race in Palo Seco
The most populous races in Palo Seco are Hispanic or Latino (795 | 100.0%), Black / African American (384 | 48.3%), and Some other Race (284 | 35.7%).
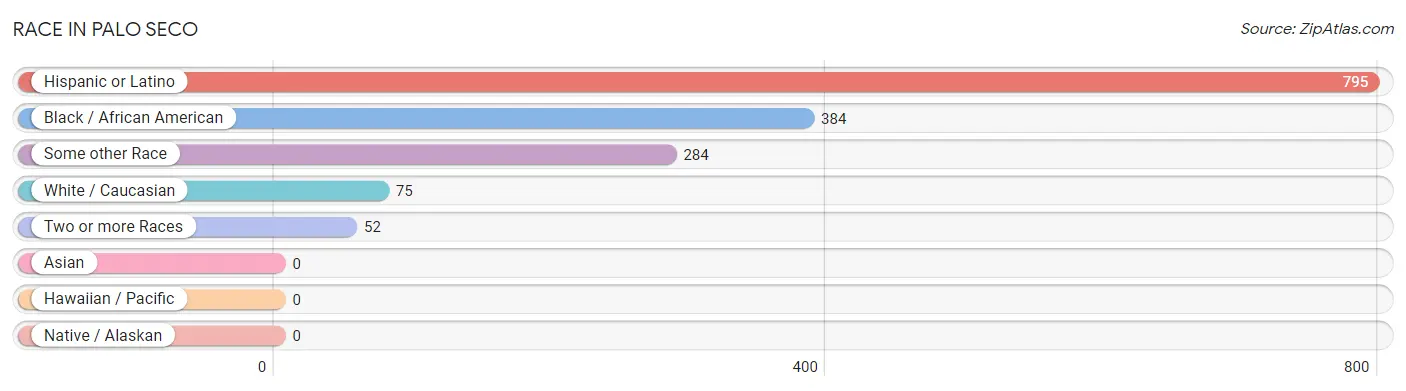
| Race | # Population | % Population |
| Asian | 0 | 0.0% |
| Black / African American | 384 | 48.3% |
| Hawaiian / Pacific | 0 | 0.0% |
| Hispanic or Latino | 795 | 100.0% |
| Native / Alaskan | 0 | 0.0% |
| White / Caucasian | 75 | 9.4% |
| Two or more Races | 52 | 6.5% |
| Some other Race | 284 | 35.7% |
| Total | 795 | 100.0% |
Ancestry in Palo Seco
The most populous ancestries reported in Palo Seco are , and Puerto Rican (795 | 100.0%), together accounting for 100.0% of all Palo Seco residents.

| Ancestry | # Population | % Population |
| Puerto Rican | 795 | 100.0% | View All 1 Rows |
Immigrants in Palo Seco

| Immigration Origin | # Population | % Population | View All 0 Rows |
Sex and Age in Palo Seco
Sex and Age in Palo Seco
The most populous age groups in Palo Seco are 70 to 74 Years (79 | 18.8%) for men and 30 to 34 Years (62 | 16.5%) for women.
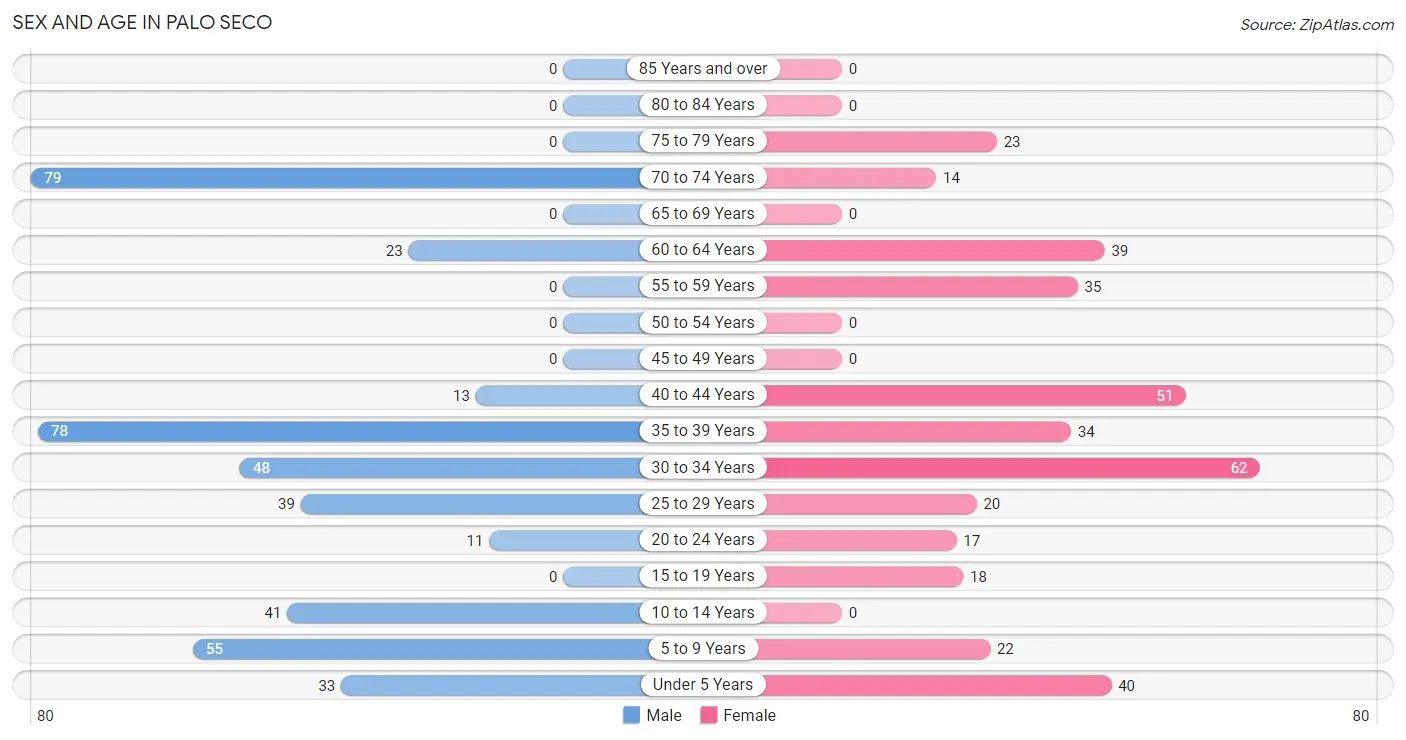
| Age Bracket | Male | Female |
| Under 5 Years | 33 (7.9%) | 40 (10.7%) |
| 5 to 9 Years | 55 (13.1%) | 22 (5.9%) |
| 10 to 14 Years | 41 (9.8%) | 0 (0.0%) |
| 15 to 19 Years | 0 (0.0%) | 18 (4.8%) |
| 20 to 24 Years | 11 (2.6%) | 17 (4.5%) |
| 25 to 29 Years | 39 (9.3%) | 20 (5.3%) |
| 30 to 34 Years | 48 (11.4%) | 62 (16.5%) |
| 35 to 39 Years | 78 (18.6%) | 34 (9.1%) |
| 40 to 44 Years | 13 (3.1%) | 51 (13.6%) |
| 45 to 49 Years | 0 (0.0%) | 0 (0.0%) |
| 50 to 54 Years | 0 (0.0%) | 0 (0.0%) |
| 55 to 59 Years | 0 (0.0%) | 35 (9.3%) |
| 60 to 64 Years | 23 (5.5%) | 39 (10.4%) |
| 65 to 69 Years | 0 (0.0%) | 0 (0.0%) |
| 70 to 74 Years | 79 (18.8%) | 14 (3.7%) |
| 75 to 79 Years | 0 (0.0%) | 23 (6.1%) |
| 80 to 84 Years | 0 (0.0%) | 0 (0.0%) |
| 85 Years and over | 0 (0.0%) | 0 (0.0%) |
| Total | 420 (100.0%) | 375 (100.0%) |
Families and Households in Palo Seco
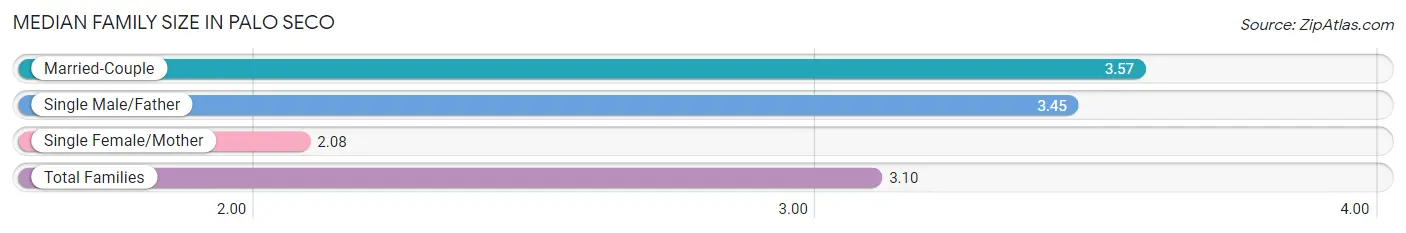
Median Family Size in Palo Seco
The median family size in Palo Seco is 3.10 persons per family, with married-couple families (99 | 47.6%) accounting for the largest median family size of 3.57 persons per family. On the other hand, single female/mother families (62 | 29.8%) represent the smallest median family size with 2.08 persons per family.
| Family Type | # Families | Family Size |
| Married-Couple | 99 (47.6%) | 3.57 |
| Single Male/Father | 47 (22.6%) | 3.45 |
| Single Female/Mother | 62 (29.8%) | 2.08 |
| Total Families | 208 (100.0%) | 3.10 |
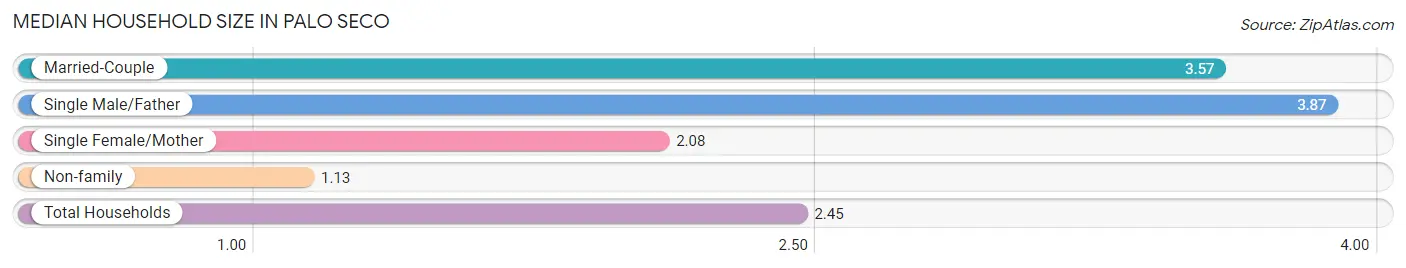
Median Household Size in Palo Seco
The median household size in Palo Seco is 2.45 persons per household, with single male/father households (47 | 14.5%) accounting for the largest median household size of 3.87 persons per household. non-family households (116 | 35.8%) represent the smallest median household size with 1.13 persons per household.
| Household Type | # Households | Household Size |
| Married-Couple | 99 (30.6%) | 3.57 |
| Single Male/Father | 47 (14.5%) | 3.87 |
| Single Female/Mother | 62 (19.1%) | 2.08 |
| Non-family | 116 (35.8%) | 1.13 |
| Total Households | 324 (100.0%) | 2.45 |
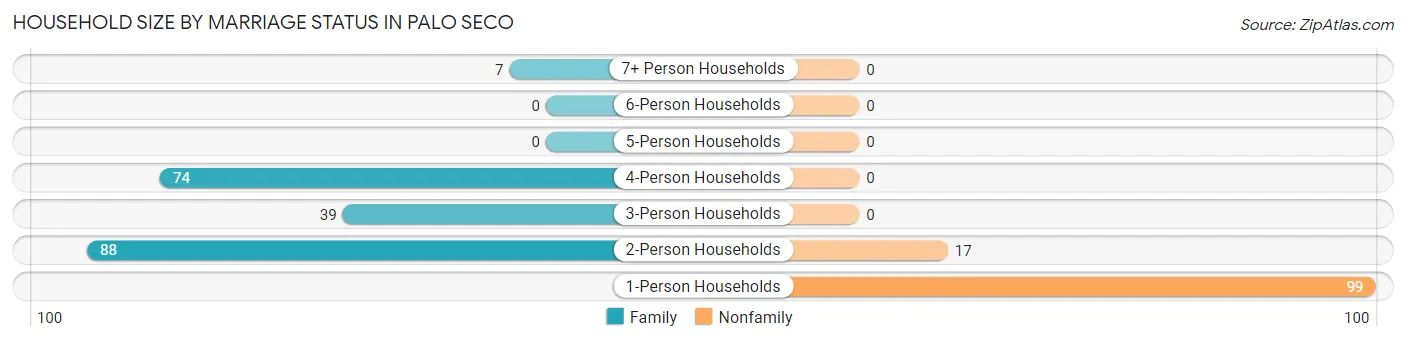
Household Size by Marriage Status in Palo Seco
Out of a total of 324 households in Palo Seco, 208 (64.2%) are family households, while 116 (35.8%) are nonfamily households. The most numerous type of family households are 2-person households, comprising 88, and the most common type of nonfamily households are 1-person households, comprising 99.
| Household Size | Family Households | Nonfamily Households |
| 1-Person Households | - | 99 (30.6%) |
| 2-Person Households | 88 (27.2%) | 17 (5.2%) |
| 3-Person Households | 39 (12.0%) | 0 (0.0%) |
| 4-Person Households | 74 (22.8%) | 0 (0.0%) |
| 5-Person Households | 0 (0.0%) | 0 (0.0%) |
| 6-Person Households | 0 (0.0%) | 0 (0.0%) |
| 7+ Person Households | 7 (2.2%) | 0 (0.0%) |
| Total | 208 (64.2%) | 116 (35.8%) |
Female Fertility in Palo Seco
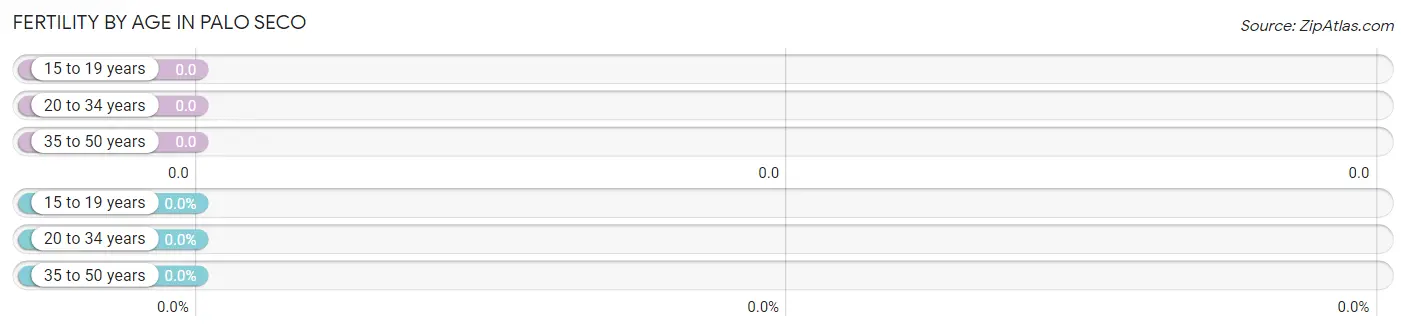
Fertility by Age in Palo Seco
| Age Bracket | Women with Births | Births / 1,000 Women |
| 15 to 19 years | 0 (0.0%) | 0.0 |
| 20 to 34 years | 0 (0.0%) | 0.0 |
| 35 to 50 years | 0 (0.0%) | 0.0 |
| Total | 0 (0.0%) | 0.0 |
Fertility by Age by Marriage Status in Palo Seco
| Age Bracket | Married | Unmarried |
| 15 to 19 years | 0 (0.0%) | 0 (0.0%) |
| 20 to 34 years | 0 (0.0%) | 0 (0.0%) |
| 35 to 50 years | 0 (0.0%) | 0 (0.0%) |
| Total | 0 (0.0%) | 0 (0.0%) |
Fertility by Education in Palo Seco
| Educational Attainment | Women with Births | Births / 1,000 Women |
| Less than High School | 0 (0.0%) | 0.0 |
| High School Diploma | 0 (0.0%) | 0.0 |
| College or Associate's Degree | 0 (0.0%) | 0.0 |
| Bachelor's Degree | 0 (0.0%) | 0.0 |
| Graduate Degree | 0 (0.0%) | 0.0 |
| Total | 0 (0.0%) | 0.0 |
Fertility by Education by Marriage Status in Palo Seco
| Educational Attainment | Married | Unmarried |
| Less than High School | 0 (0.0%) | 0 (0.0%) |
| High School Diploma | 0 (0.0%) | 0 (0.0%) |
| College or Associate's Degree | 0 (0.0%) | 0 (0.0%) |
| Bachelor's Degree | 0 (0.0%) | 0 (0.0%) |
| Graduate Degree | 0 (0.0%) | 0 (0.0%) |
| Total | 0 (0.0%) | 0 (0.0%) |
Employment Characteristics in Palo Seco
Employment by Class of Employer in Palo Seco
Among the 188 employed individuals in Palo Seco, private company employees (119 | 63.3%), local government employees (56 | 29.8%), and state government employees (13 | 6.9%) make up the most common classes of employment.
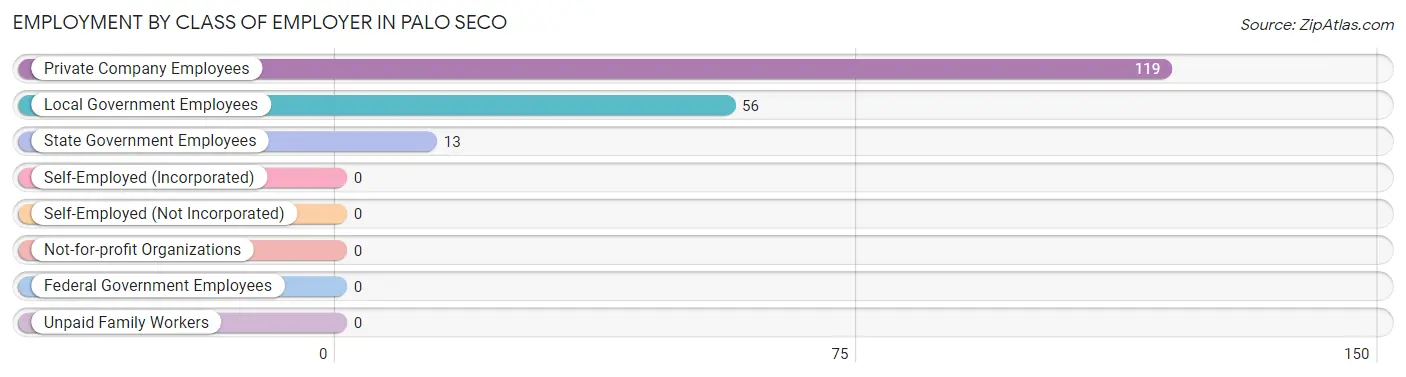
| Employer Class | # Employees | % Employees |
| Private Company Employees | 119 | 63.3% |
| Self-Employed (Incorporated) | 0 | 0.0% |
| Self-Employed (Not Incorporated) | 0 | 0.0% |
| Not-for-profit Organizations | 0 | 0.0% |
| Local Government Employees | 56 | 29.8% |
| State Government Employees | 13 | 6.9% |
| Federal Government Employees | 0 | 0.0% |
| Unpaid Family Workers | 0 | 0.0% |
| Total | 188 | 100.0% |
Employment Status by Age in Palo Seco
According to the labor force statistics for Palo Seco, out of the total population over 16 years of age (604), 52.2% or 315 individuals are in the labor force, with 22.9% or 72 of them unemployed. The age group with the highest labor force participation rate is 25 to 29 years, with 100.0% or 59 individuals in the labor force. Within the labor force, the 25 to 29 years age range has the highest percentage of unemployed individuals, with 100.0% or 59 of them being unemployed.
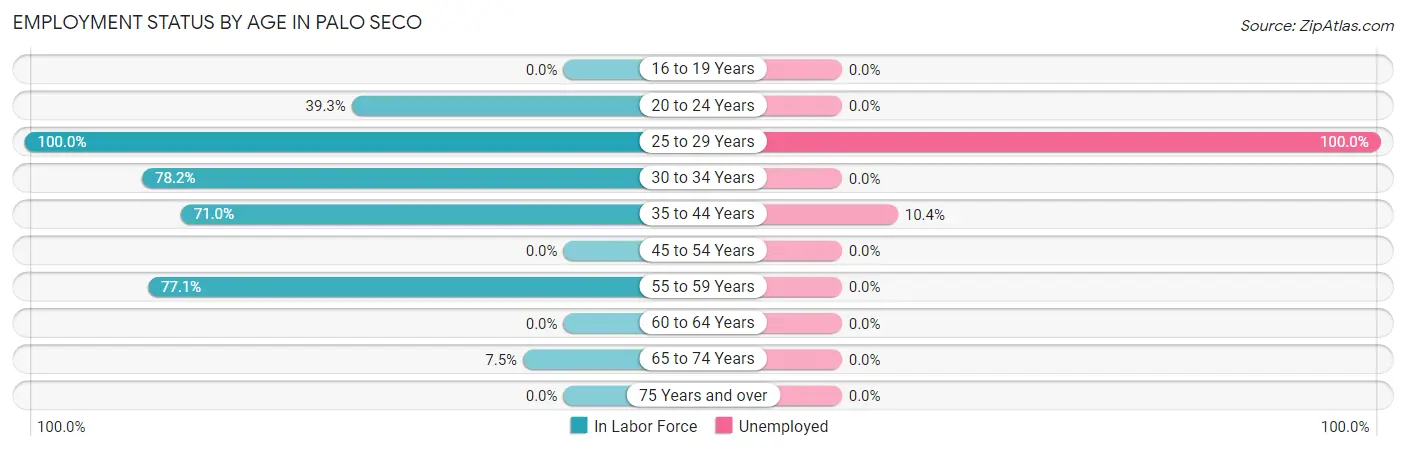
| Age Bracket | In Labor Force | Unemployed |
| 16 to 19 Years | 0 (0.0%) | 0 (0.0%) |
| 20 to 24 Years | 11 (39.3%) | 0 (0.0%) |
| 25 to 29 Years | 59 (100.0%) | 59 (100.0%) |
| 30 to 34 Years | 86 (78.2%) | 0 (0.0%) |
| 35 to 44 Years | 125 (71.0%) | 13 (10.4%) |
| 45 to 54 Years | 0 (0.0%) | 0 (0.0%) |
| 55 to 59 Years | 27 (77.1%) | 0 (0.0%) |
| 60 to 64 Years | 0 (0.0%) | 0 (0.0%) |
| 65 to 74 Years | 7 (7.5%) | 0 (0.0%) |
| 75 Years and over | 0 (0.0%) | 0 (0.0%) |
| Total | 315 (52.2%) | 72 (22.9%) |
Employment Status by Educational Attainment in Palo Seco
According to labor force statistics for Palo Seco, 67.2% of individuals (297) out of the total population between 25 and 64 years of age (442) are in the labor force, with 24.2% or 72 of them being unemployed. The group with the highest labor force participation rate are those with the educational attainment of college / associate degree, with 96.2% or 175 individuals in the labor force. Within the labor force, individuals with high school diploma education have the highest percentage of unemployment, with 38.5% or 20 of them being unemployed.
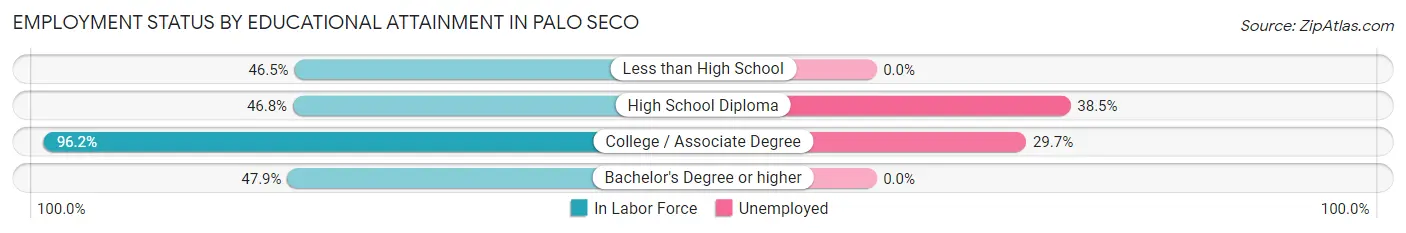
| Educational Attainment | In Labor Force | Unemployed |
| Less than High School | 47 (46.5%) | 0 (0.0%) |
| High School Diploma | 52 (46.8%) | 43 (38.5%) |
| College / Associate Degree | 175 (96.2%) | 54 (29.7%) |
| Bachelor's Degree or higher | 23 (47.9%) | 0 (0.0%) |
| Total | 297 (67.2%) | 107 (24.2%) |
Employment Occupations by Sex in Palo Seco
Management, Business, Science and Arts Occupations
The most common Management, Business, Science and Arts occupations in Palo Seco are Health Diagnosing & Treating (9 | 3.7%), and Health Technologists (9 | 3.7%).
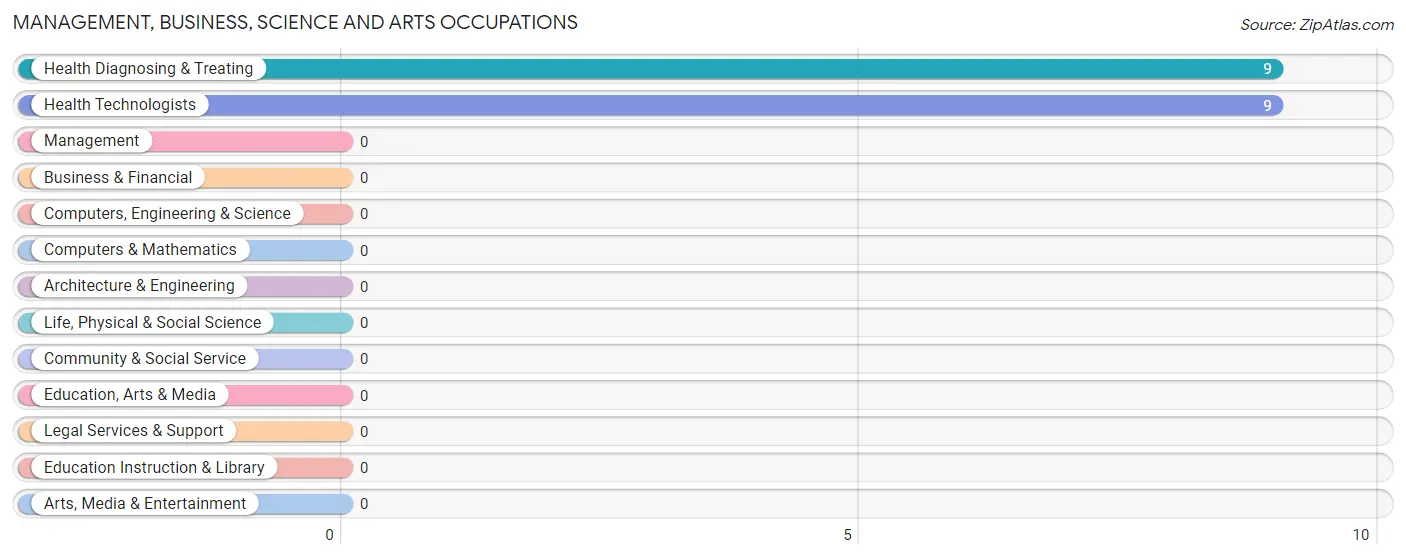
Management, Business, Science and Arts Occupations by Sex
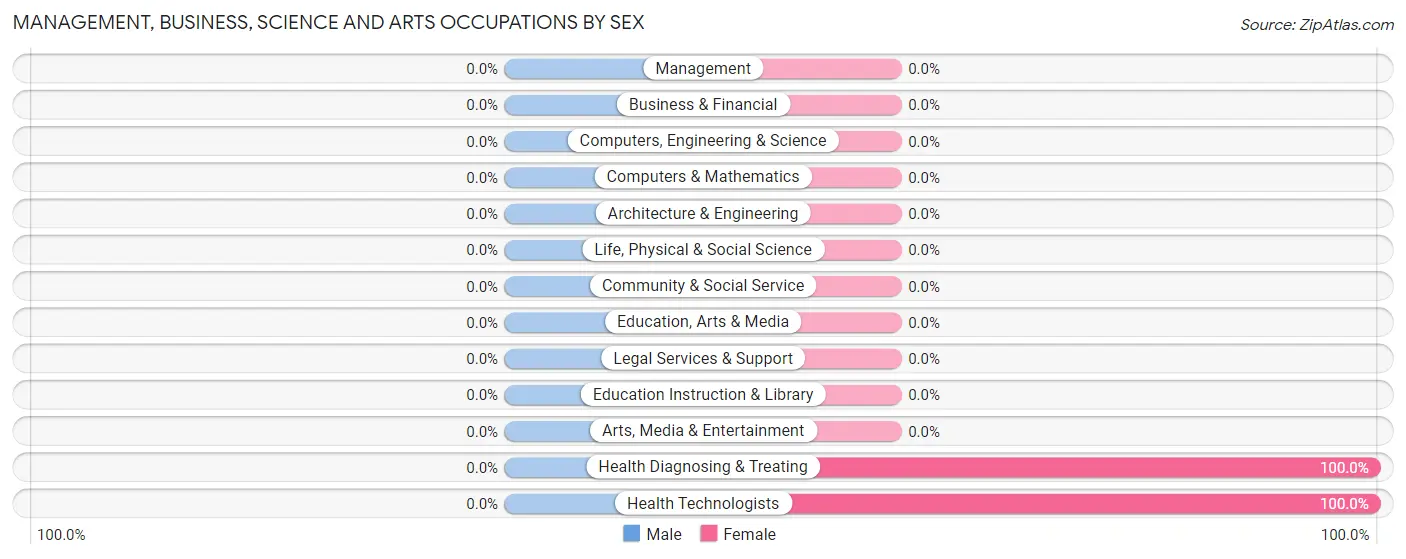
| Occupation | Male | Female |
| Management | 0 (0.0%) | 0 (0.0%) |
| Business & Financial | 0 (0.0%) | 0 (0.0%) |
| Computers, Engineering & Science | 0 (0.0%) | 0 (0.0%) |
| Computers & Mathematics | 0 (0.0%) | 0 (0.0%) |
| Architecture & Engineering | 0 (0.0%) | 0 (0.0%) |
| Life, Physical & Social Science | 0 (0.0%) | 0 (0.0%) |
| Community & Social Service | 0 (0.0%) | 0 (0.0%) |
| Education, Arts & Media | 0 (0.0%) | 0 (0.0%) |
| Legal Services & Support | 0 (0.0%) | 0 (0.0%) |
| Education Instruction & Library | 0 (0.0%) | 0 (0.0%) |
| Arts, Media & Entertainment | 0 (0.0%) | 0 (0.0%) |
| Health Diagnosing & Treating | 0 (0.0%) | 9 (100.0%) |
| Health Technologists | 0 (0.0%) | 9 (100.0%) |
| Total (Category) | 0 (0.0%) | 9 (100.0%) |
| Total (Overall) | 157 (64.6%) | 86 (35.4%) |
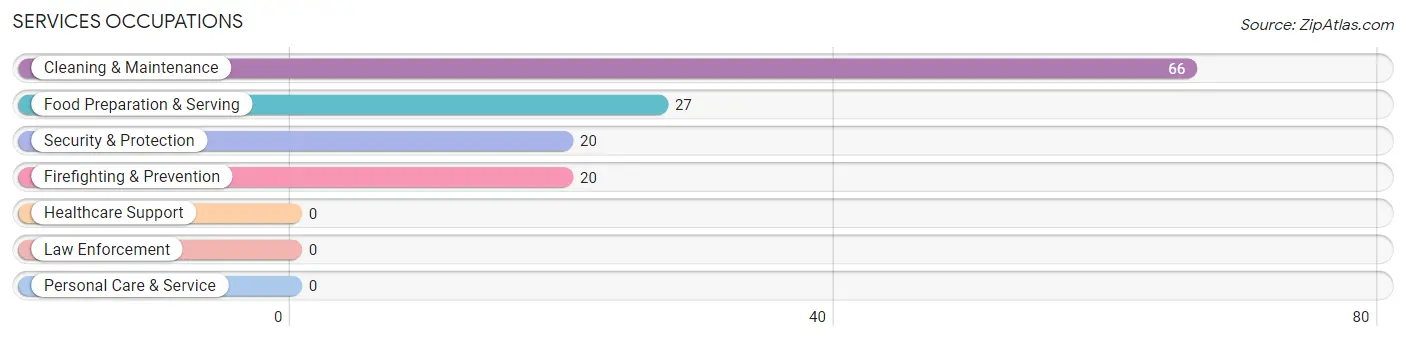
Services Occupations
The most common Services occupations in Palo Seco are Cleaning & Maintenance (66 | 27.2%), Food Preparation & Serving (27 | 11.1%), Security & Protection (20 | 8.2%), and Firefighting & Prevention (20 | 8.2%).
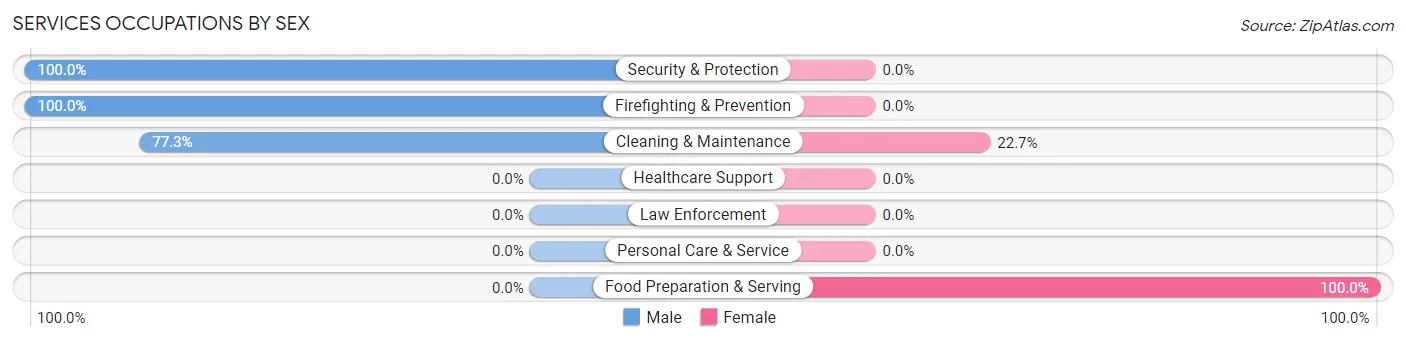
Services Occupations by Sex
Within the Services occupations in Palo Seco, the most male-oriented occupations are Security & Protection (100.0%), Firefighting & Prevention (100.0%), and Cleaning & Maintenance (77.3%), while the most female-oriented occupations are Food Preparation & Serving (100.0%), and Cleaning & Maintenance (22.7%).
| Occupation | Male | Female |
| Healthcare Support | 0 (0.0%) | 0 (0.0%) |
| Security & Protection | 20 (100.0%) | 0 (0.0%) |
| Firefighting & Prevention | 20 (100.0%) | 0 (0.0%) |
| Law Enforcement | 0 (0.0%) | 0 (0.0%) |
| Food Preparation & Serving | 0 (0.0%) | 27 (100.0%) |
| Cleaning & Maintenance | 51 (77.3%) | 15 (22.7%) |
| Personal Care & Service | 0 (0.0%) | 0 (0.0%) |
| Total (Category) | 71 (62.8%) | 42 (37.2%) |
| Total (Overall) | 157 (64.6%) | 86 (35.4%) |
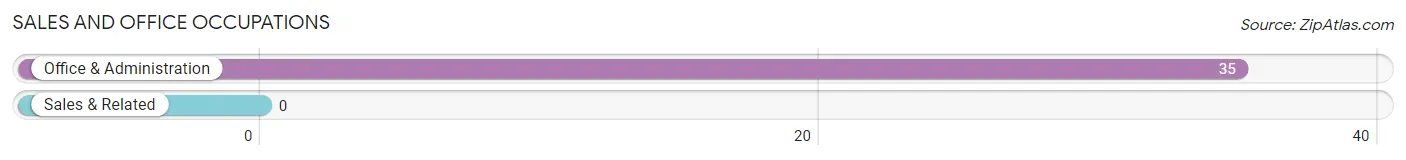
Sales and Office Occupations
The most common Sales and Office occupations in Palo Seco are , and Office & Administration (35 | 14.4%).
Sales and Office Occupations by Sex

| Occupation | Male | Female |
| Sales & Related | 0 (0.0%) | 0 (0.0%) |
| Office & Administration | 0 (0.0%) | 35 (100.0%) |
| Total (Category) | 0 (0.0%) | 35 (100.0%) |
| Total (Overall) | 157 (64.6%) | 86 (35.4%) |
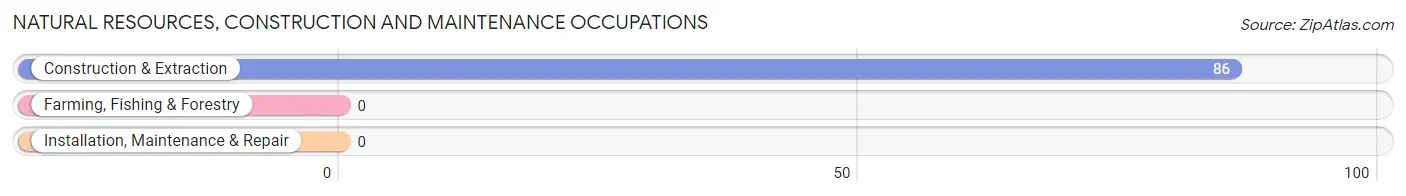
Natural Resources, Construction and Maintenance Occupations
The most common Natural Resources, Construction and Maintenance occupations in Palo Seco are , and Construction & Extraction (86 | 35.4%).
Natural Resources, Construction and Maintenance Occupations by Sex
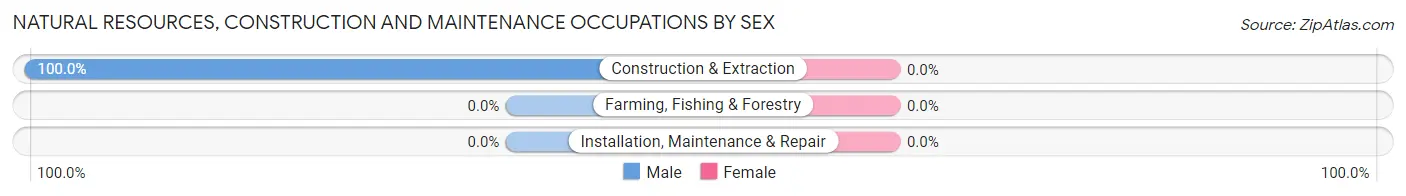
| Occupation | Male | Female |
| Farming, Fishing & Forestry | 0 (0.0%) | 0 (0.0%) |
| Construction & Extraction | 86 (100.0%) | 0 (0.0%) |
| Installation, Maintenance & Repair | 0 (0.0%) | 0 (0.0%) |
| Total (Category) | 86 (100.0%) | 0 (0.0%) |
| Total (Overall) | 157 (64.6%) | 86 (35.4%) |
Production, Transportation and Moving Occupations
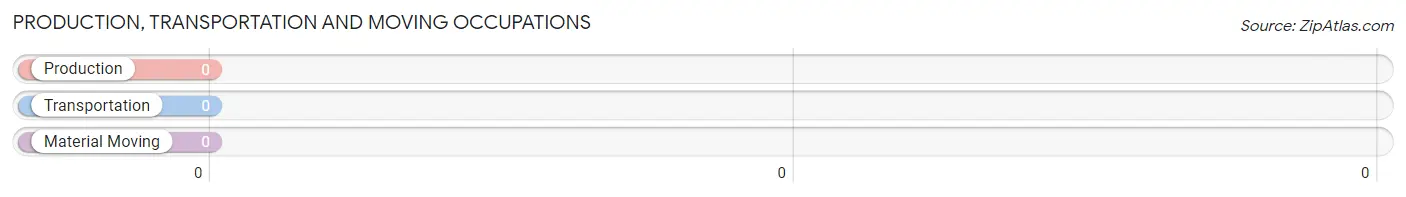
Production, Transportation and Moving Occupations by Sex
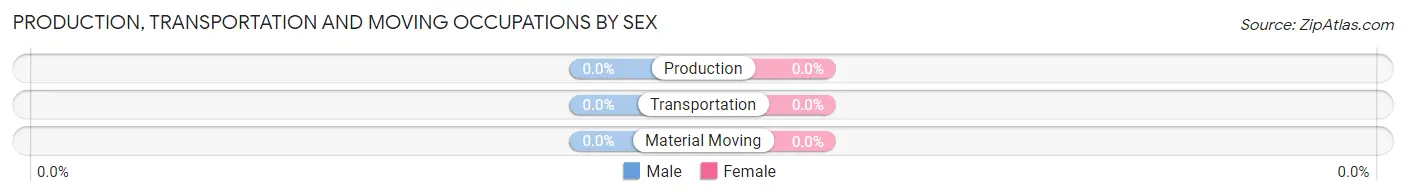
| Occupation | Male | Female |
| Production | 0 (0.0%) | 0 (0.0%) |
| Transportation | 0 (0.0%) | 0 (0.0%) |
| Material Moving | 0 (0.0%) | 0 (0.0%) |
| Total (Category) | 0 (0.0%) | 0 (0.0%) |
| Total (Overall) | 157 (64.6%) | 86 (35.4%) |
Employment Industries by Sex in Palo Seco
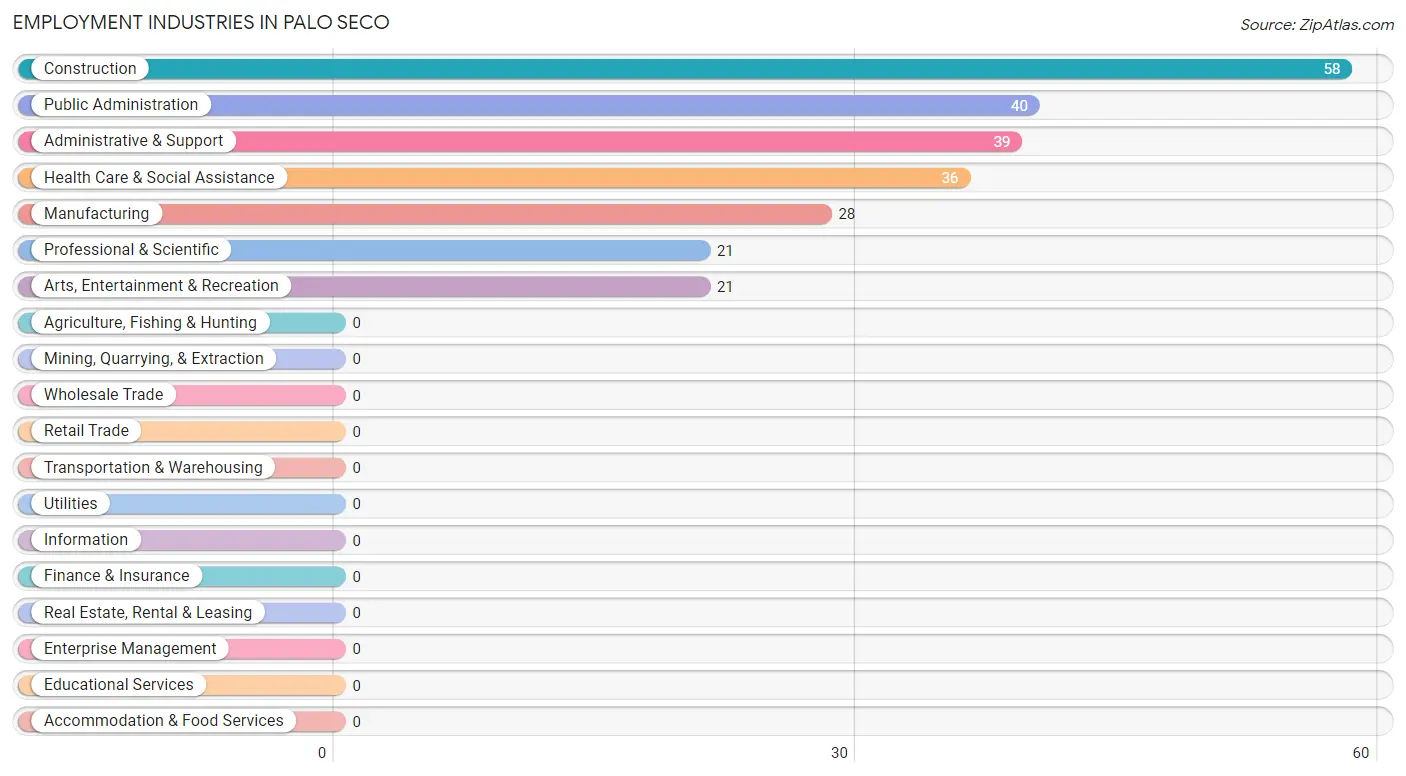
Employment Industries in Palo Seco
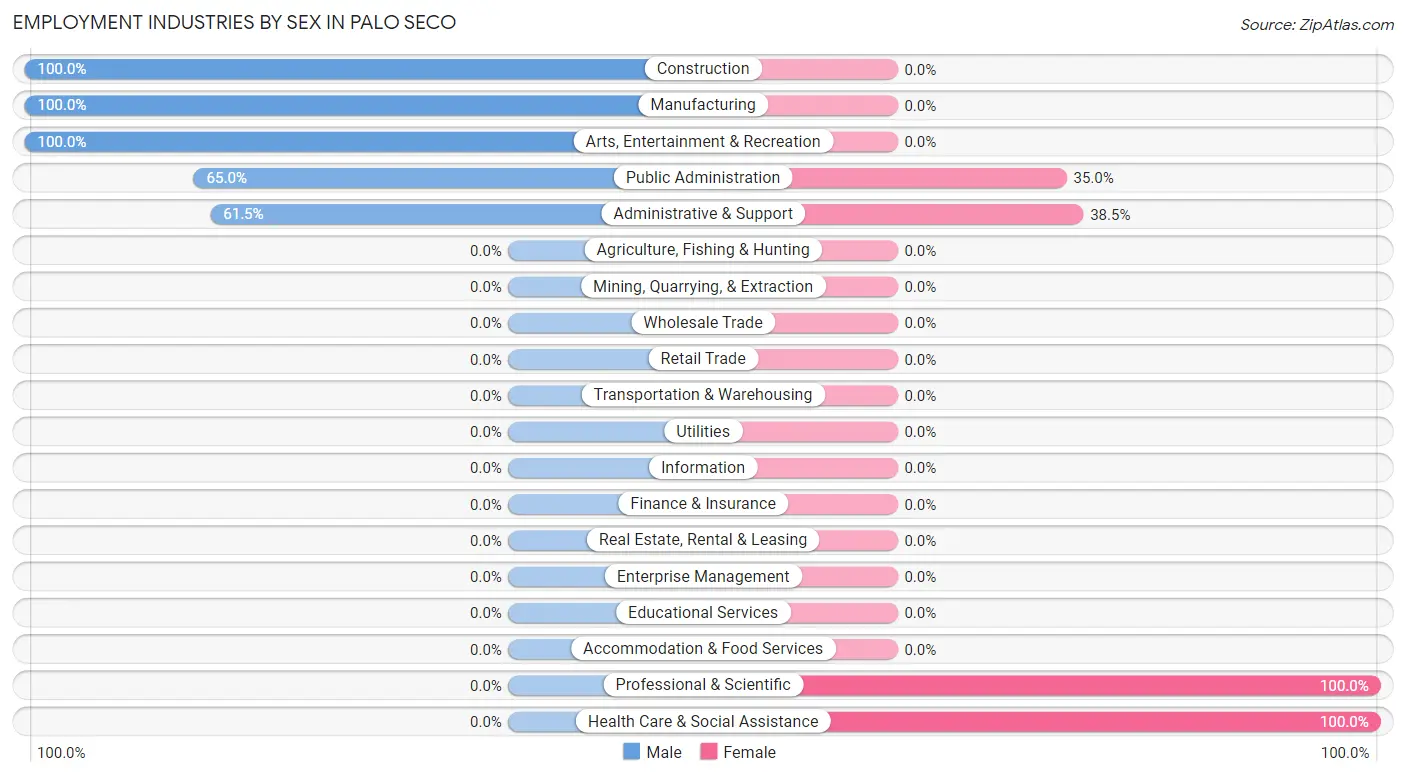
The major employment industries in Palo Seco include Construction (58 | 23.9%), Public Administration (40 | 16.5%), Administrative & Support (39 | 16.1%), Health Care & Social Assistance (36 | 14.8%), and Manufacturing (28 | 11.5%).
Employment Industries by Sex in Palo Seco
The Palo Seco industries that see more men than women are Construction (100.0%), Manufacturing (100.0%), and Arts, Entertainment & Recreation (100.0%), whereas the industries that tend to have a higher number of women are Professional & Scientific (100.0%), Health Care & Social Assistance (100.0%), and Administrative & Support (38.5%).
| Industry | Male | Female |
| Agriculture, Fishing & Hunting | 0 (0.0%) | 0 (0.0%) |
| Mining, Quarrying, & Extraction | 0 (0.0%) | 0 (0.0%) |
| Construction | 58 (100.0%) | 0 (0.0%) |
| Manufacturing | 28 (100.0%) | 0 (0.0%) |
| Wholesale Trade | 0 (0.0%) | 0 (0.0%) |
| Retail Trade | 0 (0.0%) | 0 (0.0%) |
| Transportation & Warehousing | 0 (0.0%) | 0 (0.0%) |
| Utilities | 0 (0.0%) | 0 (0.0%) |
| Information | 0 (0.0%) | 0 (0.0%) |
| Finance & Insurance | 0 (0.0%) | 0 (0.0%) |
| Real Estate, Rental & Leasing | 0 (0.0%) | 0 (0.0%) |
| Professional & Scientific | 0 (0.0%) | 21 (100.0%) |
| Enterprise Management | 0 (0.0%) | 0 (0.0%) |
| Administrative & Support | 24 (61.5%) | 15 (38.5%) |
| Educational Services | 0 (0.0%) | 0 (0.0%) |
| Health Care & Social Assistance | 0 (0.0%) | 36 (100.0%) |
| Arts, Entertainment & Recreation | 21 (100.0%) | 0 (0.0%) |
| Accommodation & Food Services | 0 (0.0%) | 0 (0.0%) |
| Public Administration | 26 (65.0%) | 14 (35.0%) |
| Total | 157 (64.6%) | 86 (35.4%) |
Education in Palo Seco
School Enrollment in Palo Seco
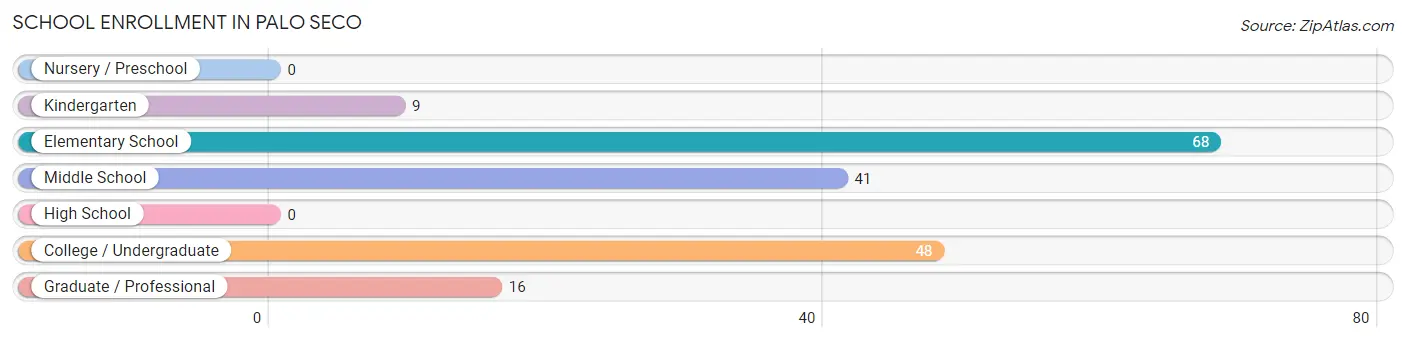
The most common levels of schooling among the 182 students in Palo Seco are elementary school (68 | 37.4%), college / undergraduate (48 | 26.4%), and middle school (41 | 22.5%).
| School Level | # Students | % Students |
| Nursery / Preschool | 0 | 0.0% |
| Kindergarten | 9 | 5.0% |
| Elementary School | 68 | 37.4% |
| Middle School | 41 | 22.5% |
| High School | 0 | 0.0% |
| College / Undergraduate | 48 | 26.4% |
| Graduate / Professional | 16 | 8.8% |
| Total | 182 | 100.0% |
School Enrollment by Age by Funding Source in Palo Seco
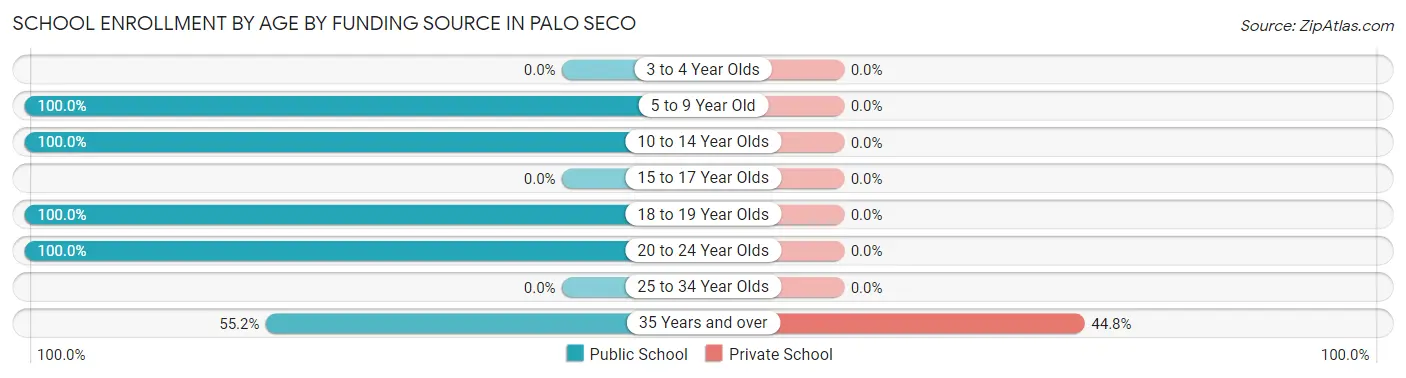
Out of a total of 182 students who are enrolled in schools in Palo Seco, 13 (7.1%) attend a private institution, while the remaining 169 (92.9%) are enrolled in public schools. The age group of 35 years and over has the highest likelihood of being enrolled in private schools, with 13 (44.8% in the age bracket) enrolled. Conversely, the age group of 5 to 9 year old has the lowest likelihood of being enrolled in a private school, with 77 (100.0% in the age bracket) attending a public institution.
| Age Bracket | Public School | Private School |
| 3 to 4 Year Olds | 0 (0.0%) | 0 (0.0%) |
| 5 to 9 Year Old | 77 (100.0%) | 0 (0.0%) |
| 10 to 14 Year Olds | 41 (100.0%) | 0 (0.0%) |
| 15 to 17 Year Olds | 0 (0.0%) | 0 (0.0%) |
| 18 to 19 Year Olds | 18 (100.0%) | 0 (0.0%) |
| 20 to 24 Year Olds | 17 (100.0%) | 0 (0.0%) |
| 25 to 34 Year Olds | 0 (0.0%) | 0 (0.0%) |
| 35 Years and over | 16 (55.2%) | 13 (44.8%) |
| Total | 169 (92.9%) | 13 (7.1%) |
Educational Attainment by Field of Study in Palo Seco
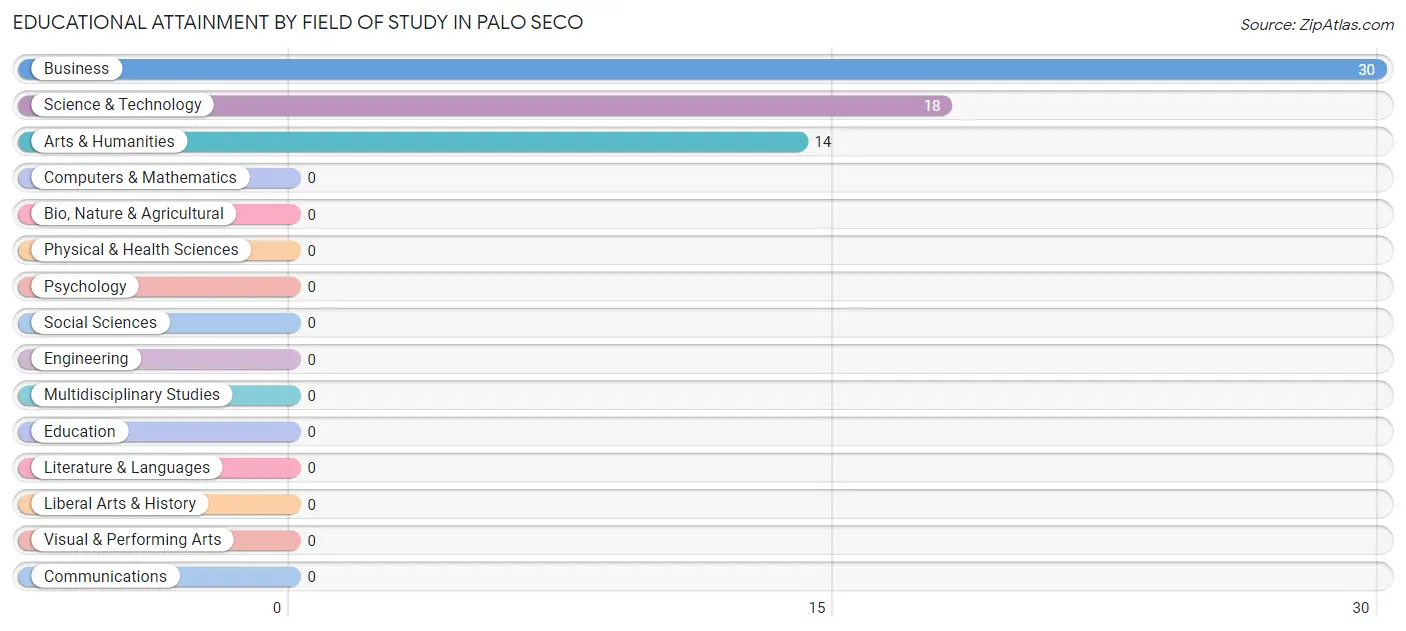
Business (30 | 48.4%), science & technology (18 | 29.0%), and arts & humanities (14 | 22.6%) are the most common fields of study among 62 individuals in Palo Seco who have obtained a bachelor's degree or higher.
| Field of Study | # Graduates | % Graduates |
| Computers & Mathematics | 0 | 0.0% |
| Bio, Nature & Agricultural | 0 | 0.0% |
| Physical & Health Sciences | 0 | 0.0% |
| Psychology | 0 | 0.0% |
| Social Sciences | 0 | 0.0% |
| Engineering | 0 | 0.0% |
| Multidisciplinary Studies | 0 | 0.0% |
| Science & Technology | 18 | 29.0% |
| Business | 30 | 48.4% |
| Education | 0 | 0.0% |
| Literature & Languages | 0 | 0.0% |
| Liberal Arts & History | 0 | 0.0% |
| Visual & Performing Arts | 0 | 0.0% |
| Communications | 0 | 0.0% |
| Arts & Humanities | 14 | 22.6% |
| Total | 62 | 100.0% |
Transportation & Commute in Palo Seco
Vehicle Availability by Sex in Palo Seco
The most prevalent vehicle ownership categories in Palo Seco are males with 2 vehicles (63, accounting for 48.8%) and females with 2 vehicles (15, making up 106.8%).
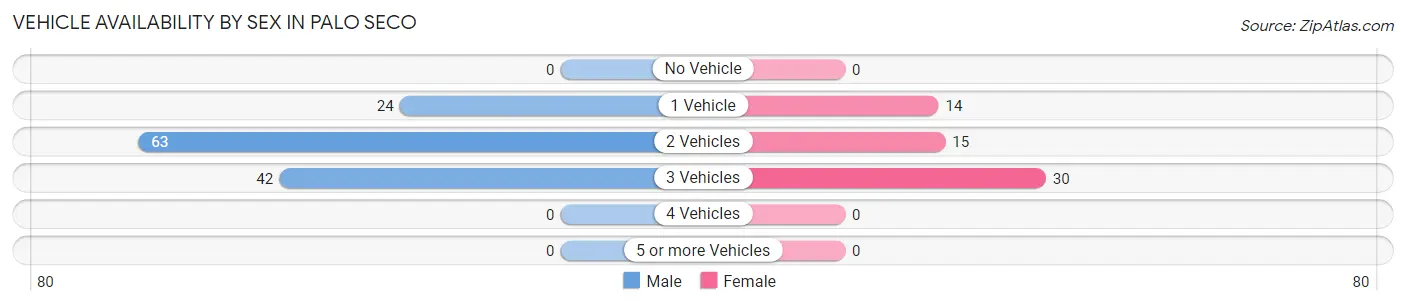
| Vehicles Available | Male | Female |
| No Vehicle | 0 (0.0%) | 0 (0.0%) |
| 1 Vehicle | 24 (18.6%) | 14 (23.7%) |
| 2 Vehicles | 63 (48.8%) | 15 (25.4%) |
| 3 Vehicles | 42 (32.6%) | 30 (50.8%) |
| 4 Vehicles | 0 (0.0%) | 0 (0.0%) |
| 5 or more Vehicles | 0 (0.0%) | 0 (0.0%) |
| Total | 129 (100.0%) | 59 (100.0%) |
Commute Time in Palo Seco
The most frequently occuring commute durations in Palo Seco are 15 to 19 minutes (34 commuters, 18.1%), 10 to 14 minutes (32 commuters, 17.0%), and 25 to 29 minutes (32 commuters, 17.0%).
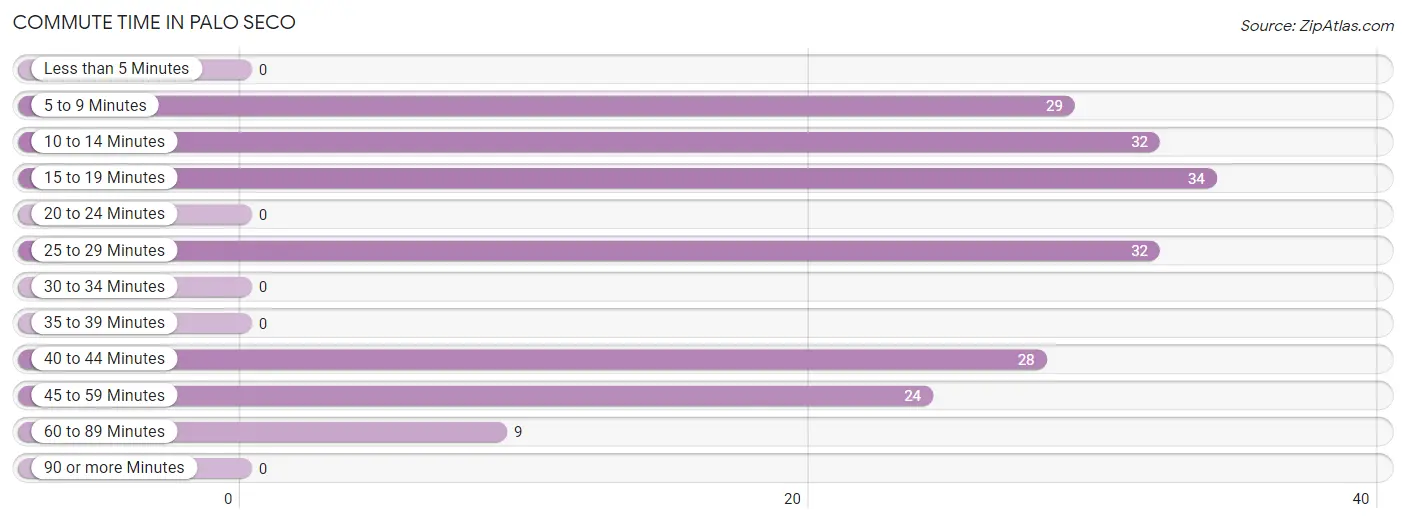
| Commute Time | # Commuters | % Commuters |
| Less than 5 Minutes | 0 | 0.0% |
| 5 to 9 Minutes | 29 | 15.4% |
| 10 to 14 Minutes | 32 | 17.0% |
| 15 to 19 Minutes | 34 | 18.1% |
| 20 to 24 Minutes | 0 | 0.0% |
| 25 to 29 Minutes | 32 | 17.0% |
| 30 to 34 Minutes | 0 | 0.0% |
| 35 to 39 Minutes | 0 | 0.0% |
| 40 to 44 Minutes | 28 | 14.9% |
| 45 to 59 Minutes | 24 | 12.8% |
| 60 to 89 Minutes | 9 | 4.8% |
| 90 or more Minutes | 0 | 0.0% |
Commute Time by Sex in Palo Seco
The most common commute times in Palo Seco are 5 to 9 minutes (29 commuters, 22.5%) for males and 15 to 19 minutes (21 commuters, 35.6%) for females.
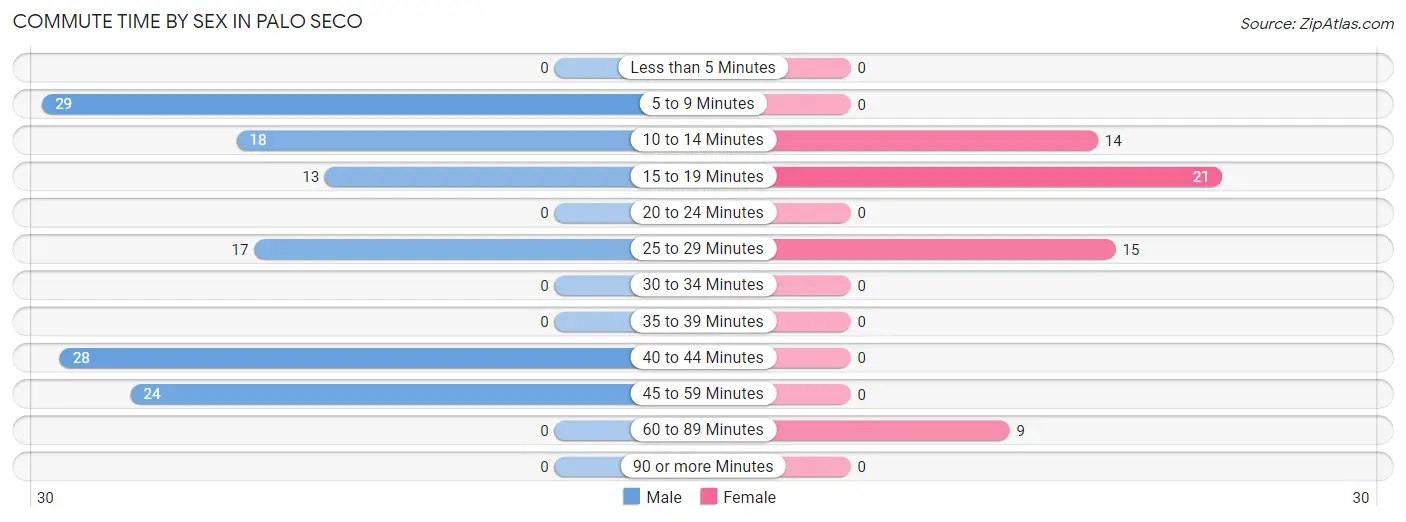
| Commute Time | Male | Female |
| Less than 5 Minutes | 0 (0.0%) | 0 (0.0%) |
| 5 to 9 Minutes | 29 (22.5%) | 0 (0.0%) |
| 10 to 14 Minutes | 18 (14.0%) | 14 (23.7%) |
| 15 to 19 Minutes | 13 (10.1%) | 21 (35.6%) |
| 20 to 24 Minutes | 0 (0.0%) | 0 (0.0%) |
| 25 to 29 Minutes | 17 (13.2%) | 15 (25.4%) |
| 30 to 34 Minutes | 0 (0.0%) | 0 (0.0%) |
| 35 to 39 Minutes | 0 (0.0%) | 0 (0.0%) |
| 40 to 44 Minutes | 28 (21.7%) | 0 (0.0%) |
| 45 to 59 Minutes | 24 (18.6%) | 0 (0.0%) |
| 60 to 89 Minutes | 0 (0.0%) | 9 (15.2%) |
| 90 or more Minutes | 0 (0.0%) | 0 (0.0%) |
Time of Departure to Work by Sex in Palo Seco
The most frequent times of departure to work in Palo Seco are 6:00 AM to 6:29 AM (47, 36.4%) for males and 7:30 AM to 7:59 AM (35, 59.3%) for females.
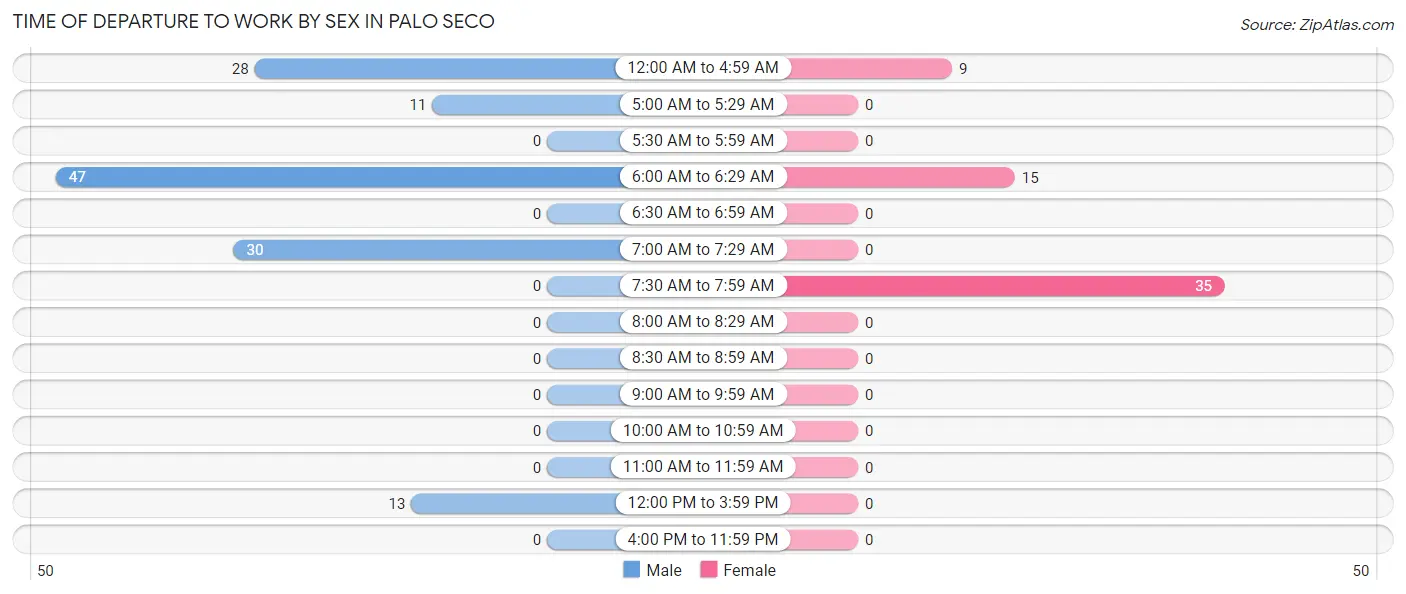
| Time of Departure | Male | Female |
| 12:00 AM to 4:59 AM | 28 (21.7%) | 9 (15.2%) |
| 5:00 AM to 5:29 AM | 11 (8.5%) | 0 (0.0%) |
| 5:30 AM to 5:59 AM | 0 (0.0%) | 0 (0.0%) |
| 6:00 AM to 6:29 AM | 47 (36.4%) | 15 (25.4%) |
| 6:30 AM to 6:59 AM | 0 (0.0%) | 0 (0.0%) |
| 7:00 AM to 7:29 AM | 30 (23.3%) | 0 (0.0%) |
| 7:30 AM to 7:59 AM | 0 (0.0%) | 35 (59.3%) |
| 8:00 AM to 8:29 AM | 0 (0.0%) | 0 (0.0%) |
| 8:30 AM to 8:59 AM | 0 (0.0%) | 0 (0.0%) |
| 9:00 AM to 9:59 AM | 0 (0.0%) | 0 (0.0%) |
| 10:00 AM to 10:59 AM | 0 (0.0%) | 0 (0.0%) |
| 11:00 AM to 11:59 AM | 0 (0.0%) | 0 (0.0%) |
| 12:00 PM to 3:59 PM | 13 (10.1%) | 0 (0.0%) |
| 4:00 PM to 11:59 PM | 0 (0.0%) | 0 (0.0%) |
| Total | 129 (100.0%) | 59 (100.0%) |
Housing Occupancy in Palo Seco
Occupancy by Ownership in Palo Seco
Of the total 324 dwellings in Palo Seco, owner-occupied units account for 148 (45.7%), while renter-occupied units make up 176 (54.3%).
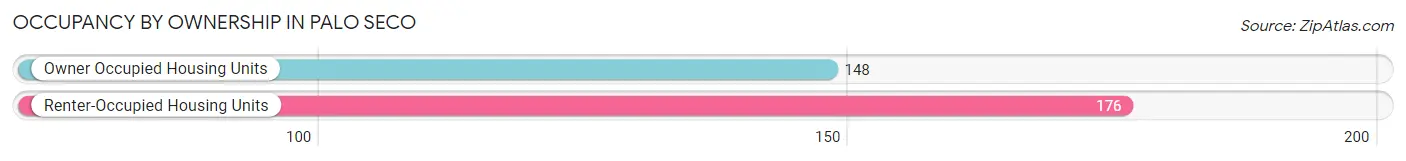
| Occupancy | # Housing Units | % Housing Units |
| Owner Occupied Housing Units | 148 | 45.7% |
| Renter-Occupied Housing Units | 176 | 54.3% |
| Total Occupied Housing Units | 324 | 100.0% |
Occupancy by Household Size in Palo Seco
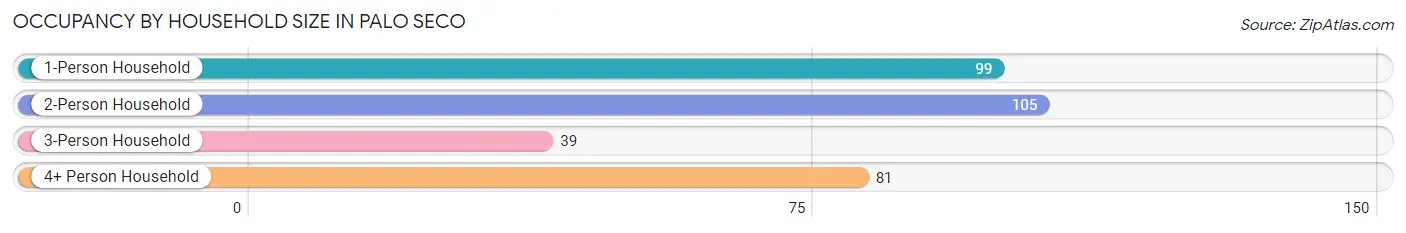
| Household Size | # Housing Units | % Housing Units |
| 1-Person Household | 99 | 30.6% |
| 2-Person Household | 105 | 32.4% |
| 3-Person Household | 39 | 12.0% |
| 4+ Person Household | 81 | 25.0% |
| Total Housing Units | 324 | 100.0% |
Occupancy by Ownership by Household Size in Palo Seco
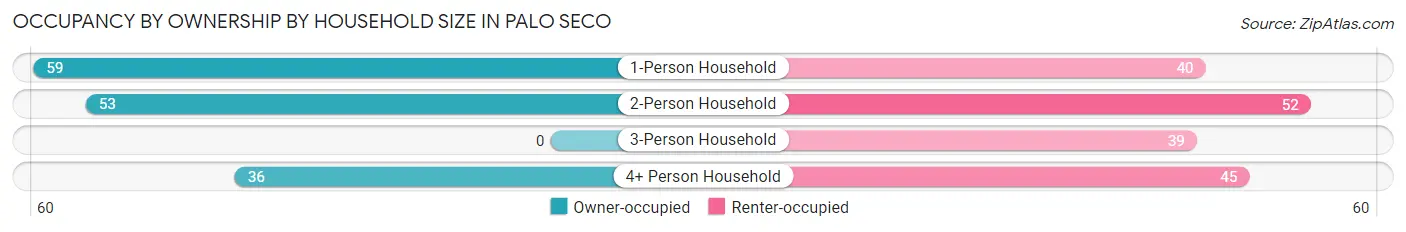
| Household Size | Owner-occupied | Renter-occupied |
| 1-Person Household | 59 (59.6%) | 40 (40.4%) |
| 2-Person Household | 53 (50.5%) | 52 (49.5%) |
| 3-Person Household | 0 (0.0%) | 39 (100.0%) |
| 4+ Person Household | 36 (44.4%) | 45 (55.6%) |
| Total Housing Units | 148 (45.7%) | 176 (54.3%) |
Occupancy by Educational Attainment in Palo Seco
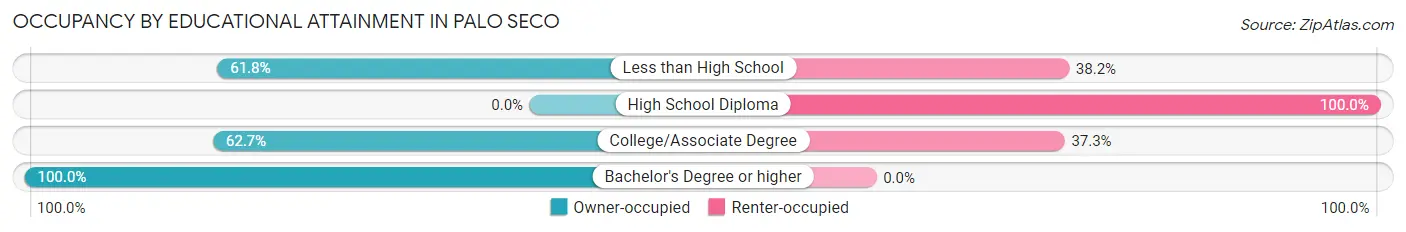
| Household Size | Owner-occupied | Renter-occupied |
| Less than High School | 76 (61.8%) | 47 (38.2%) |
| High School Diploma | 0 (0.0%) | 101 (100.0%) |
| College/Associate Degree | 47 (62.7%) | 28 (37.3%) |
| Bachelor's Degree or higher | 25 (100.0%) | 0 (0.0%) |
Occupancy by Age of Householder in Palo Seco
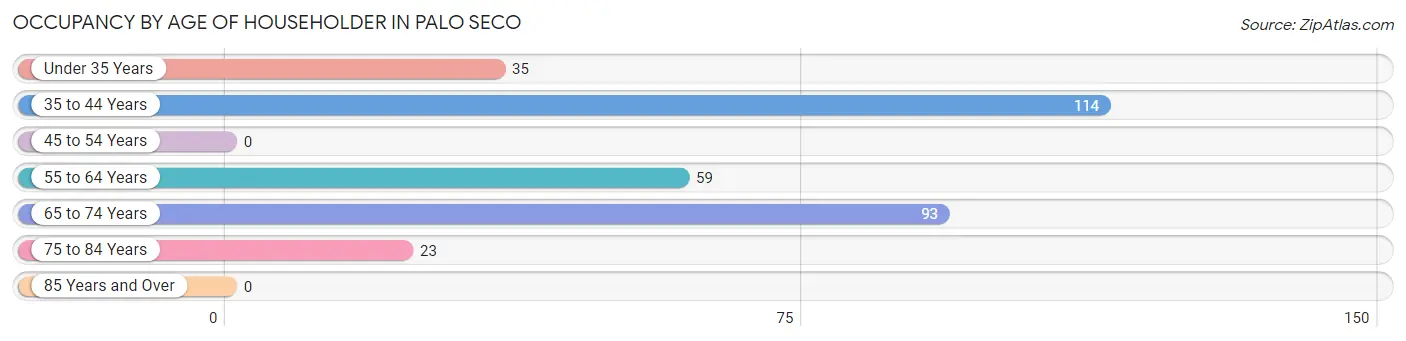
| Age Bracket | # Households | % Households |
| Under 35 Years | 35 | 10.8% |
| 35 to 44 Years | 114 | 35.2% |
| 45 to 54 Years | 0 | 0.0% |
| 55 to 64 Years | 59 | 18.2% |
| 65 to 74 Years | 93 | 28.7% |
| 75 to 84 Years | 23 | 7.1% |
| 85 Years and Over | 0 | 0.0% |
| Total | 324 | 100.0% |
Housing Finances in Palo Seco
Median Income by Occupancy in Palo Seco
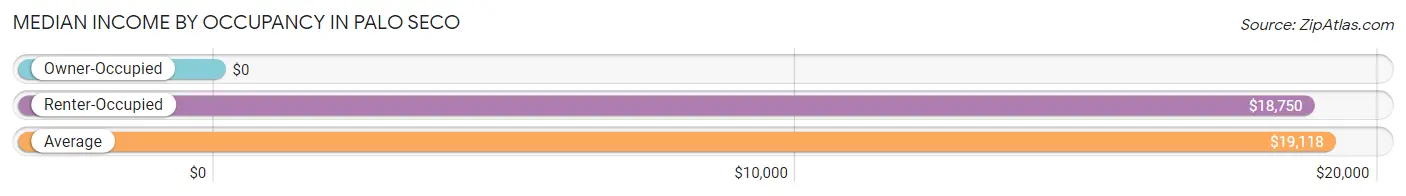
| Occupancy Type | # Households | Median Income |
| Owner-Occupied | 148 (45.7%) | $0 |
| Renter-Occupied | 176 (54.3%) | $18,750 |
| Average | 324 (100.0%) | $19,118 |
Occupancy by Householder Income Bracket in Palo Seco
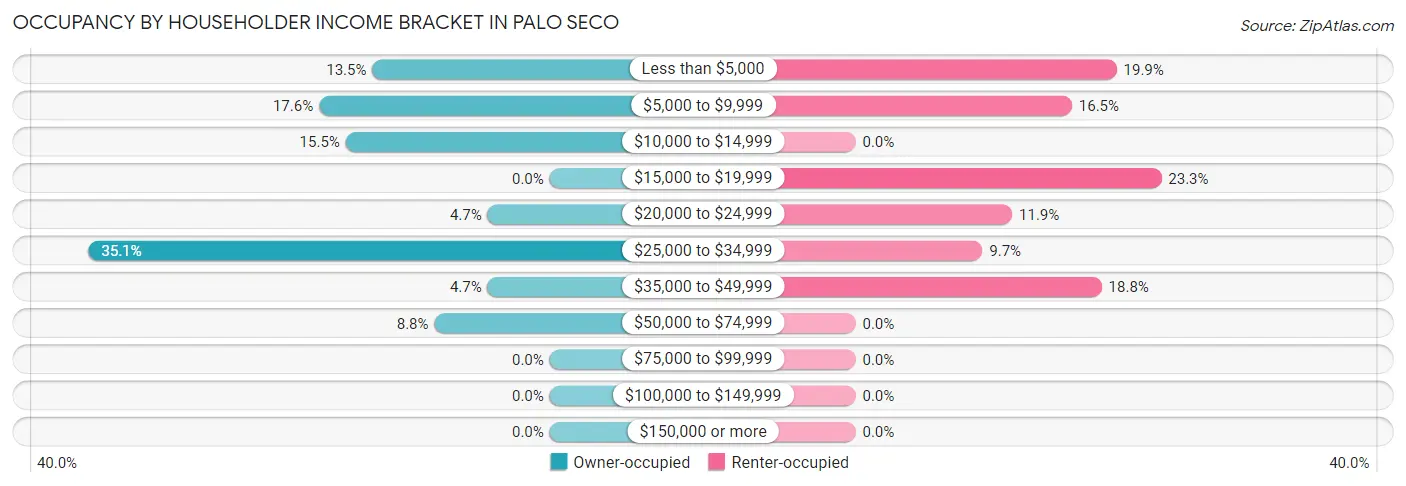
| Income Bracket | Owner-occupied | Renter-occupied |
| Less than $5,000 | 20 (13.5%) | 35 (19.9%) |
| $5,000 to $9,999 | 26 (17.6%) | 29 (16.5%) |
| $10,000 to $14,999 | 23 (15.5%) | 0 (0.0%) |
| $15,000 to $19,999 | 0 (0.0%) | 41 (23.3%) |
| $20,000 to $24,999 | 7 (4.7%) | 21 (11.9%) |
| $25,000 to $34,999 | 52 (35.1%) | 17 (9.7%) |
| $35,000 to $49,999 | 7 (4.7%) | 33 (18.8%) |
| $50,000 to $74,999 | 13 (8.8%) | 0 (0.0%) |
| $75,000 to $99,999 | 0 (0.0%) | 0 (0.0%) |
| $100,000 to $149,999 | 0 (0.0%) | 0 (0.0%) |
| $150,000 or more | 0 (0.0%) | 0 (0.0%) |
| Total | 148 (100.0%) | 176 (100.0%) |
Monthly Housing Cost Tiers in Palo Seco
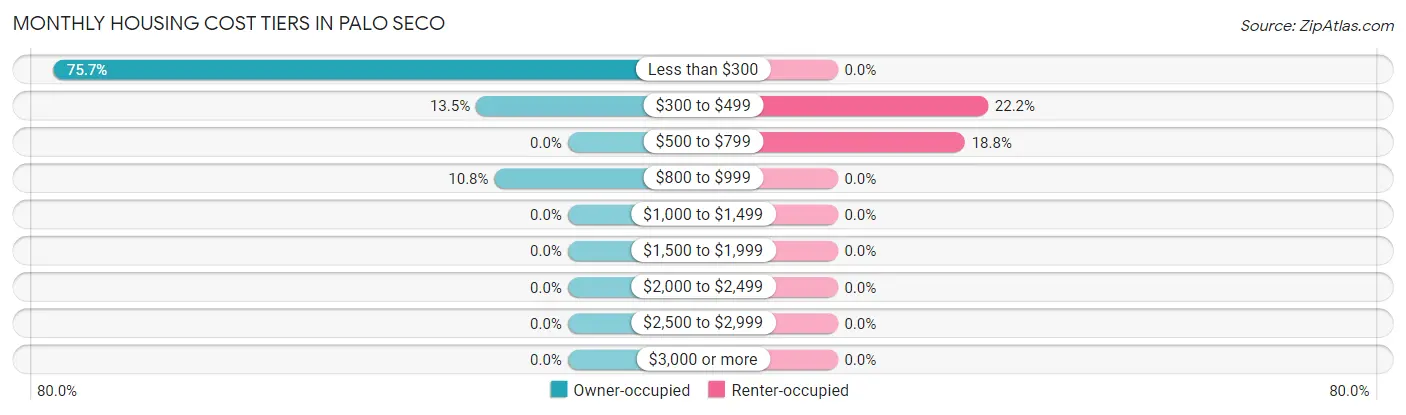
| Monthly Cost | Owner-occupied | Renter-occupied |
| Less than $300 | 112 (75.7%) | 0 (0.0%) |
| $300 to $499 | 20 (13.5%) | 39 (22.2%) |
| $500 to $799 | 0 (0.0%) | 33 (18.8%) |
| $800 to $999 | 16 (10.8%) | 0 (0.0%) |
| $1,000 to $1,499 | 0 (0.0%) | 0 (0.0%) |
| $1,500 to $1,999 | 0 (0.0%) | 0 (0.0%) |
| $2,000 to $2,499 | 0 (0.0%) | 0 (0.0%) |
| $2,500 to $2,999 | 0 (0.0%) | 0 (0.0%) |
| $3,000 or more | 0 (0.0%) | 0 (0.0%) |
| Total | 148 (100.0%) | 176 (100.0%) |
Physical Housing Characteristics in Palo Seco
Housing Structures in Palo Seco
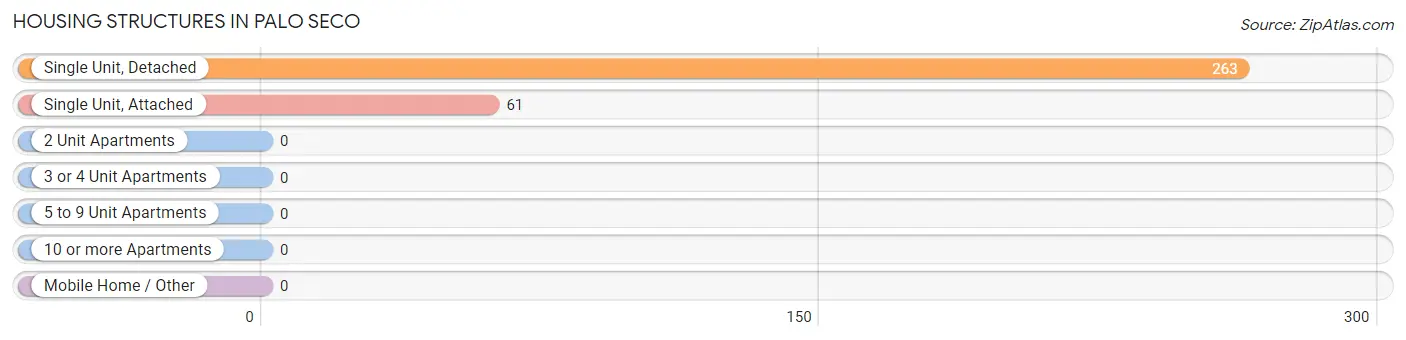
| Structure Type | # Housing Units | % Housing Units |
| Single Unit, Detached | 263 | 81.2% |
| Single Unit, Attached | 61 | 18.8% |
| 2 Unit Apartments | 0 | 0.0% |
| 3 or 4 Unit Apartments | 0 | 0.0% |
| 5 to 9 Unit Apartments | 0 | 0.0% |
| 10 or more Apartments | 0 | 0.0% |
| Mobile Home / Other | 0 | 0.0% |
| Total | 324 | 100.0% |
Housing Structures by Occupancy in Palo Seco
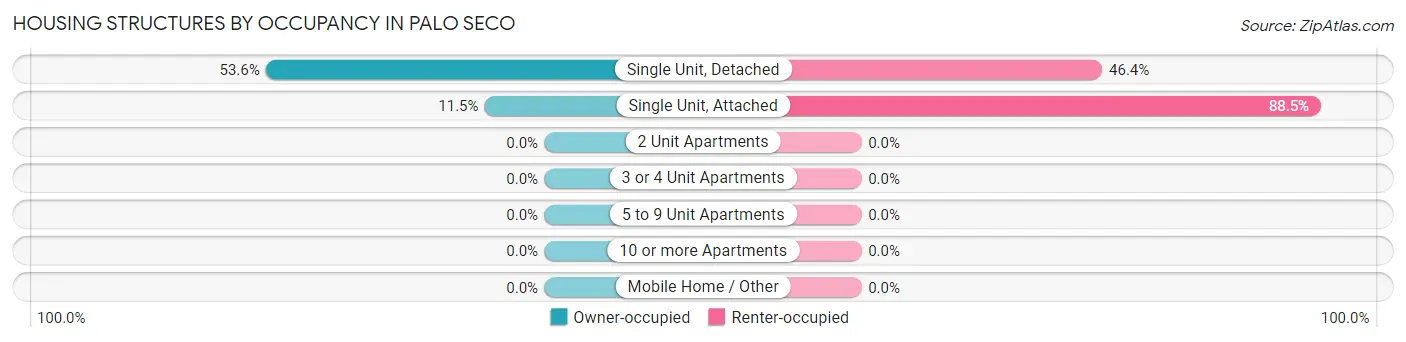
| Structure Type | Owner-occupied | Renter-occupied |
| Single Unit, Detached | 141 (53.6%) | 122 (46.4%) |
| Single Unit, Attached | 7 (11.5%) | 54 (88.5%) |
| 2 Unit Apartments | 0 (0.0%) | 0 (0.0%) |
| 3 or 4 Unit Apartments | 0 (0.0%) | 0 (0.0%) |
| 5 to 9 Unit Apartments | 0 (0.0%) | 0 (0.0%) |
| 10 or more Apartments | 0 (0.0%) | 0 (0.0%) |
| Mobile Home / Other | 0 (0.0%) | 0 (0.0%) |
| Total | 148 (45.7%) | 176 (54.3%) |
Housing Structures by Number of Rooms in Palo Seco
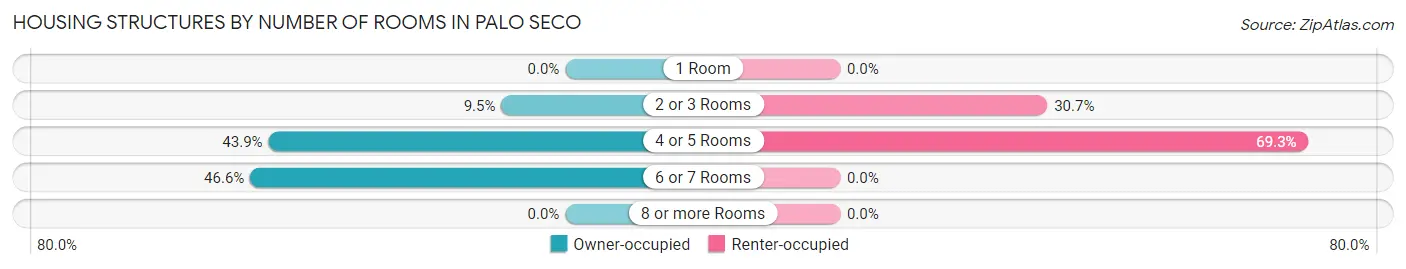
| Number of Rooms | Owner-occupied | Renter-occupied |
| 1 Room | 0 (0.0%) | 0 (0.0%) |
| 2 or 3 Rooms | 14 (9.5%) | 54 (30.7%) |
| 4 or 5 Rooms | 65 (43.9%) | 122 (69.3%) |
| 6 or 7 Rooms | 69 (46.6%) | 0 (0.0%) |
| 8 or more Rooms | 0 (0.0%) | 0 (0.0%) |
| Total | 148 (100.0%) | 176 (100.0%) |
Housing Structure by Heating Type in Palo Seco
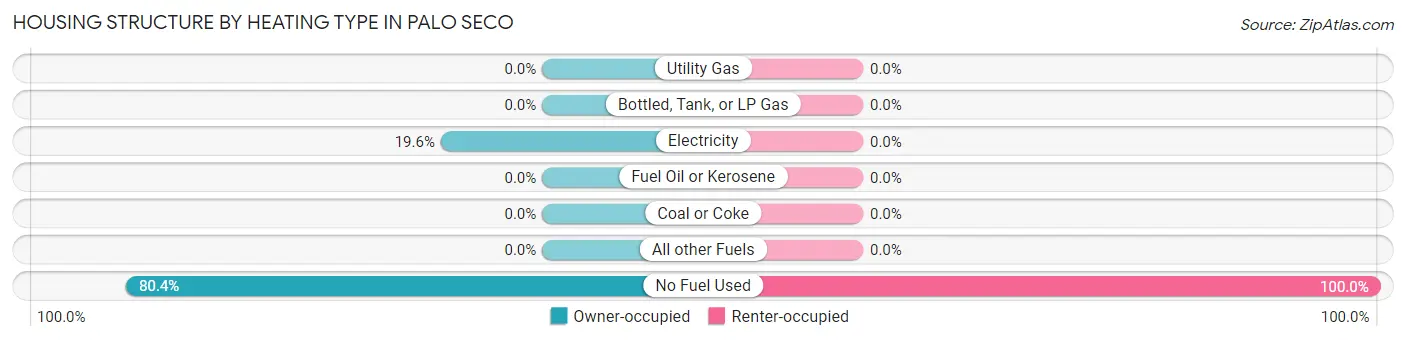
| Heating Type | Owner-occupied | Renter-occupied |
| Utility Gas | 0 (0.0%) | 0 (0.0%) |
| Bottled, Tank, or LP Gas | 0 (0.0%) | 0 (0.0%) |
| Electricity | 29 (19.6%) | 0 (0.0%) |
| Fuel Oil or Kerosene | 0 (0.0%) | 0 (0.0%) |
| Coal or Coke | 0 (0.0%) | 0 (0.0%) |
| All other Fuels | 0 (0.0%) | 0 (0.0%) |
| No Fuel Used | 119 (80.4%) | 176 (100.0%) |
| Total | 148 (100.0%) | 176 (100.0%) |
Household Vehicle Usage in Palo Seco
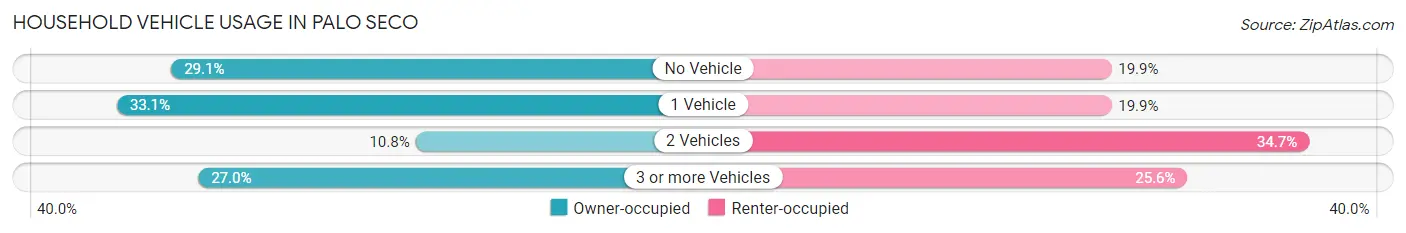
| Vehicles per Household | Owner-occupied | Renter-occupied |
| No Vehicle | 43 (29.0%) | 35 (19.9%) |
| 1 Vehicle | 49 (33.1%) | 35 (19.9%) |
| 2 Vehicles | 16 (10.8%) | 61 (34.7%) |
| 3 or more Vehicles | 40 (27.0%) | 45 (25.6%) |
| Total | 148 (100.0%) | 176 (100.0%) |
Real Estate & Mortgages in Palo Seco
Real Estate and Mortgage Overview in Palo Seco
| Characteristic | Without Mortgage | With Mortgage |
| Housing Units | 119 | 29 |
| Median Property Value | $91,800 | $0 |
| Median Household Income | - | - |
| Monthly Housing Costs | $121 | $0 |
| Real Estate Taxes | - | - |
Property Value by Mortgage Status in Palo Seco
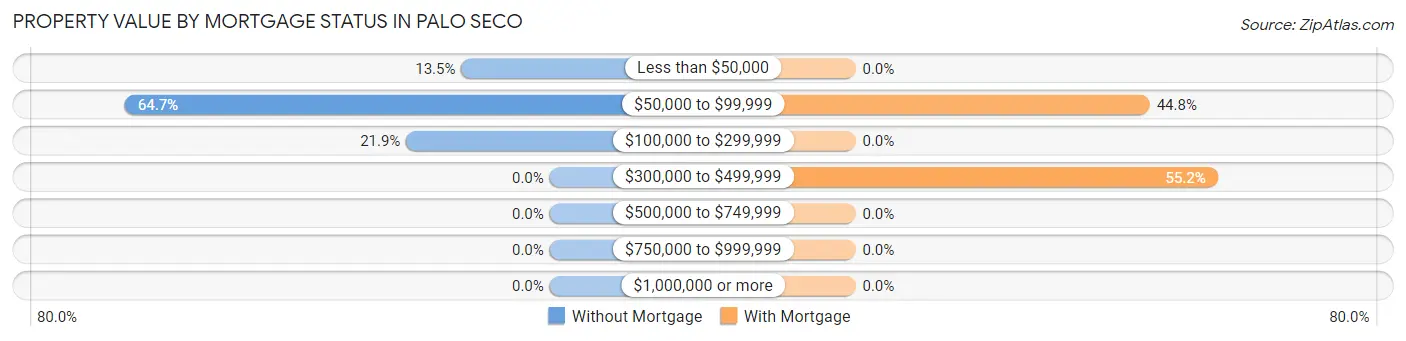
| Property Value | Without Mortgage | With Mortgage |
| Less than $50,000 | 16 (13.5%) | 0 (0.0%) |
| $50,000 to $99,999 | 77 (64.7%) | 13 (44.8%) |
| $100,000 to $299,999 | 26 (21.8%) | 0 (0.0%) |
| $300,000 to $499,999 | 0 (0.0%) | 16 (55.2%) |
| $500,000 to $749,999 | 0 (0.0%) | 0 (0.0%) |
| $750,000 to $999,999 | 0 (0.0%) | 0 (0.0%) |
| $1,000,000 or more | 0 (0.0%) | 0 (0.0%) |
| Total | 119 (100.0%) | 29 (100.0%) |
Household Income by Mortgage Status in Palo Seco
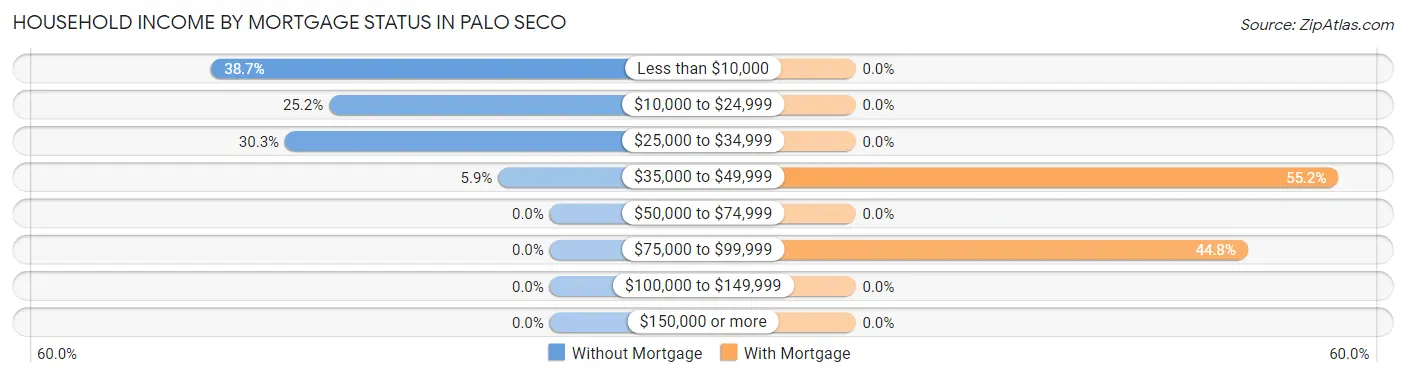
| Household Income | Without Mortgage | With Mortgage |
| Less than $10,000 | 46 (38.7%) | 0 (0.0%) |
| $10,000 to $24,999 | 30 (25.2%) | 0 (0.0%) |
| $25,000 to $34,999 | 36 (30.2%) | 0 (0.0%) |
| $35,000 to $49,999 | 7 (5.9%) | 16 (55.2%) |
| $50,000 to $74,999 | 0 (0.0%) | 0 (0.0%) |
| $75,000 to $99,999 | 0 (0.0%) | 13 (44.8%) |
| $100,000 to $149,999 | 0 (0.0%) | 0 (0.0%) |
| $150,000 or more | 0 (0.0%) | 0 (0.0%) |
| Total | 119 (100.0%) | 29 (100.0%) |
Property Value to Household Income Ratio in Palo Seco
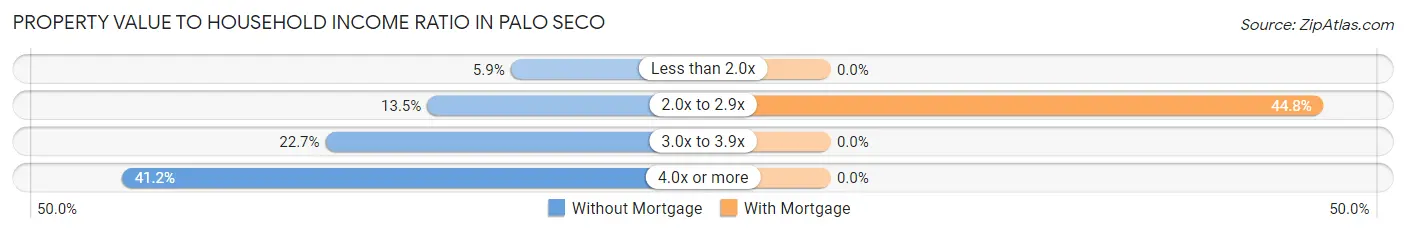
| Value-to-Income Ratio | Without Mortgage | With Mortgage |
| Less than 2.0x | 7 (5.9%) | 0 (0.0%) |
| 2.0x to 2.9x | 16 (13.5%) | 13 (44.8%) |
| 3.0x to 3.9x | 27 (22.7%) | 0 (0.0%) |
| 4.0x or more | 49 (41.2%) | 0 (0.0%) |
| Total | 119 (100.0%) | 29 (100.0%) |
Real Estate Taxes by Mortgage Status in Palo Seco
| Property Taxes | Without Mortgage | With Mortgage |
| Less than $800 | 0 (0.0%) | 0 (0.0%) |
| $800 to $1,499 | 0 (0.0%) | 0 (0.0%) |
| $800 to $1,499 | 0 (0.0%) | 0 (0.0%) |
| Total | 119 (100.0%) | 29 (100.0%) |
Health & Disability in Palo Seco
Health Insurance Coverage by Age in Palo Seco
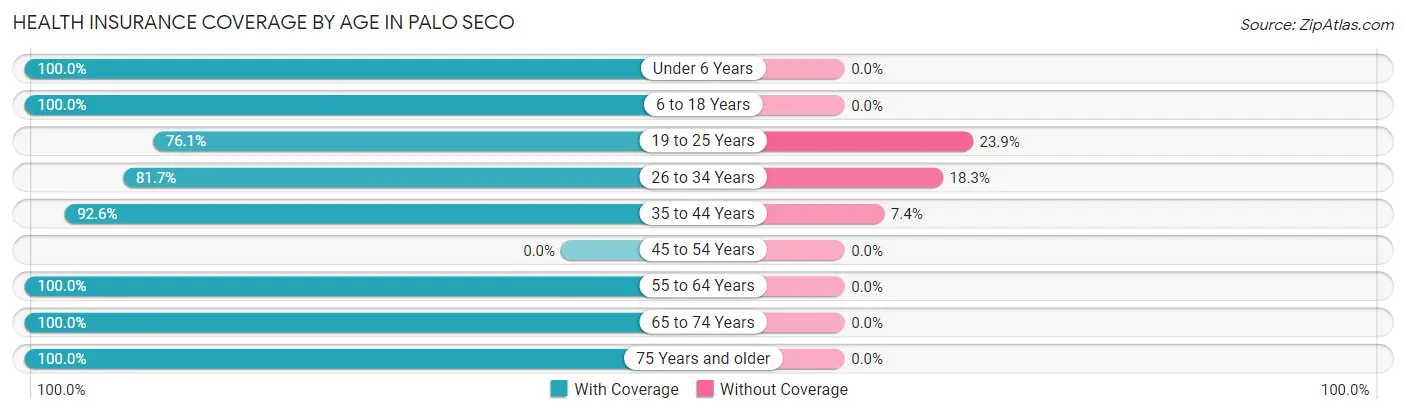
| Age Bracket | With Coverage | Without Coverage |
| Under 6 Years | 95 (100.0%) | 0 (0.0%) |
| 6 to 18 Years | 96 (100.0%) | 0 (0.0%) |
| 19 to 25 Years | 35 (76.1%) | 11 (23.9%) |
| 26 to 34 Years | 138 (81.7%) | 31 (18.3%) |
| 35 to 44 Years | 163 (92.6%) | 13 (7.4%) |
| 45 to 54 Years | 0 (0.0%) | 0 (0.0%) |
| 55 to 64 Years | 97 (100.0%) | 0 (0.0%) |
| 65 to 74 Years | 93 (100.0%) | 0 (0.0%) |
| 75 Years and older | 23 (100.0%) | 0 (0.0%) |
| Total | 740 (93.1%) | 55 (6.9%) |
Health Insurance Coverage by Citizenship Status in Palo Seco
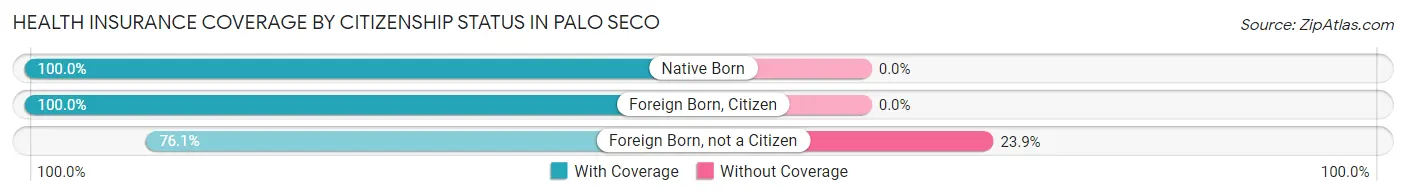
| Citizenship Status | With Coverage | Without Coverage |
| Native Born | 95 (100.0%) | 0 (0.0%) |
| Foreign Born, Citizen | 96 (100.0%) | 0 (0.0%) |
| Foreign Born, not a Citizen | 35 (76.1%) | 11 (23.9%) |
Health Insurance Coverage by Household Income in Palo Seco
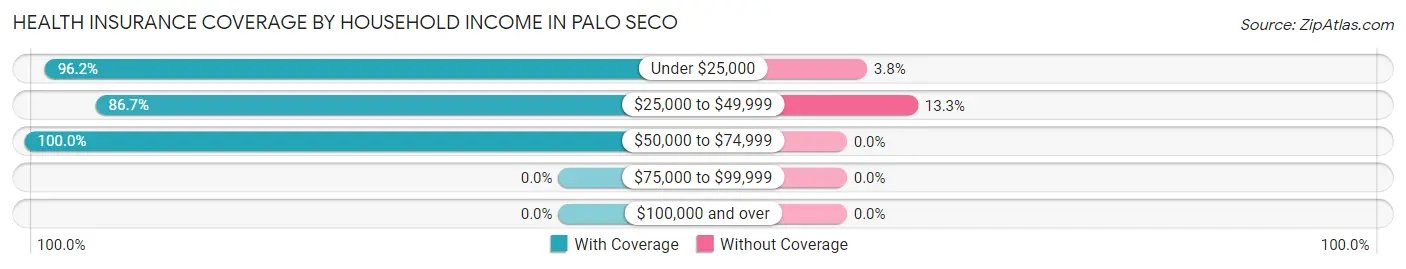
| Household Income | With Coverage | Without Coverage |
| Under $25,000 | 460 (96.2%) | 18 (3.8%) |
| $25,000 to $49,999 | 241 (86.7%) | 37 (13.3%) |
| $50,000 to $74,999 | 39 (100.0%) | 0 (0.0%) |
| $75,000 to $99,999 | 0 (0.0%) | 0 (0.0%) |
| $100,000 and over | 0 (0.0%) | 0 (0.0%) |
Public vs Private Health Insurance Coverage by Age in Palo Seco
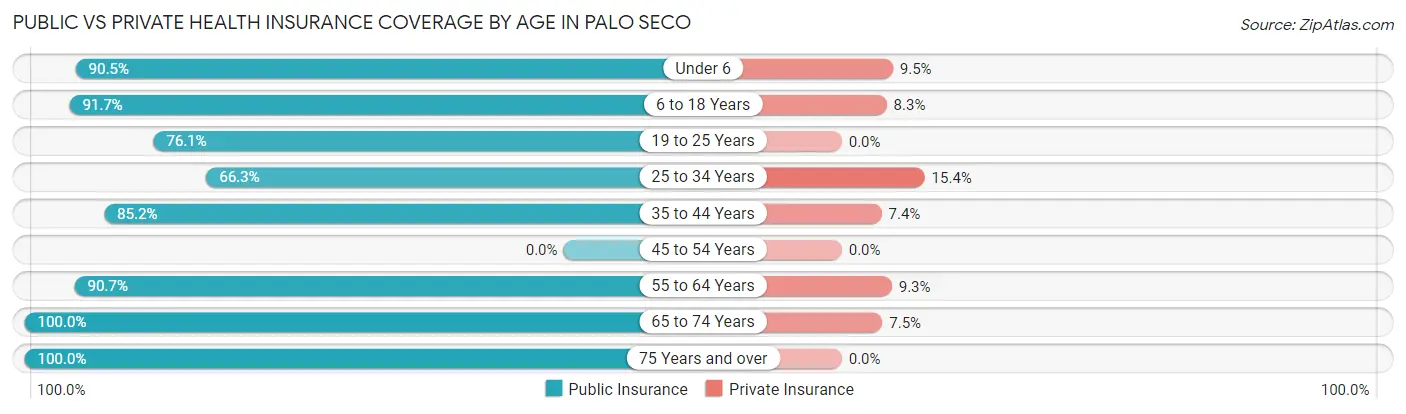
| Age Bracket | Public Insurance | Private Insurance |
| Under 6 | 86 (90.5%) | 9 (9.5%) |
| 6 to 18 Years | 88 (91.7%) | 8 (8.3%) |
| 19 to 25 Years | 35 (76.1%) | 0 (0.0%) |
| 25 to 34 Years | 112 (66.3%) | 26 (15.4%) |
| 35 to 44 Years | 150 (85.2%) | 13 (7.4%) |
| 45 to 54 Years | 0 (0.0%) | 0 (0.0%) |
| 55 to 64 Years | 88 (90.7%) | 9 (9.3%) |
| 65 to 74 Years | 93 (100.0%) | 7 (7.5%) |
| 75 Years and over | 23 (100.0%) | 0 (0.0%) |
| Total | 675 (84.9%) | 72 (9.1%) |
Disability Status by Sex by Age in Palo Seco
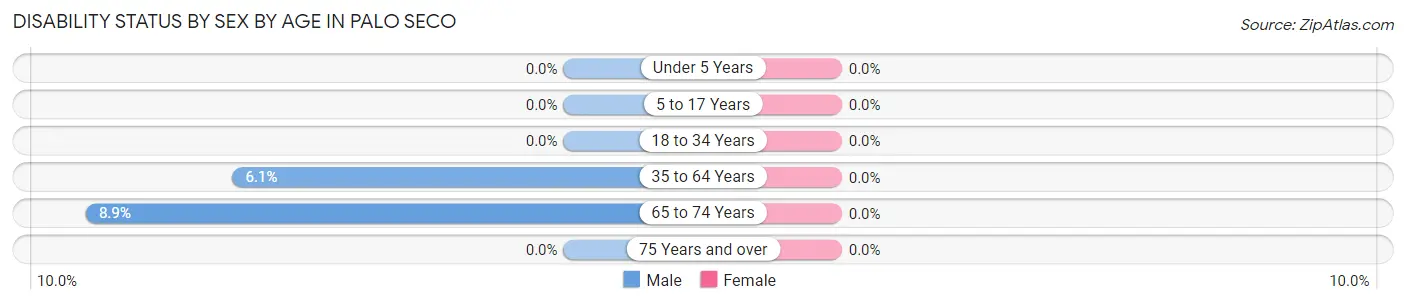
| Age Bracket | Male | Female |
| Under 5 Years | 0 (0.0%) | 0 (0.0%) |
| 5 to 17 Years | 0 (0.0%) | 0 (0.0%) |
| 18 to 34 Years | 0 (0.0%) | 0 (0.0%) |
| 35 to 64 Years | 7 (6.1%) | 0 (0.0%) |
| 65 to 74 Years | 7 (8.9%) | 0 (0.0%) |
| 75 Years and over | 0 (0.0%) | 0 (0.0%) |
Disability Class by Sex by Age in Palo Seco
Disability Class: Hearing Difficulty
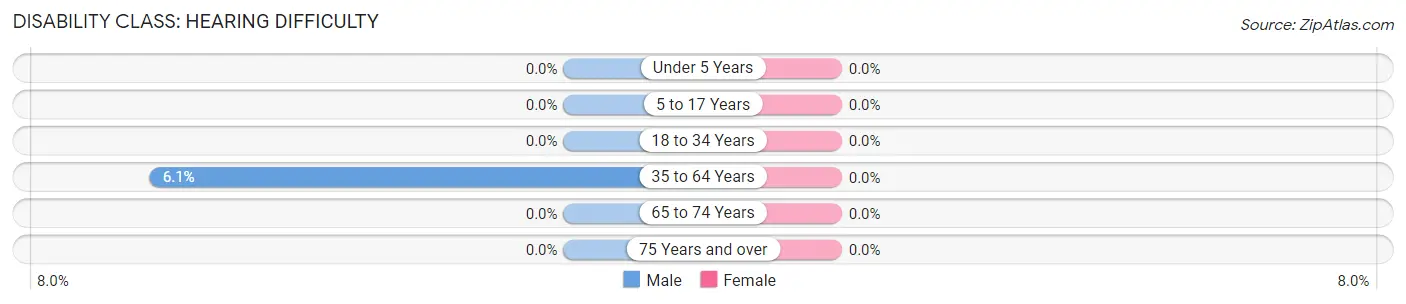
| Age Bracket | Male | Female |
| Under 5 Years | 0 (0.0%) | 0 (0.0%) |
| 5 to 17 Years | 0 (0.0%) | 0 (0.0%) |
| 18 to 34 Years | 0 (0.0%) | 0 (0.0%) |
| 35 to 64 Years | 7 (6.1%) | 0 (0.0%) |
| 65 to 74 Years | 0 (0.0%) | 0 (0.0%) |
| 75 Years and over | 0 (0.0%) | 0 (0.0%) |
Disability Class: Vision Difficulty
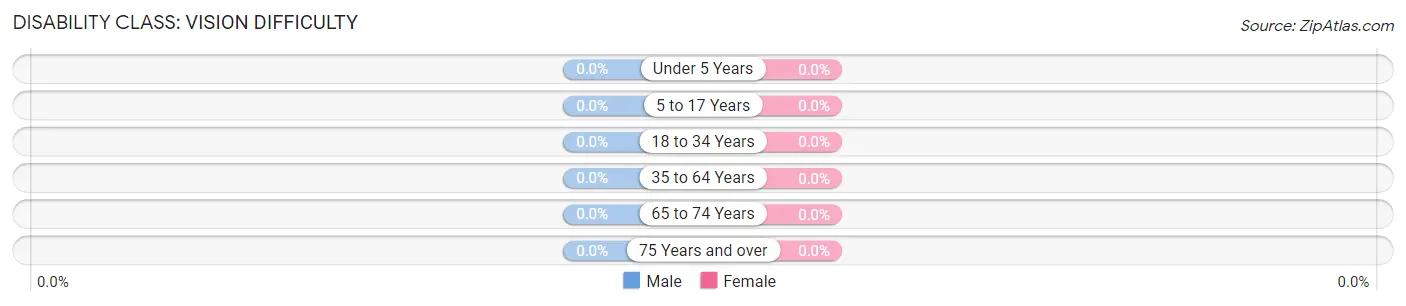
| Age Bracket | Male | Female |
| Under 5 Years | 0 (0.0%) | 0 (0.0%) |
| 5 to 17 Years | 0 (0.0%) | 0 (0.0%) |
| 18 to 34 Years | 0 (0.0%) | 0 (0.0%) |
| 35 to 64 Years | 0 (0.0%) | 0 (0.0%) |
| 65 to 74 Years | 0 (0.0%) | 0 (0.0%) |
| 75 Years and over | 0 (0.0%) | 0 (0.0%) |
Disability Class: Cognitive Difficulty
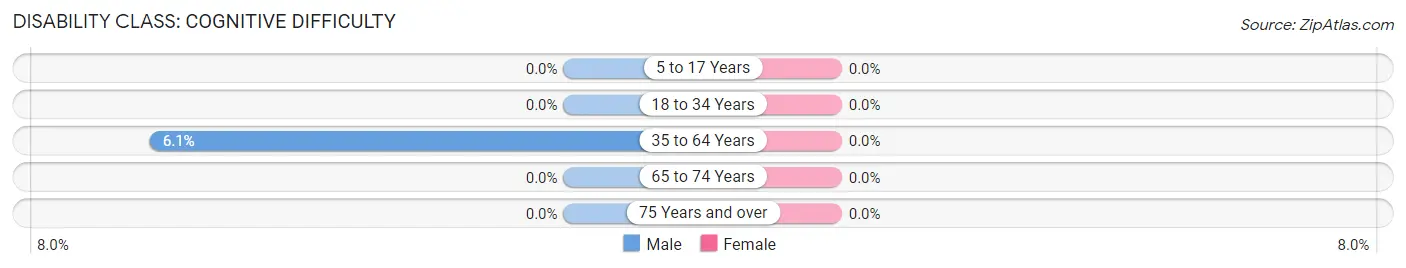
| Age Bracket | Male | Female |
| 5 to 17 Years | 0 (0.0%) | 0 (0.0%) |
| 18 to 34 Years | 0 (0.0%) | 0 (0.0%) |
| 35 to 64 Years | 7 (6.1%) | 0 (0.0%) |
| 65 to 74 Years | 0 (0.0%) | 0 (0.0%) |
| 75 Years and over | 0 (0.0%) | 0 (0.0%) |
Disability Class: Ambulatory Difficulty
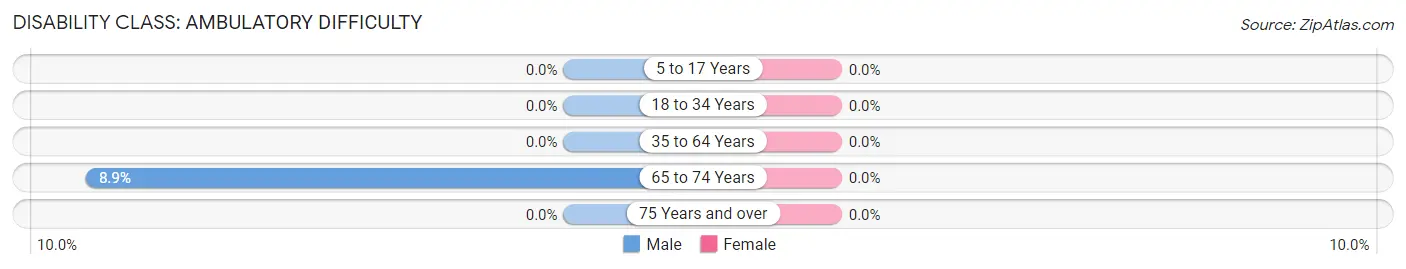
| Age Bracket | Male | Female |
| 5 to 17 Years | 0 (0.0%) | 0 (0.0%) |
| 18 to 34 Years | 0 (0.0%) | 0 (0.0%) |
| 35 to 64 Years | 0 (0.0%) | 0 (0.0%) |
| 65 to 74 Years | 7 (8.9%) | 0 (0.0%) |
| 75 Years and over | 0 (0.0%) | 0 (0.0%) |
Disability Class: Self-Care Difficulty
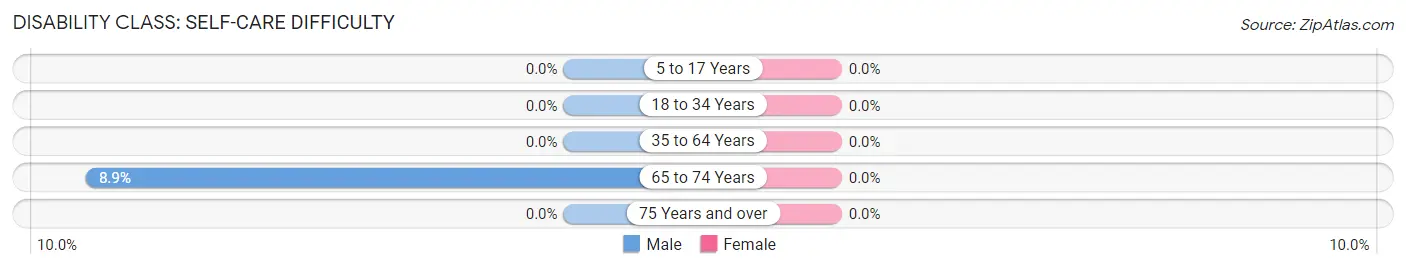
| Age Bracket | Male | Female |
| 5 to 17 Years | 0 (0.0%) | 0 (0.0%) |
| 18 to 34 Years | 0 (0.0%) | 0 (0.0%) |
| 35 to 64 Years | 0 (0.0%) | 0 (0.0%) |
| 65 to 74 Years | 7 (8.9%) | 0 (0.0%) |
| 75 Years and over | 0 (0.0%) | 0 (0.0%) |
Technology Access in Palo Seco
Computing Device Access in Palo Seco
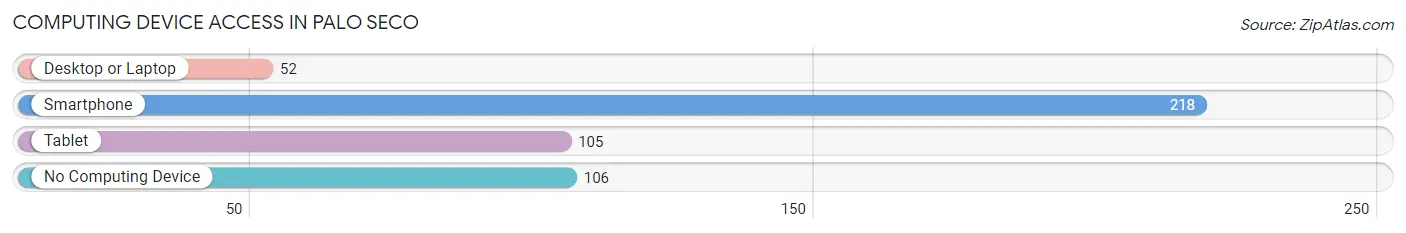
| Device Type | # Households | % Households |
| Desktop or Laptop | 52 | 16.1% |
| Smartphone | 218 | 67.3% |
| Tablet | 105 | 32.4% |
| No Computing Device | 106 | 32.7% |
| Total | 324 | 100.0% |
Internet Access in Palo Seco
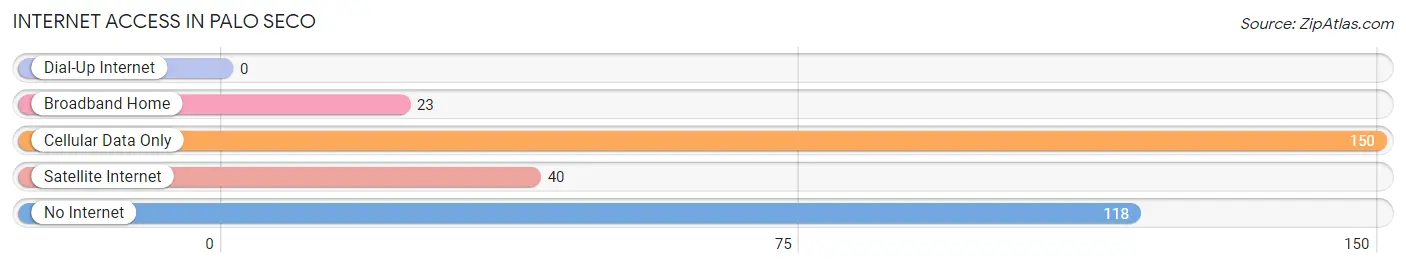
| Internet Type | # Households | % Households |
| Dial-Up Internet | 0 | 0.0% |
| Broadband Home | 23 | 7.1% |
| Cellular Data Only | 150 | 46.3% |
| Satellite Internet | 40 | 12.3% |
| No Internet | 118 | 36.4% |
| Total | 324 | 100.0% |
Palo Seco Summary
Palo Seco is a small municipality located in the southern region of Puerto Rico. It is part of the San Germán-Cabo Rojo Metropolitan Statistical Area and is situated in the municipality of San Germán. The municipality has a population of approximately 4,000 people and covers an area of 4.3 square miles.
History
Palo Seco was founded in 1845 by Don Francisco de la Cruz. The name of the town is derived from the Spanish phrase “palo seco” which means “dry stick”. The town was originally a small farming community and was known for its production of sugar cane, coffee, and tobacco.
In the late 19th century, the town experienced a period of economic growth due to the construction of a railroad line that connected the town to the rest of Puerto Rico. This allowed for the transportation of goods and services to and from the town.
In the early 20th century, the town experienced a period of decline due to the Great Depression. This caused many of the town’s residents to leave in search of better economic opportunities elsewhere.
Geography
Palo Seco is located in the southern region of Puerto Rico. It is situated in the municipality of San Germán and is part of the San Germán-Cabo Rojo Metropolitan Statistical Area. The municipality covers an area of 4.3 square miles and is bordered by the municipalities of San Germán, Lajas, and Cabo Rojo.
The terrain of Palo Seco is mostly flat with some rolling hills. The town is located near the Caribbean Sea and is home to several beaches, including Playa de Palo Seco and Playa de la Piedra.
Economy
The economy of Palo Seco is largely based on agriculture. The town is known for its production of sugar cane, coffee, and tobacco. In addition, the town is home to several small businesses, including restaurants, shops, and hotels.
The town also receives some income from tourism. The town is home to several beaches, including Playa de Palo Seco and Playa de la Piedra, which attract visitors from all over Puerto Rico and the Caribbean.
Demographics
As of the 2010 census, the population of Palo Seco was 4,000. The population is mostly of Puerto Rican descent, with a small percentage of African and European descent. The town has a median age of 33.5 years and a median household income of $17,000.
The town is predominantly Roman Catholic, with a small percentage of other religious affiliations. The town is served by several schools, including the Escuela Superior de Palo Seco and the Escuela Primaria de Palo Seco.
Conclusion
Palo Seco is a small municipality located in the southern region of Puerto Rico. It is part of the San Germán-Cabo Rojo Metropolitan Statistical Area and is situated in the municipality of San Germán. The town was founded in 1845 and has a population of approximately 4,000 people. The economy of the town is largely based on agriculture, with some income coming from tourism. The population is mostly of Puerto Rican descent, with a small percentage of African and European descent. The town is predominantly Roman Catholic, with a small percentage of other religious affiliations.
Common Questions
What is Per Capita Income in Palo Seco?
Per Capita income in Palo Seco is $8,735.
What is the Median Family Income in Palo Seco?
Median Family Income in Palo Seco is $18,529.
What is the Median Household income in Palo Seco?
Median Household Income in Palo Seco is $19,118.
What is Income or Wage Gap in Palo Seco?
Income or Wage Gap in Palo Seco is 11.5%.
Women in Palo Seco earn 88.5 cents for every dollar earned by a man.
What is Inequality or Gini Index in Palo Seco?
Inequality or Gini Index in Palo Seco is 0.39.
What is the Total Population of Palo Seco?
Total Population of Palo Seco is 795.
What is the Total Male Population of Palo Seco?
Total Male Population of Palo Seco is 420.
What is the Total Female Population of Palo Seco?
Total Female Population of Palo Seco is 375.
What is the Ratio of Males per 100 Females in Palo Seco?
There are 112.00 Males per 100 Females in Palo Seco.
What is the Ratio of Females per 100 Males in Palo Seco?
There are 89.29 Females per 100 Males in Palo Seco.
What is the Median Population Age in Palo Seco?
Median Population Age in Palo Seco is 34.5 Years.
What is the Average Family Size in Palo Seco
Average Family Size in Palo Seco is 3.1 People.
What is the Average Household Size in Palo Seco
Average Household Size in Palo Seco is 2.5 People.
How Large is the Labor Force in Palo Seco?
There are 315 People in the Labor Forcein in Palo Seco.
What is the Percentage of People in the Labor Force in Palo Seco?
52.2% of People are in the Labor Force in Palo Seco.
What is the Unemployment Rate in Palo Seco?
Unemployment Rate in Palo Seco is 22.9%.