Las Ollas, PR Map & Demographics
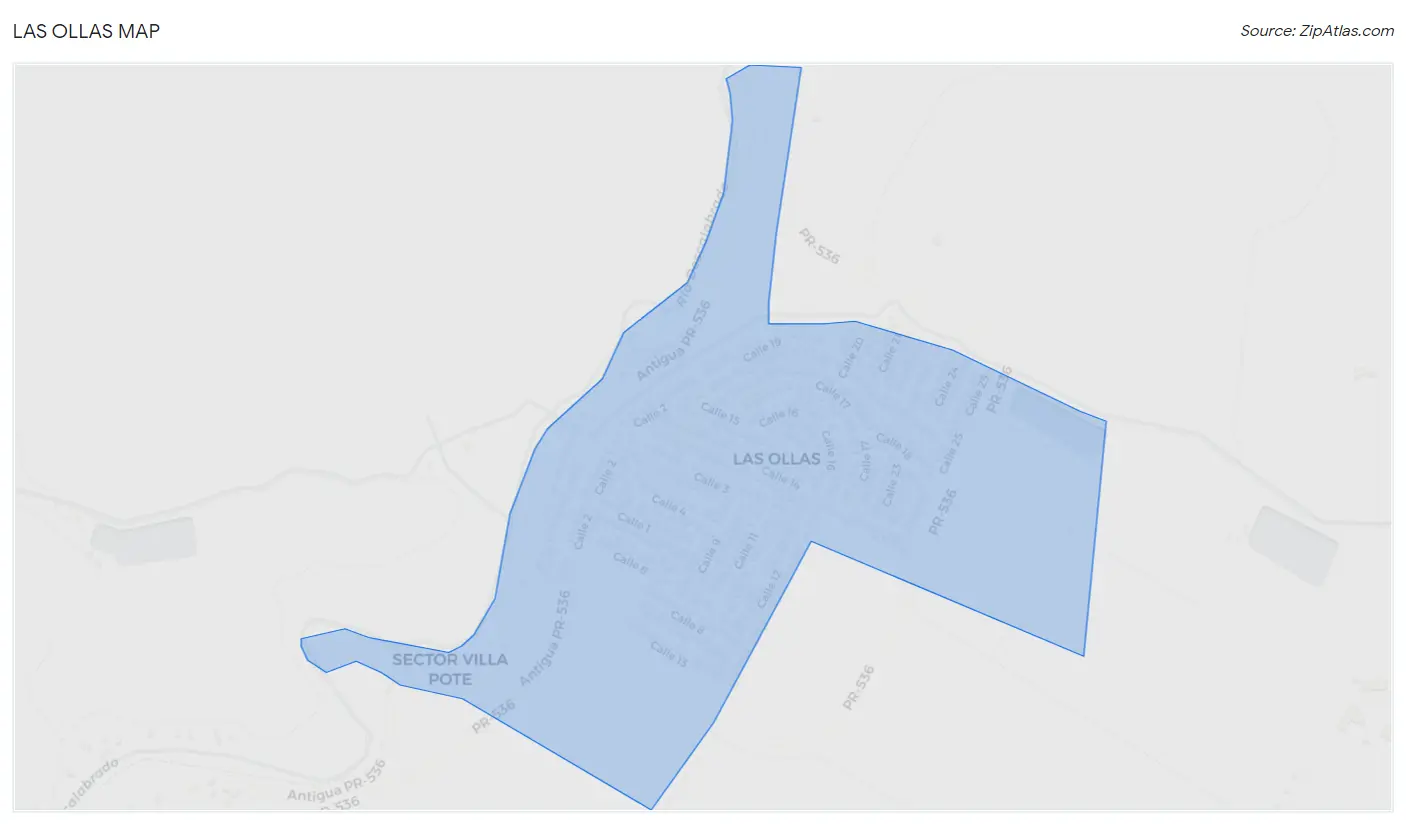
Las Ollas Map
Las Ollas Overview
$10,855
PER CAPITA INCOME
$20,128
AVG FAMILY INCOME
$14,831
AVG HOUSEHOLD INCOME
0.41
INEQUALITY / GINI INDEX
984
TOTAL POPULATION
548
MALE POPULATION
436
FEMALE POPULATION
125.69
MALES / 100 FEMALES
79.56
FEMALES / 100 MALES
48.3
MEDIAN AGE
2.9
AVG FAMILY SIZE
2.4
AVG HOUSEHOLD SIZE
379
LABOR FORCE [ PEOPLE ]
41.4%
PERCENT IN LABOR FORCE
17.2%
UNEMPLOYMENT RATE
Income in Las Ollas
Income Overview in Las Ollas
Per Capita Income in Las Ollas is $10,855, while median incomes of families and households are $20,128 and $14,831 respectively.
| Characteristic | Number | Measure |
| Per Capita Income | 984 | $10,855 |
| Median Family Income | 302 | $20,128 |
| Mean Family Income | 302 | $25,912 |
| Median Household Income | 409 | $14,831 |
| Mean Household Income | 409 | $21,589 |
| Income Deficit | 302 | $0 |
| Wage / Income Gap (%) | 984 | 0.00% |
| Wage / Income Gap ($) | 984 | 100.00¢ per $1 |
| Gini / Inequality Index | 984 | 0.41 |
Earnings by Sex in Las Ollas
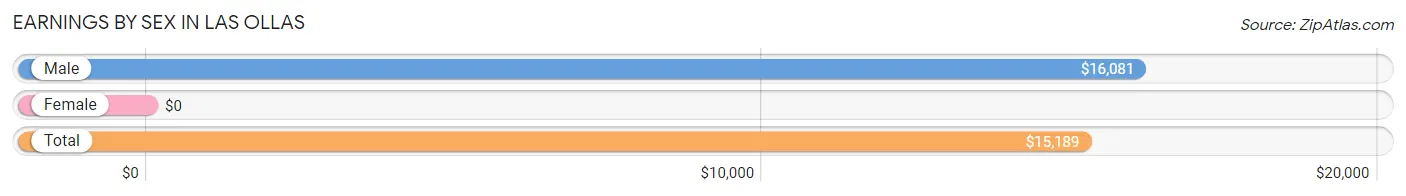
| Sex | Number | Average Earnings |
| Male | 167 (44.5%) | $16,081 |
| Female | 208 (55.5%) | $0 |
| Total | 375 (100.0%) | $15,189 |
Earnings by Sex by Income Bracket in Las Ollas
The most common earnings brackets in Las Ollas are $15,000 to $17,499 for men (59 | 35.3%) and $2,500 to $4,999 for women (44 | 21.1%).
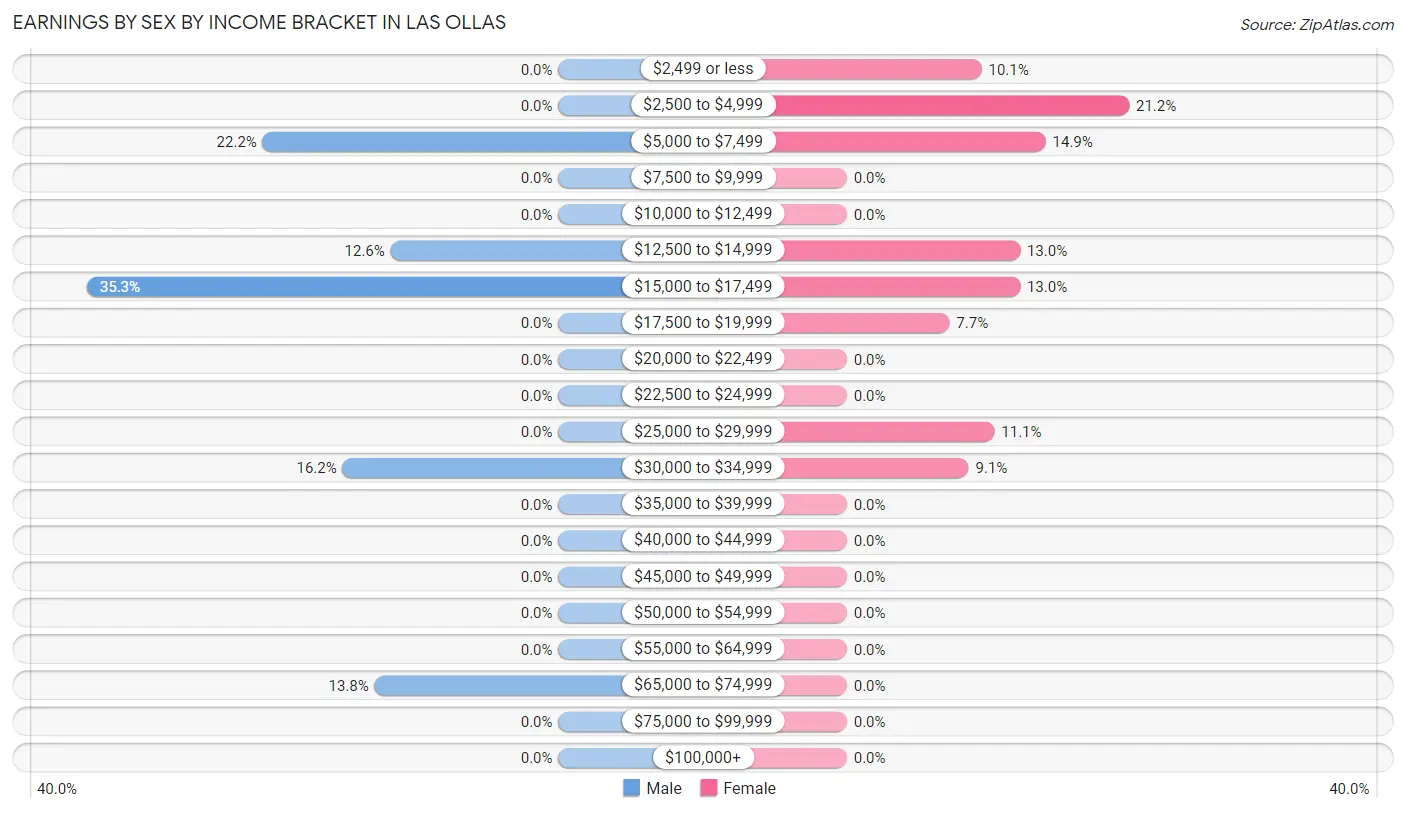
| Income | Male | Female |
| $2,499 or less | 0 (0.0%) | 21 (10.1%) |
| $2,500 to $4,999 | 0 (0.0%) | 44 (21.1%) |
| $5,000 to $7,499 | 37 (22.2%) | 31 (14.9%) |
| $7,500 to $9,999 | 0 (0.0%) | 0 (0.0%) |
| $10,000 to $12,499 | 0 (0.0%) | 0 (0.0%) |
| $12,500 to $14,999 | 21 (12.6%) | 27 (13.0%) |
| $15,000 to $17,499 | 59 (35.3%) | 27 (13.0%) |
| $17,500 to $19,999 | 0 (0.0%) | 16 (7.7%) |
| $20,000 to $22,499 | 0 (0.0%) | 0 (0.0%) |
| $22,500 to $24,999 | 0 (0.0%) | 0 (0.0%) |
| $25,000 to $29,999 | 0 (0.0%) | 23 (11.1%) |
| $30,000 to $34,999 | 27 (16.2%) | 19 (9.1%) |
| $35,000 to $39,999 | 0 (0.0%) | 0 (0.0%) |
| $40,000 to $44,999 | 0 (0.0%) | 0 (0.0%) |
| $45,000 to $49,999 | 0 (0.0%) | 0 (0.0%) |
| $50,000 to $54,999 | 0 (0.0%) | 0 (0.0%) |
| $55,000 to $64,999 | 0 (0.0%) | 0 (0.0%) |
| $65,000 to $74,999 | 23 (13.8%) | 0 (0.0%) |
| $75,000 to $99,999 | 0 (0.0%) | 0 (0.0%) |
| $100,000+ | 0 (0.0%) | 0 (0.0%) |
| Total | 167 (100.0%) | 208 (100.0%) |
Earnings by Sex by Educational Attainment in Las Ollas
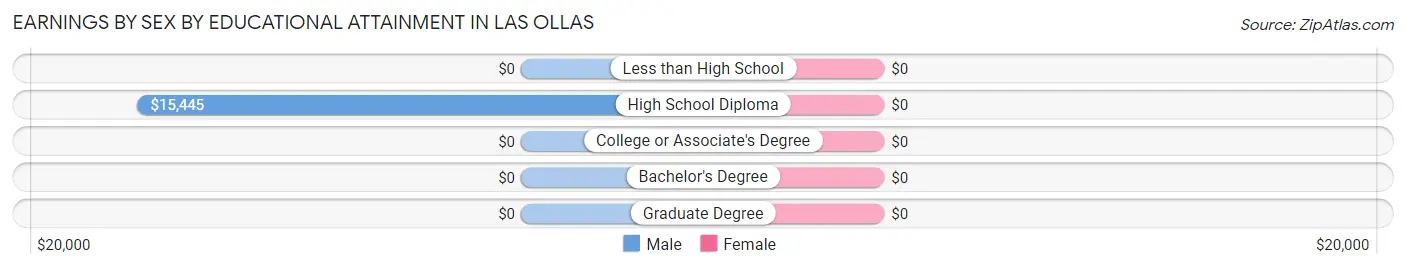
| Educational Attainment | Male Income | Female Income |
| Less than High School | - | - |
| High School Diploma | $15,445 | $0 |
| College or Associate's Degree | - | - |
| Bachelor's Degree | - | - |
| Graduate Degree | - | - |
| Total | $16,504 | $0 |
Family Income in Las Ollas
Family Income Brackets in Las Ollas
According to the Las Ollas family income data, there are 84 families falling into the $15,000 to $24,999 income range, which is the most common income bracket and makes up 27.8% of all families.
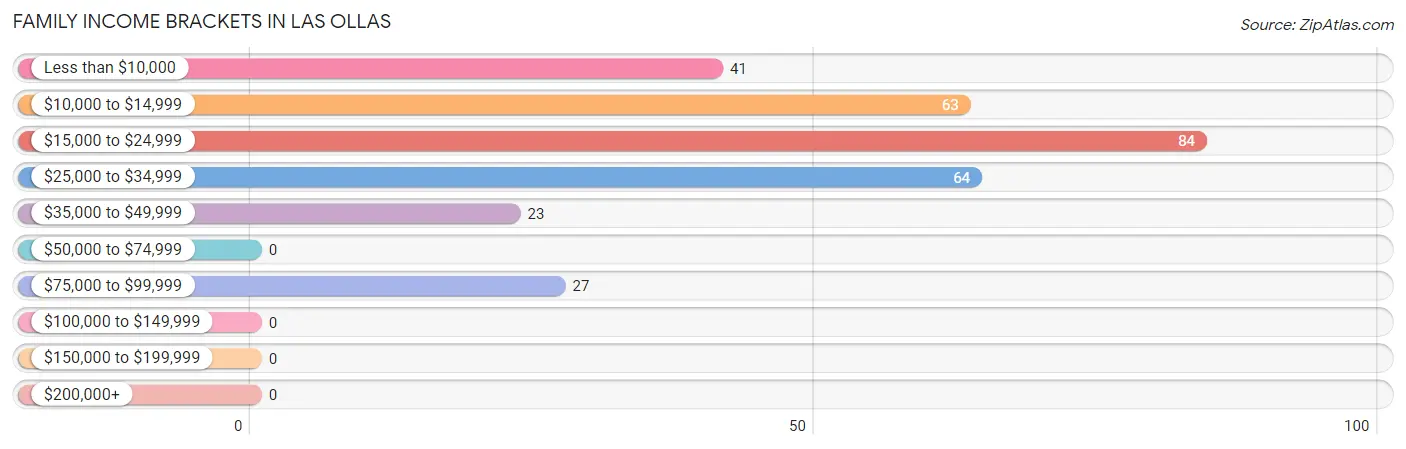
| Income Bracket | # Families | % Families |
| Less than $10,000 | 41 | 13.6% |
| $10,000 to $14,999 | 63 | 20.9% |
| $15,000 to $24,999 | 84 | 27.8% |
| $25,000 to $34,999 | 64 | 21.2% |
| $35,000 to $49,999 | 23 | 7.6% |
| $50,000 to $74,999 | 0 | 0.0% |
| $75,000 to $99,999 | 27 | 8.9% |
| $100,000 to $149,999 | 0 | 0.0% |
| $150,000 to $199,999 | 0 | 0.0% |
| $200,000+ | 0 | 0.0% |
Family Income by Famaliy Size in Las Ollas
2-person families (163 | 54.0%) account for the highest median family income in Las Ollas with $20,160 per family, while 2-person families (163 | 54.0%) have the highest median income of $10,080 per family member.
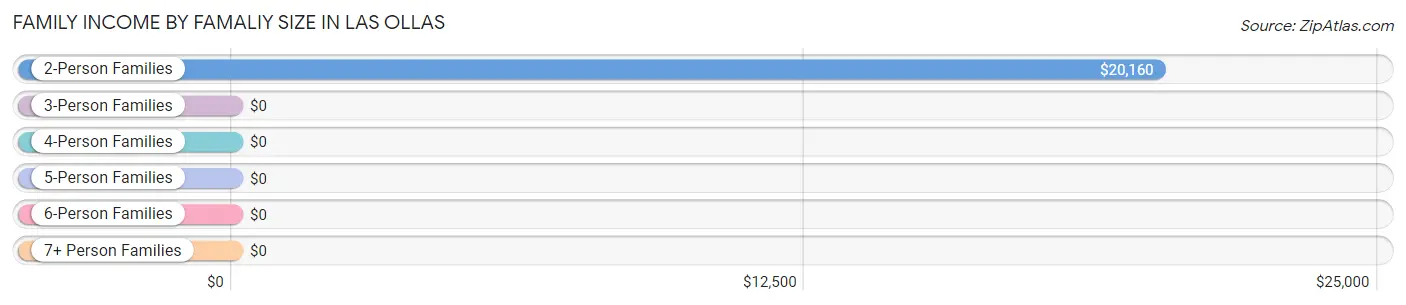
| Income Bracket | # Families | Median Income |
| 2-Person Families | 163 (54.0%) | $20,160 |
| 3-Person Families | 117 (38.7%) | $0 |
| 4-Person Families | 22 (7.3%) | $0 |
| 5-Person Families | 0 (0.0%) | $0 |
| 6-Person Families | 0 (0.0%) | $0 |
| 7+ Person Families | 0 (0.0%) | $0 |
| Total | 302 (100.0%) | $20,128 |
Family Income by Number of Earners in Las Ollas
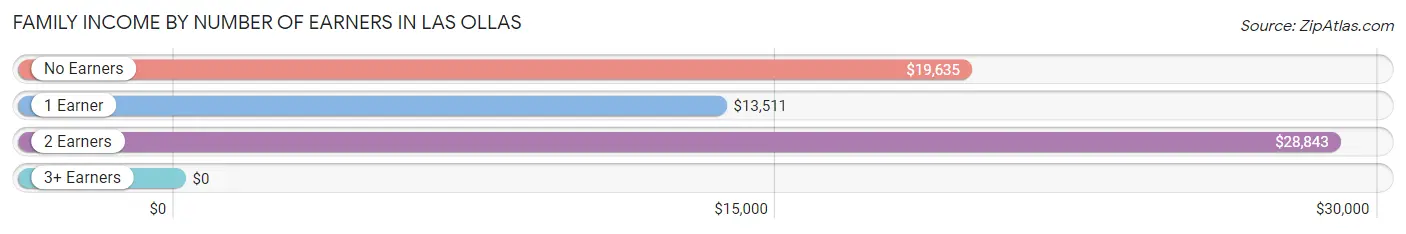
| Number of Earners | # Families | Median Income |
| No Earners | 121 (40.1%) | $19,635 |
| 1 Earner | 72 (23.8%) | $13,511 |
| 2 Earners | 109 (36.1%) | $28,843 |
| 3+ Earners | 0 (0.0%) | $0 |
| Total | 302 (100.0%) | $20,128 |
Household Income in Las Ollas
Household Income Brackets in Las Ollas
With 107 households falling in the category, the $10,000 to $14,999 income range is the most frequent in Las Ollas, accounting for 26.2% of all households.
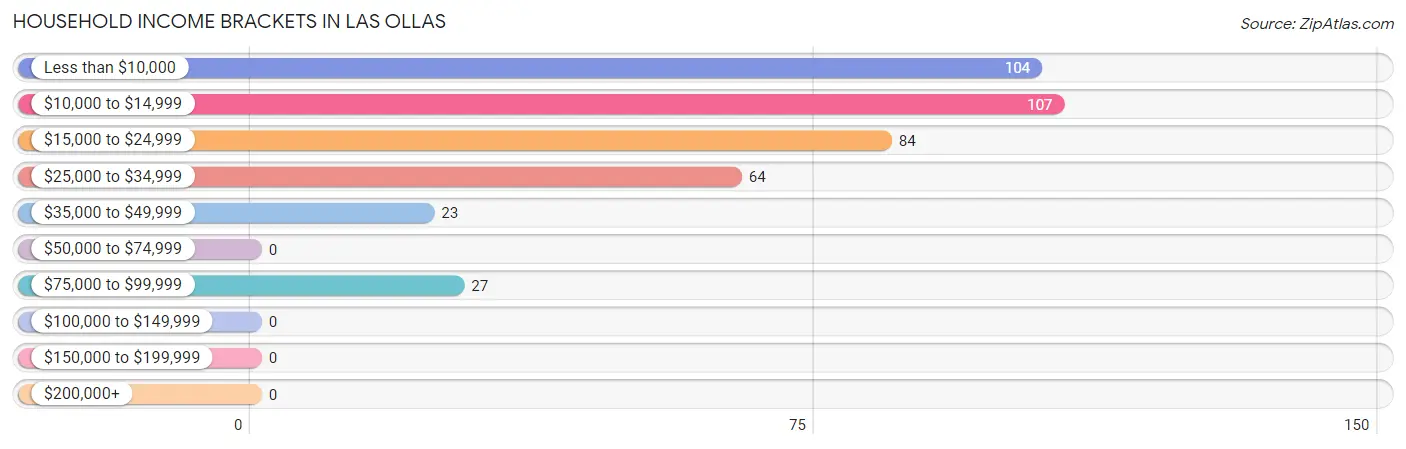
| Income Bracket | # Households | % Households |
| Less than $10,000 | 104 | 25.4% |
| $10,000 to $14,999 | 107 | 26.2% |
| $15,000 to $24,999 | 84 | 20.5% |
| $25,000 to $34,999 | 64 | 15.6% |
| $35,000 to $49,999 | 23 | 5.6% |
| $50,000 to $74,999 | 0 | 0.0% |
| $75,000 to $99,999 | 27 | 6.6% |
| $100,000 to $149,999 | 0 | 0.0% |
| $150,000 to $199,999 | 0 | 0.0% |
| $200,000+ | 0 | 0.0% |
Household Income by Householder Age in Las Ollas
The median household income in Las Ollas is $14,831, with the highest median household income of $28,657 found in the 25 to 44 years age bracket for the primary householder. A total of 59 households (14.4%) fall into this category.
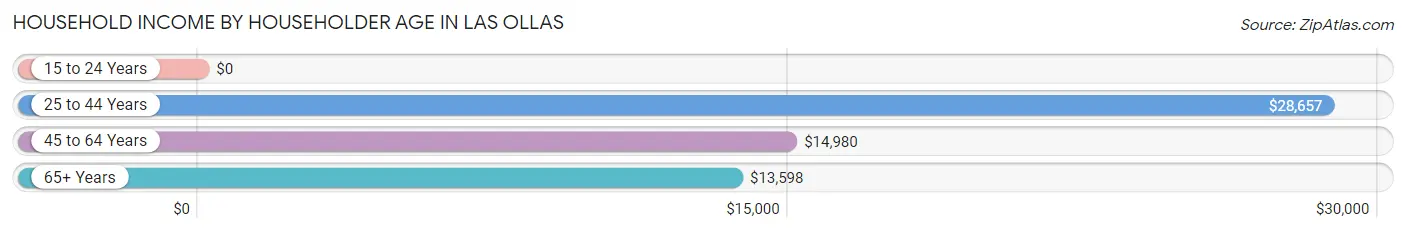
| Income Bracket | # Households | Median Income |
| 15 to 24 Years | 0 (0.0%) | $0 |
| 25 to 44 Years | 59 (14.4%) | $28,657 |
| 45 to 64 Years | 161 (39.4%) | $14,980 |
| 65+ Years | 189 (46.2%) | $13,598 |
| Total | 409 (100.0%) | $14,831 |
Poverty in Las Ollas
Income Below Poverty by Sex and Age in Las Ollas
With 52.0% poverty level for males and 44.0% for females among the residents of Las Ollas, 45 to 54 year old males and 65 to 74 year old females are the most vulnerable to poverty, with 47 males (79.7%) and 90 females (82.6%) in their respective age groups living below the poverty level.
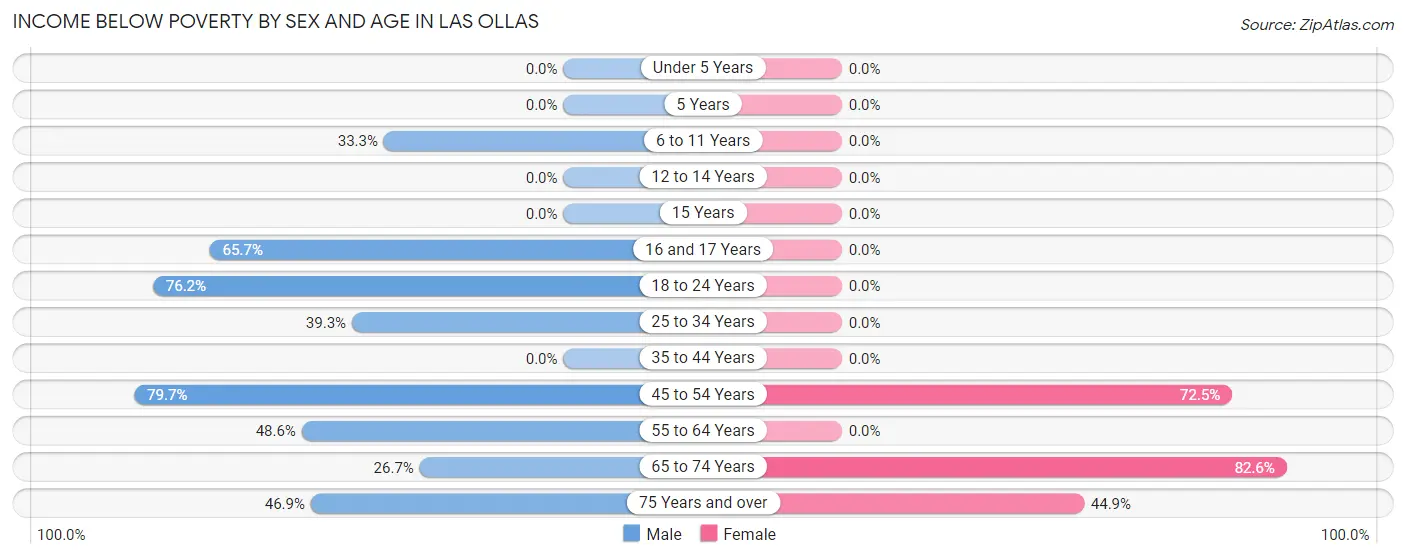
| Age Bracket | Male | Female |
| Under 5 Years | 0 (0.0%) | 0 (0.0%) |
| 5 Years | 0 (0.0%) | 0 (0.0%) |
| 6 to 11 Years | 23 (33.3%) | 0 (0.0%) |
| 12 to 14 Years | 0 (0.0%) | 0 (0.0%) |
| 15 Years | 0 (0.0%) | 0 (0.0%) |
| 16 and 17 Years | 44 (65.7%) | 0 (0.0%) |
| 18 to 24 Years | 64 (76.2%) | 0 (0.0%) |
| 25 to 34 Years | 42 (39.3%) | 0 (0.0%) |
| 35 to 44 Years | 0 (0.0%) | 0 (0.0%) |
| 45 to 54 Years | 47 (79.7%) | 71 (72.5%) |
| 55 to 64 Years | 34 (48.6%) | 0 (0.0%) |
| 65 to 74 Years | 16 (26.7%) | 90 (82.6%) |
| 75 Years and over | 15 (46.9%) | 31 (44.9%) |
| Total | 285 (52.0%) | 192 (44.0%) |
Income Above Poverty by Sex and Age in Las Ollas
According to the poverty statistics in Las Ollas, males aged 65 to 74 years and females aged 25 to 34 years are the age groups that are most secure financially, with 73.3% of males and 100.0% of females in these age groups living above the poverty line.
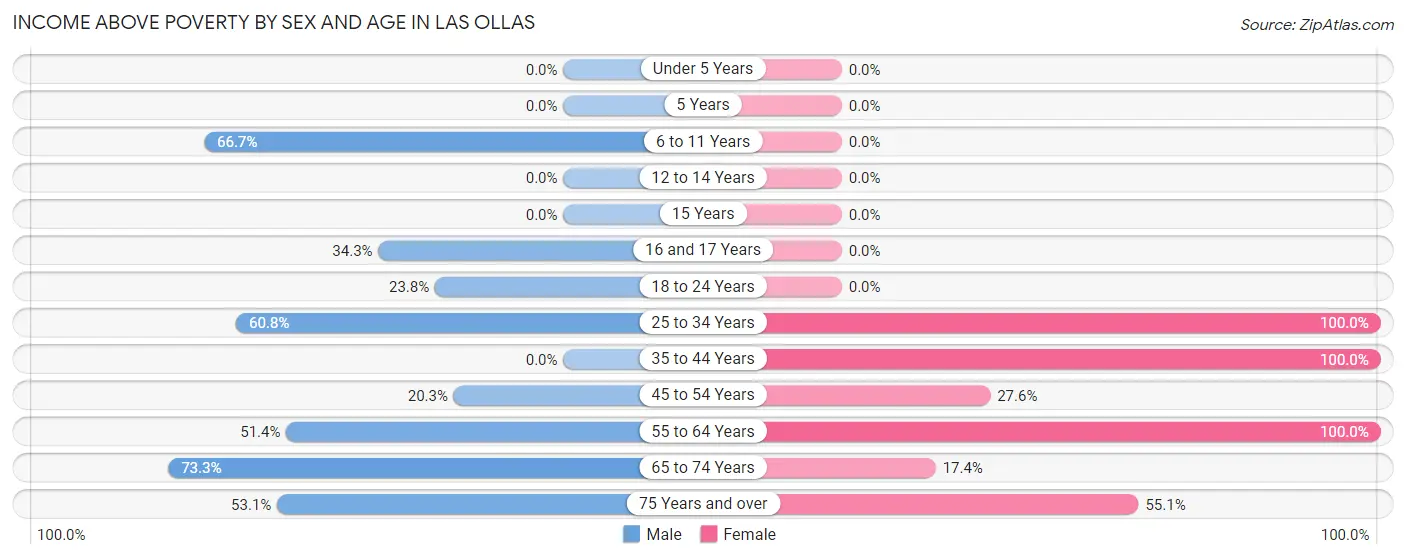
| Age Bracket | Male | Female |
| Under 5 Years | 0 (0.0%) | 0 (0.0%) |
| 5 Years | 0 (0.0%) | 0 (0.0%) |
| 6 to 11 Years | 46 (66.7%) | 0 (0.0%) |
| 12 to 14 Years | 0 (0.0%) | 0 (0.0%) |
| 15 Years | 0 (0.0%) | 0 (0.0%) |
| 16 and 17 Years | 23 (34.3%) | 0 (0.0%) |
| 18 to 24 Years | 20 (23.8%) | 0 (0.0%) |
| 25 to 34 Years | 65 (60.8%) | 54 (100.0%) |
| 35 to 44 Years | 0 (0.0%) | 71 (100.0%) |
| 45 to 54 Years | 12 (20.3%) | 27 (27.6%) |
| 55 to 64 Years | 36 (51.4%) | 35 (100.0%) |
| 65 to 74 Years | 44 (73.3%) | 19 (17.4%) |
| 75 Years and over | 17 (53.1%) | 38 (55.1%) |
| Total | 263 (48.0%) | 244 (56.0%) |
Income Below Poverty Among Married-Couple Families in Las Ollas
The poverty statistics for married-couple families in Las Ollas show that 41.1% or 65 of the total 158 families live below the poverty line. Families with 1 or 2 children have the highest poverty rate of 50.0%, comprising of 15 families. On the other hand, families with no children have the lowest poverty rate of 39.1%, which includes 50 families.
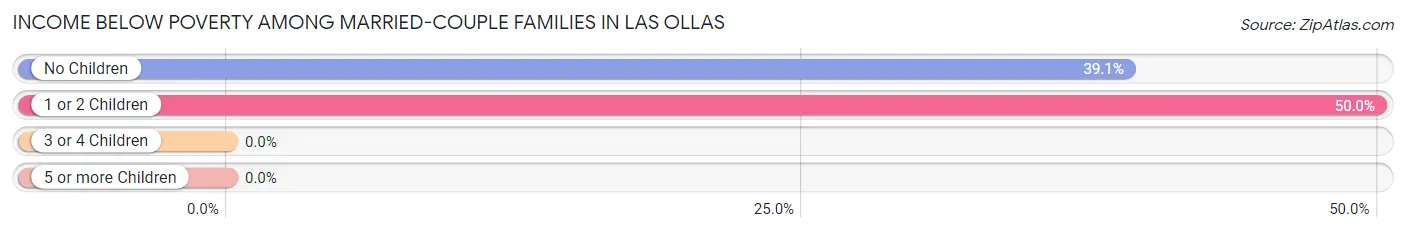
| Children | Above Poverty | Below Poverty |
| No Children | 78 (60.9%) | 50 (39.1%) |
| 1 or 2 Children | 15 (50.0%) | 15 (50.0%) |
| 3 or 4 Children | 0 (0.0%) | 0 (0.0%) |
| 5 or more Children | 0 (0.0%) | 0 (0.0%) |
| Total | 93 (58.9%) | 65 (41.1%) |
Income Below Poverty Among Single-Parent Households in Las Ollas
According to the poverty data in Las Ollas, 59.7% or 46 single-father households and 31.3% or 21 single-mother households are living below the poverty line. Among single-father households, those with 1 or 2 children have the highest poverty rate, with 38 households (100.0%) experiencing poverty. Likewise, among single-mother households, those with no children have the highest poverty rate, with 21 households (52.5%) falling below the poverty line.
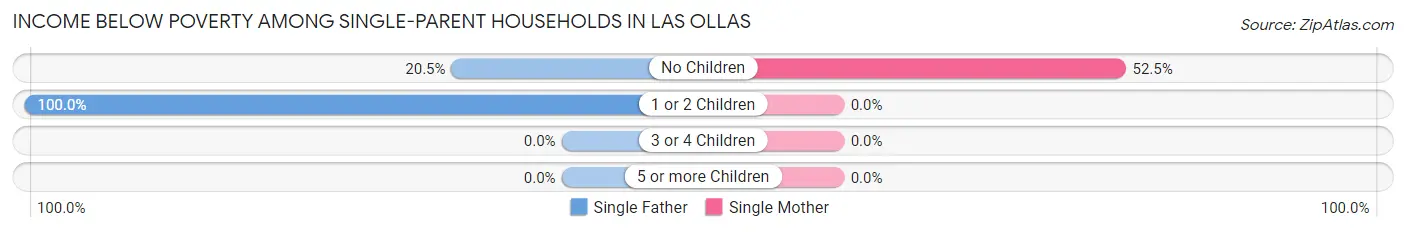
| Children | Single Father | Single Mother |
| No Children | 8 (20.5%) | 21 (52.5%) |
| 1 or 2 Children | 38 (100.0%) | 0 (0.0%) |
| 3 or 4 Children | 0 (0.0%) | 0 (0.0%) |
| 5 or more Children | 0 (0.0%) | 0 (0.0%) |
| Total | 46 (59.7%) | 21 (31.3%) |
Income Below Poverty Among Married-Couple vs Single-Parent Households in Las Ollas
The poverty data for Las Ollas shows that 65 of the married-couple family households (41.1%) and 67 of the single-parent households (46.5%) are living below the poverty level. Within the married-couple family households, those with 1 or 2 children have the highest poverty rate, with 15 households (50.0%) falling below the poverty line. Among the single-parent households, those with 1 or 2 children have the highest poverty rate, with 38 household (58.5%) living below poverty.
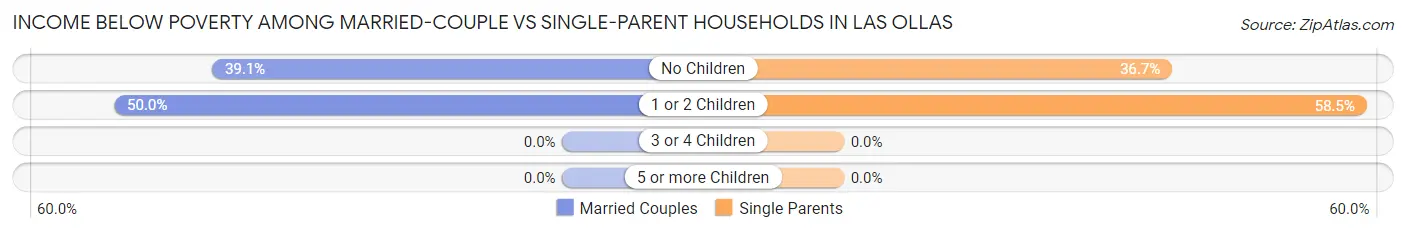
| Children | Married-Couple Families | Single-Parent Households |
| No Children | 50 (39.1%) | 29 (36.7%) |
| 1 or 2 Children | 15 (50.0%) | 38 (58.5%) |
| 3 or 4 Children | 0 (0.0%) | 0 (0.0%) |
| 5 or more Children | 0 (0.0%) | 0 (0.0%) |
| Total | 65 (41.1%) | 67 (46.5%) |
Race in Las Ollas
The most populous races in Las Ollas are Hispanic or Latino (984 | 100.0%), Two or more Races (491 | 49.9%), and White / Caucasian (332 | 33.7%).
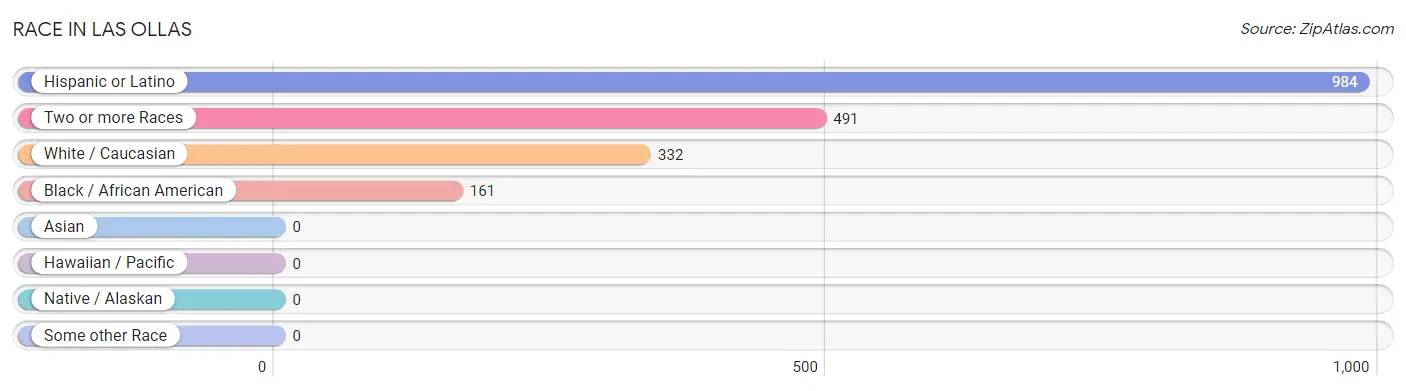
| Race | # Population | % Population |
| Asian | 0 | 0.0% |
| Black / African American | 161 | 16.4% |
| Hawaiian / Pacific | 0 | 0.0% |
| Hispanic or Latino | 984 | 100.0% |
| Native / Alaskan | 0 | 0.0% |
| White / Caucasian | 332 | 33.7% |
| Two or more Races | 491 | 49.9% |
| Some other Race | 0 | 0.0% |
| Total | 984 | 100.0% |
Ancestry in Las Ollas
The most populous ancestries reported in Las Ollas are Puerto Rican (967 | 98.3%), Colombian (17 | 1.7%), and South American (17 | 1.7%), together accounting for 101.7% of all Las Ollas residents.
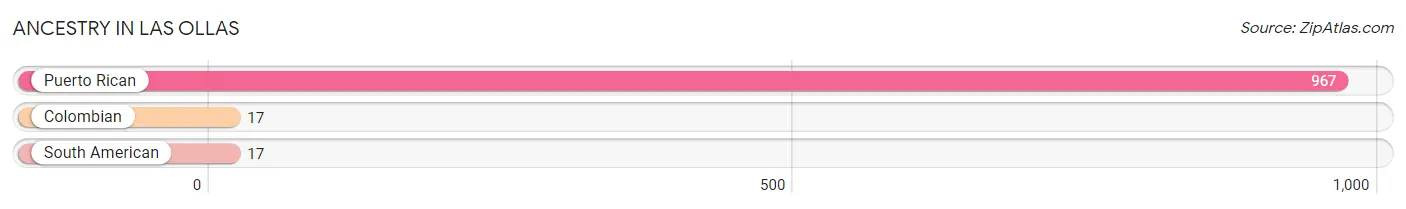
| Ancestry | # Population | % Population |
| Colombian | 17 | 1.7% |
| Puerto Rican | 967 | 98.3% |
| South American | 17 | 1.7% | View All 3 Rows |
Immigrants in Las Ollas

| Immigration Origin | # Population | % Population | View All 0 Rows |
Sex and Age in Las Ollas
Sex and Age in Las Ollas
The most populous age groups in Las Ollas are 30 to 34 Years (107 | 19.5%) for men and 40 to 44 Years (71 | 16.3%) for women.
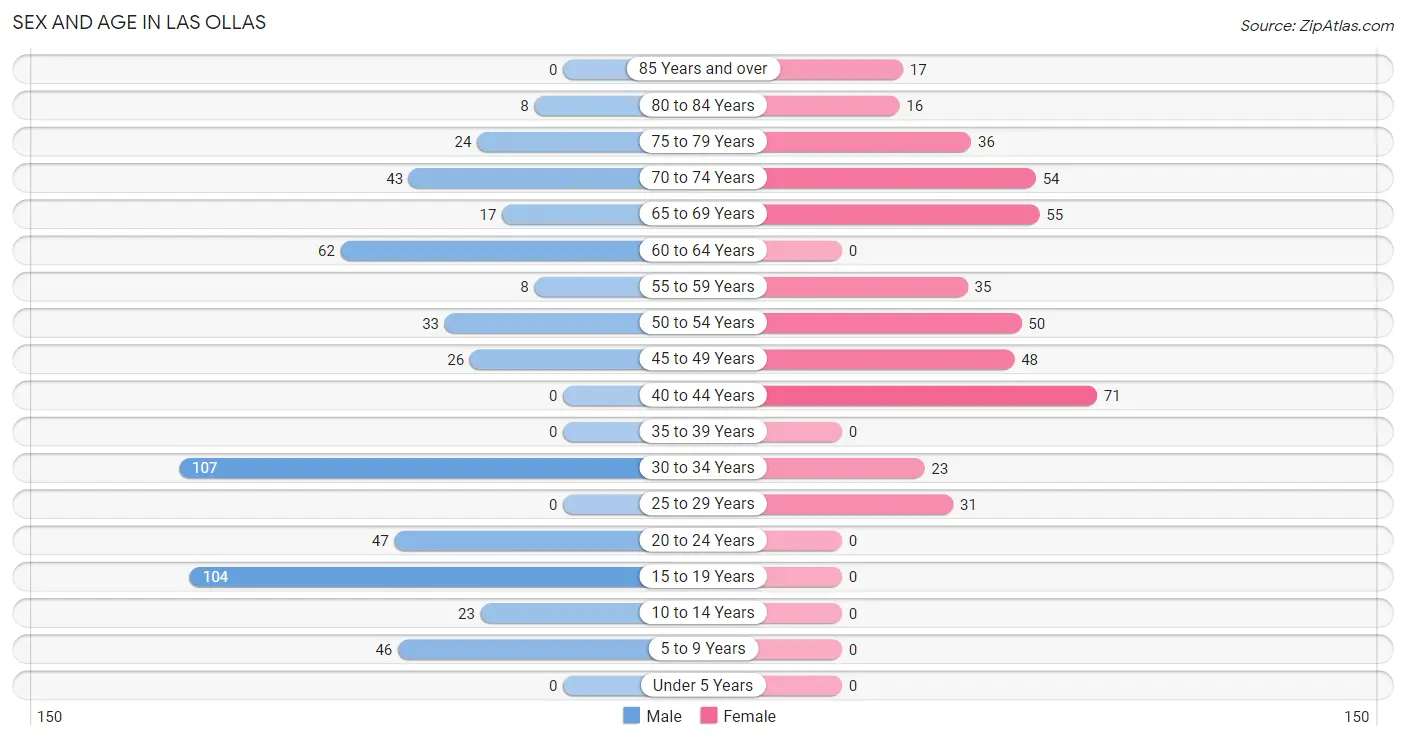
| Age Bracket | Male | Female |
| Under 5 Years | 0 (0.0%) | 0 (0.0%) |
| 5 to 9 Years | 46 (8.4%) | 0 (0.0%) |
| 10 to 14 Years | 23 (4.2%) | 0 (0.0%) |
| 15 to 19 Years | 104 (19.0%) | 0 (0.0%) |
| 20 to 24 Years | 47 (8.6%) | 0 (0.0%) |
| 25 to 29 Years | 0 (0.0%) | 31 (7.1%) |
| 30 to 34 Years | 107 (19.5%) | 23 (5.3%) |
| 35 to 39 Years | 0 (0.0%) | 0 (0.0%) |
| 40 to 44 Years | 0 (0.0%) | 71 (16.3%) |
| 45 to 49 Years | 26 (4.7%) | 48 (11.0%) |
| 50 to 54 Years | 33 (6.0%) | 50 (11.5%) |
| 55 to 59 Years | 8 (1.5%) | 35 (8.0%) |
| 60 to 64 Years | 62 (11.3%) | 0 (0.0%) |
| 65 to 69 Years | 17 (3.1%) | 55 (12.6%) |
| 70 to 74 Years | 43 (7.9%) | 54 (12.4%) |
| 75 to 79 Years | 24 (4.4%) | 36 (8.3%) |
| 80 to 84 Years | 8 (1.5%) | 16 (3.7%) |
| 85 Years and over | 0 (0.0%) | 17 (3.9%) |
| Total | 548 (100.0%) | 436 (100.0%) |
Families and Households in Las Ollas
Median Family Size in Las Ollas
The median family size in Las Ollas is 2.86 persons per family, with single female/mother families (67 | 22.2%) accounting for the largest median family size of 3.31 persons per family. On the other hand, single male/father families (77 | 25.5%) represent the smallest median family size with 2.48 persons per family.
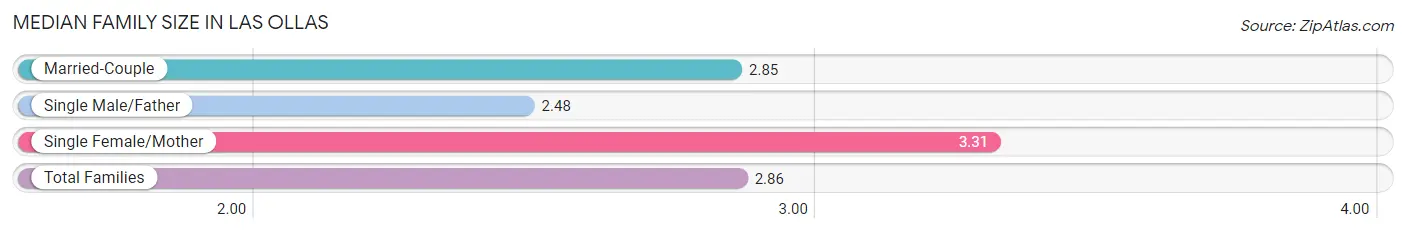
| Family Type | # Families | Family Size |
| Married-Couple | 158 (52.3%) | 2.85 |
| Single Male/Father | 77 (25.5%) | 2.48 |
| Single Female/Mother | 67 (22.2%) | 3.31 |
| Total Families | 302 (100.0%) | 2.86 |
Median Household Size in Las Ollas
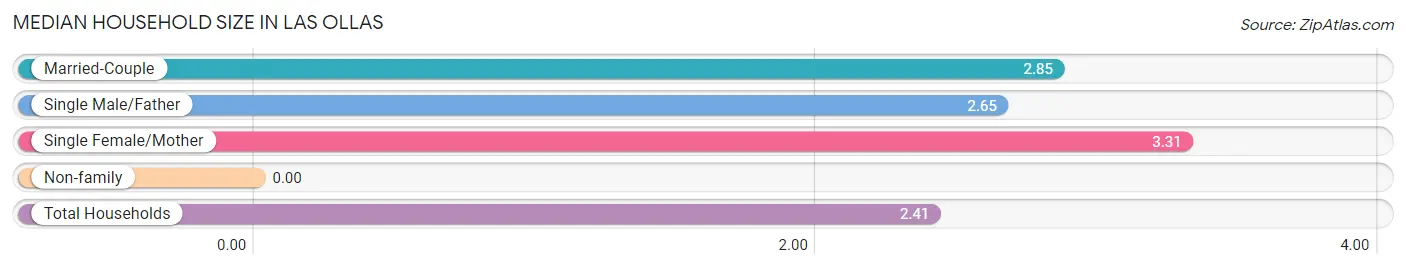
| Household Type | # Households | Household Size |
| Married-Couple | 158 (38.6%) | 2.85 |
| Single Male/Father | 77 (18.8%) | 2.65 |
| Single Female/Mother | 67 (16.4%) | 3.31 |
| Non-family | 107 (26.2%) | - |
| Total Households | 409 (100.0%) | 2.41 |
Household Size by Marriage Status in Las Ollas
Out of a total of 409 households in Las Ollas, 302 (73.8%) are family households, while 107 (26.2%) are nonfamily households. The most numerous type of family households are 2-person households, comprising 142, and the most common type of nonfamily households are 1-person households, comprising 107.
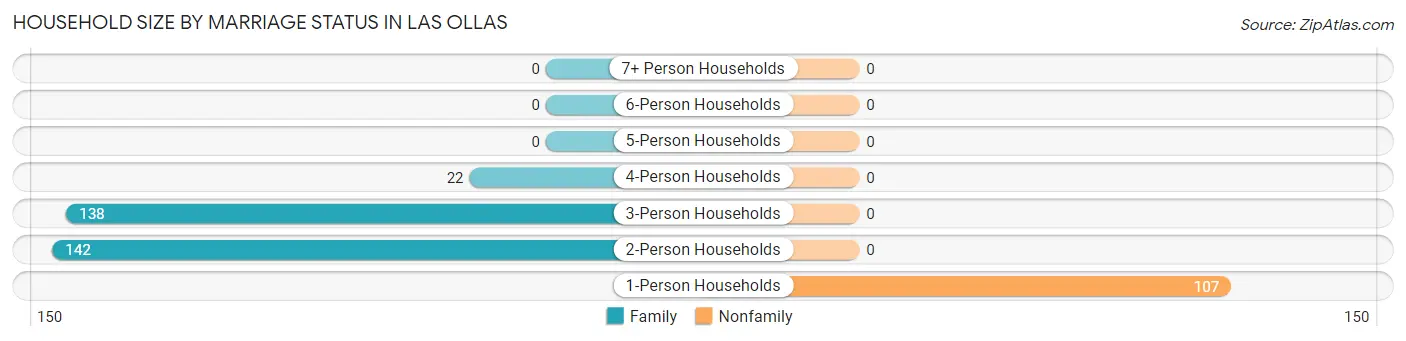
| Household Size | Family Households | Nonfamily Households |
| 1-Person Households | - | 107 (26.2%) |
| 2-Person Households | 142 (34.7%) | 0 (0.0%) |
| 3-Person Households | 138 (33.7%) | 0 (0.0%) |
| 4-Person Households | 22 (5.4%) | 0 (0.0%) |
| 5-Person Households | 0 (0.0%) | 0 (0.0%) |
| 6-Person Households | 0 (0.0%) | 0 (0.0%) |
| 7+ Person Households | 0 (0.0%) | 0 (0.0%) |
| Total | 302 (73.8%) | 107 (26.2%) |
Female Fertility in Las Ollas
Fertility by Age in Las Ollas
| Age Bracket | Women with Births | Births / 1,000 Women |
| 15 to 19 years | 0 (0.0%) | 0.0 |
| 20 to 34 years | 0 (0.0%) | 0.0 |
| 35 to 50 years | 0 (0.0%) | 0.0 |
| Total | 0 (0.0%) | 0.0 |
Fertility by Age by Marriage Status in Las Ollas
| Age Bracket | Married | Unmarried |
| 15 to 19 years | 0 (0.0%) | 0 (0.0%) |
| 20 to 34 years | 0 (0.0%) | 0 (0.0%) |
| 35 to 50 years | 0 (0.0%) | 0 (0.0%) |
| Total | 0 (0.0%) | 0 (0.0%) |
Fertility by Education in Las Ollas
| Educational Attainment | Women with Births | Births / 1,000 Women |
| Less than High School | 0 (0.0%) | 0.0 |
| High School Diploma | 0 (0.0%) | 0.0 |
| College or Associate's Degree | 0 (0.0%) | 0.0 |
| Bachelor's Degree | 0 (0.0%) | 0.0 |
| Graduate Degree | 0 (0.0%) | 0.0 |
| Total | 0 (0.0%) | 0.0 |
Fertility by Education by Marriage Status in Las Ollas
| Educational Attainment | Married | Unmarried |
| Less than High School | 0 (0.0%) | 0 (0.0%) |
| High School Diploma | 0 (0.0%) | 0 (0.0%) |
| College or Associate's Degree | 0 (0.0%) | 0 (0.0%) |
| Bachelor's Degree | 0 (0.0%) | 0 (0.0%) |
| Graduate Degree | 0 (0.0%) | 0 (0.0%) |
| Total | 0 (0.0%) | 0 (0.0%) |
Employment Characteristics in Las Ollas
Employment by Class of Employer in Las Ollas
Among the 314 employed individuals in Las Ollas, private company employees (233 | 74.2%), local government employees (31 | 9.9%), and state government employees (27 | 8.6%) make up the most common classes of employment.
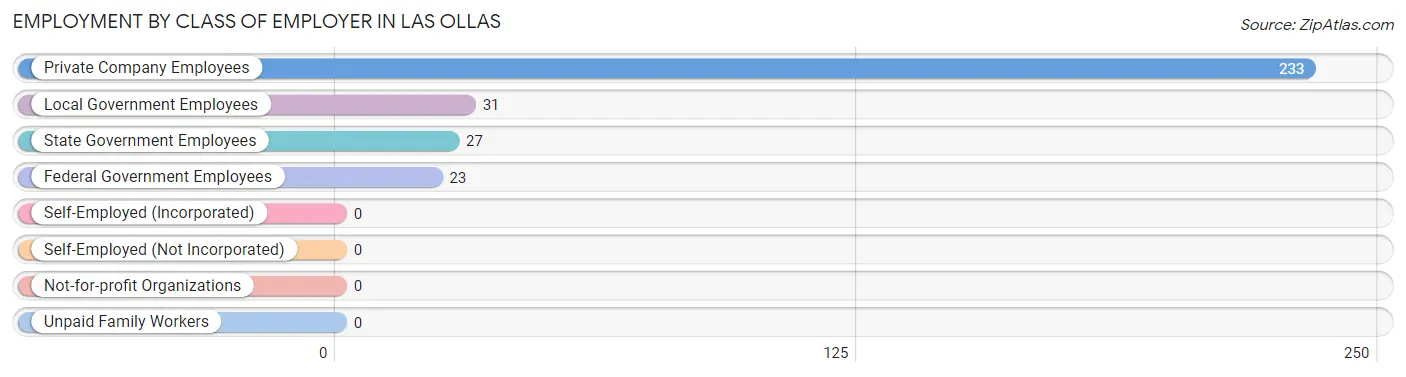
| Employer Class | # Employees | % Employees |
| Private Company Employees | 233 | 74.2% |
| Self-Employed (Incorporated) | 0 | 0.0% |
| Self-Employed (Not Incorporated) | 0 | 0.0% |
| Not-for-profit Organizations | 0 | 0.0% |
| Local Government Employees | 31 | 9.9% |
| State Government Employees | 27 | 8.6% |
| Federal Government Employees | 23 | 7.3% |
| Unpaid Family Workers | 0 | 0.0% |
| Total | 314 | 100.0% |
Employment Status by Age in Las Ollas
According to the labor force statistics for Las Ollas, out of the total population over 16 years of age (915), 41.4% or 379 individuals are in the labor force, with 17.2% or 65 of them unemployed. The age group with the highest labor force participation rate is 25 to 29 years, with 100.0% or 31 individuals in the labor force. Within the labor force, the 20 to 24 years age range has the highest percentage of unemployed individuals, with 100.0% or 21 of them being unemployed.
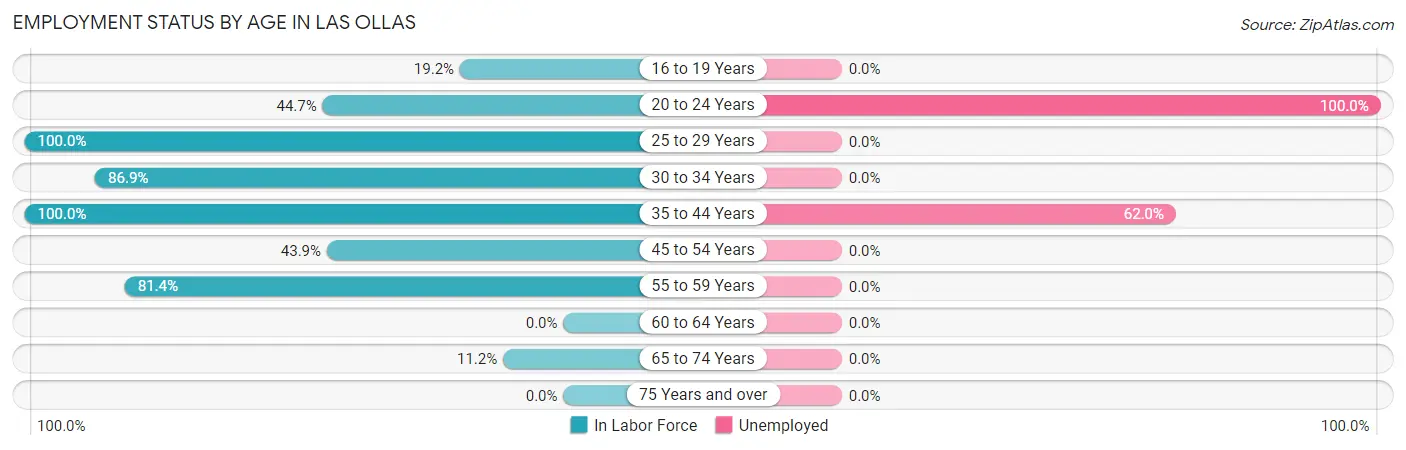
| Age Bracket | In Labor Force | Unemployed |
| 16 to 19 Years | 20 (19.2%) | 0 (0.0%) |
| 20 to 24 Years | 21 (44.7%) | 21 (100.0%) |
| 25 to 29 Years | 31 (100.0%) | 0 (0.0%) |
| 30 to 34 Years | 113 (86.9%) | 0 (0.0%) |
| 35 to 44 Years | 71 (100.0%) | 44 (62.0%) |
| 45 to 54 Years | 69 (43.9%) | 0 (0.0%) |
| 55 to 59 Years | 35 (81.4%) | 0 (0.0%) |
| 60 to 64 Years | 0 (0.0%) | 0 (0.0%) |
| 65 to 74 Years | 19 (11.2%) | 0 (0.0%) |
| 75 Years and over | 0 (0.0%) | 0 (0.0%) |
| Total | 379 (41.4%) | 65 (17.2%) |
Employment Status by Educational Attainment in Las Ollas
According to labor force statistics for Las Ollas, 64.6% of individuals (319) out of the total population between 25 and 64 years of age (494) are in the labor force, with 13.8% or 44 of them being unemployed. The group with the highest labor force participation rate are those with the educational attainment of bachelor's degree or higher, with 89.4% or 93 individuals in the labor force. Within the labor force, individuals with less than high school education have the highest percentage of unemployment, with 47.8% or 44 of them being unemployed.
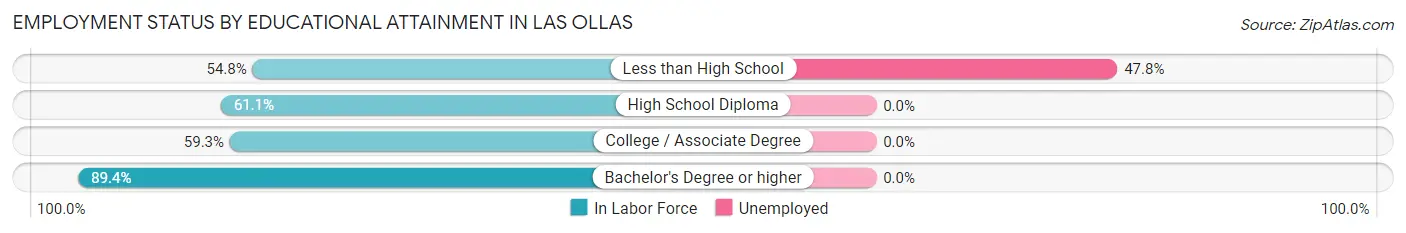
| Educational Attainment | In Labor Force | Unemployed |
| Less than High School | 92 (54.8%) | 80 (47.8%) |
| High School Diploma | 80 (61.1%) | 0 (0.0%) |
| College / Associate Degree | 54 (59.3%) | 0 (0.0%) |
| Bachelor's Degree or higher | 93 (89.4%) | 0 (0.0%) |
| Total | 319 (64.6%) | 68 (13.8%) |
Employment Occupations by Sex in Las Ollas
Management, Business, Science and Arts Occupations
The most common Management, Business, Science and Arts occupations in Las Ollas are Health Diagnosing & Treating (23 | 7.3%), and Health Technologists (23 | 7.3%).
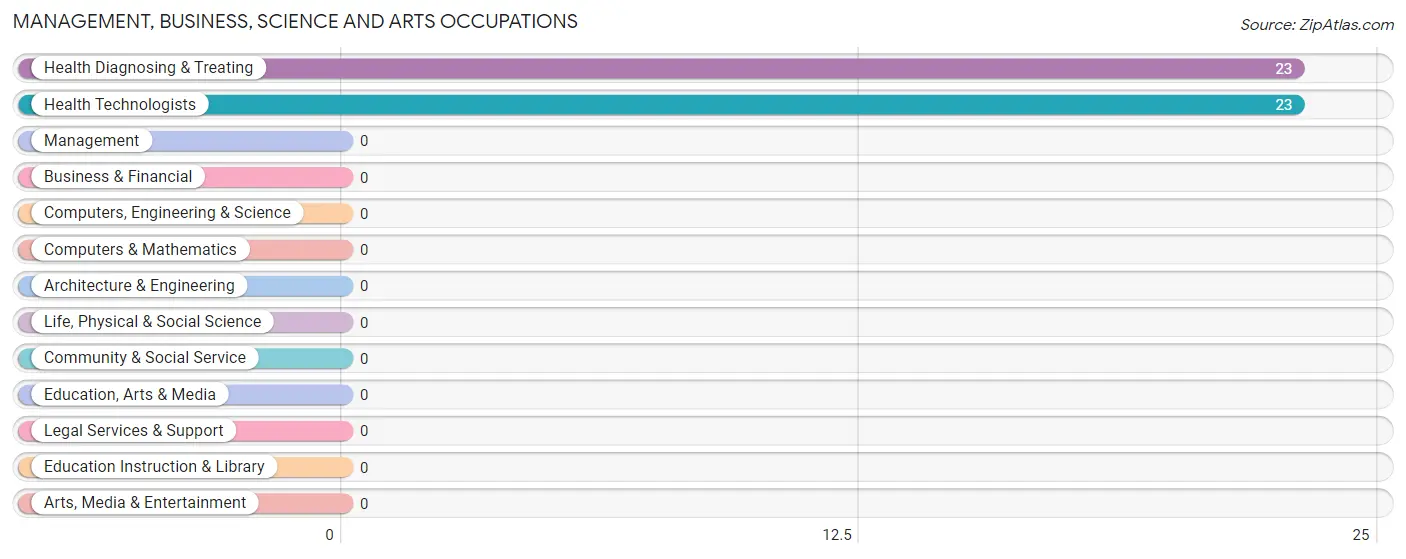
Management, Business, Science and Arts Occupations by Sex
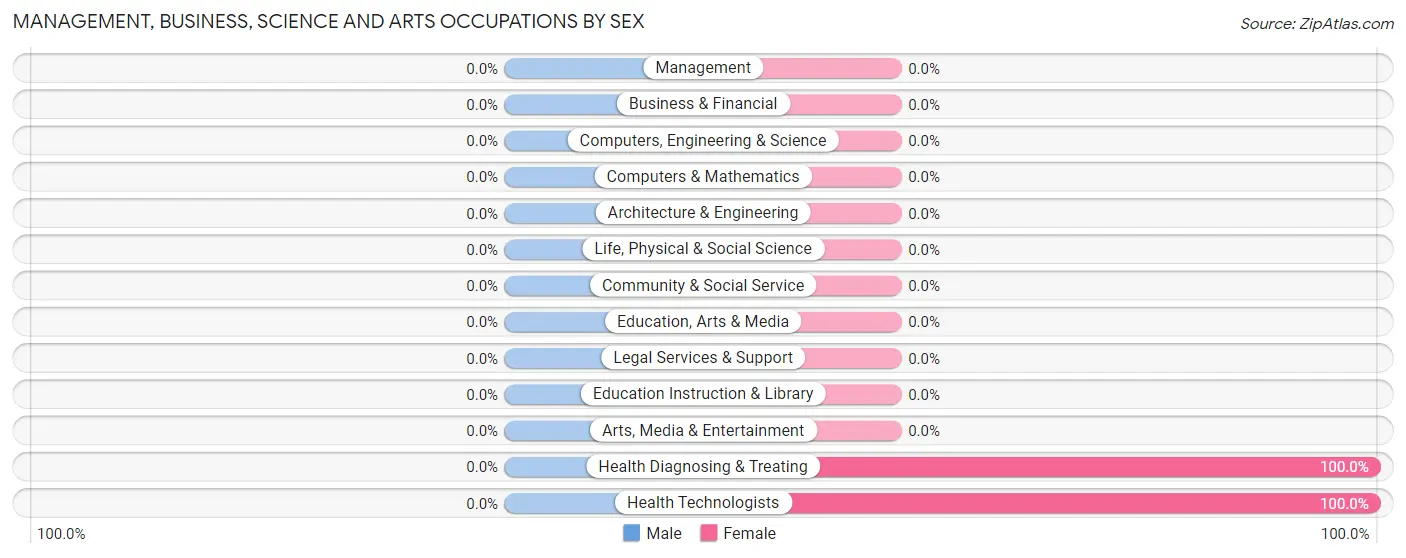
| Occupation | Male | Female |
| Management | 0 (0.0%) | 0 (0.0%) |
| Business & Financial | 0 (0.0%) | 0 (0.0%) |
| Computers, Engineering & Science | 0 (0.0%) | 0 (0.0%) |
| Computers & Mathematics | 0 (0.0%) | 0 (0.0%) |
| Architecture & Engineering | 0 (0.0%) | 0 (0.0%) |
| Life, Physical & Social Science | 0 (0.0%) | 0 (0.0%) |
| Community & Social Service | 0 (0.0%) | 0 (0.0%) |
| Education, Arts & Media | 0 (0.0%) | 0 (0.0%) |
| Legal Services & Support | 0 (0.0%) | 0 (0.0%) |
| Education Instruction & Library | 0 (0.0%) | 0 (0.0%) |
| Arts, Media & Entertainment | 0 (0.0%) | 0 (0.0%) |
| Health Diagnosing & Treating | 0 (0.0%) | 23 (100.0%) |
| Health Technologists | 0 (0.0%) | 23 (100.0%) |
| Total (Category) | 0 (0.0%) | 23 (100.0%) |
| Total (Overall) | 150 (47.8%) | 164 (52.2%) |
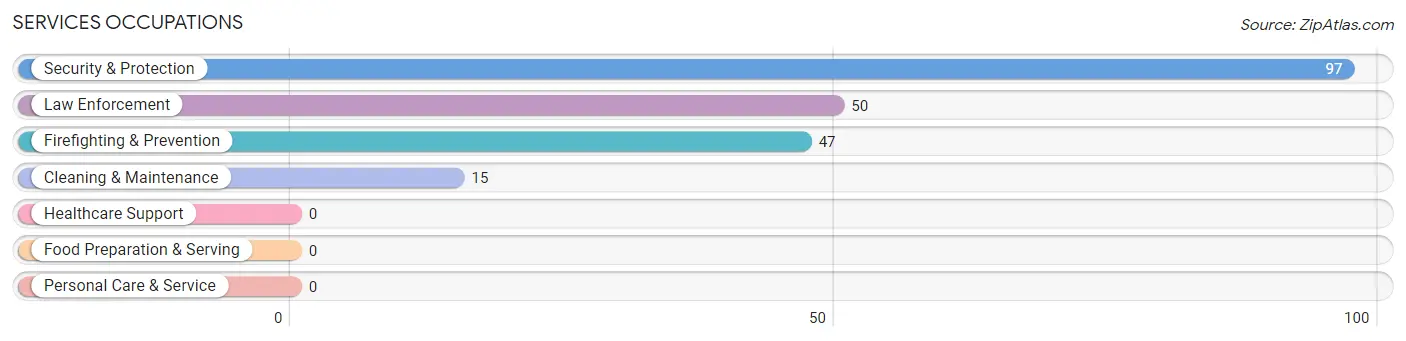
Services Occupations
The most common Services occupations in Las Ollas are Security & Protection (97 | 30.9%), Law Enforcement (50 | 15.9%), Firefighting & Prevention (47 | 15.0%), and Cleaning & Maintenance (15 | 4.8%).
Services Occupations by Sex
Within the Services occupations in Las Ollas, the most male-oriented occupations are Law Enforcement (100.0%), Cleaning & Maintenance (100.0%), and Security & Protection (72.2%), while the most female-oriented occupations are Firefighting & Prevention (57.5%), and Security & Protection (27.8%).
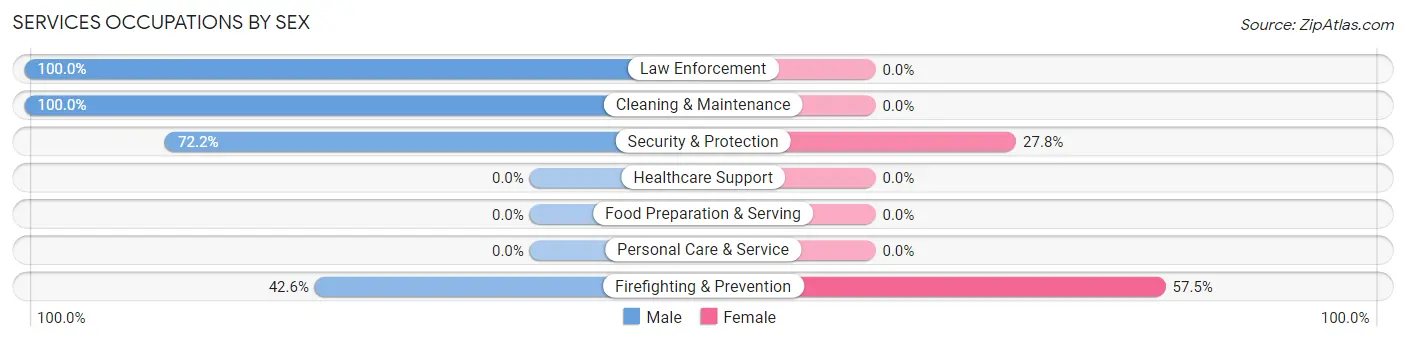
| Occupation | Male | Female |
| Healthcare Support | 0 (0.0%) | 0 (0.0%) |
| Security & Protection | 70 (72.2%) | 27 (27.8%) |
| Firefighting & Prevention | 20 (42.5%) | 27 (57.5%) |
| Law Enforcement | 50 (100.0%) | 0 (0.0%) |
| Food Preparation & Serving | 0 (0.0%) | 0 (0.0%) |
| Cleaning & Maintenance | 15 (100.0%) | 0 (0.0%) |
| Personal Care & Service | 0 (0.0%) | 0 (0.0%) |
| Total (Category) | 85 (75.9%) | 27 (24.1%) |
| Total (Overall) | 150 (47.8%) | 164 (52.2%) |
Sales and Office Occupations
The most common Sales and Office occupations in Las Ollas are , and Office & Administration (62 | 19.8%).

Sales and Office Occupations by Sex

| Occupation | Male | Female |
| Sales & Related | 0 (0.0%) | 0 (0.0%) |
| Office & Administration | 0 (0.0%) | 62 (100.0%) |
| Total (Category) | 0 (0.0%) | 62 (100.0%) |
| Total (Overall) | 150 (47.8%) | 164 (52.2%) |
Natural Resources, Construction and Maintenance Occupations
The most common Natural Resources, Construction and Maintenance occupations in Las Ollas are , and Farming, Fishing & Forestry (86 | 27.4%).

Natural Resources, Construction and Maintenance Occupations by Sex

| Occupation | Male | Female |
| Farming, Fishing & Forestry | 65 (75.6%) | 21 (24.4%) |
| Construction & Extraction | 0 (0.0%) | 0 (0.0%) |
| Installation, Maintenance & Repair | 0 (0.0%) | 0 (0.0%) |
| Total (Category) | 65 (75.6%) | 21 (24.4%) |
| Total (Overall) | 150 (47.8%) | 164 (52.2%) |
Production, Transportation and Moving Occupations
The most common Production, Transportation and Moving occupations in Las Ollas are , and Production (31 | 9.9%).
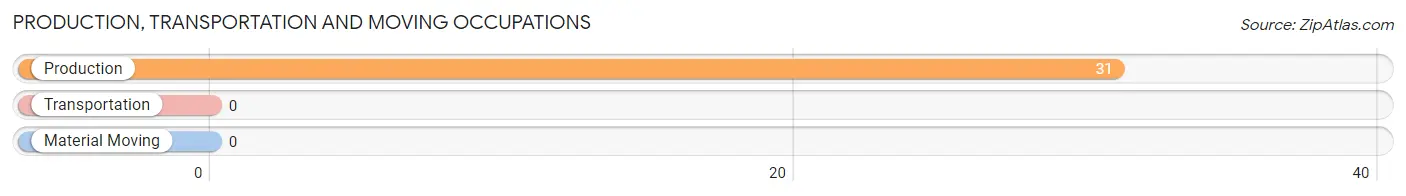
Production, Transportation and Moving Occupations by Sex
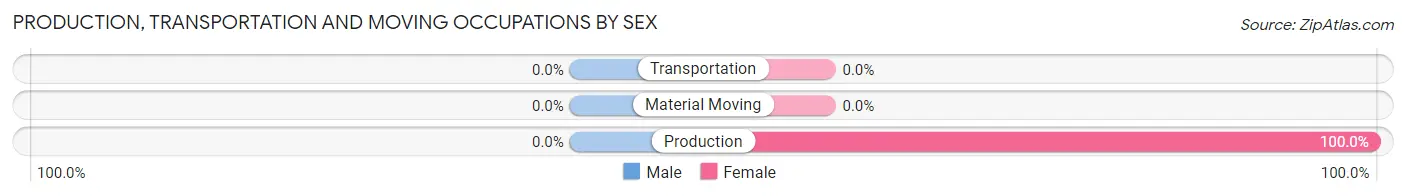
| Occupation | Male | Female |
| Production | 0 (0.0%) | 31 (100.0%) |
| Transportation | 0 (0.0%) | 0 (0.0%) |
| Material Moving | 0 (0.0%) | 0 (0.0%) |
| Total (Category) | 0 (0.0%) | 31 (100.0%) |
| Total (Overall) | 150 (47.8%) | 164 (52.2%) |
Employment Industries by Sex in Las Ollas
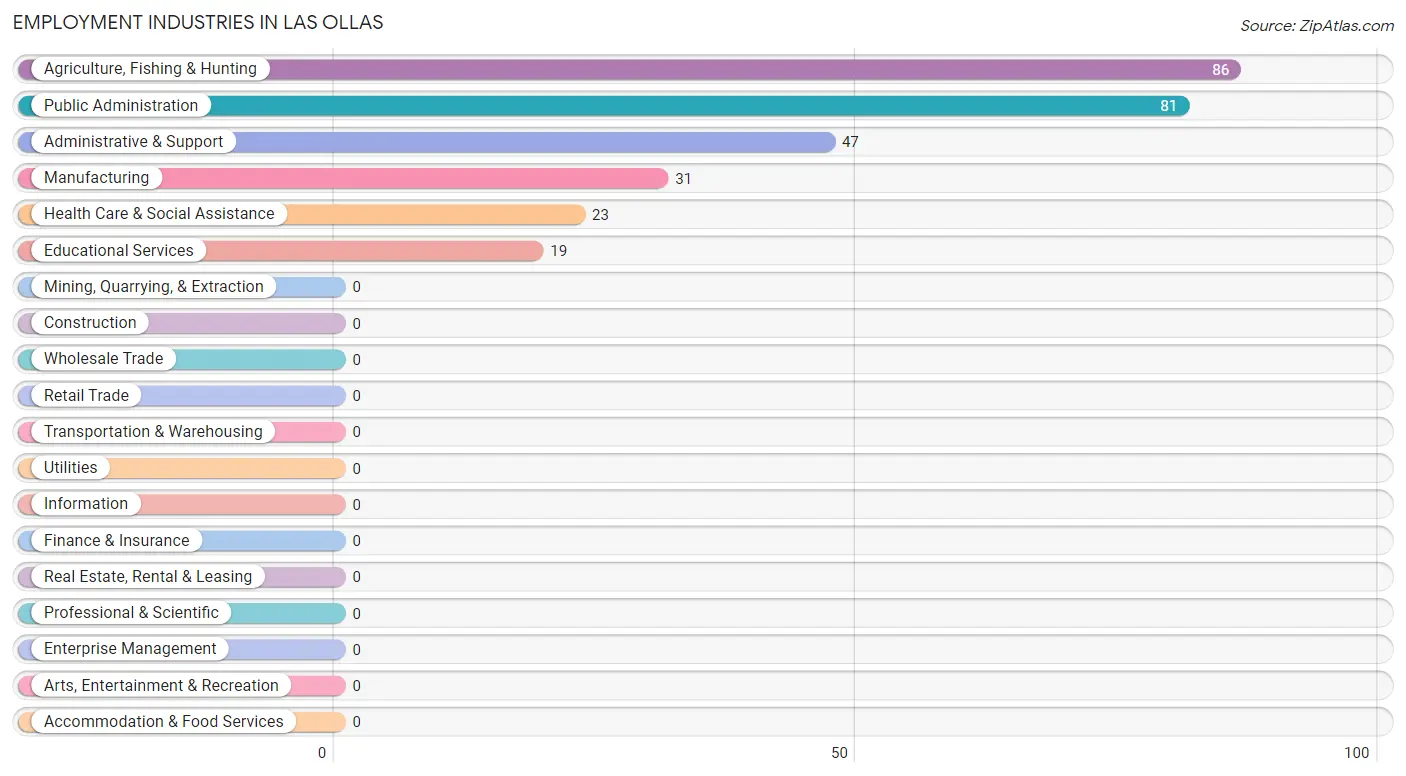
Employment Industries in Las Ollas
The major employment industries in Las Ollas include Agriculture, Fishing & Hunting (86 | 27.4%), Public Administration (81 | 25.8%), Administrative & Support (47 | 15.0%), Manufacturing (31 | 9.9%), and Health Care & Social Assistance (23 | 7.3%).
Employment Industries by Sex in Las Ollas
The Las Ollas industries that see more men than women are Public Administration (80.2%), Agriculture, Fishing & Hunting (75.6%), and Administrative & Support (42.5%), whereas the industries that tend to have a higher number of women are Manufacturing (100.0%), Educational Services (100.0%), and Health Care & Social Assistance (100.0%).
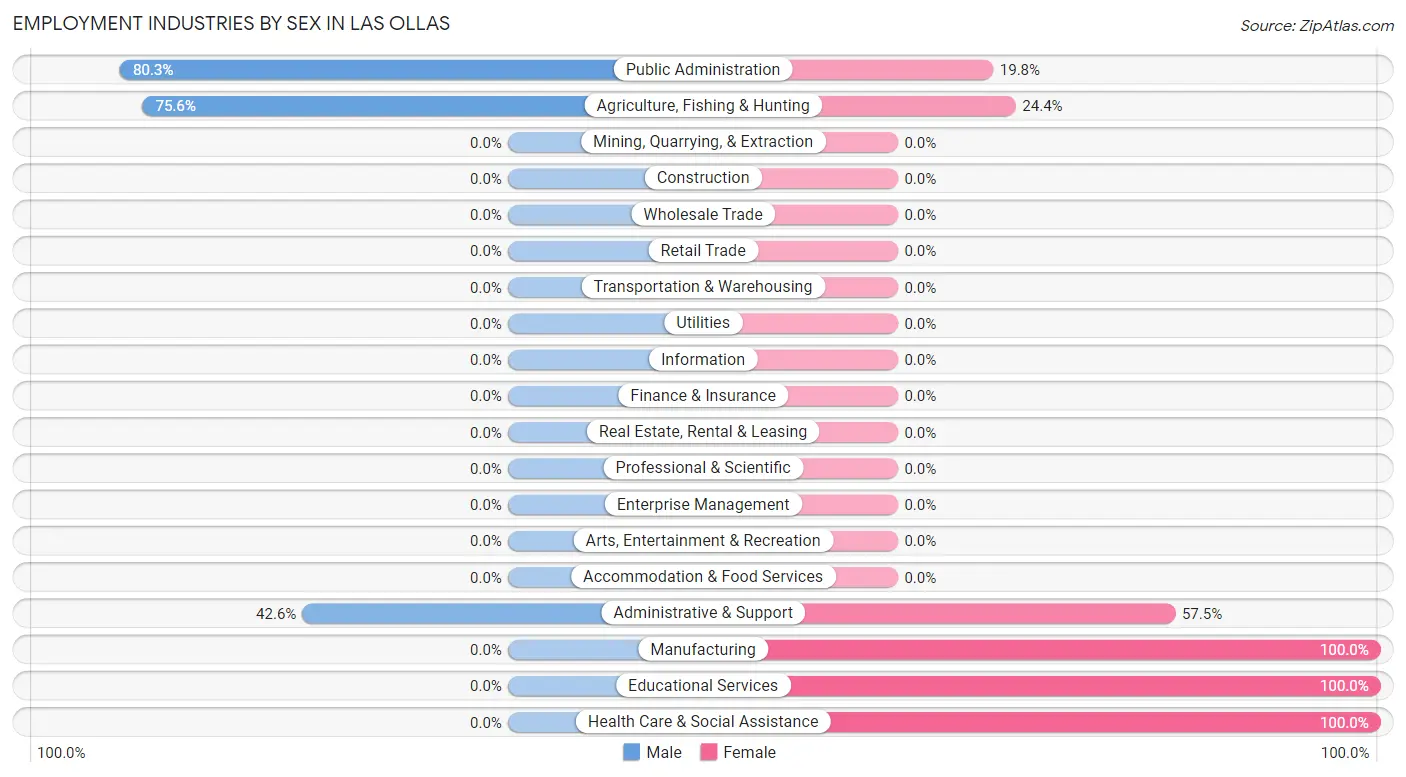
| Industry | Male | Female |
| Agriculture, Fishing & Hunting | 65 (75.6%) | 21 (24.4%) |
| Mining, Quarrying, & Extraction | 0 (0.0%) | 0 (0.0%) |
| Construction | 0 (0.0%) | 0 (0.0%) |
| Manufacturing | 0 (0.0%) | 31 (100.0%) |
| Wholesale Trade | 0 (0.0%) | 0 (0.0%) |
| Retail Trade | 0 (0.0%) | 0 (0.0%) |
| Transportation & Warehousing | 0 (0.0%) | 0 (0.0%) |
| Utilities | 0 (0.0%) | 0 (0.0%) |
| Information | 0 (0.0%) | 0 (0.0%) |
| Finance & Insurance | 0 (0.0%) | 0 (0.0%) |
| Real Estate, Rental & Leasing | 0 (0.0%) | 0 (0.0%) |
| Professional & Scientific | 0 (0.0%) | 0 (0.0%) |
| Enterprise Management | 0 (0.0%) | 0 (0.0%) |
| Administrative & Support | 20 (42.5%) | 27 (57.5%) |
| Educational Services | 0 (0.0%) | 19 (100.0%) |
| Health Care & Social Assistance | 0 (0.0%) | 23 (100.0%) |
| Arts, Entertainment & Recreation | 0 (0.0%) | 0 (0.0%) |
| Accommodation & Food Services | 0 (0.0%) | 0 (0.0%) |
| Public Administration | 65 (80.2%) | 16 (19.8%) |
| Total | 150 (47.8%) | 164 (52.2%) |
Education in Las Ollas
School Enrollment in Las Ollas
The most common levels of schooling among the 163 students in Las Ollas are high school (74 | 45.4%), elementary school (46 | 28.2%), and middle school (23 | 14.1%).
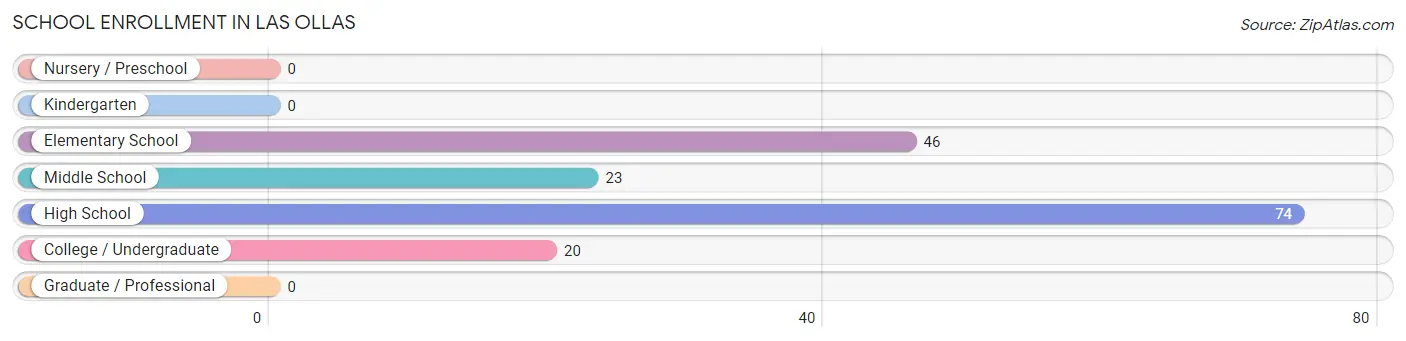
| School Level | # Students | % Students |
| Nursery / Preschool | 0 | 0.0% |
| Kindergarten | 0 | 0.0% |
| Elementary School | 46 | 28.2% |
| Middle School | 23 | 14.1% |
| High School | 74 | 45.4% |
| College / Undergraduate | 20 | 12.3% |
| Graduate / Professional | 0 | 0.0% |
| Total | 163 | 100.0% |
School Enrollment by Age by Funding Source in Las Ollas
Out of a total of 163 students who are enrolled in schools in Las Ollas, 20 (12.3%) attend a private institution, while the remaining 143 (87.7%) are enrolled in public schools. The age group of 18 to 19 year olds has the highest likelihood of being enrolled in private schools, with 20 (54.0% in the age bracket) enrolled. Conversely, the age group of 5 to 9 year old has the lowest likelihood of being enrolled in a private school, with 46 (100.0% in the age bracket) attending a public institution.
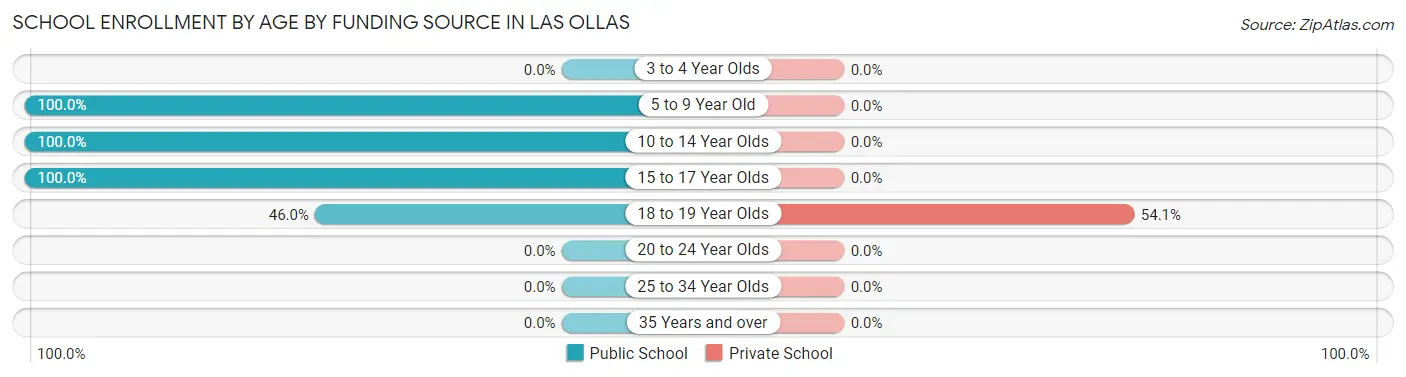
| Age Bracket | Public School | Private School |
| 3 to 4 Year Olds | 0 (0.0%) | 0 (0.0%) |
| 5 to 9 Year Old | 46 (100.0%) | 0 (0.0%) |
| 10 to 14 Year Olds | 23 (100.0%) | 0 (0.0%) |
| 15 to 17 Year Olds | 57 (100.0%) | 0 (0.0%) |
| 18 to 19 Year Olds | 17 (46.0%) | 20 (54.0%) |
| 20 to 24 Year Olds | 0 (0.0%) | 0 (0.0%) |
| 25 to 34 Year Olds | 0 (0.0%) | 0 (0.0%) |
| 35 Years and over | 0 (0.0%) | 0 (0.0%) |
| Total | 143 (87.7%) | 20 (12.3%) |
Educational Attainment by Field of Study in Las Ollas
Bio, nature & agricultural (31 | 29.8%), business (27 | 26.0%), science & technology (23 | 22.1%), and education (23 | 22.1%) are the most common fields of study among 104 individuals in Las Ollas who have obtained a bachelor's degree or higher.
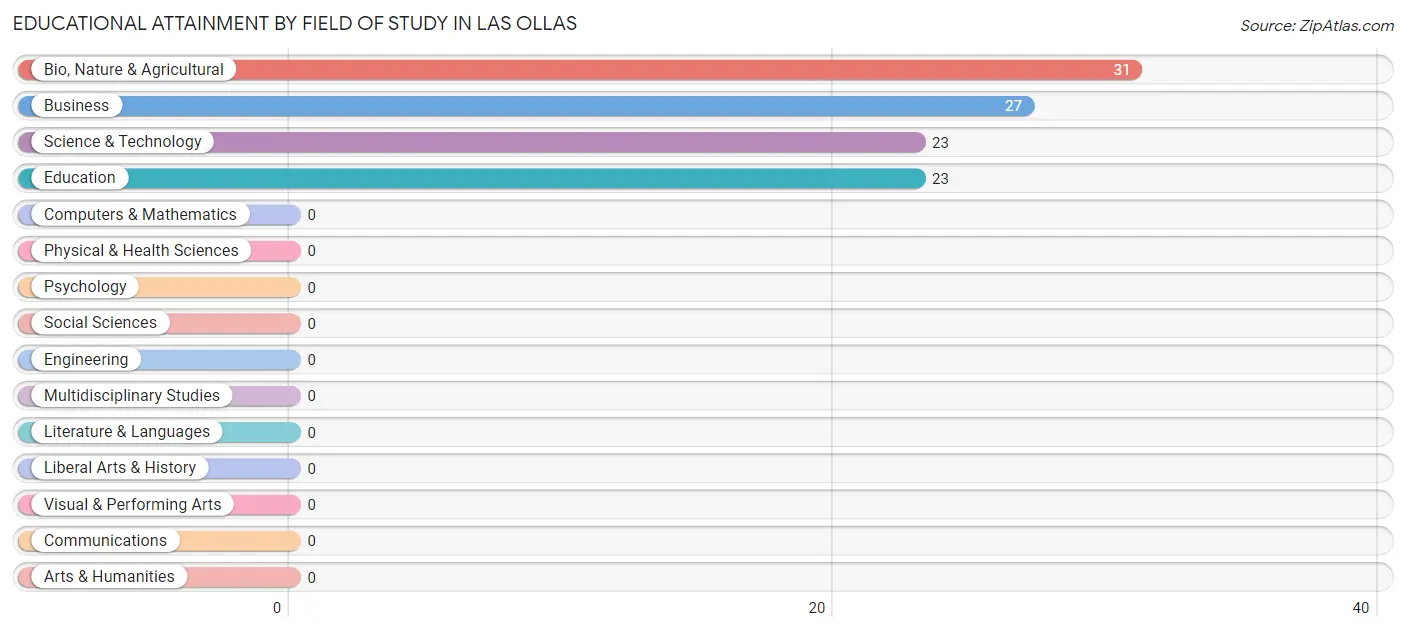
| Field of Study | # Graduates | % Graduates |
| Computers & Mathematics | 0 | 0.0% |
| Bio, Nature & Agricultural | 31 | 29.8% |
| Physical & Health Sciences | 0 | 0.0% |
| Psychology | 0 | 0.0% |
| Social Sciences | 0 | 0.0% |
| Engineering | 0 | 0.0% |
| Multidisciplinary Studies | 0 | 0.0% |
| Science & Technology | 23 | 22.1% |
| Business | 27 | 26.0% |
| Education | 23 | 22.1% |
| Literature & Languages | 0 | 0.0% |
| Liberal Arts & History | 0 | 0.0% |
| Visual & Performing Arts | 0 | 0.0% |
| Communications | 0 | 0.0% |
| Arts & Humanities | 0 | 0.0% |
| Total | 104 | 100.0% |
Transportation & Commute in Las Ollas
Vehicle Availability by Sex in Las Ollas
The most prevalent vehicle ownership categories in Las Ollas are males with 2 vehicles (66, accounting for 44.0%) and females with 2 vehicles (73, making up 40.2%).
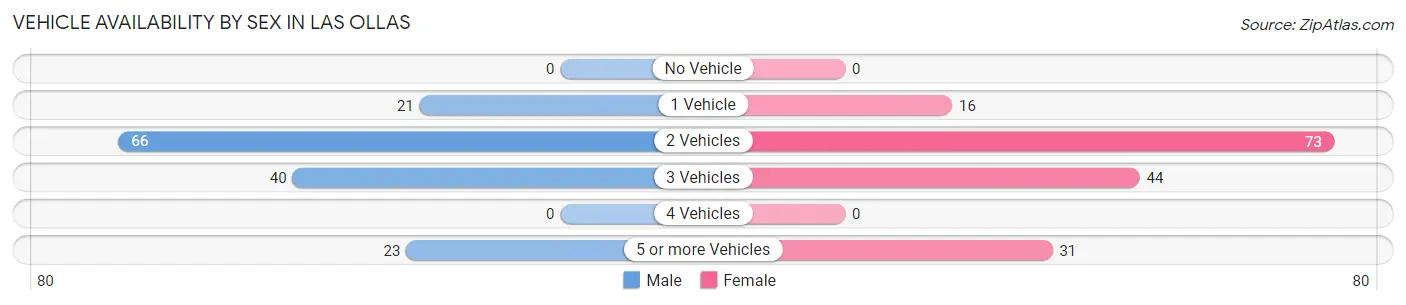
| Vehicles Available | Male | Female |
| No Vehicle | 0 (0.0%) | 0 (0.0%) |
| 1 Vehicle | 21 (14.0%) | 16 (9.8%) |
| 2 Vehicles | 66 (44.0%) | 73 (44.5%) |
| 3 Vehicles | 40 (26.7%) | 44 (26.8%) |
| 4 Vehicles | 0 (0.0%) | 0 (0.0%) |
| 5 or more Vehicles | 23 (15.3%) | 31 (18.9%) |
| Total | 150 (100.0%) | 164 (100.0%) |
Commute Time in Las Ollas
The most frequently occuring commute durations in Las Ollas are 15 to 19 minutes (82 commuters, 28.2%), 10 to 14 minutes (46 commuters, 15.8%), and 30 to 34 minutes (46 commuters, 15.8%).
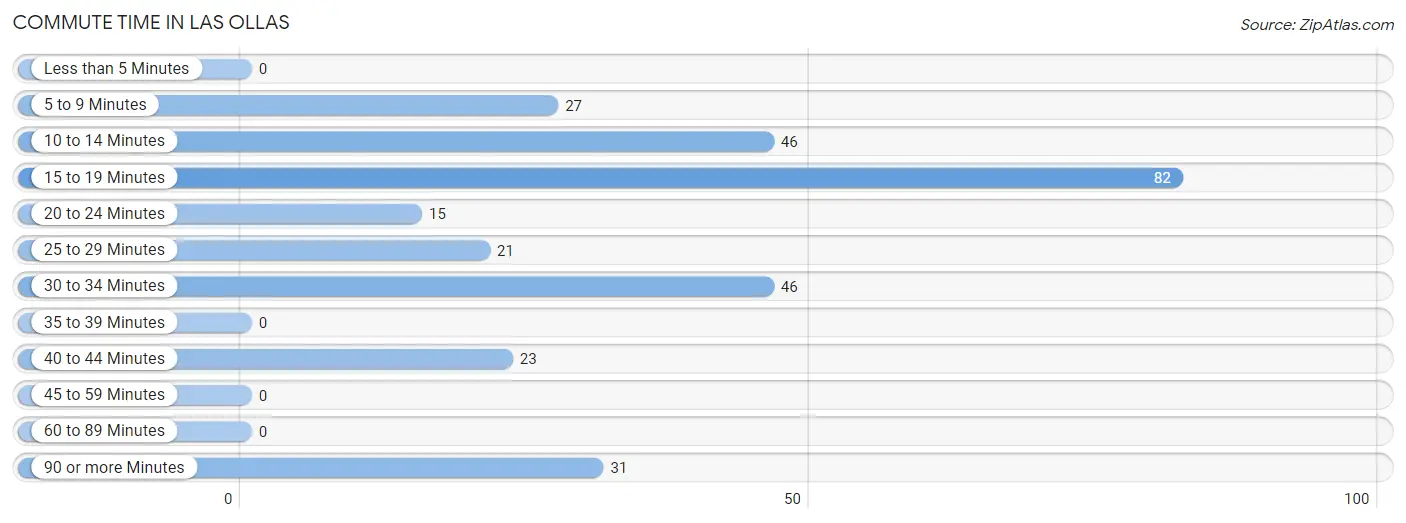
| Commute Time | # Commuters | % Commuters |
| Less than 5 Minutes | 0 | 0.0% |
| 5 to 9 Minutes | 27 | 9.3% |
| 10 to 14 Minutes | 46 | 15.8% |
| 15 to 19 Minutes | 82 | 28.2% |
| 20 to 24 Minutes | 15 | 5.1% |
| 25 to 29 Minutes | 21 | 7.2% |
| 30 to 34 Minutes | 46 | 15.8% |
| 35 to 39 Minutes | 0 | 0.0% |
| 40 to 44 Minutes | 23 | 7.9% |
| 45 to 59 Minutes | 0 | 0.0% |
| 60 to 89 Minutes | 0 | 0.0% |
| 90 or more Minutes | 31 | 10.6% |
Commute Time by Sex in Las Ollas
The most common commute times in Las Ollas are 10 to 14 minutes (46 commuters, 36.2%) for males and 15 to 19 minutes (43 commuters, 26.2%) for females.
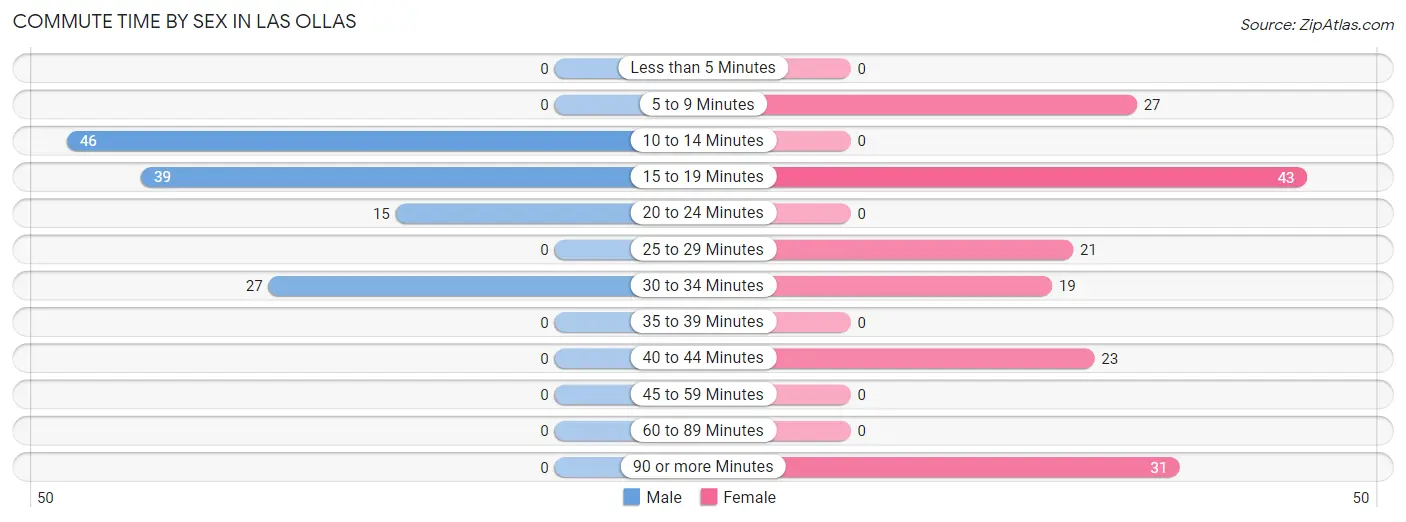
| Commute Time | Male | Female |
| Less than 5 Minutes | 0 (0.0%) | 0 (0.0%) |
| 5 to 9 Minutes | 0 (0.0%) | 27 (16.5%) |
| 10 to 14 Minutes | 46 (36.2%) | 0 (0.0%) |
| 15 to 19 Minutes | 39 (30.7%) | 43 (26.2%) |
| 20 to 24 Minutes | 15 (11.8%) | 0 (0.0%) |
| 25 to 29 Minutes | 0 (0.0%) | 21 (12.8%) |
| 30 to 34 Minutes | 27 (21.3%) | 19 (11.6%) |
| 35 to 39 Minutes | 0 (0.0%) | 0 (0.0%) |
| 40 to 44 Minutes | 0 (0.0%) | 23 (14.0%) |
| 45 to 59 Minutes | 0 (0.0%) | 0 (0.0%) |
| 60 to 89 Minutes | 0 (0.0%) | 0 (0.0%) |
| 90 or more Minutes | 0 (0.0%) | 31 (18.9%) |
Time of Departure to Work by Sex in Las Ollas
The most frequent times of departure to work in Las Ollas are 6:00 AM to 6:29 AM (67, 52.8%) for males and 6:30 AM to 6:59 AM (63, 38.4%) for females.
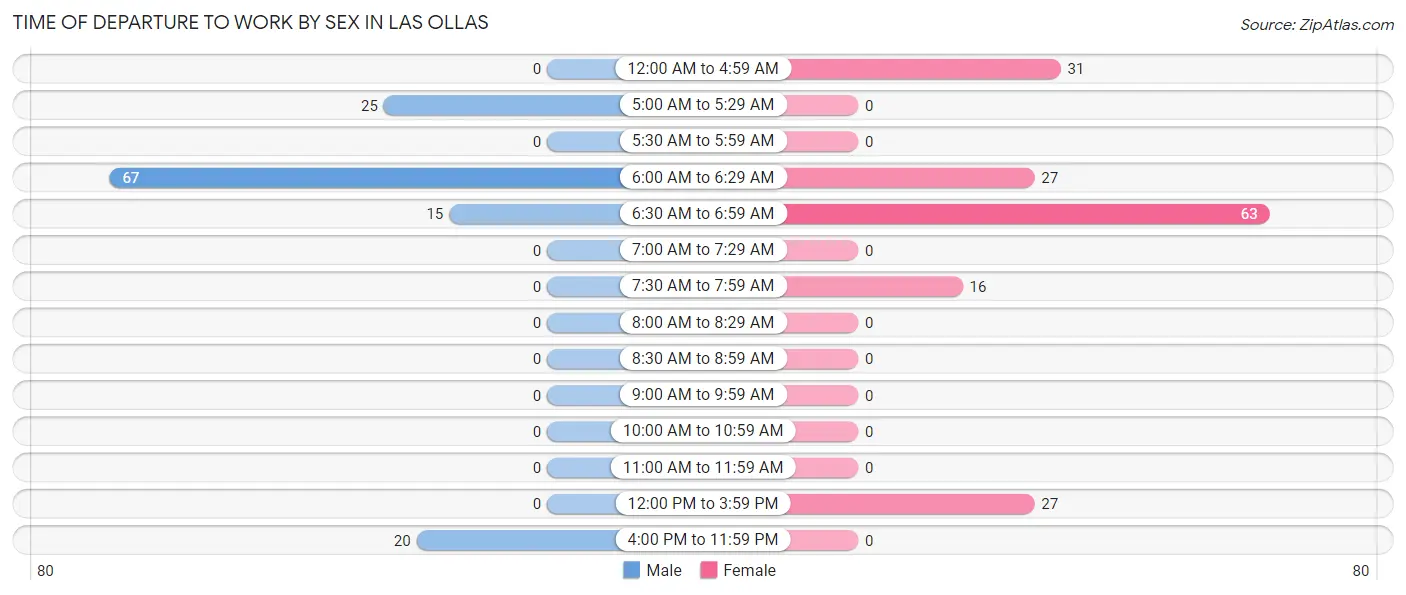
| Time of Departure | Male | Female |
| 12:00 AM to 4:59 AM | 0 (0.0%) | 31 (18.9%) |
| 5:00 AM to 5:29 AM | 25 (19.7%) | 0 (0.0%) |
| 5:30 AM to 5:59 AM | 0 (0.0%) | 0 (0.0%) |
| 6:00 AM to 6:29 AM | 67 (52.8%) | 27 (16.5%) |
| 6:30 AM to 6:59 AM | 15 (11.8%) | 63 (38.4%) |
| 7:00 AM to 7:29 AM | 0 (0.0%) | 0 (0.0%) |
| 7:30 AM to 7:59 AM | 0 (0.0%) | 16 (9.8%) |
| 8:00 AM to 8:29 AM | 0 (0.0%) | 0 (0.0%) |
| 8:30 AM to 8:59 AM | 0 (0.0%) | 0 (0.0%) |
| 9:00 AM to 9:59 AM | 0 (0.0%) | 0 (0.0%) |
| 10:00 AM to 10:59 AM | 0 (0.0%) | 0 (0.0%) |
| 11:00 AM to 11:59 AM | 0 (0.0%) | 0 (0.0%) |
| 12:00 PM to 3:59 PM | 0 (0.0%) | 27 (16.5%) |
| 4:00 PM to 11:59 PM | 20 (15.8%) | 0 (0.0%) |
| Total | 127 (100.0%) | 164 (100.0%) |
Housing Occupancy in Las Ollas
Occupancy by Ownership in Las Ollas
Of the total 409 dwellings in Las Ollas, owner-occupied units account for 302 (73.8%), while renter-occupied units make up 107 (26.2%).
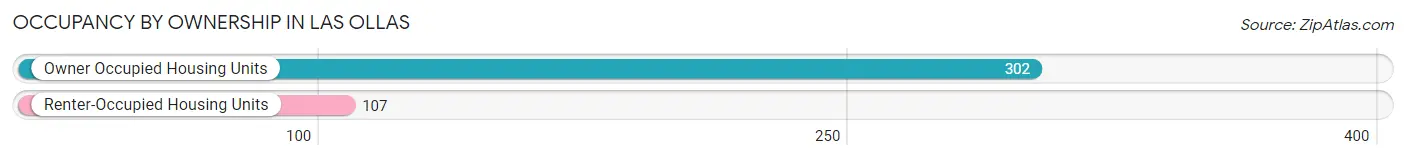
| Occupancy | # Housing Units | % Housing Units |
| Owner Occupied Housing Units | 302 | 73.8% |
| Renter-Occupied Housing Units | 107 | 26.2% |
| Total Occupied Housing Units | 409 | 100.0% |
Occupancy by Household Size in Las Ollas
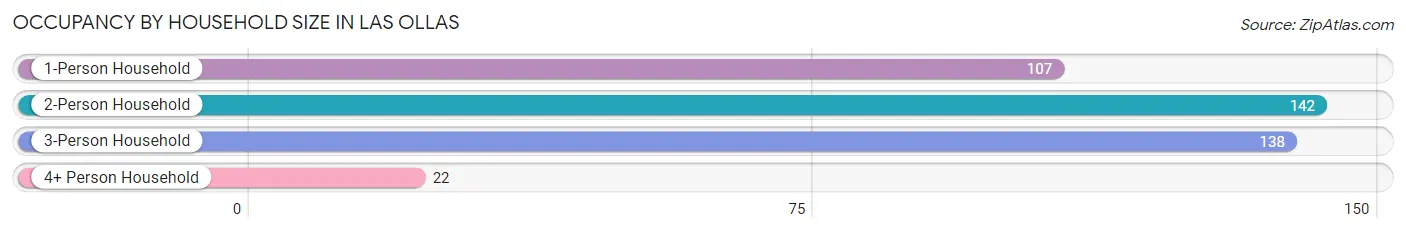
| Household Size | # Housing Units | % Housing Units |
| 1-Person Household | 107 | 26.2% |
| 2-Person Household | 142 | 34.7% |
| 3-Person Household | 138 | 33.7% |
| 4+ Person Household | 22 | 5.4% |
| Total Housing Units | 409 | 100.0% |
Occupancy by Ownership by Household Size in Las Ollas
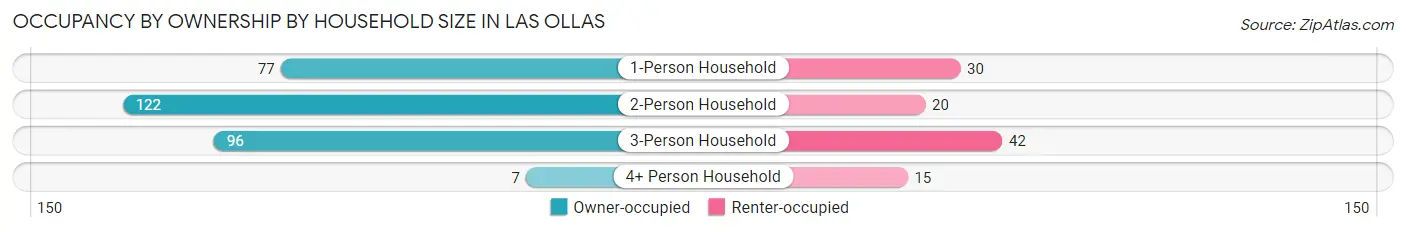
| Household Size | Owner-occupied | Renter-occupied |
| 1-Person Household | 77 (72.0%) | 30 (28.0%) |
| 2-Person Household | 122 (85.9%) | 20 (14.1%) |
| 3-Person Household | 96 (69.6%) | 42 (30.4%) |
| 4+ Person Household | 7 (31.8%) | 15 (68.2%) |
| Total Housing Units | 302 (73.8%) | 107 (26.2%) |
Occupancy by Educational Attainment in Las Ollas
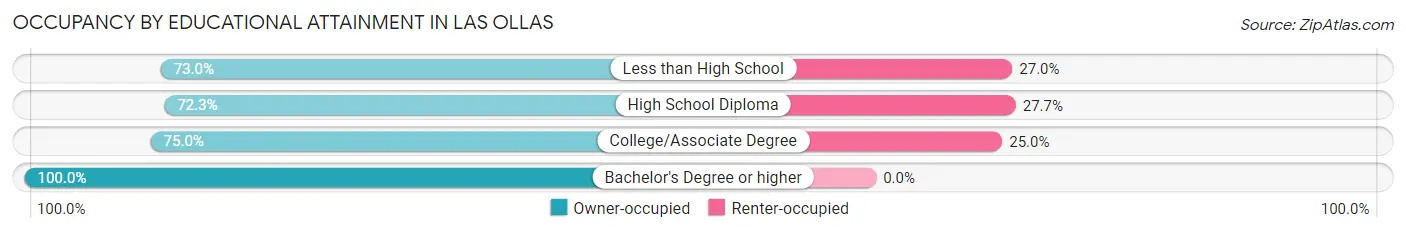
| Household Size | Owner-occupied | Renter-occupied |
| Less than High School | 146 (73.0%) | 54 (27.0%) |
| High School Diploma | 94 (72.3%) | 36 (27.7%) |
| College/Associate Degree | 51 (75.0%) | 17 (25.0%) |
| Bachelor's Degree or higher | 11 (100.0%) | 0 (0.0%) |
Occupancy by Age of Householder in Las Ollas
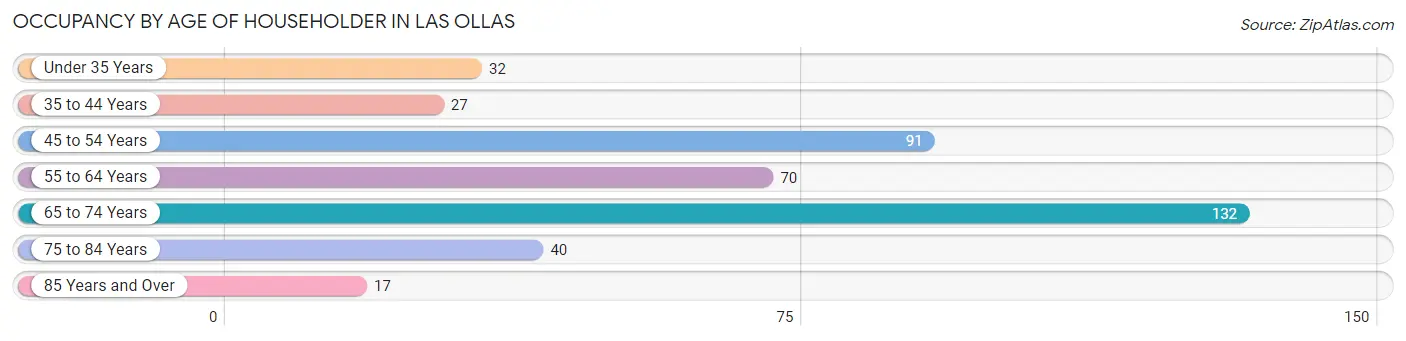
| Age Bracket | # Households | % Households |
| Under 35 Years | 32 | 7.8% |
| 35 to 44 Years | 27 | 6.6% |
| 45 to 54 Years | 91 | 22.3% |
| 55 to 64 Years | 70 | 17.1% |
| 65 to 74 Years | 132 | 32.3% |
| 75 to 84 Years | 40 | 9.8% |
| 85 Years and Over | 17 | 4.2% |
| Total | 409 | 100.0% |
Housing Finances in Las Ollas
Median Income by Occupancy in Las Ollas
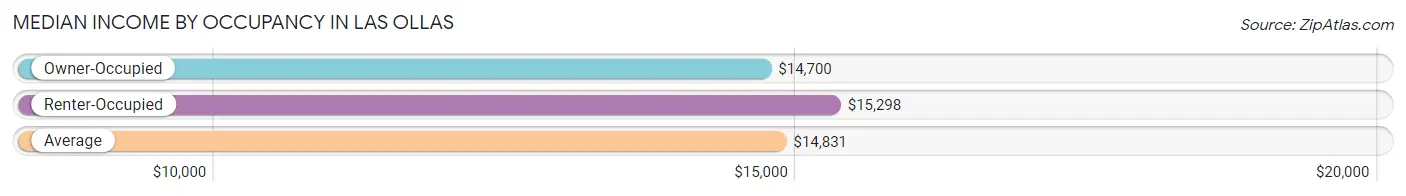
| Occupancy Type | # Households | Median Income |
| Owner-Occupied | 302 (73.8%) | $14,700 |
| Renter-Occupied | 107 (26.2%) | $15,298 |
| Average | 409 (100.0%) | $14,831 |
Occupancy by Householder Income Bracket in Las Ollas
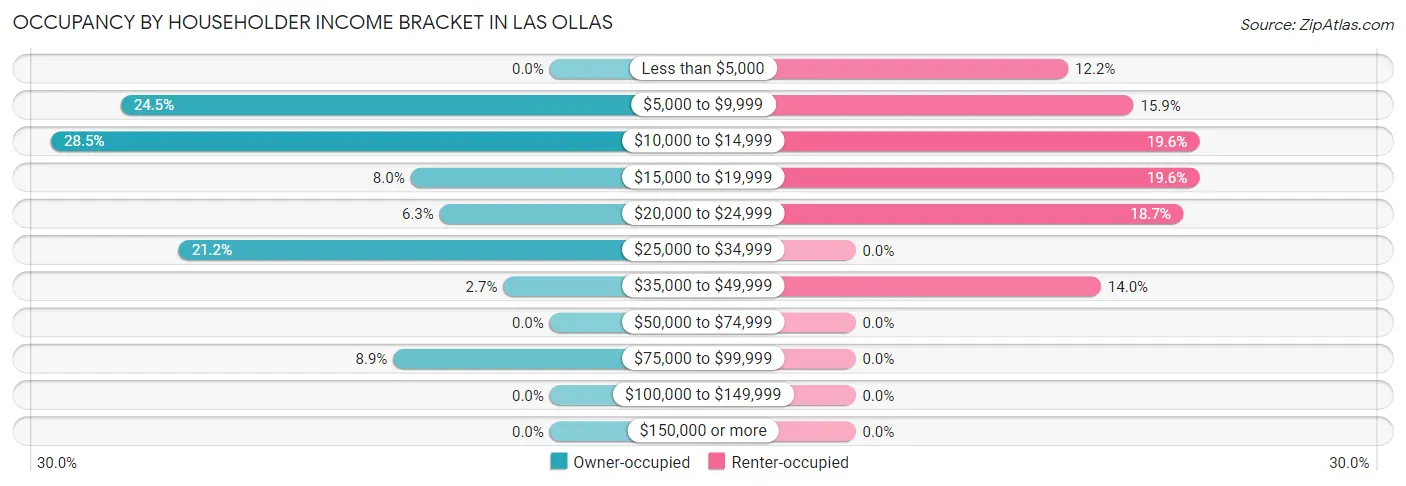
| Income Bracket | Owner-occupied | Renter-occupied |
| Less than $5,000 | 0 (0.0%) | 13 (12.1%) |
| $5,000 to $9,999 | 74 (24.5%) | 17 (15.9%) |
| $10,000 to $14,999 | 86 (28.5%) | 21 (19.6%) |
| $15,000 to $19,999 | 24 (8.0%) | 21 (19.6%) |
| $20,000 to $24,999 | 19 (6.3%) | 20 (18.7%) |
| $25,000 to $34,999 | 64 (21.2%) | 0 (0.0%) |
| $35,000 to $49,999 | 8 (2.6%) | 15 (14.0%) |
| $50,000 to $74,999 | 0 (0.0%) | 0 (0.0%) |
| $75,000 to $99,999 | 27 (8.9%) | 0 (0.0%) |
| $100,000 to $149,999 | 0 (0.0%) | 0 (0.0%) |
| $150,000 or more | 0 (0.0%) | 0 (0.0%) |
| Total | 302 (100.0%) | 107 (100.0%) |
Monthly Housing Cost Tiers in Las Ollas
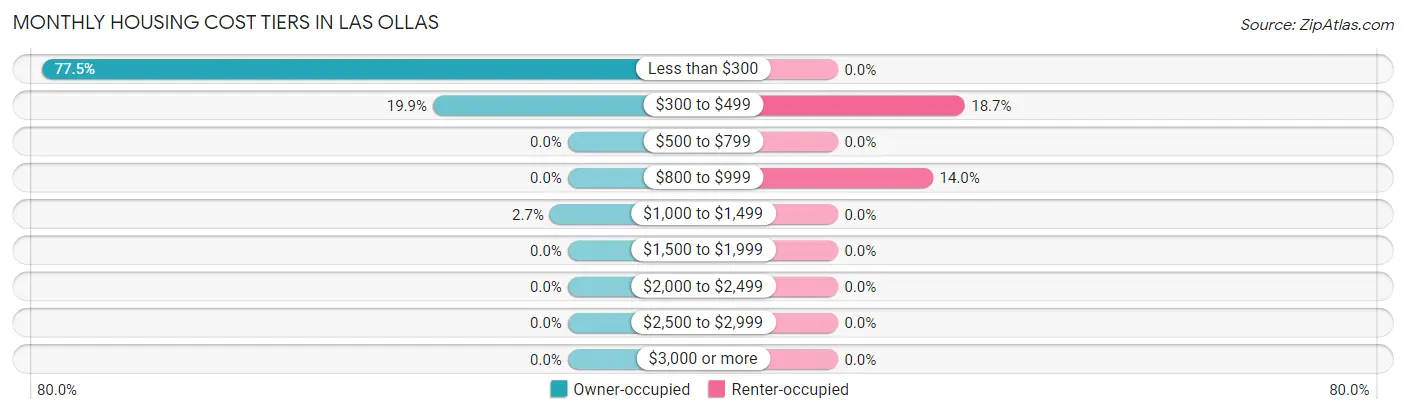
| Monthly Cost | Owner-occupied | Renter-occupied |
| Less than $300 | 234 (77.5%) | 0 (0.0%) |
| $300 to $499 | 60 (19.9%) | 20 (18.7%) |
| $500 to $799 | 0 (0.0%) | 0 (0.0%) |
| $800 to $999 | 0 (0.0%) | 15 (14.0%) |
| $1,000 to $1,499 | 8 (2.6%) | 0 (0.0%) |
| $1,500 to $1,999 | 0 (0.0%) | 0 (0.0%) |
| $2,000 to $2,499 | 0 (0.0%) | 0 (0.0%) |
| $2,500 to $2,999 | 0 (0.0%) | 0 (0.0%) |
| $3,000 or more | 0 (0.0%) | 0 (0.0%) |
| Total | 302 (100.0%) | 107 (100.0%) |
Physical Housing Characteristics in Las Ollas
Housing Structures in Las Ollas
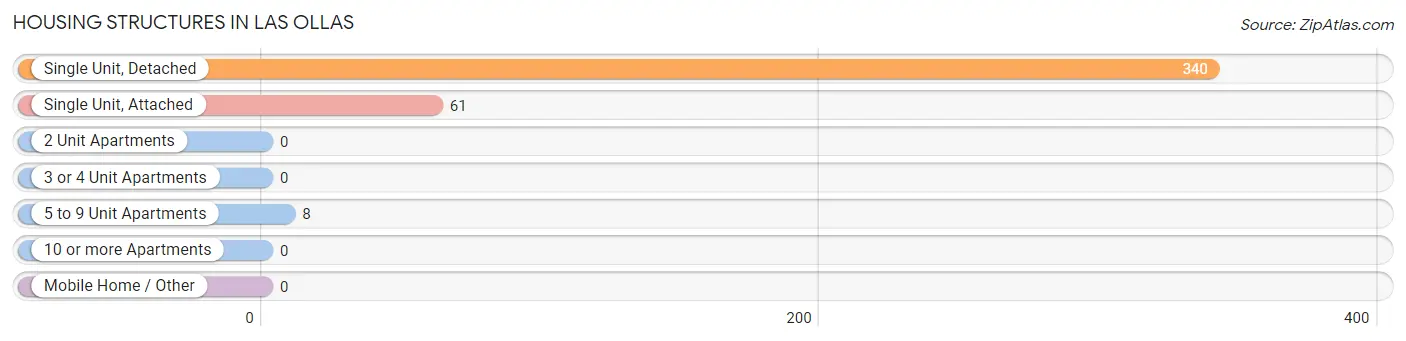
| Structure Type | # Housing Units | % Housing Units |
| Single Unit, Detached | 340 | 83.1% |
| Single Unit, Attached | 61 | 14.9% |
| 2 Unit Apartments | 0 | 0.0% |
| 3 or 4 Unit Apartments | 0 | 0.0% |
| 5 to 9 Unit Apartments | 8 | 2.0% |
| 10 or more Apartments | 0 | 0.0% |
| Mobile Home / Other | 0 | 0.0% |
| Total | 409 | 100.0% |
Housing Structures by Occupancy in Las Ollas
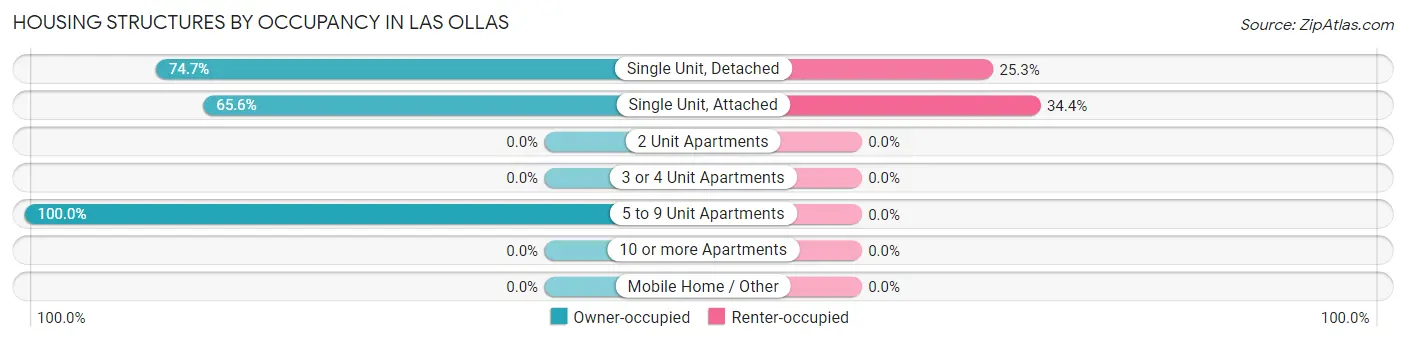
| Structure Type | Owner-occupied | Renter-occupied |
| Single Unit, Detached | 254 (74.7%) | 86 (25.3%) |
| Single Unit, Attached | 40 (65.6%) | 21 (34.4%) |
| 2 Unit Apartments | 0 (0.0%) | 0 (0.0%) |
| 3 or 4 Unit Apartments | 0 (0.0%) | 0 (0.0%) |
| 5 to 9 Unit Apartments | 8 (100.0%) | 0 (0.0%) |
| 10 or more Apartments | 0 (0.0%) | 0 (0.0%) |
| Mobile Home / Other | 0 (0.0%) | 0 (0.0%) |
| Total | 302 (73.8%) | 107 (26.2%) |
Housing Structures by Number of Rooms in Las Ollas
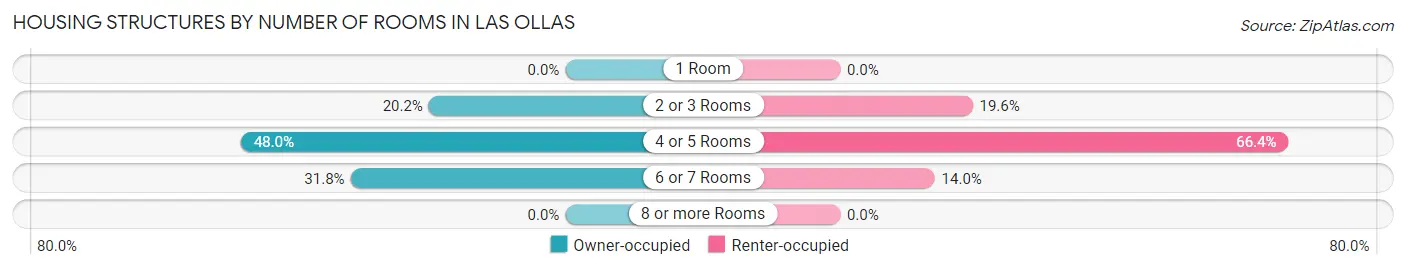
| Number of Rooms | Owner-occupied | Renter-occupied |
| 1 Room | 0 (0.0%) | 0 (0.0%) |
| 2 or 3 Rooms | 61 (20.2%) | 21 (19.6%) |
| 4 or 5 Rooms | 145 (48.0%) | 71 (66.4%) |
| 6 or 7 Rooms | 96 (31.8%) | 15 (14.0%) |
| 8 or more Rooms | 0 (0.0%) | 0 (0.0%) |
| Total | 302 (100.0%) | 107 (100.0%) |
Housing Structure by Heating Type in Las Ollas
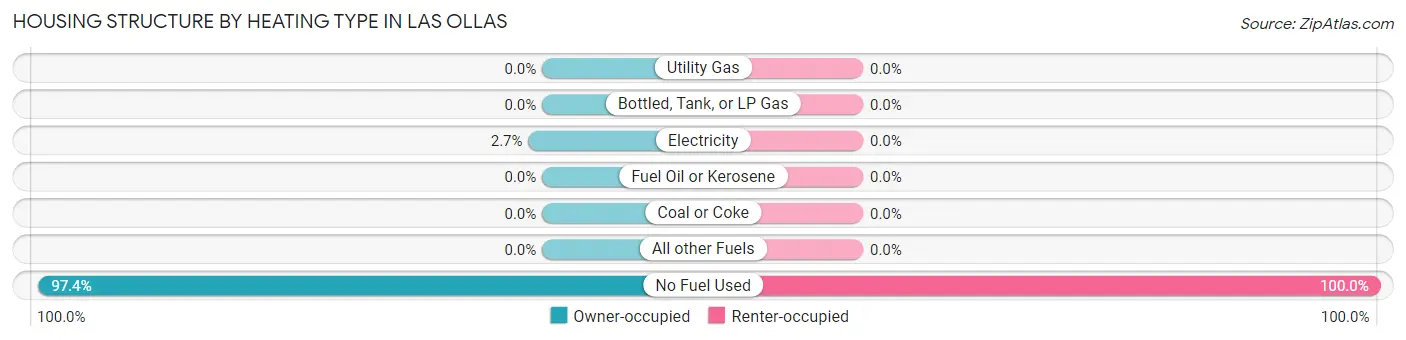
| Heating Type | Owner-occupied | Renter-occupied |
| Utility Gas | 0 (0.0%) | 0 (0.0%) |
| Bottled, Tank, or LP Gas | 0 (0.0%) | 0 (0.0%) |
| Electricity | 8 (2.6%) | 0 (0.0%) |
| Fuel Oil or Kerosene | 0 (0.0%) | 0 (0.0%) |
| Coal or Coke | 0 (0.0%) | 0 (0.0%) |
| All other Fuels | 0 (0.0%) | 0 (0.0%) |
| No Fuel Used | 294 (97.4%) | 107 (100.0%) |
| Total | 302 (100.0%) | 107 (100.0%) |
Household Vehicle Usage in Las Ollas
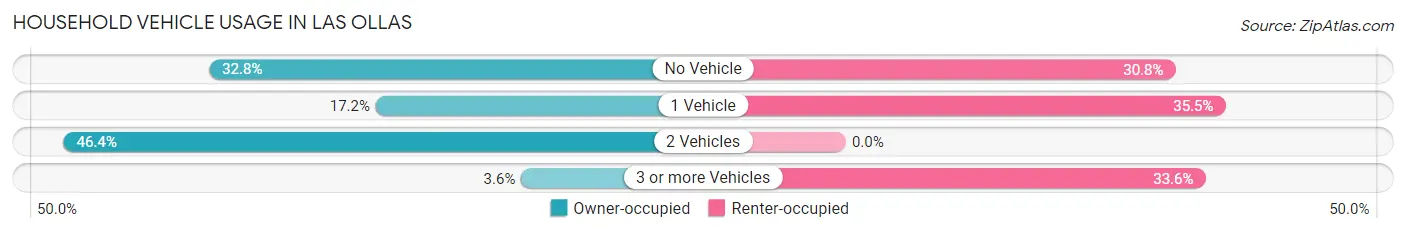
| Vehicles per Household | Owner-occupied | Renter-occupied |
| No Vehicle | 99 (32.8%) | 33 (30.8%) |
| 1 Vehicle | 52 (17.2%) | 38 (35.5%) |
| 2 Vehicles | 140 (46.4%) | 0 (0.0%) |
| 3 or more Vehicles | 11 (3.6%) | 36 (33.6%) |
| Total | 302 (100.0%) | 107 (100.0%) |
Real Estate & Mortgages in Las Ollas
Real Estate and Mortgage Overview in Las Ollas
| Characteristic | Without Mortgage | With Mortgage |
| Housing Units | 294 | 8 |
| Median Property Value | $71,600 | $0 |
| Median Household Income | $14,567 | $0 |
| Monthly Housing Costs | $150 | $0 |
| Real Estate Taxes | - | - |
Property Value by Mortgage Status in Las Ollas
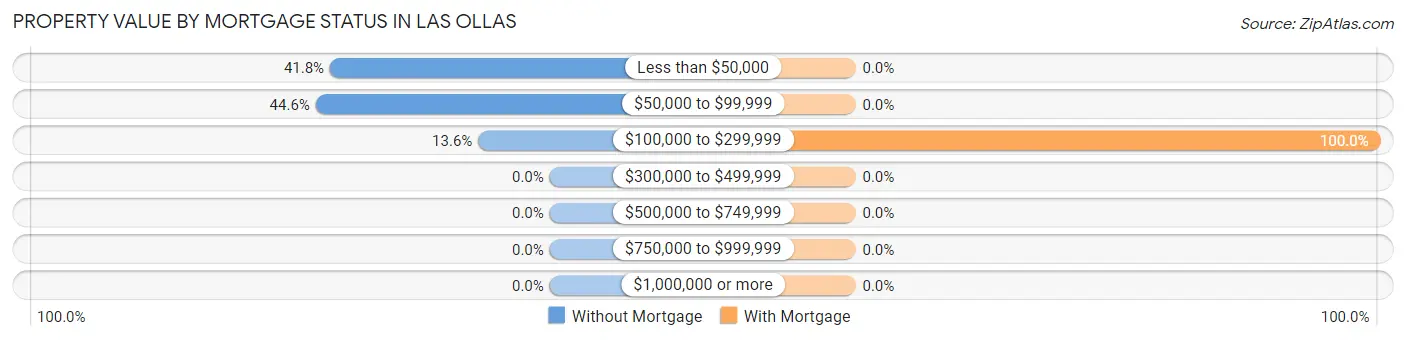
| Property Value | Without Mortgage | With Mortgage |
| Less than $50,000 | 123 (41.8%) | 0 (0.0%) |
| $50,000 to $99,999 | 131 (44.6%) | 0 (0.0%) |
| $100,000 to $299,999 | 40 (13.6%) | 8 (100.0%) |
| $300,000 to $499,999 | 0 (0.0%) | 0 (0.0%) |
| $500,000 to $749,999 | 0 (0.0%) | 0 (0.0%) |
| $750,000 to $999,999 | 0 (0.0%) | 0 (0.0%) |
| $1,000,000 or more | 0 (0.0%) | 0 (0.0%) |
| Total | 294 (100.0%) | 8 (100.0%) |
Household Income by Mortgage Status in Las Ollas
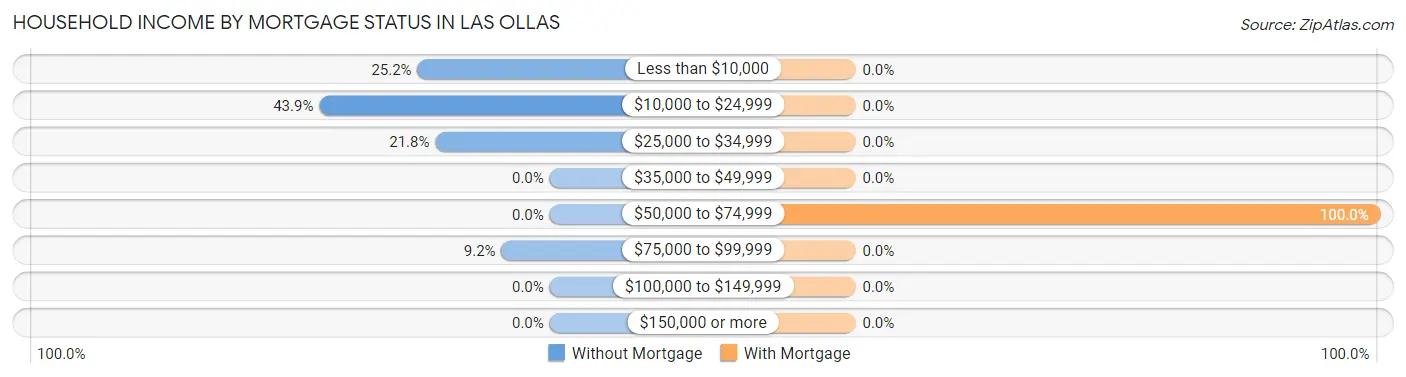
| Household Income | Without Mortgage | With Mortgage |
| Less than $10,000 | 74 (25.2%) | 0 (0.0%) |
| $10,000 to $24,999 | 129 (43.9%) | 0 (0.0%) |
| $25,000 to $34,999 | 64 (21.8%) | 0 (0.0%) |
| $35,000 to $49,999 | 0 (0.0%) | 0 (0.0%) |
| $50,000 to $74,999 | 0 (0.0%) | 8 (100.0%) |
| $75,000 to $99,999 | 27 (9.2%) | 0 (0.0%) |
| $100,000 to $149,999 | 0 (0.0%) | 0 (0.0%) |
| $150,000 or more | 0 (0.0%) | 0 (0.0%) |
| Total | 294 (100.0%) | 8 (100.0%) |
Property Value to Household Income Ratio in Las Ollas
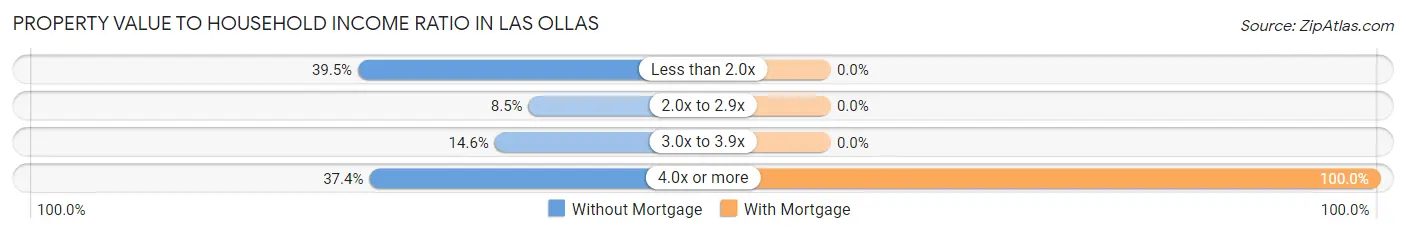
| Value-to-Income Ratio | Without Mortgage | With Mortgage |
| Less than 2.0x | 116 (39.5%) | 0 (0.0%) |
| 2.0x to 2.9x | 25 (8.5%) | 0 (0.0%) |
| 3.0x to 3.9x | 43 (14.6%) | 0 (0.0%) |
| 4.0x or more | 110 (37.4%) | 8 (100.0%) |
| Total | 294 (100.0%) | 8 (100.0%) |
Real Estate Taxes by Mortgage Status in Las Ollas
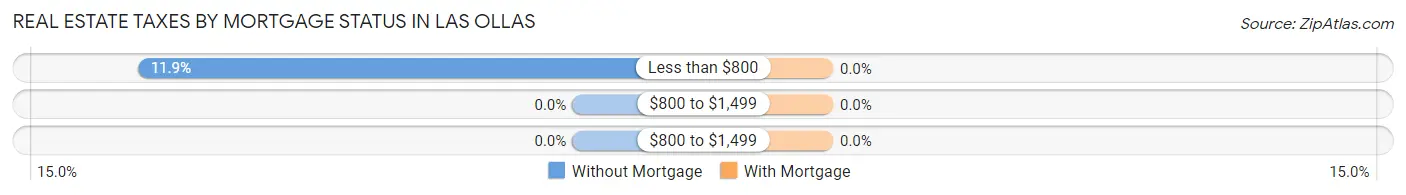
| Property Taxes | Without Mortgage | With Mortgage |
| Less than $800 | 35 (11.9%) | 0 (0.0%) |
| $800 to $1,499 | 0 (0.0%) | 0 (0.0%) |
| $800 to $1,499 | 0 (0.0%) | 0 (0.0%) |
| Total | 294 (100.0%) | 8 (100.0%) |
Health & Disability in Las Ollas
Health Insurance Coverage by Age in Las Ollas
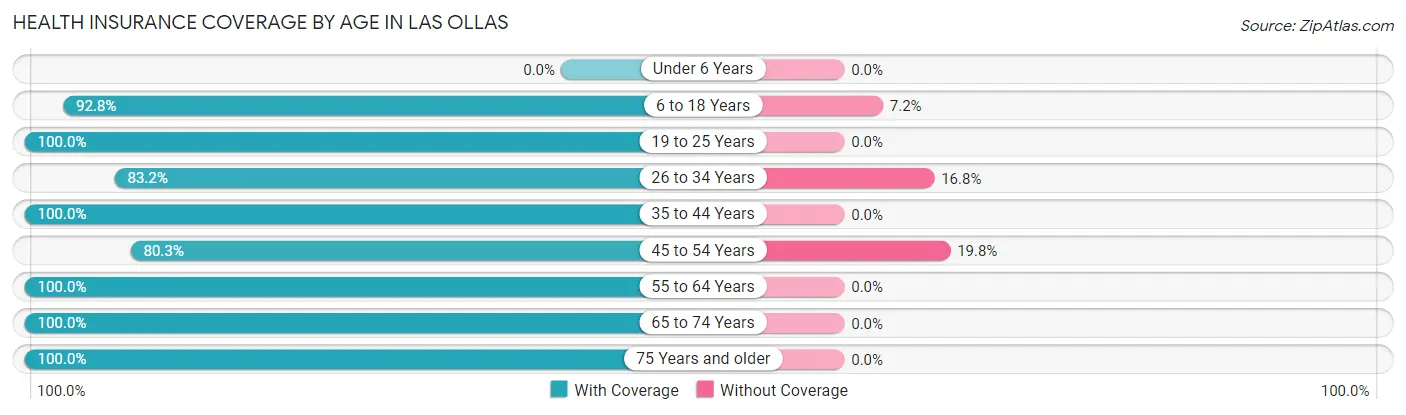
| Age Bracket | With Coverage | Without Coverage |
| Under 6 Years | 0 (0.0%) | 0 (0.0%) |
| 6 to 18 Years | 142 (92.8%) | 11 (7.2%) |
| 19 to 25 Years | 67 (100.0%) | 0 (0.0%) |
| 26 to 34 Years | 134 (83.2%) | 27 (16.8%) |
| 35 to 44 Years | 71 (100.0%) | 0 (0.0%) |
| 45 to 54 Years | 126 (80.2%) | 31 (19.8%) |
| 55 to 64 Years | 105 (100.0%) | 0 (0.0%) |
| 65 to 74 Years | 169 (100.0%) | 0 (0.0%) |
| 75 Years and older | 101 (100.0%) | 0 (0.0%) |
| Total | 915 (93.0%) | 69 (7.0%) |
Health Insurance Coverage by Citizenship Status in Las Ollas
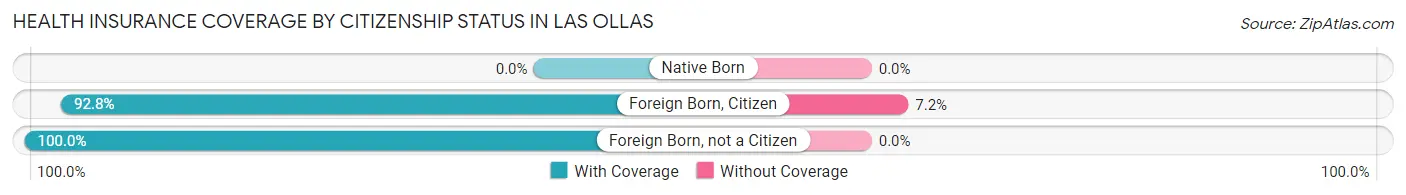
| Citizenship Status | With Coverage | Without Coverage |
| Native Born | 0 (0.0%) | 0 (0.0%) |
| Foreign Born, Citizen | 142 (92.8%) | 11 (7.2%) |
| Foreign Born, not a Citizen | 67 (100.0%) | 0 (0.0%) |
Health Insurance Coverage by Household Income in Las Ollas
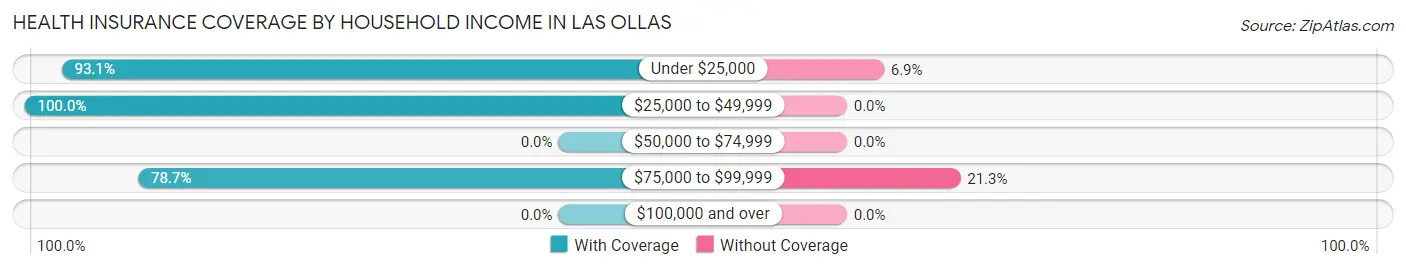
| Household Income | With Coverage | Without Coverage |
| Under $25,000 | 564 (93.1%) | 42 (6.9%) |
| $25,000 to $49,999 | 251 (100.0%) | 0 (0.0%) |
| $50,000 to $74,999 | 0 (0.0%) | 0 (0.0%) |
| $75,000 to $99,999 | 100 (78.7%) | 27 (21.3%) |
| $100,000 and over | 0 (0.0%) | 0 (0.0%) |
Public vs Private Health Insurance Coverage by Age in Las Ollas
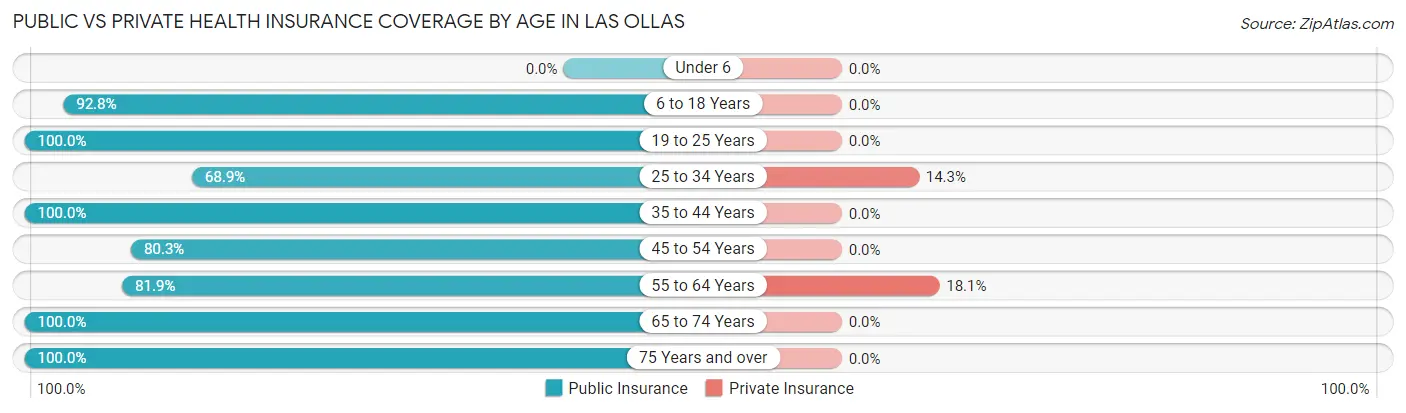
| Age Bracket | Public Insurance | Private Insurance |
| Under 6 | 0 (0.0%) | 0 (0.0%) |
| 6 to 18 Years | 142 (92.8%) | 0 (0.0%) |
| 19 to 25 Years | 67 (100.0%) | 0 (0.0%) |
| 25 to 34 Years | 111 (68.9%) | 23 (14.3%) |
| 35 to 44 Years | 71 (100.0%) | 0 (0.0%) |
| 45 to 54 Years | 126 (80.2%) | 0 (0.0%) |
| 55 to 64 Years | 86 (81.9%) | 19 (18.1%) |
| 65 to 74 Years | 169 (100.0%) | 0 (0.0%) |
| 75 Years and over | 101 (100.0%) | 0 (0.0%) |
| Total | 873 (88.7%) | 42 (4.3%) |
Disability Status by Sex by Age in Las Ollas
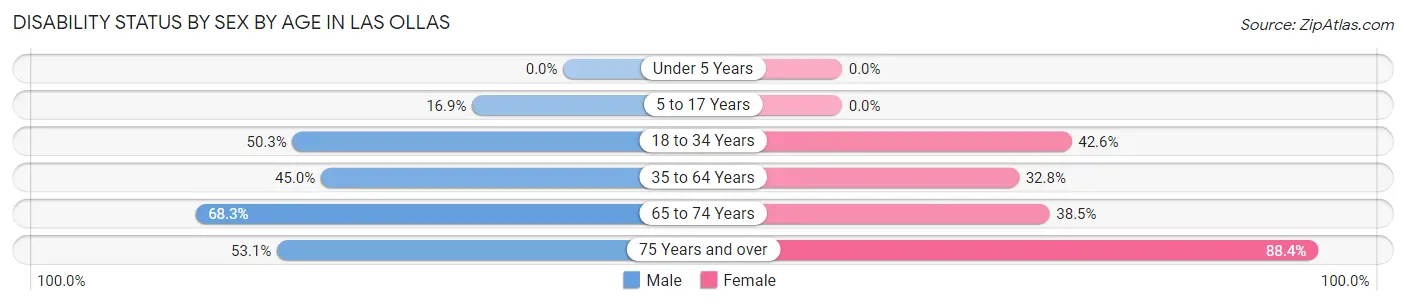
| Age Bracket | Male | Female |
| Under 5 Years | 0 (0.0%) | 0 (0.0%) |
| 5 to 17 Years | 23 (16.9%) | 0 (0.0%) |
| 18 to 34 Years | 96 (50.3%) | 23 (42.6%) |
| 35 to 64 Years | 58 (45.0%) | 67 (32.8%) |
| 65 to 74 Years | 41 (68.3%) | 42 (38.5%) |
| 75 Years and over | 17 (53.1%) | 61 (88.4%) |
Disability Class by Sex by Age in Las Ollas
Disability Class: Hearing Difficulty
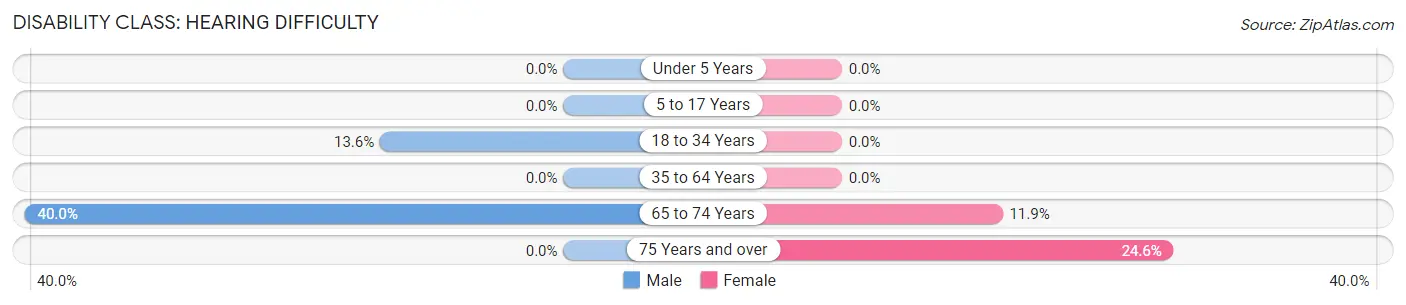
| Age Bracket | Male | Female |
| Under 5 Years | 0 (0.0%) | 0 (0.0%) |
| 5 to 17 Years | 0 (0.0%) | 0 (0.0%) |
| 18 to 34 Years | 26 (13.6%) | 0 (0.0%) |
| 35 to 64 Years | 0 (0.0%) | 0 (0.0%) |
| 65 to 74 Years | 24 (40.0%) | 13 (11.9%) |
| 75 Years and over | 0 (0.0%) | 17 (24.6%) |
Disability Class: Vision Difficulty
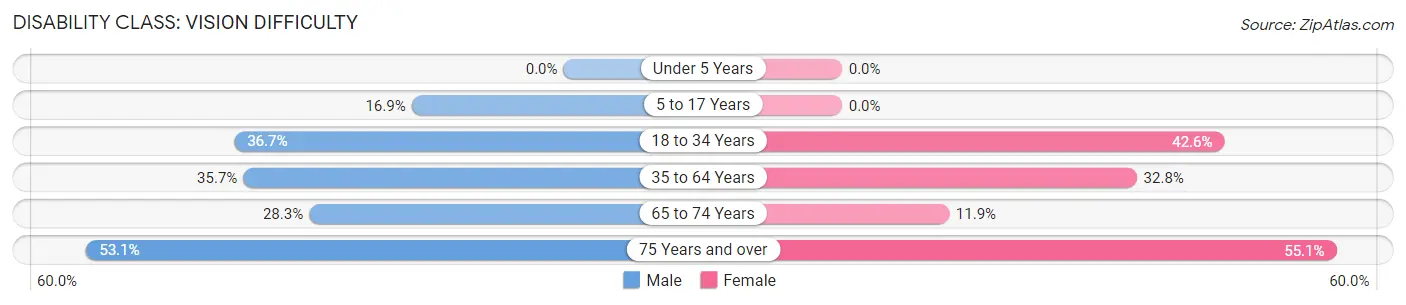
| Age Bracket | Male | Female |
| Under 5 Years | 0 (0.0%) | 0 (0.0%) |
| 5 to 17 Years | 23 (16.9%) | 0 (0.0%) |
| 18 to 34 Years | 70 (36.6%) | 23 (42.6%) |
| 35 to 64 Years | 46 (35.7%) | 67 (32.8%) |
| 65 to 74 Years | 17 (28.3%) | 13 (11.9%) |
| 75 Years and over | 17 (53.1%) | 38 (55.1%) |
Disability Class: Cognitive Difficulty
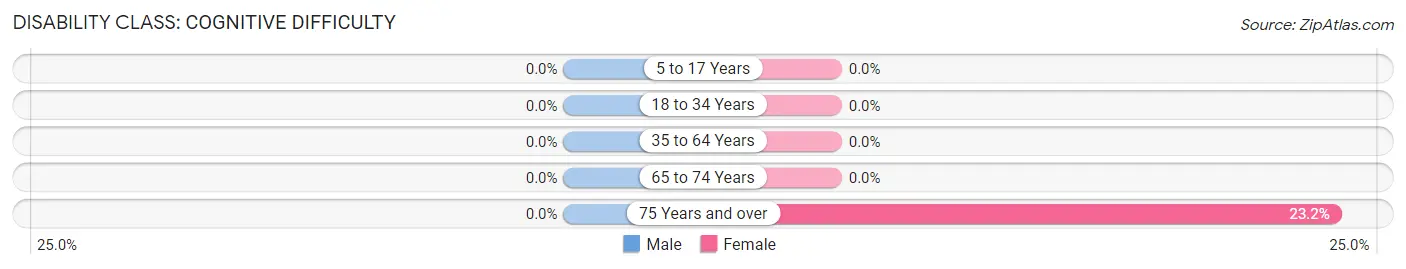
| Age Bracket | Male | Female |
| 5 to 17 Years | 0 (0.0%) | 0 (0.0%) |
| 18 to 34 Years | 0 (0.0%) | 0 (0.0%) |
| 35 to 64 Years | 0 (0.0%) | 0 (0.0%) |
| 65 to 74 Years | 0 (0.0%) | 0 (0.0%) |
| 75 Years and over | 0 (0.0%) | 16 (23.2%) |
Disability Class: Ambulatory Difficulty
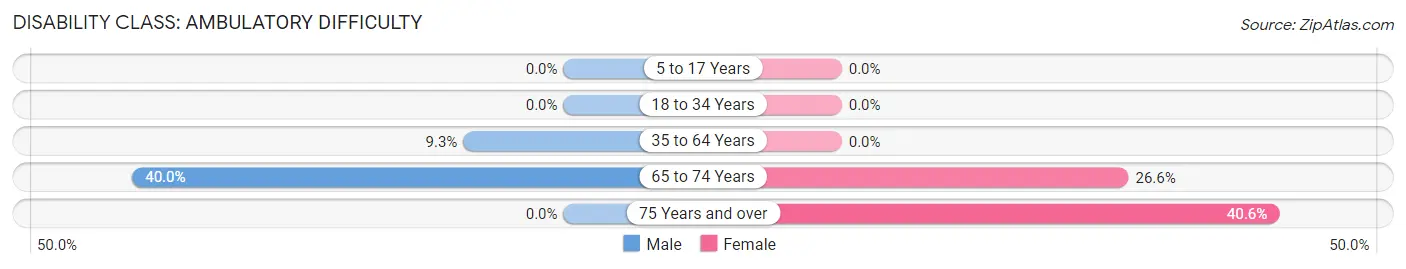
| Age Bracket | Male | Female |
| 5 to 17 Years | 0 (0.0%) | 0 (0.0%) |
| 18 to 34 Years | 0 (0.0%) | 0 (0.0%) |
| 35 to 64 Years | 12 (9.3%) | 0 (0.0%) |
| 65 to 74 Years | 24 (40.0%) | 29 (26.6%) |
| 75 Years and over | 0 (0.0%) | 28 (40.6%) |
Disability Class: Self-Care Difficulty
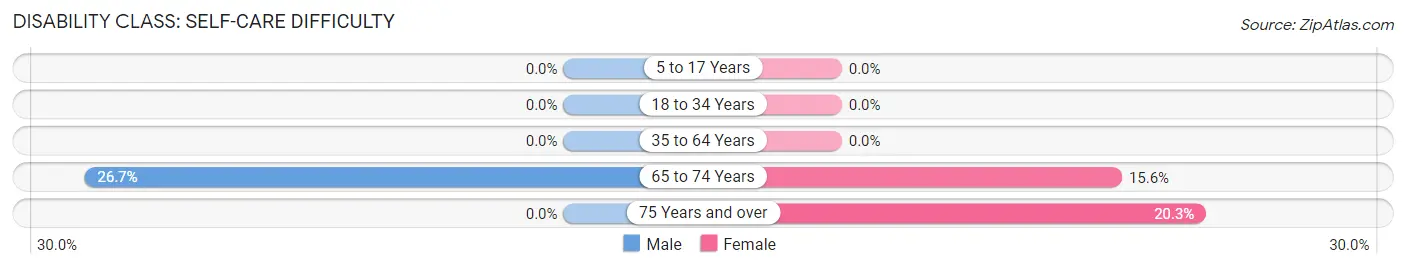
| Age Bracket | Male | Female |
| 5 to 17 Years | 0 (0.0%) | 0 (0.0%) |
| 18 to 34 Years | 0 (0.0%) | 0 (0.0%) |
| 35 to 64 Years | 0 (0.0%) | 0 (0.0%) |
| 65 to 74 Years | 16 (26.7%) | 17 (15.6%) |
| 75 Years and over | 0 (0.0%) | 14 (20.3%) |
Technology Access in Las Ollas
Computing Device Access in Las Ollas
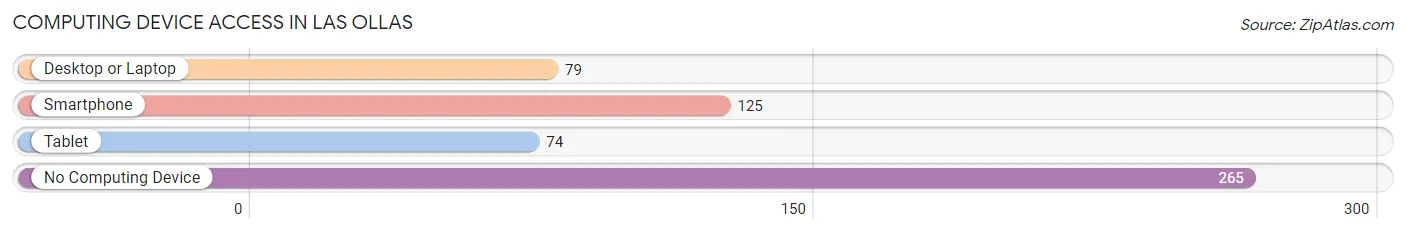
| Device Type | # Households | % Households |
| Desktop or Laptop | 79 | 19.3% |
| Smartphone | 125 | 30.6% |
| Tablet | 74 | 18.1% |
| No Computing Device | 265 | 64.8% |
| Total | 409 | 100.0% |
Internet Access in Las Ollas
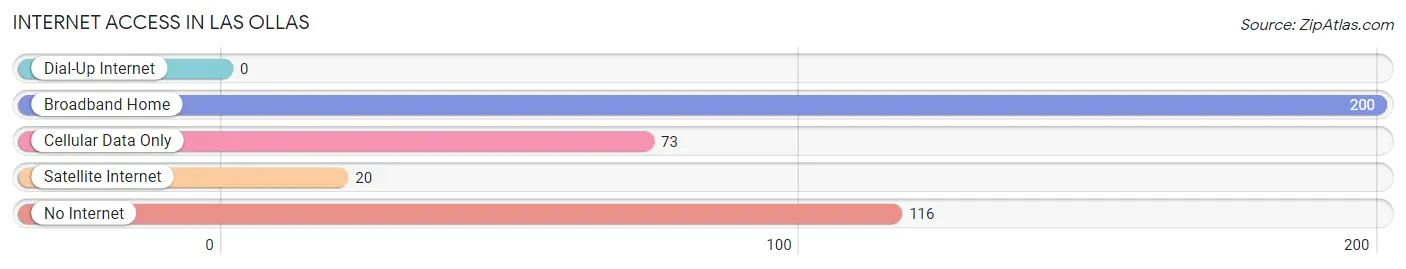
| Internet Type | # Households | % Households |
| Dial-Up Internet | 0 | 0.0% |
| Broadband Home | 200 | 48.9% |
| Cellular Data Only | 73 | 17.8% |
| Satellite Internet | 20 | 4.9% |
| No Internet | 116 | 28.4% |
| Total | 409 | 100.0% |
Las Ollas Summary
Las Ollas is a small town located in the municipality of San Germán, Puerto Rico. It is situated in the southwestern part of the island, about 20 miles from the capital city of San Juan. The town has a population of approximately 1,500 people and is known for its agricultural production, particularly of coffee and sugar cane.
Geography
Las Ollas is located in the southwestern part of Puerto Rico, in the municipality of San Germán. It is situated at an elevation of about 1,000 feet above sea level and is surrounded by mountains. The town is located in a valley, which is surrounded by the Cordillera Central mountain range. The climate in Las Ollas is tropical, with temperatures ranging from the mid-70s to the mid-80s Fahrenheit.
Economy
The economy of Las Ollas is largely based on agriculture. The town is known for its production of coffee and sugar cane, which are exported to other parts of Puerto Rico and the Caribbean. Other crops grown in the area include bananas, plantains, and yams. In addition to agriculture, the town also has a small manufacturing sector, which produces furniture and other wood products.
Demographics
As of the 2010 census, the population of Las Ollas was 1,521. The majority of the population is of Puerto Rican descent, with a small percentage of African and European ancestry. The town has a median age of 33.5 years, with a gender ratio of 51.2% female and 48.8% male. The median household income in Las Ollas is $17,845, and the poverty rate is 28.3%.
History
Las Ollas was founded in the late 19th century by a group of settlers from the nearby town of San Germán. The town was named after the ollas, or clay pots, that were used by the settlers to store water. The town grew rapidly in the early 20th century, as the agricultural industry in the area flourished. In the 1950s, the town was connected to the rest of Puerto Rico by a road, which allowed for increased trade and commerce.
Today, Las Ollas is a small but vibrant town. The town is known for its agricultural production, and its residents are proud of their heritage and culture. The town is also home to a number of festivals and events, which attract visitors from all over Puerto Rico.
Common Questions
What is Per Capita Income in Las Ollas?
Per Capita income in Las Ollas is $10,855.
What is the Median Family Income in Las Ollas?
Median Family Income in Las Ollas is $20,128.
What is the Median Household income in Las Ollas?
Median Household Income in Las Ollas is $14,831.
What is Inequality or Gini Index in Las Ollas?
Inequality or Gini Index in Las Ollas is 0.41.
What is the Total Population of Las Ollas?
Total Population of Las Ollas is 984.
What is the Total Male Population of Las Ollas?
Total Male Population of Las Ollas is 548.
What is the Total Female Population of Las Ollas?
Total Female Population of Las Ollas is 436.
What is the Ratio of Males per 100 Females in Las Ollas?
There are 125.69 Males per 100 Females in Las Ollas.
What is the Ratio of Females per 100 Males in Las Ollas?
There are 79.56 Females per 100 Males in Las Ollas.
What is the Median Population Age in Las Ollas?
Median Population Age in Las Ollas is 48.3 Years.
What is the Average Family Size in Las Ollas
Average Family Size in Las Ollas is 2.9 People.
What is the Average Household Size in Las Ollas
Average Household Size in Las Ollas is 2.4 People.
How Large is the Labor Force in Las Ollas?
There are 379 People in the Labor Forcein in Las Ollas.
What is the Percentage of People in the Labor Force in Las Ollas?
41.4% of People are in the Labor Force in Las Ollas.
What is the Unemployment Rate in Las Ollas?
Unemployment Rate in Las Ollas is 17.2%.