Olimpo, PR Map & Demographics
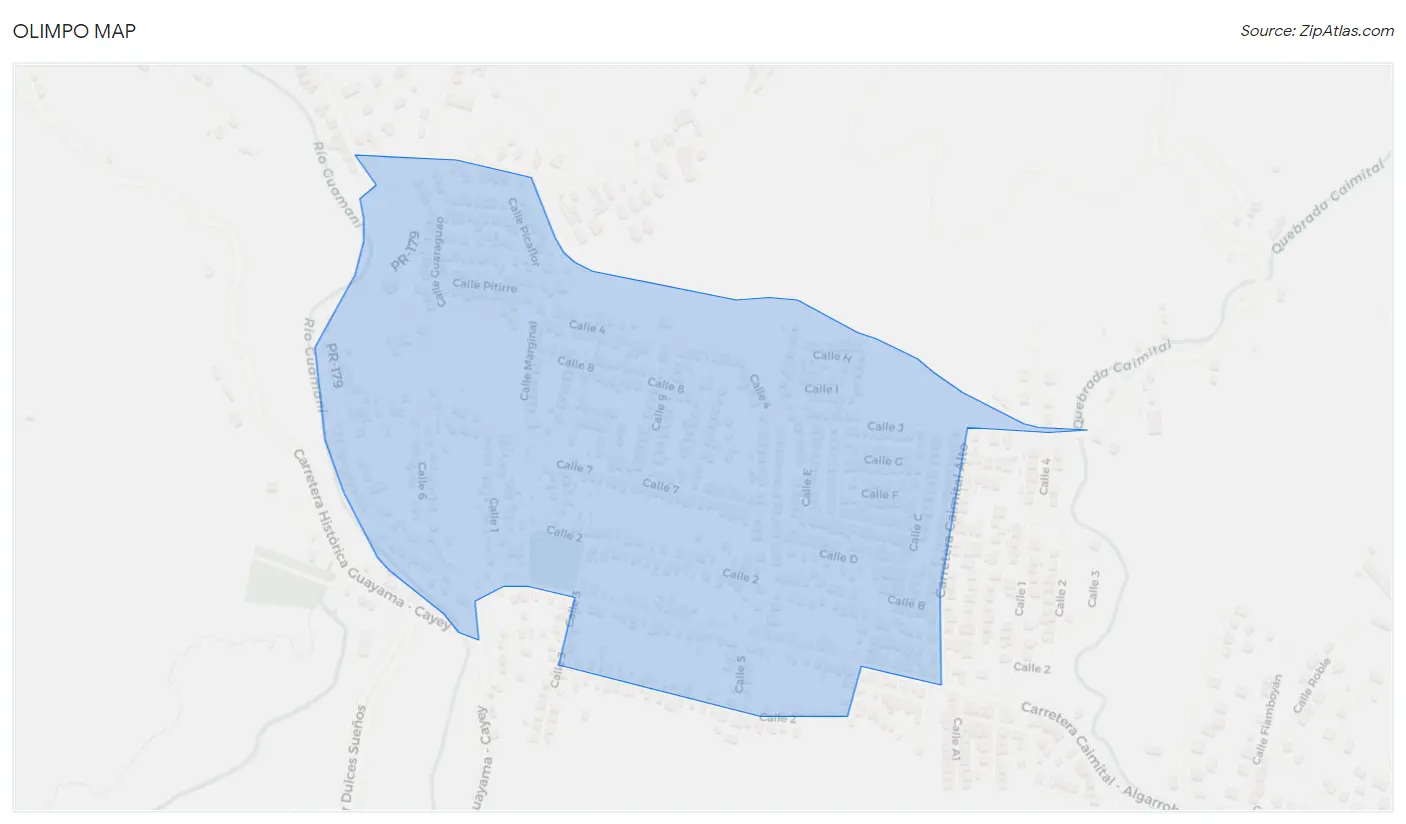
Olimpo Map
Olimpo Overview
$13,483
PER CAPITA INCOME
$22,679
AVG FAMILY INCOME
$19,381
AVG HOUSEHOLD INCOME
59.0%
WAGE / INCOME GAP [ % ]
41.0¢/ $1
WAGE / INCOME GAP [ $ ]
$5,667
FAMILY INCOME DEFICIT
0.48
INEQUALITY / GINI INDEX
1,621
TOTAL POPULATION
670
MALE POPULATION
951
FEMALE POPULATION
70.45
MALES / 100 FEMALES
141.94
FEMALES / 100 MALES
48.3
MEDIAN AGE
2.8
AVG FAMILY SIZE
2.4
AVG HOUSEHOLD SIZE
356
LABOR FORCE [ PEOPLE ]
25.4%
PERCENT IN LABOR FORCE
Income in Olimpo
Income Overview in Olimpo
Per Capita Income in Olimpo is $13,483, while median incomes of families and households are $22,679 and $19,381 respectively.
| Characteristic | Number | Measure |
| Per Capita Income | 1,621 | $13,483 |
| Median Family Income | 529 | $22,679 |
| Mean Family Income | 529 | $38,013 |
| Median Household Income | 662 | $19,381 |
| Mean Household Income | 662 | $32,684 |
| Income Deficit | 529 | $5,667 |
| Wage / Income Gap (%) | 1,621 | 59.02% |
| Wage / Income Gap ($) | 1,621 | 40.98¢ per $1 |
| Gini / Inequality Index | 1,621 | 0.48 |
Earnings by Sex in Olimpo
Average Earnings in Olimpo are $30,086, $12,933 for men and $31,558 for women, a difference of 59.0%.
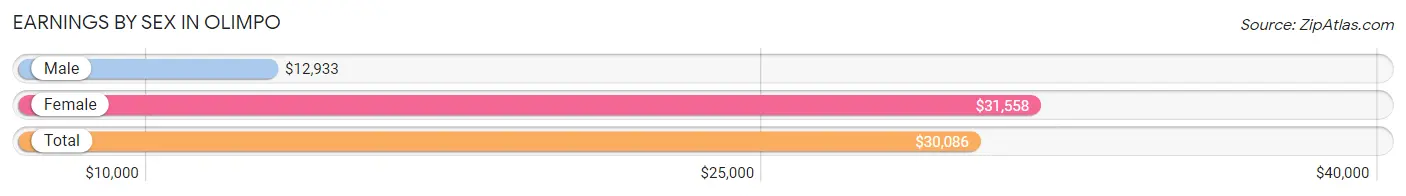
| Sex | Number | Average Earnings |
| Male | 168 (43.2%) | $12,933 |
| Female | 221 (56.8%) | $31,558 |
| Total | 389 (100.0%) | $30,086 |
Earnings by Sex by Income Bracket in Olimpo
The most common earnings brackets in Olimpo are $12,500 to $14,999 for men (52 | 30.9%) and $30,000 to $34,999 for women (118 | 53.4%).
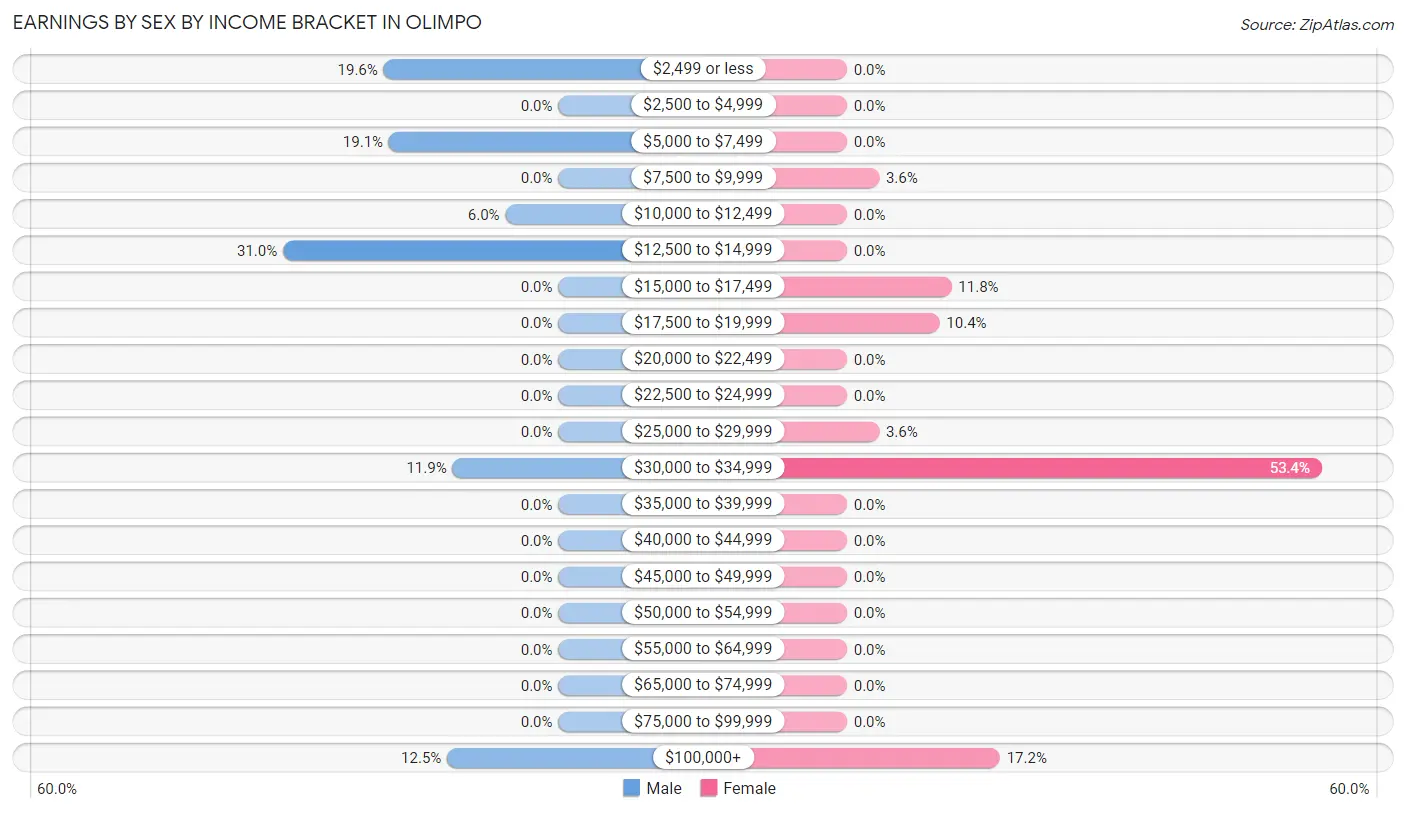
| Income | Male | Female |
| $2,499 or less | 33 (19.6%) | 0 (0.0%) |
| $2,500 to $4,999 | 0 (0.0%) | 0 (0.0%) |
| $5,000 to $7,499 | 32 (19.1%) | 0 (0.0%) |
| $7,500 to $9,999 | 0 (0.0%) | 8 (3.6%) |
| $10,000 to $12,499 | 10 (5.9%) | 0 (0.0%) |
| $12,500 to $14,999 | 52 (30.9%) | 0 (0.0%) |
| $15,000 to $17,499 | 0 (0.0%) | 26 (11.8%) |
| $17,500 to $19,999 | 0 (0.0%) | 23 (10.4%) |
| $20,000 to $22,499 | 0 (0.0%) | 0 (0.0%) |
| $22,500 to $24,999 | 0 (0.0%) | 0 (0.0%) |
| $25,000 to $29,999 | 0 (0.0%) | 8 (3.6%) |
| $30,000 to $34,999 | 20 (11.9%) | 118 (53.4%) |
| $35,000 to $39,999 | 0 (0.0%) | 0 (0.0%) |
| $40,000 to $44,999 | 0 (0.0%) | 0 (0.0%) |
| $45,000 to $49,999 | 0 (0.0%) | 0 (0.0%) |
| $50,000 to $54,999 | 0 (0.0%) | 0 (0.0%) |
| $55,000 to $64,999 | 0 (0.0%) | 0 (0.0%) |
| $65,000 to $74,999 | 0 (0.0%) | 0 (0.0%) |
| $75,000 to $99,999 | 0 (0.0%) | 0 (0.0%) |
| $100,000+ | 21 (12.5%) | 38 (17.2%) |
| Total | 168 (100.0%) | 221 (100.0%) |
Earnings by Sex by Educational Attainment in Olimpo
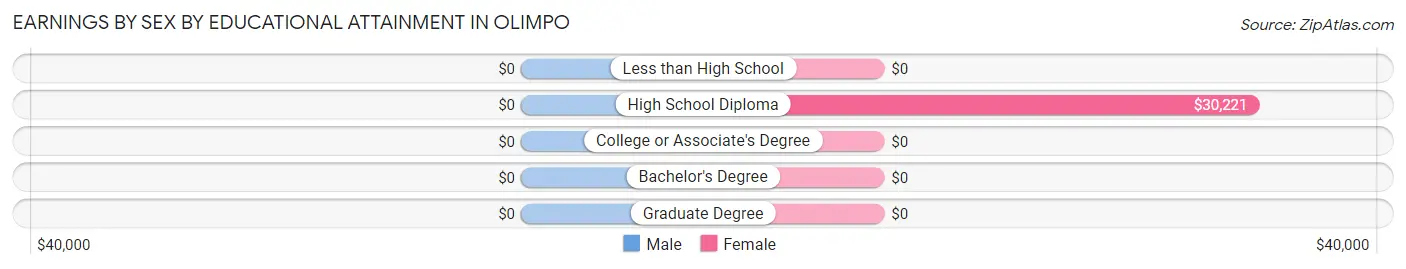
| Educational Attainment | Male Income | Female Income |
| Less than High School | - | - |
| High School Diploma | - | - |
| College or Associate's Degree | - | - |
| Bachelor's Degree | - | - |
| Graduate Degree | - | - |
| Total | $13,510 | $31,558 |
Family Income in Olimpo
Family Income Brackets in Olimpo
According to the Olimpo family income data, there are 201 families falling into the $15,000 to $24,999 income range, which is the most common income bracket and makes up 38.0% of all families.
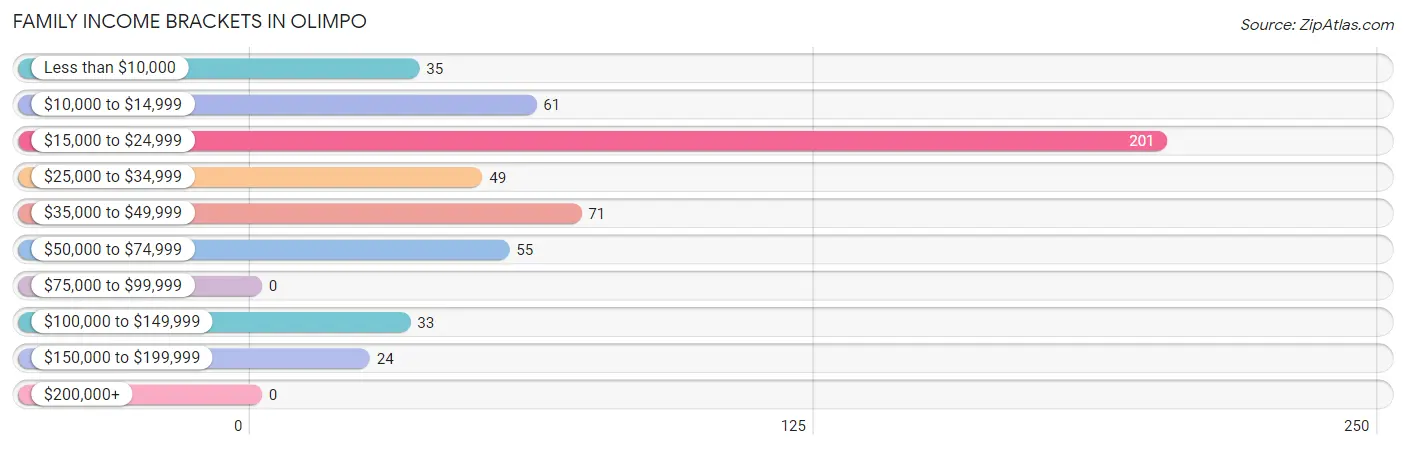
| Income Bracket | # Families | % Families |
| Less than $10,000 | 35 | 6.6% |
| $10,000 to $14,999 | 61 | 11.5% |
| $15,000 to $24,999 | 201 | 38.0% |
| $25,000 to $34,999 | 49 | 9.3% |
| $35,000 to $49,999 | 71 | 13.4% |
| $50,000 to $74,999 | 55 | 10.4% |
| $75,000 to $99,999 | 0 | 0.0% |
| $100,000 to $149,999 | 33 | 6.2% |
| $150,000 to $199,999 | 24 | 4.5% |
| $200,000+ | 0 | 0.0% |
Family Income by Famaliy Size in Olimpo
4-person families (110 | 20.8%) account for the highest median family income in Olimpo with $40,000 per family, while 4-person families (110 | 20.8%) have the highest median income of $10,000 per family member.
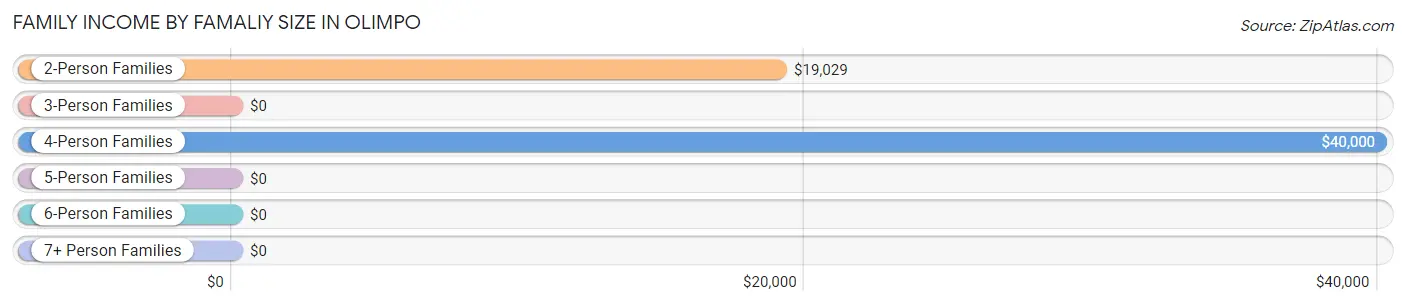
| Income Bracket | # Families | Median Income |
| 2-Person Families | 334 (63.1%) | $19,029 |
| 3-Person Families | 85 (16.1%) | $0 |
| 4-Person Families | 110 (20.8%) | $40,000 |
| 5-Person Families | 0 (0.0%) | $0 |
| 6-Person Families | 0 (0.0%) | $0 |
| 7+ Person Families | 0 (0.0%) | $0 |
| Total | 529 (100.0%) | $22,679 |
Family Income by Number of Earners in Olimpo
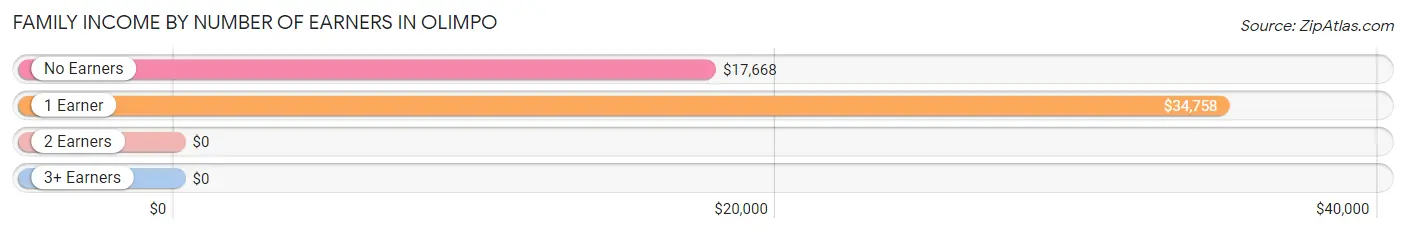
| Number of Earners | # Families | Median Income |
| No Earners | 235 (44.4%) | $17,668 |
| 1 Earner | 248 (46.9%) | $34,758 |
| 2 Earners | 46 (8.7%) | $0 |
| 3+ Earners | 0 (0.0%) | $0 |
| Total | 529 (100.0%) | $22,679 |
Household Income in Olimpo
Household Income Brackets in Olimpo
With 278 households falling in the category, the $15,000 to $24,999 income range is the most frequent in Olimpo, accounting for 42.0% of all households.
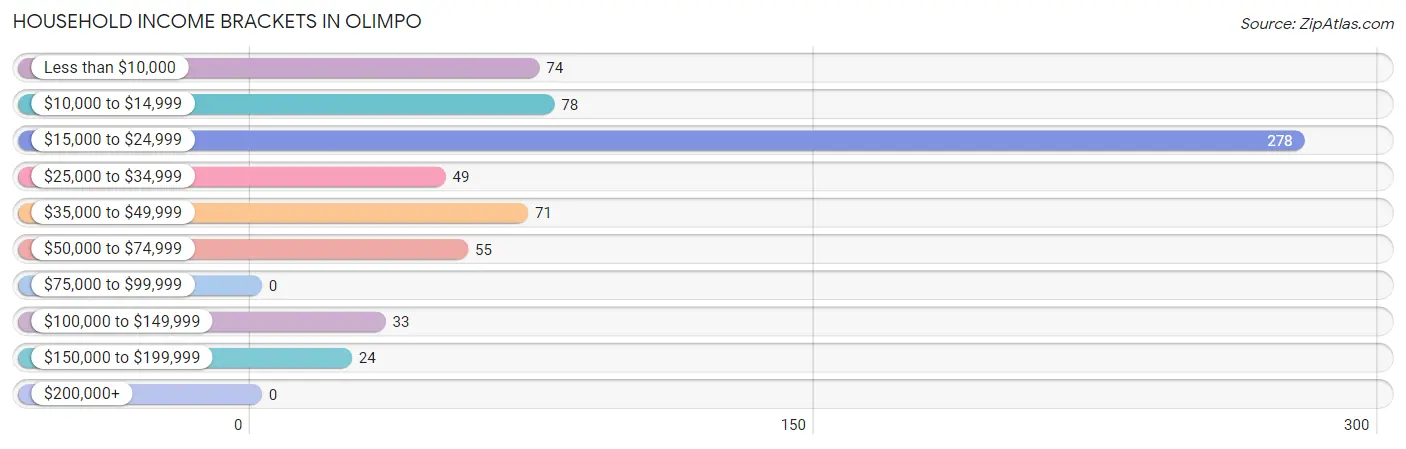
| Income Bracket | # Households | % Households |
| Less than $10,000 | 74 | 11.2% |
| $10,000 to $14,999 | 78 | 11.8% |
| $15,000 to $24,999 | 278 | 42.0% |
| $25,000 to $34,999 | 49 | 7.4% |
| $35,000 to $49,999 | 71 | 10.7% |
| $50,000 to $74,999 | 55 | 8.3% |
| $75,000 to $99,999 | 0 | 0.0% |
| $100,000 to $149,999 | 33 | 5.0% |
| $150,000 to $199,999 | 24 | 3.6% |
| $200,000+ | 0 | 0.0% |
Household Income by Householder Age in Olimpo
The median household income in Olimpo is $19,381, with the highest median household income of $33,631 found in the 25 to 44 years age bracket for the primary householder. A total of 195 households (29.5%) fall into this category.
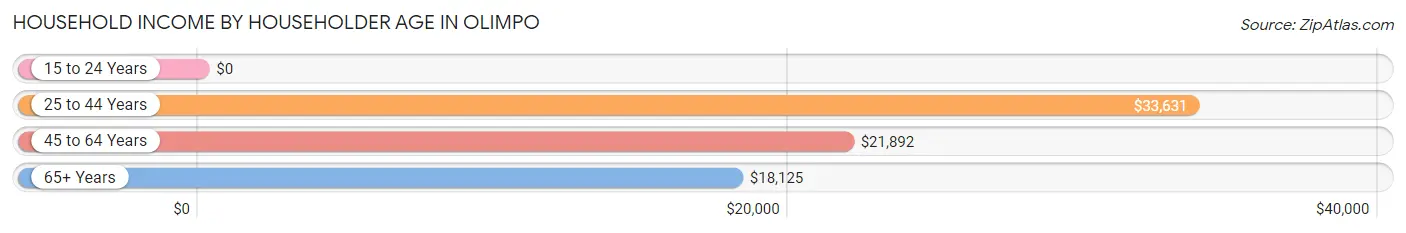
| Income Bracket | # Households | Median Income |
| 15 to 24 Years | 0 (0.0%) | $0 |
| 25 to 44 Years | 195 (29.5%) | $33,631 |
| 45 to 64 Years | 244 (36.9%) | $21,892 |
| 65+ Years | 223 (33.7%) | $18,125 |
| Total | 662 (100.0%) | $19,381 |
Poverty in Olimpo
Income Below Poverty by Sex and Age in Olimpo
With 27.3% poverty level for males and 45.4% for females among the residents of Olimpo, 35 to 44 year old males and under 5 year old females are the most vulnerable to poverty, with 35 males (63.6%) and 43 females (100.0%) in their respective age groups living below the poverty level.
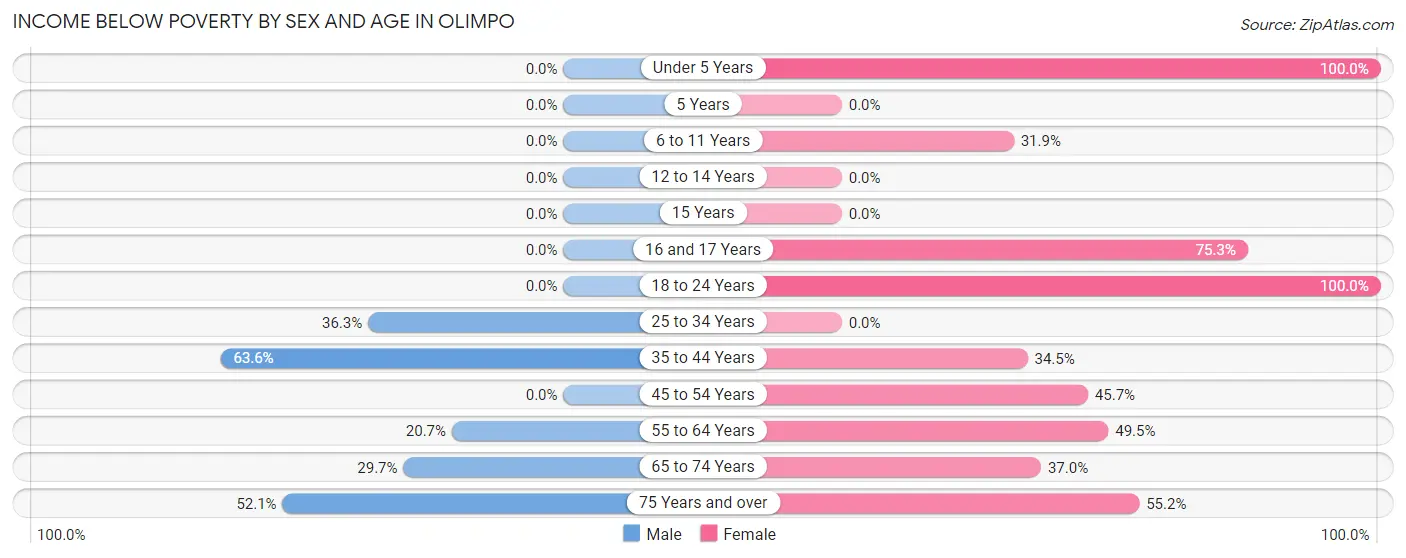
| Age Bracket | Male | Female |
| Under 5 Years | 0 (0.0%) | 43 (100.0%) |
| 5 Years | 0 (0.0%) | 0 (0.0%) |
| 6 to 11 Years | 0 (0.0%) | 15 (31.9%) |
| 12 to 14 Years | 0 (0.0%) | 0 (0.0%) |
| 15 Years | 0 (0.0%) | 0 (0.0%) |
| 16 and 17 Years | 0 (0.0%) | 55 (75.3%) |
| 18 to 24 Years | 0 (0.0%) | 19 (100.0%) |
| 25 to 34 Years | 33 (36.3%) | 0 (0.0%) |
| 35 to 44 Years | 35 (63.6%) | 70 (34.5%) |
| 45 to 54 Years | 0 (0.0%) | 37 (45.7%) |
| 55 to 64 Years | 24 (20.7%) | 93 (49.5%) |
| 65 to 74 Years | 30 (29.7%) | 44 (37.0%) |
| 75 Years and over | 61 (52.1%) | 53 (55.2%) |
| Total | 183 (27.3%) | 429 (45.4%) |
Income Above Poverty by Sex and Age in Olimpo
According to the poverty statistics in Olimpo, males aged under 5 years and females aged 15 years are the age groups that are most secure financially, with 100.0% of males and 100.0% of females in these age groups living above the poverty line.
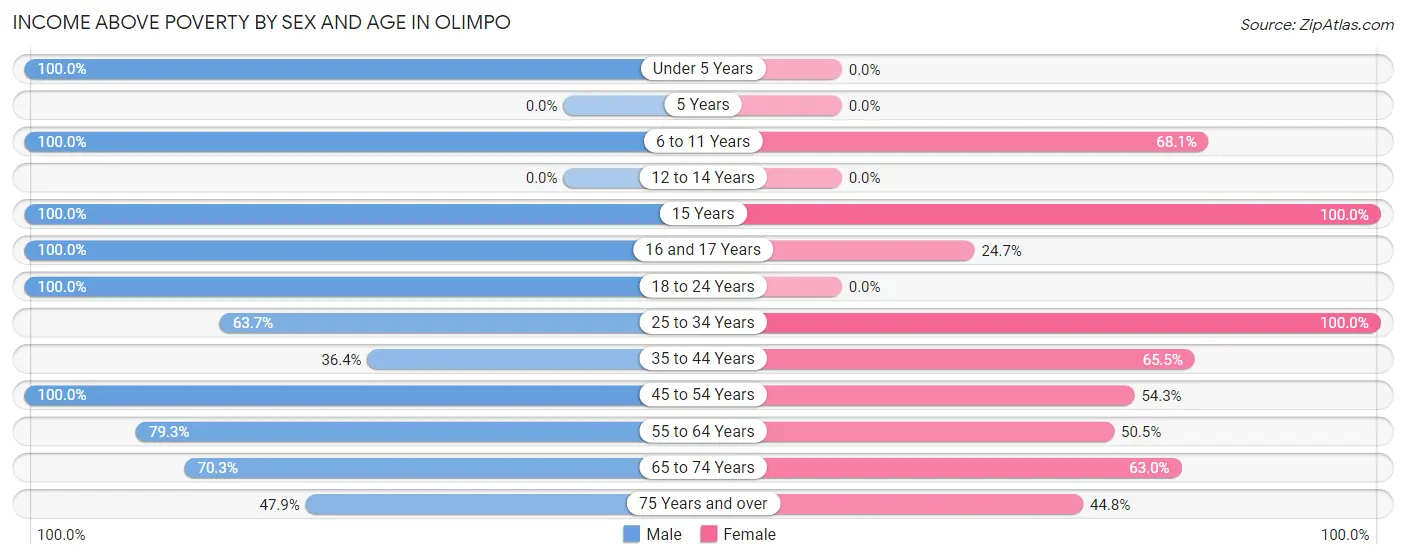
| Age Bracket | Male | Female |
| Under 5 Years | 33 (100.0%) | 0 (0.0%) |
| 5 Years | 0 (0.0%) | 0 (0.0%) |
| 6 to 11 Years | 25 (100.0%) | 32 (68.1%) |
| 12 to 14 Years | 0 (0.0%) | 0 (0.0%) |
| 15 Years | 46 (100.0%) | 24 (100.0%) |
| 16 and 17 Years | 24 (100.0%) | 18 (24.7%) |
| 18 to 24 Years | 37 (100.0%) | 0 (0.0%) |
| 25 to 34 Years | 58 (63.7%) | 51 (100.0%) |
| 35 to 44 Years | 20 (36.4%) | 133 (65.5%) |
| 45 to 54 Years | 25 (100.0%) | 44 (54.3%) |
| 55 to 64 Years | 92 (79.3%) | 95 (50.5%) |
| 65 to 74 Years | 71 (70.3%) | 75 (63.0%) |
| 75 Years and over | 56 (47.9%) | 43 (44.8%) |
| Total | 487 (72.7%) | 515 (54.6%) |
Income Below Poverty Among Married-Couple Families in Olimpo
The poverty statistics for married-couple families in Olimpo show that 36.4% or 134 of the total 368 families live below the poverty line. Families with 1 or 2 children have the highest poverty rate of 44.6%, comprising of 37 families. On the other hand, families with no children have the lowest poverty rate of 34.0%, which includes 97 families.
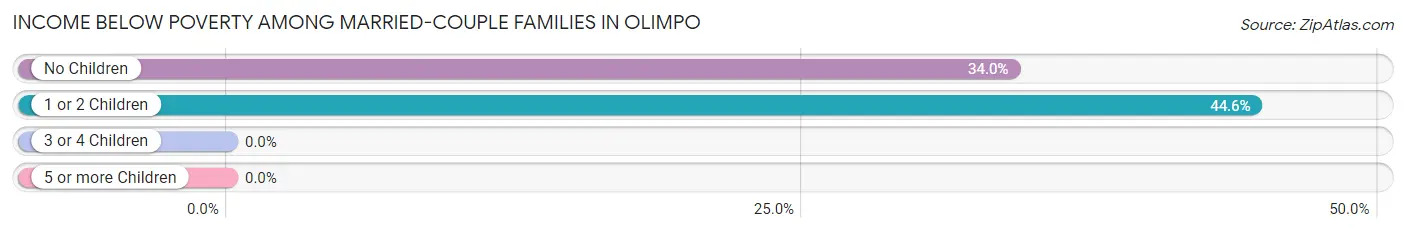
| Children | Above Poverty | Below Poverty |
| No Children | 188 (66.0%) | 97 (34.0%) |
| 1 or 2 Children | 46 (55.4%) | 37 (44.6%) |
| 3 or 4 Children | 0 (0.0%) | 0 (0.0%) |
| 5 or more Children | 0 (0.0%) | 0 (0.0%) |
| Total | 234 (63.6%) | 134 (36.4%) |
Income Below Poverty Among Single-Parent Households in Olimpo
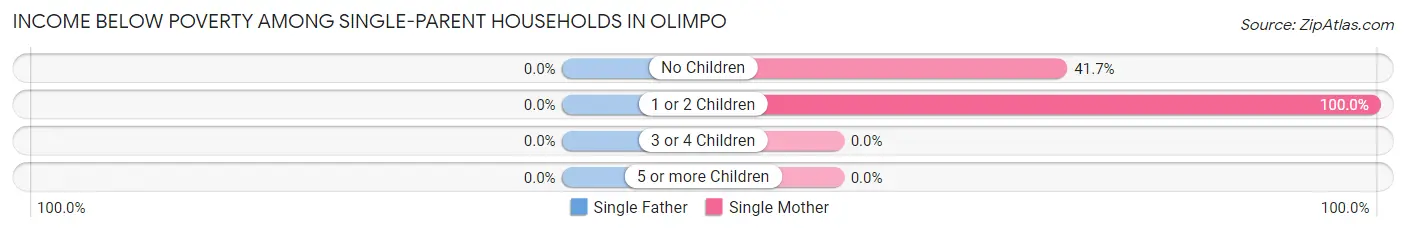
| Children | Single Father | Single Mother |
| No Children | 0 (0.0%) | 35 (41.7%) |
| 1 or 2 Children | 0 (0.0%) | 31 (100.0%) |
| 3 or 4 Children | 0 (0.0%) | 0 (0.0%) |
| 5 or more Children | 0 (0.0%) | 0 (0.0%) |
| Total | 0 (0.0%) | 66 (43.4%) |
Income Below Poverty Among Married-Couple vs Single-Parent Households in Olimpo
The poverty data for Olimpo shows that 134 of the married-couple family households (36.4%) and 66 of the single-parent households (41.0%) are living below the poverty level. Within the married-couple family households, those with 1 or 2 children have the highest poverty rate, with 37 households (44.6%) falling below the poverty line. Among the single-parent households, those with 1 or 2 children have the highest poverty rate, with 31 household (100.0%) living below poverty.
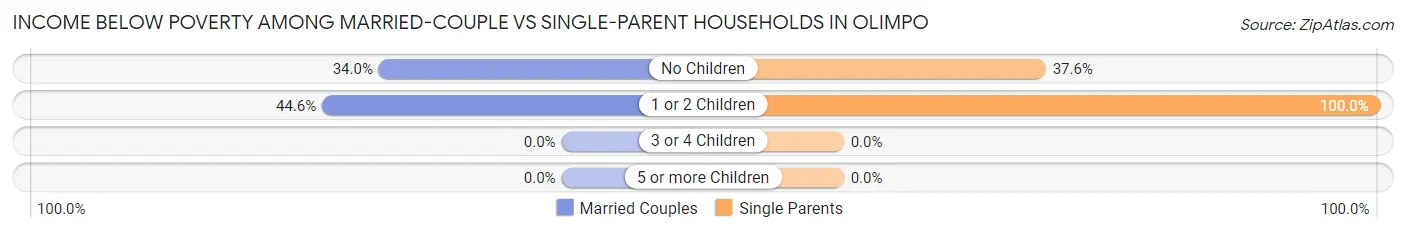
| Children | Married-Couple Families | Single-Parent Households |
| No Children | 97 (34.0%) | 35 (37.6%) |
| 1 or 2 Children | 37 (44.6%) | 31 (100.0%) |
| 3 or 4 Children | 0 (0.0%) | 0 (0.0%) |
| 5 or more Children | 0 (0.0%) | 0 (0.0%) |
| Total | 134 (36.4%) | 66 (41.0%) |
Race in Olimpo
The most populous races in Olimpo are Hispanic or Latino (1,621 | 100.0%), White / Caucasian (842 | 51.9%), and Some other Race (307 | 18.9%).
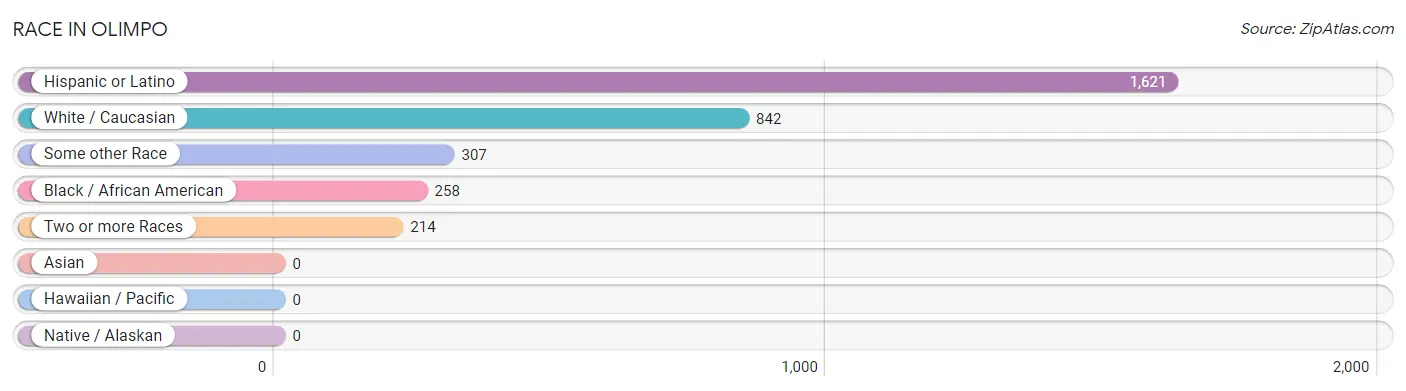
| Race | # Population | % Population |
| Asian | 0 | 0.0% |
| Black / African American | 258 | 15.9% |
| Hawaiian / Pacific | 0 | 0.0% |
| Hispanic or Latino | 1,621 | 100.0% |
| Native / Alaskan | 0 | 0.0% |
| White / Caucasian | 842 | 51.9% |
| Two or more Races | 214 | 13.2% |
| Some other Race | 307 | 18.9% |
| Total | 1,621 | 100.0% |
Ancestry in Olimpo
The most populous ancestries reported in Olimpo are Puerto Rican (1,596 | 98.5%), Dominican (8 | 0.5%), and American (7 | 0.4%), together accounting for 99.4% of all Olimpo residents.
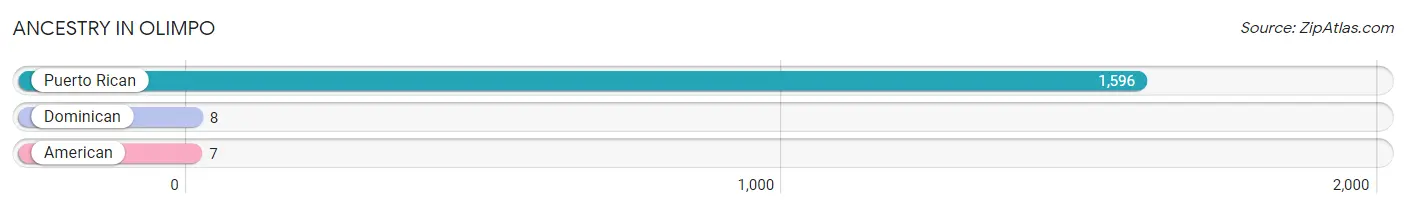
| Ancestry | # Population | % Population |
| American | 7 | 0.4% |
| Dominican | 8 | 0.5% |
| Puerto Rican | 1,596 | 98.5% | View All 3 Rows |
Immigrants in Olimpo

| Immigration Origin | # Population | % Population | View All 0 Rows |
Sex and Age in Olimpo
Sex and Age in Olimpo
The most populous age groups in Olimpo are 15 to 19 Years (70 | 10.4%) for men and 40 to 44 Years (140 | 14.7%) for women.
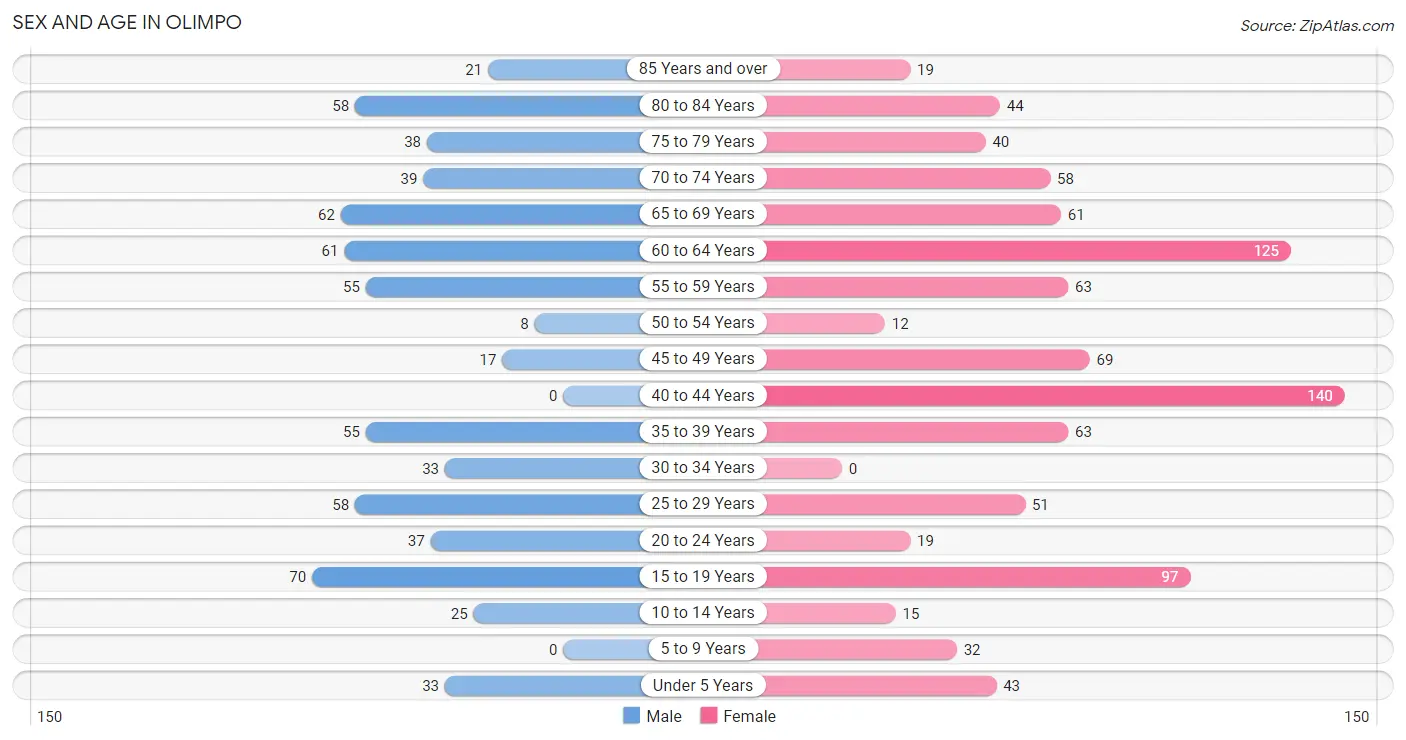
| Age Bracket | Male | Female |
| Under 5 Years | 33 (4.9%) | 43 (4.5%) |
| 5 to 9 Years | 0 (0.0%) | 32 (3.4%) |
| 10 to 14 Years | 25 (3.7%) | 15 (1.6%) |
| 15 to 19 Years | 70 (10.4%) | 97 (10.2%) |
| 20 to 24 Years | 37 (5.5%) | 19 (2.0%) |
| 25 to 29 Years | 58 (8.7%) | 51 (5.4%) |
| 30 to 34 Years | 33 (4.9%) | 0 (0.0%) |
| 35 to 39 Years | 55 (8.2%) | 63 (6.6%) |
| 40 to 44 Years | 0 (0.0%) | 140 (14.7%) |
| 45 to 49 Years | 17 (2.5%) | 69 (7.3%) |
| 50 to 54 Years | 8 (1.2%) | 12 (1.3%) |
| 55 to 59 Years | 55 (8.2%) | 63 (6.6%) |
| 60 to 64 Years | 61 (9.1%) | 125 (13.1%) |
| 65 to 69 Years | 62 (9.2%) | 61 (6.4%) |
| 70 to 74 Years | 39 (5.8%) | 58 (6.1%) |
| 75 to 79 Years | 38 (5.7%) | 40 (4.2%) |
| 80 to 84 Years | 58 (8.7%) | 44 (4.6%) |
| 85 Years and over | 21 (3.1%) | 19 (2.0%) |
| Total | 670 (100.0%) | 951 (100.0%) |
Families and Households in Olimpo
Median Family Size in Olimpo
The median family size in Olimpo is 2.76 persons per family, with single female/mother families (152 | 28.7%) accounting for the largest median family size of 3.14 persons per family. On the other hand, married-couple families (368 | 69.6%) represent the smallest median family size with 2.60 persons per family.
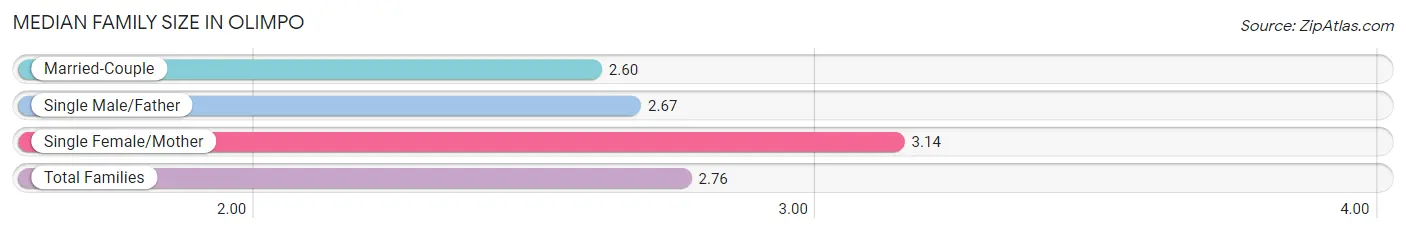
| Family Type | # Families | Family Size |
| Married-Couple | 368 (69.6%) | 2.60 |
| Single Male/Father | 9 (1.7%) | 2.67 |
| Single Female/Mother | 152 (28.7%) | 3.14 |
| Total Families | 529 (100.0%) | 2.76 |
Median Household Size in Olimpo
The median household size in Olimpo is 2.44 persons per household, with single female/mother households (152 | 23.0%) accounting for the largest median household size of 3.14 persons per household. non-family households (133 | 20.1%) represent the smallest median household size with 1.17 persons per household.
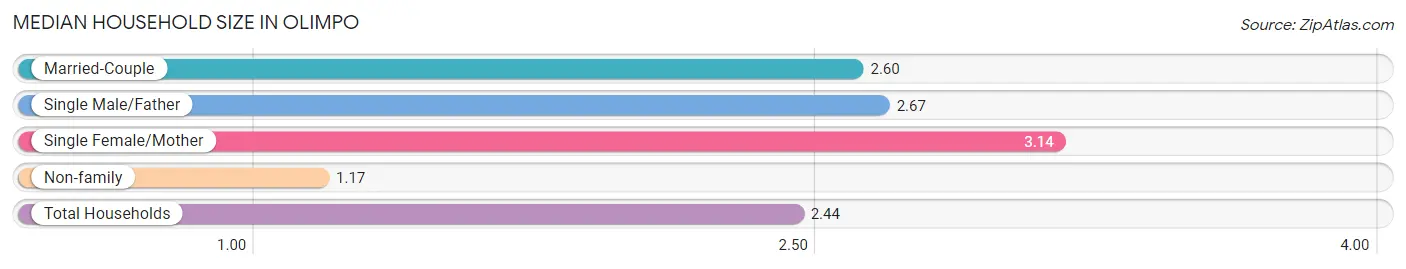
| Household Type | # Households | Household Size |
| Married-Couple | 368 (55.6%) | 2.60 |
| Single Male/Father | 9 (1.4%) | 2.67 |
| Single Female/Mother | 152 (23.0%) | 3.14 |
| Non-family | 133 (20.1%) | 1.17 |
| Total Households | 662 (100.0%) | 2.44 |
Household Size by Marriage Status in Olimpo
Out of a total of 662 households in Olimpo, 529 (79.9%) are family households, while 133 (20.1%) are nonfamily households. The most numerous type of family households are 2-person households, comprising 334, and the most common type of nonfamily households are 1-person households, comprising 109.
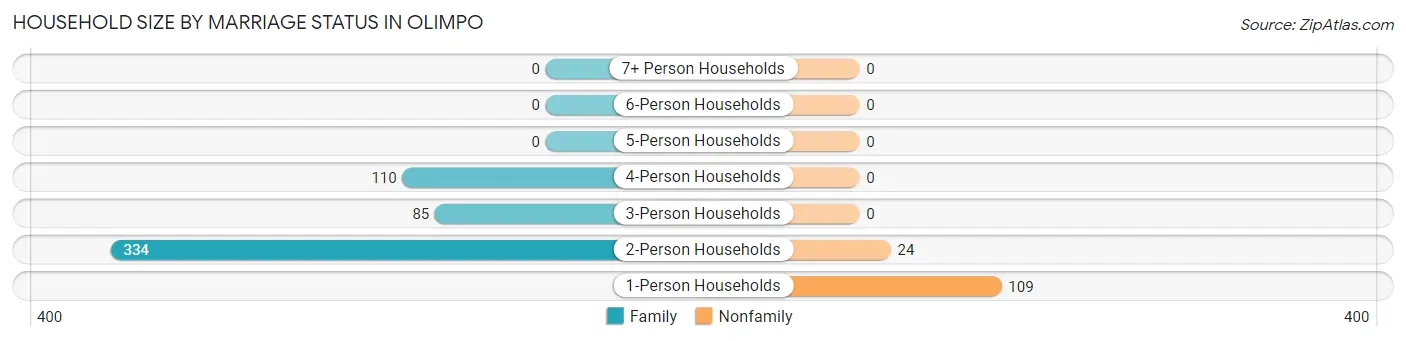
| Household Size | Family Households | Nonfamily Households |
| 1-Person Households | - | 109 (16.5%) |
| 2-Person Households | 334 (50.4%) | 24 (3.6%) |
| 3-Person Households | 85 (12.8%) | 0 (0.0%) |
| 4-Person Households | 110 (16.6%) | 0 (0.0%) |
| 5-Person Households | 0 (0.0%) | 0 (0.0%) |
| 6-Person Households | 0 (0.0%) | 0 (0.0%) |
| 7+ Person Households | 0 (0.0%) | 0 (0.0%) |
| Total | 529 (79.9%) | 133 (20.1%) |
Female Fertility in Olimpo
Fertility by Age in Olimpo
| Age Bracket | Women with Births | Births / 1,000 Women |
| 15 to 19 years | 0 (0.0%) | 0.0 |
| 20 to 34 years | 0 (0.0%) | 0.0 |
| 35 to 50 years | 0 (0.0%) | 0.0 |
| Total | 0 (0.0%) | 0.0 |
Fertility by Age by Marriage Status in Olimpo
| Age Bracket | Married | Unmarried |
| 15 to 19 years | 0 (0.0%) | 0 (0.0%) |
| 20 to 34 years | 0 (0.0%) | 0 (0.0%) |
| 35 to 50 years | 0 (0.0%) | 0 (0.0%) |
| Total | 0 (0.0%) | 0 (0.0%) |
Fertility by Education in Olimpo
| Educational Attainment | Women with Births | Births / 1,000 Women |
| Less than High School | 0 (0.0%) | 0.0 |
| High School Diploma | 0 (0.0%) | 0.0 |
| College or Associate's Degree | 0 (0.0%) | 0.0 |
| Bachelor's Degree | 0 (0.0%) | 0.0 |
| Graduate Degree | 0 (0.0%) | 0.0 |
| Total | 0 (0.0%) | 0.0 |
Fertility by Education by Marriage Status in Olimpo
| Educational Attainment | Married | Unmarried |
| Less than High School | 0 (0.0%) | 0 (0.0%) |
| High School Diploma | 0 (0.0%) | 0 (0.0%) |
| College or Associate's Degree | 0 (0.0%) | 0 (0.0%) |
| Bachelor's Degree | 0 (0.0%) | 0 (0.0%) |
| Graduate Degree | 0 (0.0%) | 0 (0.0%) |
| Total | 0 (0.0%) | 0 (0.0%) |
Employment Characteristics in Olimpo
Employment by Class of Employer in Olimpo
Among the 318 employed individuals in Olimpo, private company employees (241 | 75.8%), state government employees (31 | 9.8%), and federal government employees (20 | 6.3%) make up the most common classes of employment.
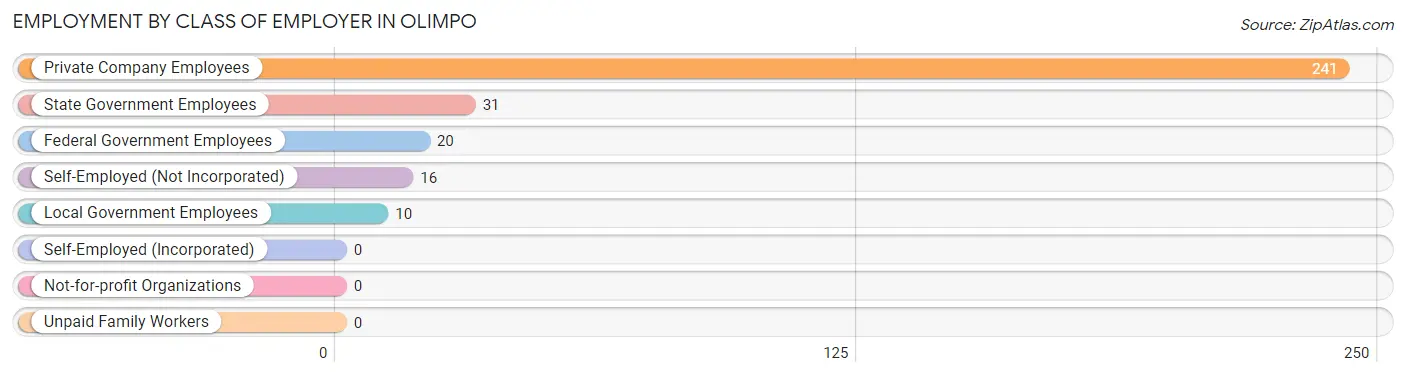
| Employer Class | # Employees | % Employees |
| Private Company Employees | 241 | 75.8% |
| Self-Employed (Incorporated) | 0 | 0.0% |
| Self-Employed (Not Incorporated) | 16 | 5.0% |
| Not-for-profit Organizations | 0 | 0.0% |
| Local Government Employees | 10 | 3.1% |
| State Government Employees | 31 | 9.8% |
| Federal Government Employees | 20 | 6.3% |
| Unpaid Family Workers | 0 | 0.0% |
| Total | 318 | 100.0% |
Employment Status by Age in Olimpo
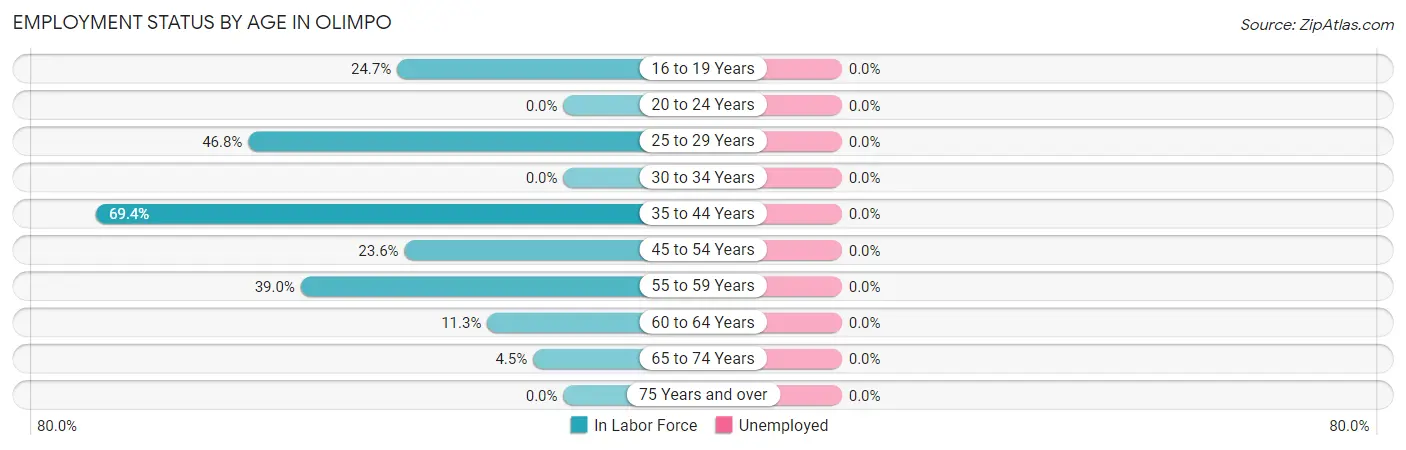
| Age Bracket | In Labor Force | Unemployed |
| 16 to 19 Years | 24 (24.7%) | 0 (0.0%) |
| 20 to 24 Years | 0 (0.0%) | 0 (0.0%) |
| 25 to 29 Years | 51 (46.8%) | 0 (0.0%) |
| 30 to 34 Years | 0 (0.0%) | 0 (0.0%) |
| 35 to 44 Years | 179 (69.4%) | 0 (0.0%) |
| 45 to 54 Years | 25 (23.6%) | 0 (0.0%) |
| 55 to 59 Years | 46 (39.0%) | 0 (0.0%) |
| 60 to 64 Years | 21 (11.3%) | 0 (0.0%) |
| 65 to 74 Years | 10 (4.5%) | 0 (0.0%) |
| 75 Years and over | 0 (0.0%) | 0 (0.0%) |
| Total | 356 (25.4%) | 0 (0.0%) |
Employment Status by Educational Attainment in Olimpo
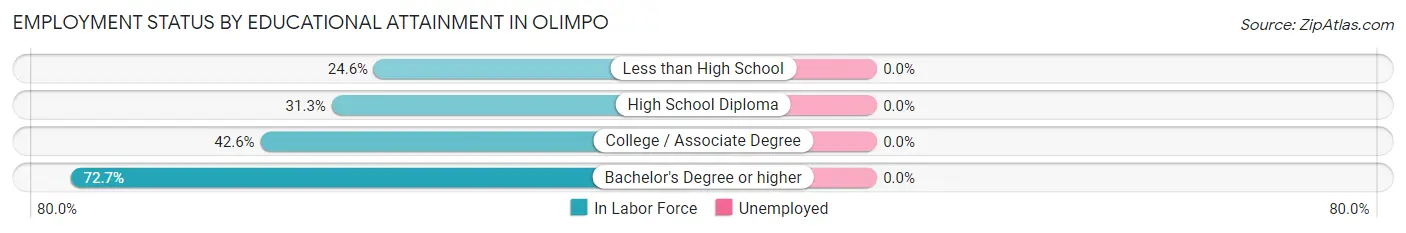
| Educational Attainment | In Labor Force | Unemployed |
| Less than High School | 35 (24.6%) | 0 (0.0%) |
| High School Diploma | 118 (31.3%) | 0 (0.0%) |
| College / Associate Degree | 60 (42.6%) | 0 (0.0%) |
| Bachelor's Degree or higher | 109 (72.7%) | 0 (0.0%) |
| Total | 322 (39.8%) | 0 (0.0%) |
Employment Occupations by Sex in Olimpo
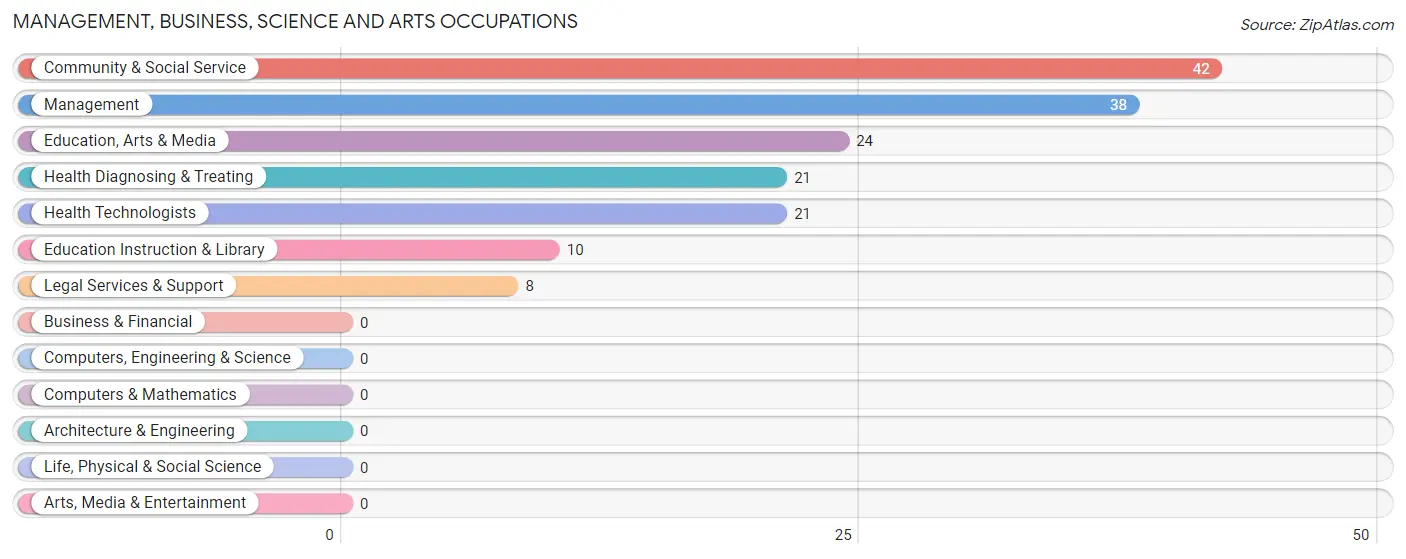
Management, Business, Science and Arts Occupations
The most common Management, Business, Science and Arts occupations in Olimpo are Community & Social Service (42 | 11.8%), Management (38 | 10.7%), Education, Arts & Media (24 | 6.7%), Health Diagnosing & Treating (21 | 5.9%), and Health Technologists (21 | 5.9%).
Management, Business, Science and Arts Occupations by Sex
Within the Management, Business, Science and Arts occupations in Olimpo, the most male-oriented occupations are Education Instruction & Library (100.0%), and Community & Social Service (23.8%), while the most female-oriented occupations are Management (100.0%), Education, Arts & Media (100.0%), and Legal Services & Support (100.0%).
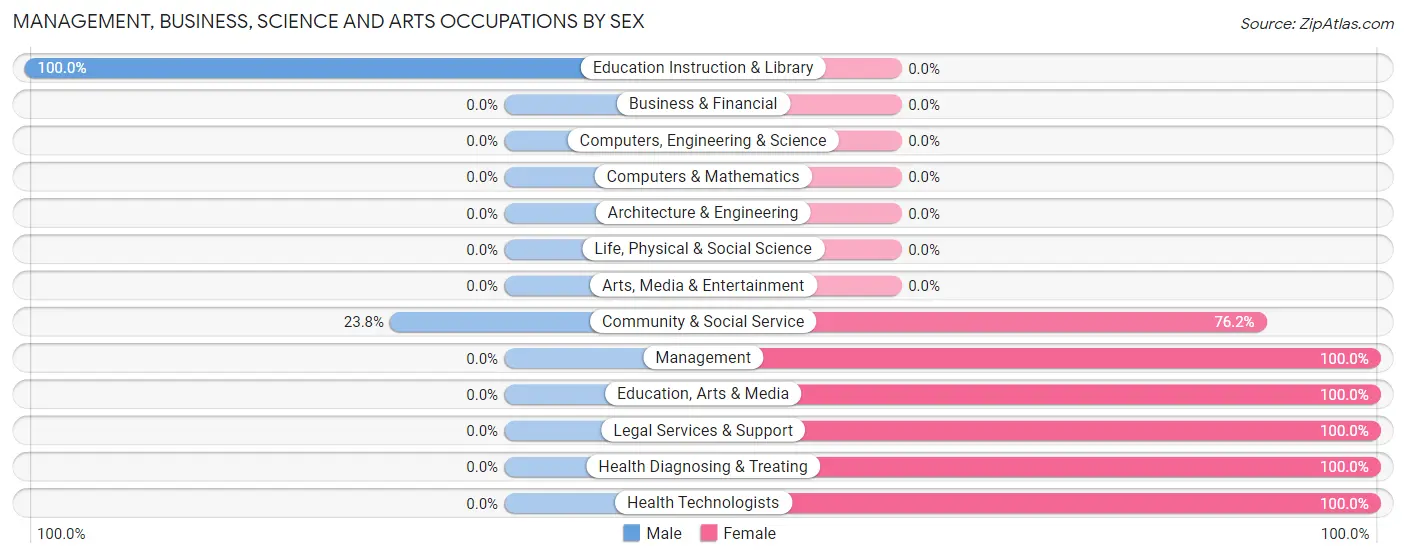
| Occupation | Male | Female |
| Management | 0 (0.0%) | 38 (100.0%) |
| Business & Financial | 0 (0.0%) | 0 (0.0%) |
| Computers, Engineering & Science | 0 (0.0%) | 0 (0.0%) |
| Computers & Mathematics | 0 (0.0%) | 0 (0.0%) |
| Architecture & Engineering | 0 (0.0%) | 0 (0.0%) |
| Life, Physical & Social Science | 0 (0.0%) | 0 (0.0%) |
| Community & Social Service | 10 (23.8%) | 32 (76.2%) |
| Education, Arts & Media | 0 (0.0%) | 24 (100.0%) |
| Legal Services & Support | 0 (0.0%) | 8 (100.0%) |
| Education Instruction & Library | 10 (100.0%) | 0 (0.0%) |
| Arts, Media & Entertainment | 0 (0.0%) | 0 (0.0%) |
| Health Diagnosing & Treating | 0 (0.0%) | 21 (100.0%) |
| Health Technologists | 0 (0.0%) | 21 (100.0%) |
| Total (Category) | 10 (9.9%) | 91 (90.1%) |
| Total (Overall) | 135 (37.9%) | 221 (62.1%) |
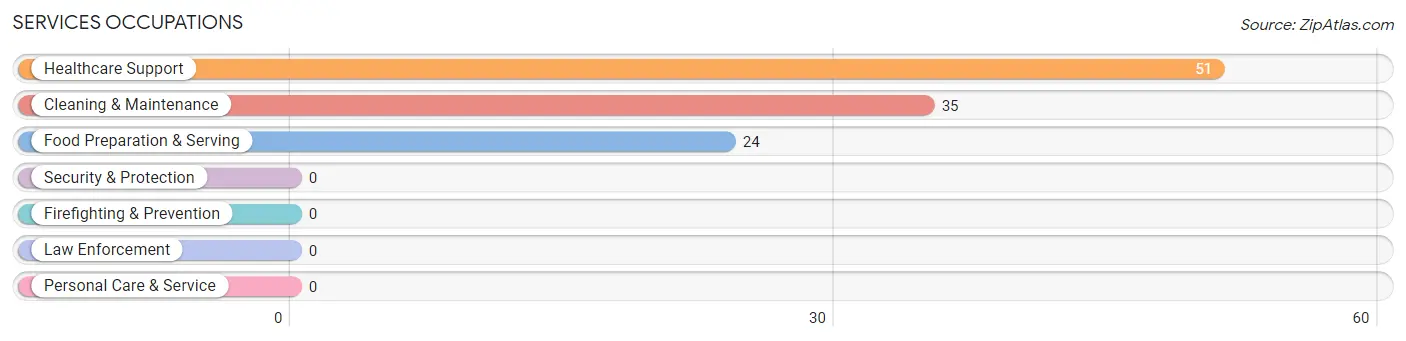
Services Occupations
The most common Services occupations in Olimpo are Healthcare Support (51 | 14.3%), Cleaning & Maintenance (35 | 9.8%), and Food Preparation & Serving (24 | 6.7%).
Services Occupations by Sex
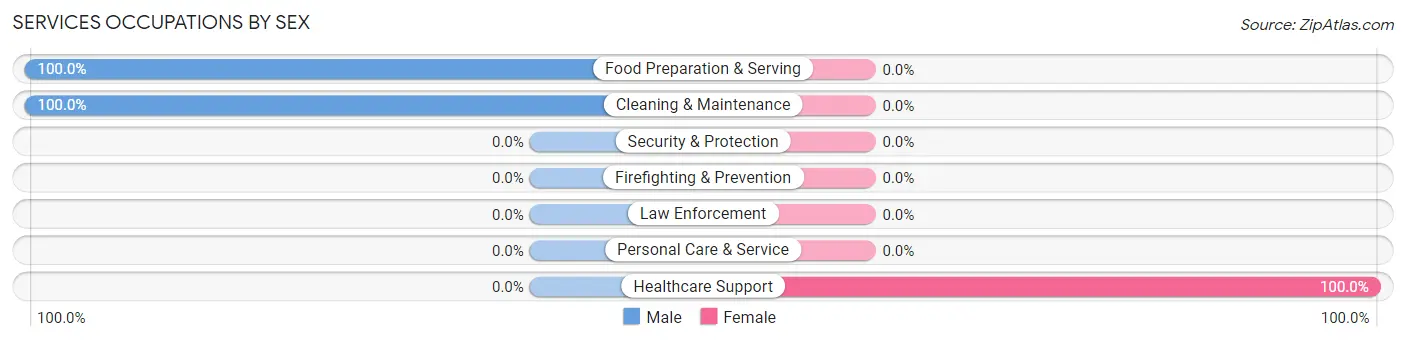
| Occupation | Male | Female |
| Healthcare Support | 0 (0.0%) | 51 (100.0%) |
| Security & Protection | 0 (0.0%) | 0 (0.0%) |
| Firefighting & Prevention | 0 (0.0%) | 0 (0.0%) |
| Law Enforcement | 0 (0.0%) | 0 (0.0%) |
| Food Preparation & Serving | 24 (100.0%) | 0 (0.0%) |
| Cleaning & Maintenance | 35 (100.0%) | 0 (0.0%) |
| Personal Care & Service | 0 (0.0%) | 0 (0.0%) |
| Total (Category) | 59 (53.6%) | 51 (46.4%) |
| Total (Overall) | 135 (37.9%) | 221 (62.1%) |
Sales and Office Occupations
The most common Sales and Office occupations in Olimpo are Office & Administration (99 | 27.8%), and Sales & Related (38 | 10.7%).
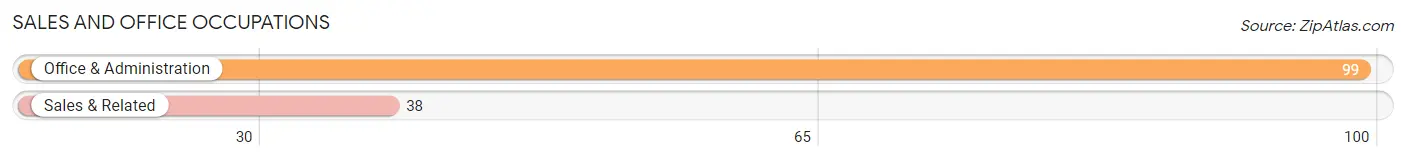
Sales and Office Occupations by Sex
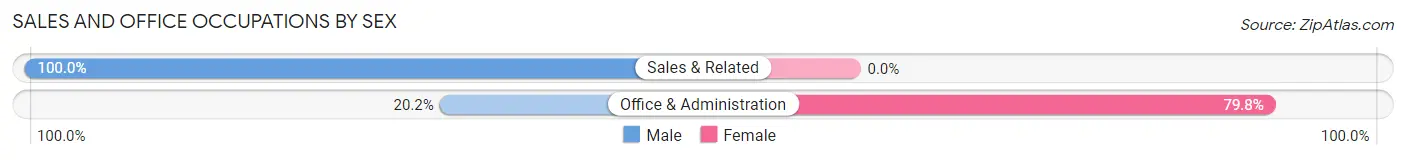
| Occupation | Male | Female |
| Sales & Related | 38 (100.0%) | 0 (0.0%) |
| Office & Administration | 20 (20.2%) | 79 (79.8%) |
| Total (Category) | 58 (42.3%) | 79 (57.7%) |
| Total (Overall) | 135 (37.9%) | 221 (62.1%) |
Natural Resources, Construction and Maintenance Occupations
The most common Natural Resources, Construction and Maintenance occupations in Olimpo are , and Installation, Maintenance & Repair (8 | 2.2%).
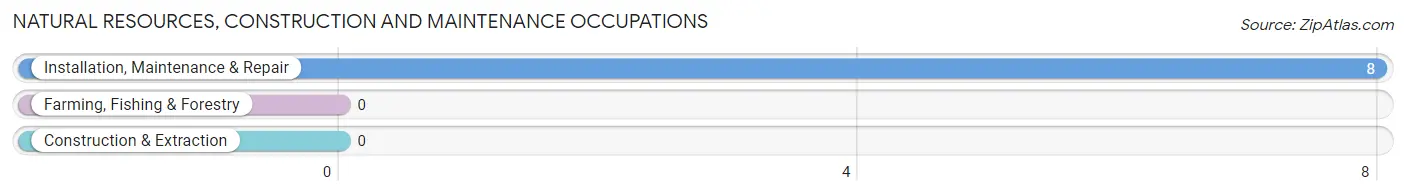
Natural Resources, Construction and Maintenance Occupations by Sex
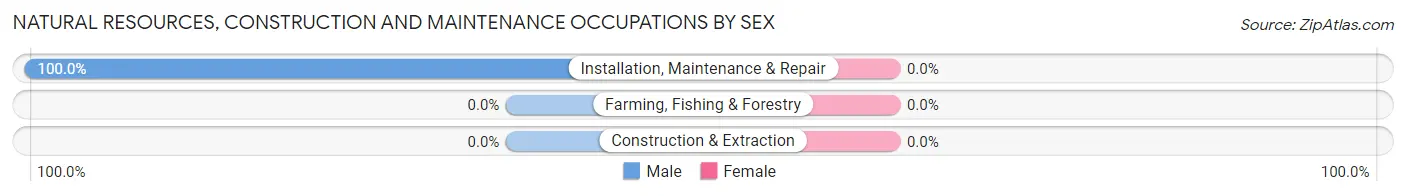
| Occupation | Male | Female |
| Farming, Fishing & Forestry | 0 (0.0%) | 0 (0.0%) |
| Construction & Extraction | 0 (0.0%) | 0 (0.0%) |
| Installation, Maintenance & Repair | 8 (100.0%) | 0 (0.0%) |
| Total (Category) | 8 (100.0%) | 0 (0.0%) |
| Total (Overall) | 135 (37.9%) | 221 (62.1%) |
Production, Transportation and Moving Occupations
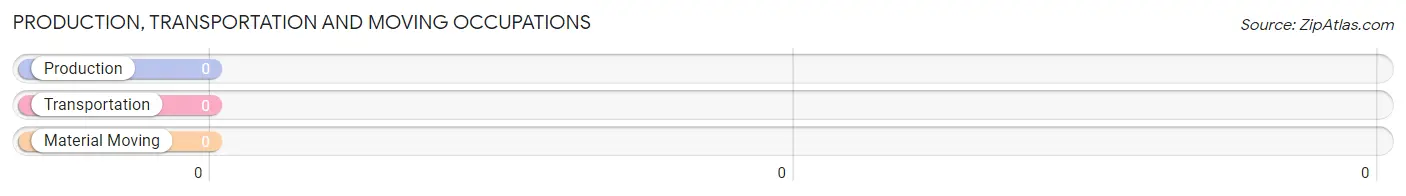
Production, Transportation and Moving Occupations by Sex
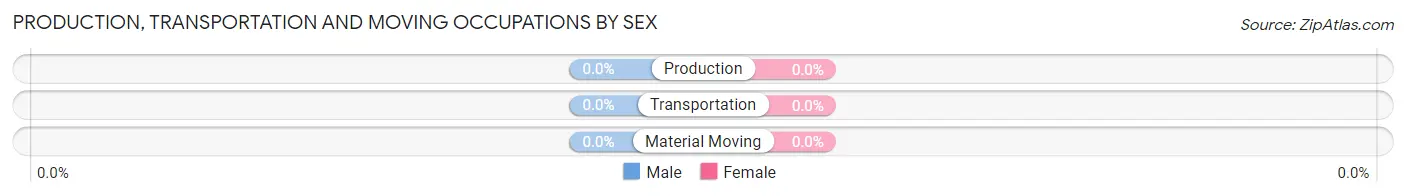
| Occupation | Male | Female |
| Production | 0 (0.0%) | 0 (0.0%) |
| Transportation | 0 (0.0%) | 0 (0.0%) |
| Material Moving | 0 (0.0%) | 0 (0.0%) |
| Total (Category) | 0 (0.0%) | 0 (0.0%) |
| Total (Overall) | 135 (37.9%) | 221 (62.1%) |
Employment Industries by Sex in Olimpo
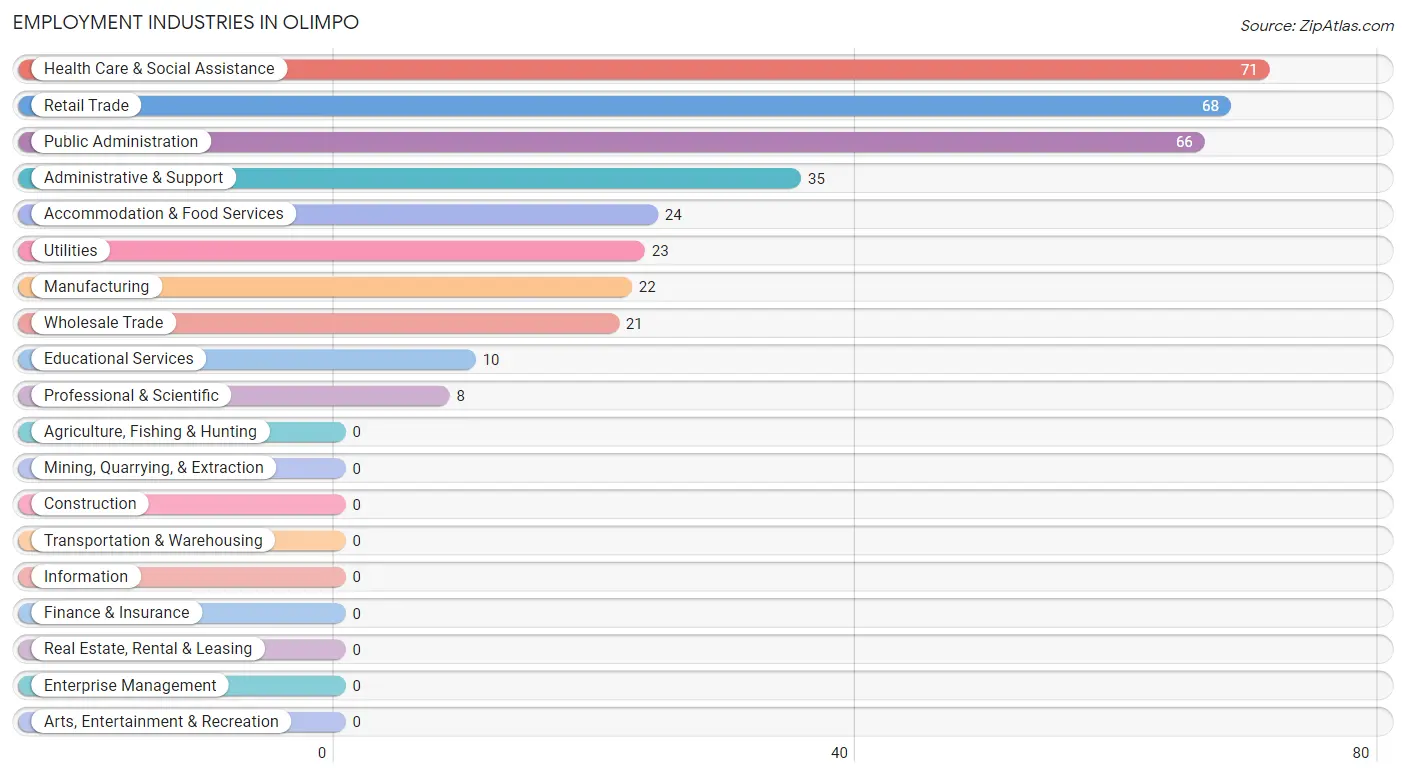
Employment Industries in Olimpo
The major employment industries in Olimpo include Health Care & Social Assistance (71 | 19.9%), Retail Trade (68 | 19.1%), Public Administration (66 | 18.5%), Administrative & Support (35 | 9.8%), and Accommodation & Food Services (24 | 6.7%).
Employment Industries by Sex in Olimpo
The Olimpo industries that see more men than women are Wholesale Trade (100.0%), Administrative & Support (100.0%), and Educational Services (100.0%), whereas the industries that tend to have a higher number of women are Manufacturing (100.0%), Utilities (100.0%), and Professional & Scientific (100.0%).
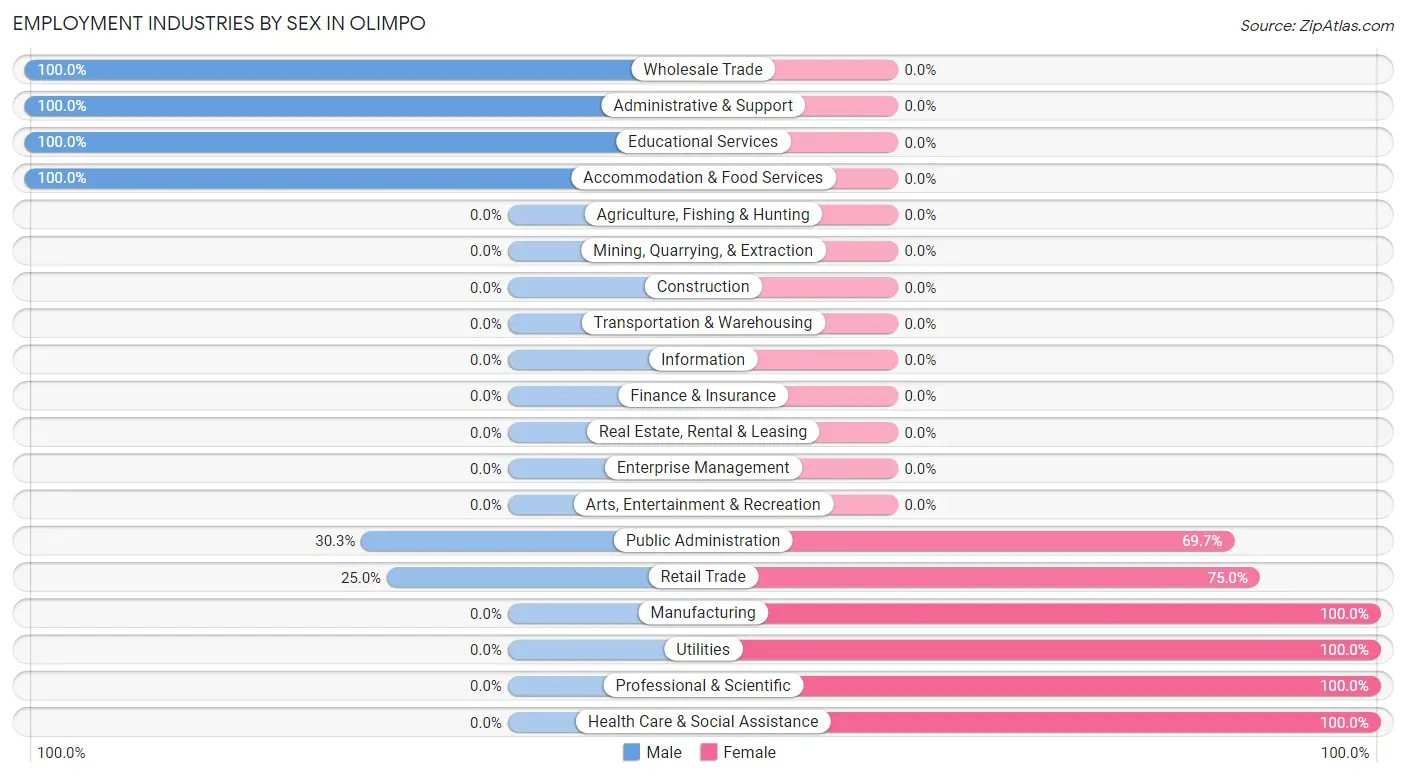
| Industry | Male | Female |
| Agriculture, Fishing & Hunting | 0 (0.0%) | 0 (0.0%) |
| Mining, Quarrying, & Extraction | 0 (0.0%) | 0 (0.0%) |
| Construction | 0 (0.0%) | 0 (0.0%) |
| Manufacturing | 0 (0.0%) | 22 (100.0%) |
| Wholesale Trade | 21 (100.0%) | 0 (0.0%) |
| Retail Trade | 17 (25.0%) | 51 (75.0%) |
| Transportation & Warehousing | 0 (0.0%) | 0 (0.0%) |
| Utilities | 0 (0.0%) | 23 (100.0%) |
| Information | 0 (0.0%) | 0 (0.0%) |
| Finance & Insurance | 0 (0.0%) | 0 (0.0%) |
| Real Estate, Rental & Leasing | 0 (0.0%) | 0 (0.0%) |
| Professional & Scientific | 0 (0.0%) | 8 (100.0%) |
| Enterprise Management | 0 (0.0%) | 0 (0.0%) |
| Administrative & Support | 35 (100.0%) | 0 (0.0%) |
| Educational Services | 10 (100.0%) | 0 (0.0%) |
| Health Care & Social Assistance | 0 (0.0%) | 71 (100.0%) |
| Arts, Entertainment & Recreation | 0 (0.0%) | 0 (0.0%) |
| Accommodation & Food Services | 24 (100.0%) | 0 (0.0%) |
| Public Administration | 20 (30.3%) | 46 (69.7%) |
| Total | 135 (37.9%) | 221 (62.1%) |
Education in Olimpo
School Enrollment in Olimpo
The most common levels of schooling among the 366 students in Olimpo are high school (167 | 45.6%), nursery / preschool (76 | 20.8%), and college / undergraduate (51 | 13.9%).
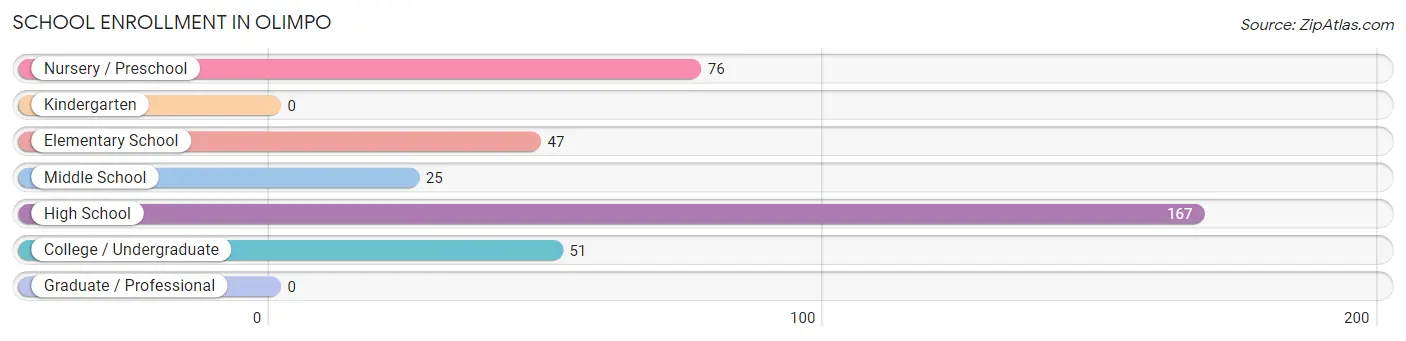
| School Level | # Students | % Students |
| Nursery / Preschool | 76 | 20.8% |
| Kindergarten | 0 | 0.0% |
| Elementary School | 47 | 12.8% |
| Middle School | 25 | 6.8% |
| High School | 167 | 45.6% |
| College / Undergraduate | 51 | 13.9% |
| Graduate / Professional | 0 | 0.0% |
| Total | 366 | 100.0% |
School Enrollment by Age by Funding Source in Olimpo
Out of a total of 366 students who are enrolled in schools in Olimpo, 32 (8.7%) attend a private institution, while the remaining 334 (91.3%) are enrolled in public schools. The age group of 35 years and over has the highest likelihood of being enrolled in private schools, with 32 (100.0% in the age bracket) enrolled. Conversely, the age group of 3 to 4 year olds has the lowest likelihood of being enrolled in a private school, with 76 (100.0% in the age bracket) attending a public institution.
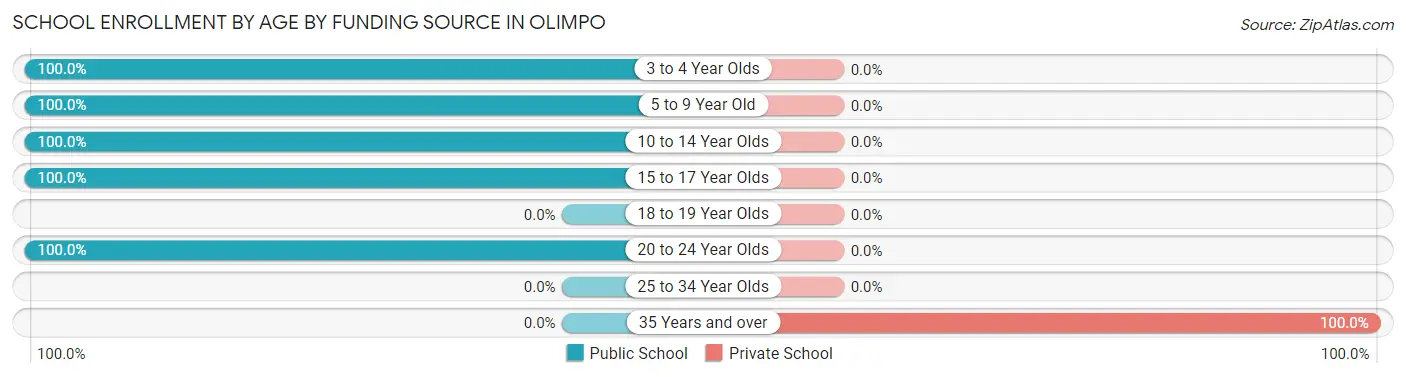
| Age Bracket | Public School | Private School |
| 3 to 4 Year Olds | 76 (100.0%) | 0 (0.0%) |
| 5 to 9 Year Old | 32 (100.0%) | 0 (0.0%) |
| 10 to 14 Year Olds | 40 (100.0%) | 0 (0.0%) |
| 15 to 17 Year Olds | 167 (100.0%) | 0 (0.0%) |
| 18 to 19 Year Olds | 0 (0.0%) | 0 (0.0%) |
| 20 to 24 Year Olds | 19 (100.0%) | 0 (0.0%) |
| 25 to 34 Year Olds | 0 (0.0%) | 0 (0.0%) |
| 35 Years and over | 0 (0.0%) | 32 (100.0%) |
| Total | 334 (91.3%) | 32 (8.7%) |
Educational Attainment by Field of Study in Olimpo
Business (89 | 47.6%), science & technology (48 | 25.7%), psychology (24 | 12.8%), arts & humanities (16 | 8.6%), and social sciences (10 | 5.3%) are the most common fields of study among 187 individuals in Olimpo who have obtained a bachelor's degree or higher.
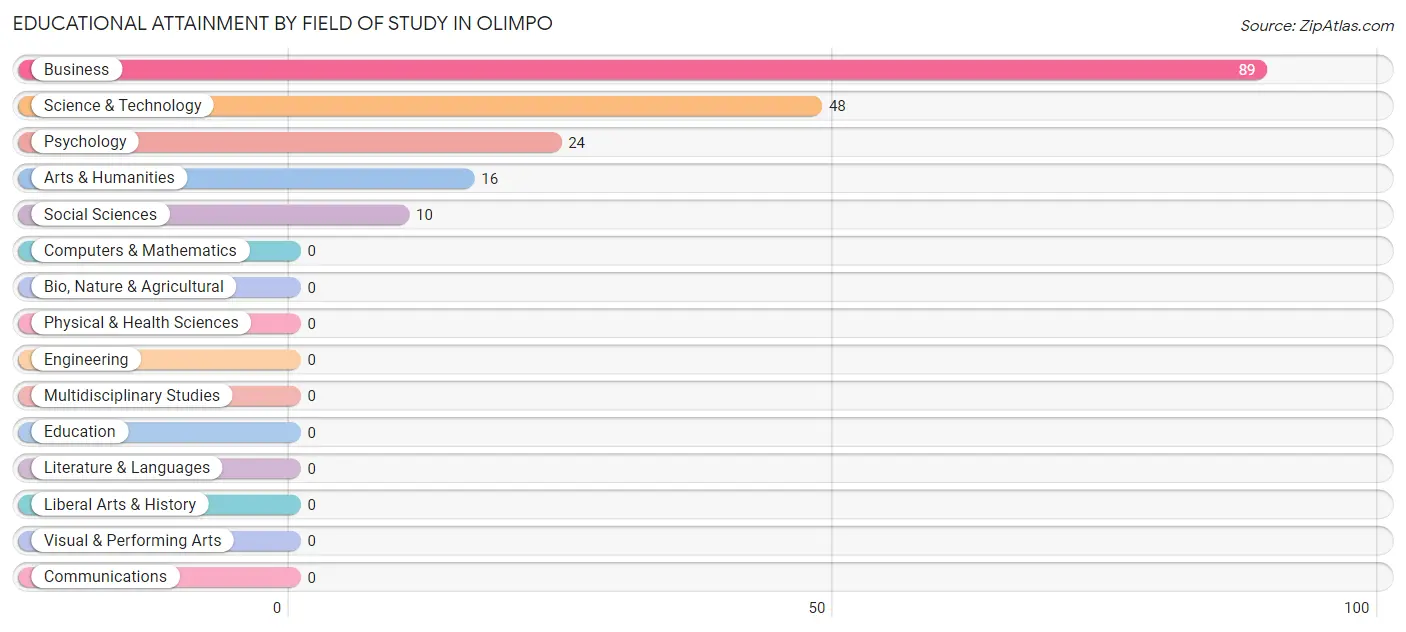
| Field of Study | # Graduates | % Graduates |
| Computers & Mathematics | 0 | 0.0% |
| Bio, Nature & Agricultural | 0 | 0.0% |
| Physical & Health Sciences | 0 | 0.0% |
| Psychology | 24 | 12.8% |
| Social Sciences | 10 | 5.3% |
| Engineering | 0 | 0.0% |
| Multidisciplinary Studies | 0 | 0.0% |
| Science & Technology | 48 | 25.7% |
| Business | 89 | 47.6% |
| Education | 0 | 0.0% |
| Literature & Languages | 0 | 0.0% |
| Liberal Arts & History | 0 | 0.0% |
| Visual & Performing Arts | 0 | 0.0% |
| Communications | 0 | 0.0% |
| Arts & Humanities | 16 | 8.6% |
| Total | 187 | 100.0% |
Transportation & Commute in Olimpo
Vehicle Availability by Sex in Olimpo
The most prevalent vehicle ownership categories in Olimpo are males with 2 vehicles (81, accounting for 60.0%) and females with 2 vehicles (22, making up 44.3%).
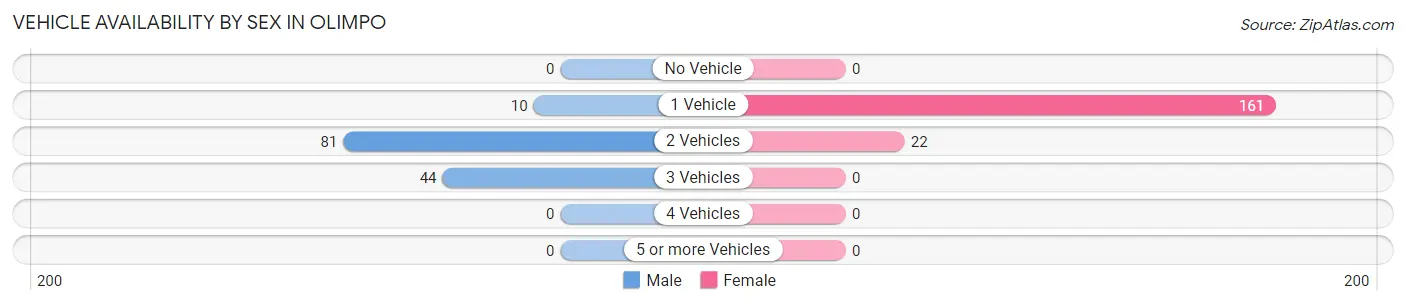
| Vehicles Available | Male | Female |
| No Vehicle | 0 (0.0%) | 0 (0.0%) |
| 1 Vehicle | 10 (7.4%) | 161 (88.0%) |
| 2 Vehicles | 81 (60.0%) | 22 (12.0%) |
| 3 Vehicles | 44 (32.6%) | 0 (0.0%) |
| 4 Vehicles | 0 (0.0%) | 0 (0.0%) |
| 5 or more Vehicles | 0 (0.0%) | 0 (0.0%) |
| Total | 135 (100.0%) | 183 (100.0%) |
Commute Time in Olimpo
The most frequently occuring commute durations in Olimpo are 30 to 34 minutes (103 commuters, 34.7%), 40 to 44 minutes (59 commuters, 19.9%), and 10 to 14 minutes (46 commuters, 15.5%).
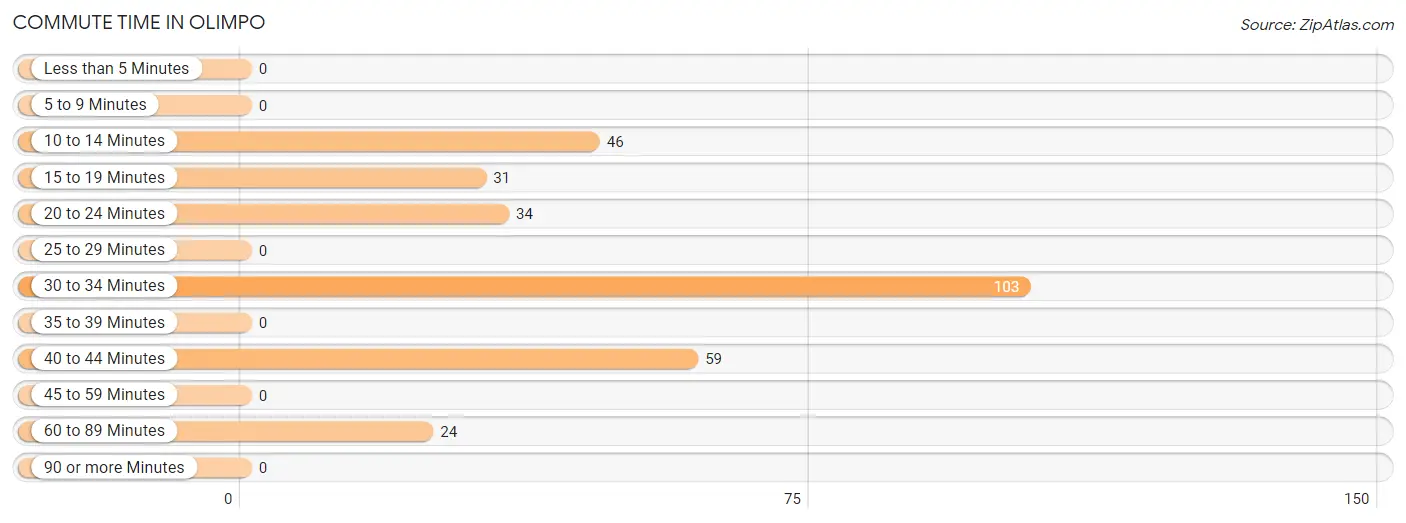
| Commute Time | # Commuters | % Commuters |
| Less than 5 Minutes | 0 | 0.0% |
| 5 to 9 Minutes | 0 | 0.0% |
| 10 to 14 Minutes | 46 | 15.5% |
| 15 to 19 Minutes | 31 | 10.4% |
| 20 to 24 Minutes | 34 | 11.5% |
| 25 to 29 Minutes | 0 | 0.0% |
| 30 to 34 Minutes | 103 | 34.7% |
| 35 to 39 Minutes | 0 | 0.0% |
| 40 to 44 Minutes | 59 | 19.9% |
| 45 to 59 Minutes | 0 | 0.0% |
| 60 to 89 Minutes | 24 | 8.1% |
| 90 or more Minutes | 0 | 0.0% |
Commute Time by Sex in Olimpo
The most common commute times in Olimpo are 40 to 44 minutes (59 commuters, 51.7%) for males and 30 to 34 minutes (73 commuters, 39.9%) for females.
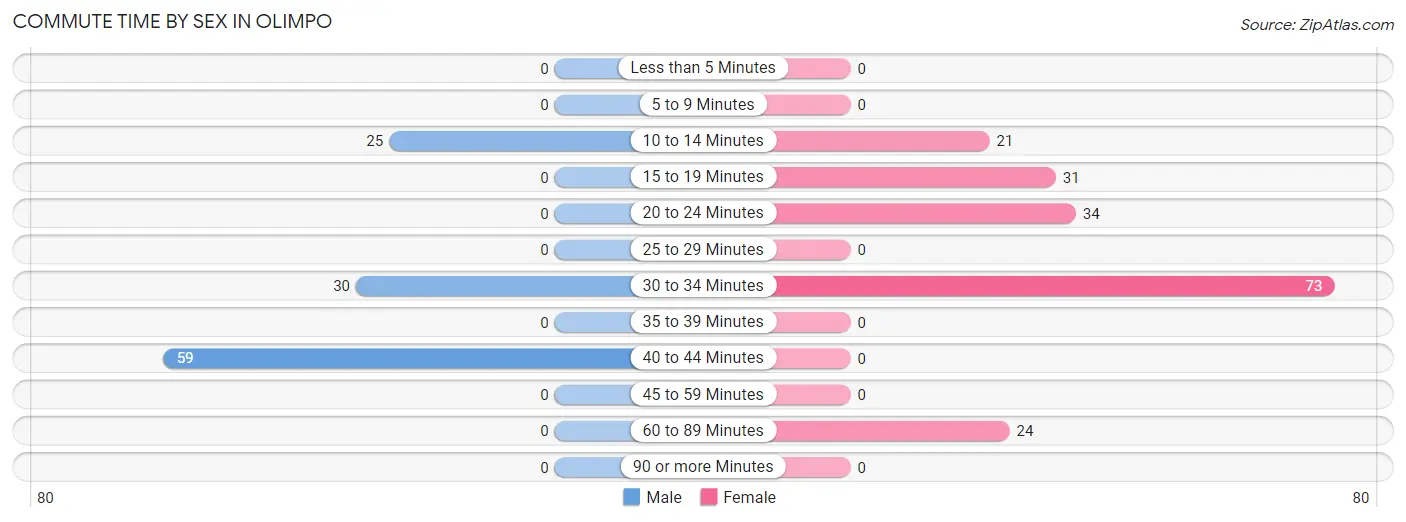
| Commute Time | Male | Female |
| Less than 5 Minutes | 0 (0.0%) | 0 (0.0%) |
| 5 to 9 Minutes | 0 (0.0%) | 0 (0.0%) |
| 10 to 14 Minutes | 25 (21.9%) | 21 (11.5%) |
| 15 to 19 Minutes | 0 (0.0%) | 31 (16.9%) |
| 20 to 24 Minutes | 0 (0.0%) | 34 (18.6%) |
| 25 to 29 Minutes | 0 (0.0%) | 0 (0.0%) |
| 30 to 34 Minutes | 30 (26.3%) | 73 (39.9%) |
| 35 to 39 Minutes | 0 (0.0%) | 0 (0.0%) |
| 40 to 44 Minutes | 59 (51.7%) | 0 (0.0%) |
| 45 to 59 Minutes | 0 (0.0%) | 0 (0.0%) |
| 60 to 89 Minutes | 0 (0.0%) | 24 (13.1%) |
| 90 or more Minutes | 0 (0.0%) | 0 (0.0%) |
Time of Departure to Work by Sex in Olimpo
The most frequent times of departure to work in Olimpo are 6:30 AM to 6:59 AM (54, 47.4%) for males and 5:00 AM to 5:29 AM (75, 41.0%) for females.
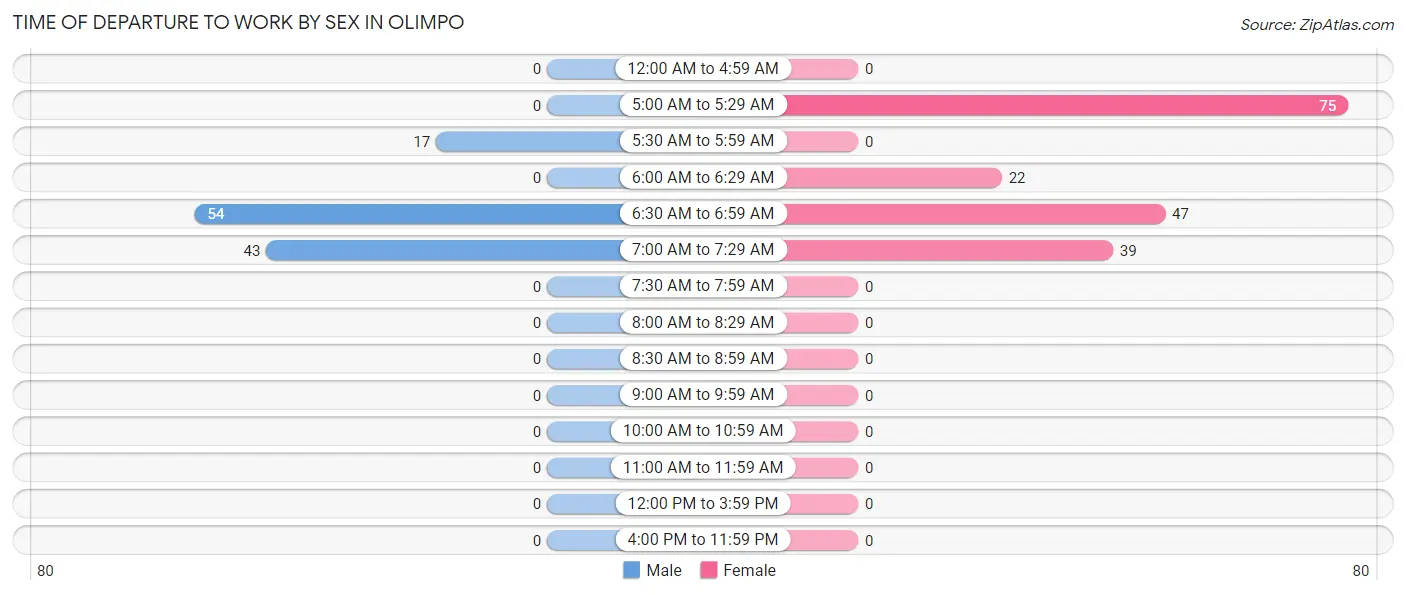
| Time of Departure | Male | Female |
| 12:00 AM to 4:59 AM | 0 (0.0%) | 0 (0.0%) |
| 5:00 AM to 5:29 AM | 0 (0.0%) | 75 (41.0%) |
| 5:30 AM to 5:59 AM | 17 (14.9%) | 0 (0.0%) |
| 6:00 AM to 6:29 AM | 0 (0.0%) | 22 (12.0%) |
| 6:30 AM to 6:59 AM | 54 (47.4%) | 47 (25.7%) |
| 7:00 AM to 7:29 AM | 43 (37.7%) | 39 (21.3%) |
| 7:30 AM to 7:59 AM | 0 (0.0%) | 0 (0.0%) |
| 8:00 AM to 8:29 AM | 0 (0.0%) | 0 (0.0%) |
| 8:30 AM to 8:59 AM | 0 (0.0%) | 0 (0.0%) |
| 9:00 AM to 9:59 AM | 0 (0.0%) | 0 (0.0%) |
| 10:00 AM to 10:59 AM | 0 (0.0%) | 0 (0.0%) |
| 11:00 AM to 11:59 AM | 0 (0.0%) | 0 (0.0%) |
| 12:00 PM to 3:59 PM | 0 (0.0%) | 0 (0.0%) |
| 4:00 PM to 11:59 PM | 0 (0.0%) | 0 (0.0%) |
| Total | 114 (100.0%) | 183 (100.0%) |
Housing Occupancy in Olimpo
Occupancy by Ownership in Olimpo
Of the total 662 dwellings in Olimpo, owner-occupied units account for 604 (91.2%), while renter-occupied units make up 58 (8.8%).
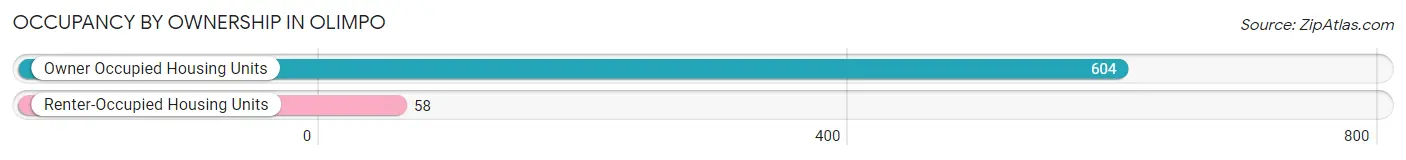
| Occupancy | # Housing Units | % Housing Units |
| Owner Occupied Housing Units | 604 | 91.2% |
| Renter-Occupied Housing Units | 58 | 8.8% |
| Total Occupied Housing Units | 662 | 100.0% |
Occupancy by Household Size in Olimpo
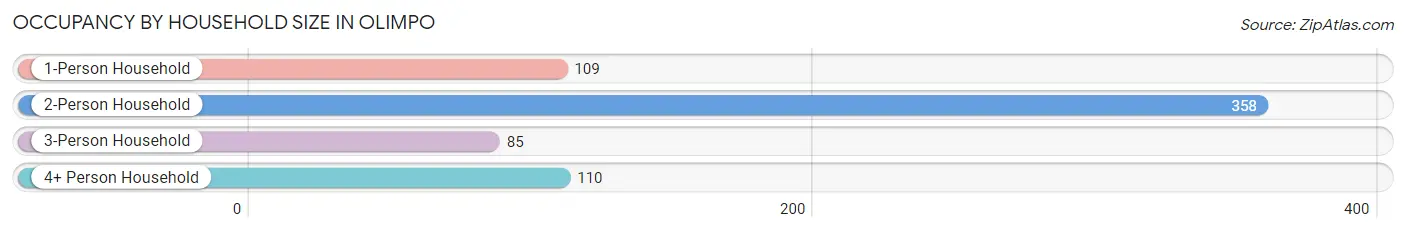
| Household Size | # Housing Units | % Housing Units |
| 1-Person Household | 109 | 16.5% |
| 2-Person Household | 358 | 54.1% |
| 3-Person Household | 85 | 12.8% |
| 4+ Person Household | 110 | 16.6% |
| Total Housing Units | 662 | 100.0% |
Occupancy by Ownership by Household Size in Olimpo
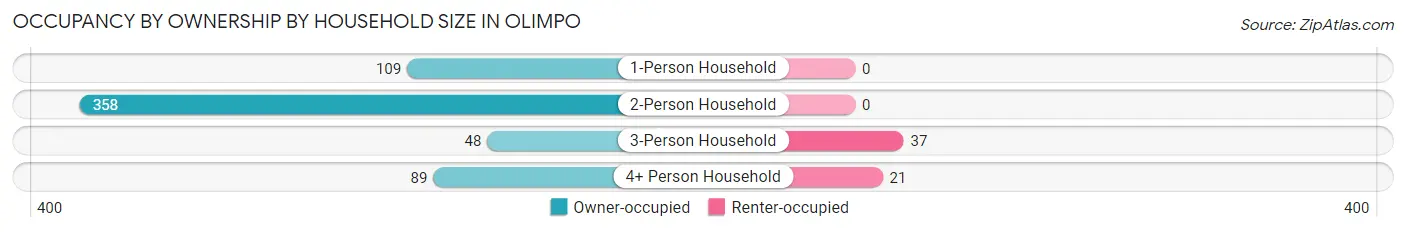
| Household Size | Owner-occupied | Renter-occupied |
| 1-Person Household | 109 (100.0%) | 0 (0.0%) |
| 2-Person Household | 358 (100.0%) | 0 (0.0%) |
| 3-Person Household | 48 (56.5%) | 37 (43.5%) |
| 4+ Person Household | 89 (80.9%) | 21 (19.1%) |
| Total Housing Units | 604 (91.2%) | 58 (8.8%) |
Occupancy by Educational Attainment in Olimpo
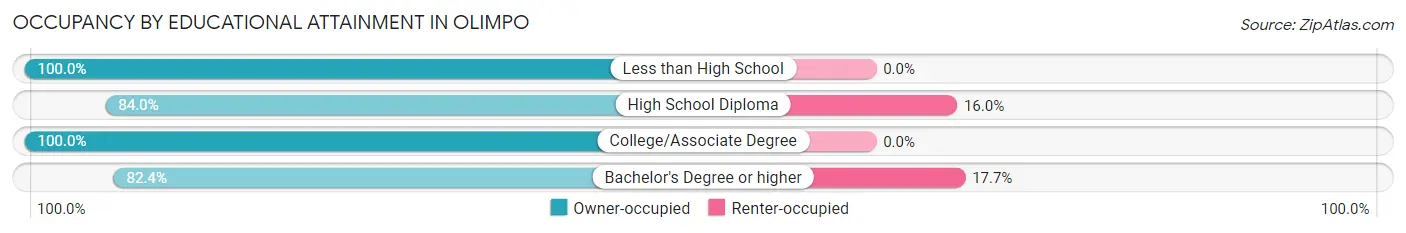
| Household Size | Owner-occupied | Renter-occupied |
| Less than High School | 214 (100.0%) | 0 (0.0%) |
| High School Diploma | 194 (84.0%) | 37 (16.0%) |
| College/Associate Degree | 98 (100.0%) | 0 (0.0%) |
| Bachelor's Degree or higher | 98 (82.4%) | 21 (17.6%) |
Occupancy by Age of Householder in Olimpo
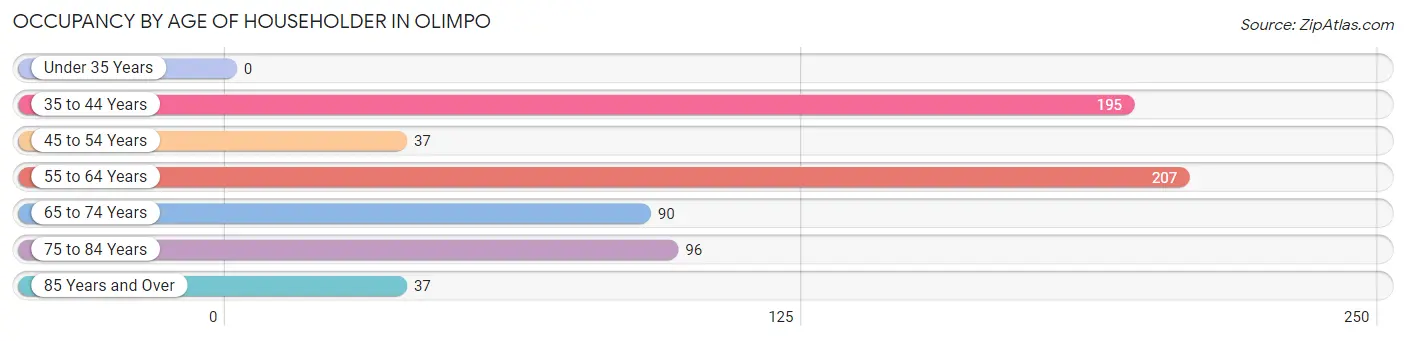
| Age Bracket | # Households | % Households |
| Under 35 Years | 0 | 0.0% |
| 35 to 44 Years | 195 | 29.5% |
| 45 to 54 Years | 37 | 5.6% |
| 55 to 64 Years | 207 | 31.3% |
| 65 to 74 Years | 90 | 13.6% |
| 75 to 84 Years | 96 | 14.5% |
| 85 Years and Over | 37 | 5.6% |
| Total | 662 | 100.0% |
Housing Finances in Olimpo
Median Income by Occupancy in Olimpo
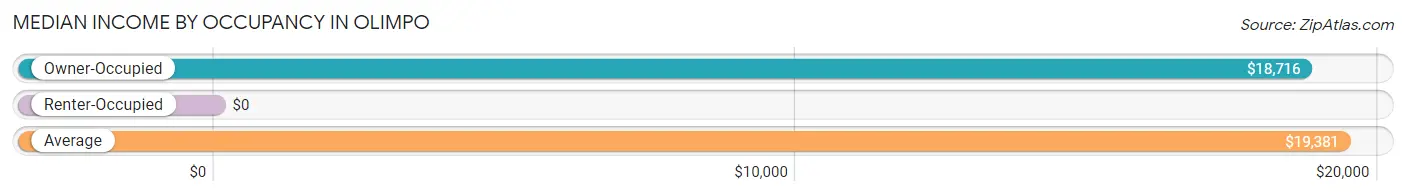
| Occupancy Type | # Households | Median Income |
| Owner-Occupied | 604 (91.2%) | $18,716 |
| Renter-Occupied | 58 (8.8%) | $0 |
| Average | 662 (100.0%) | $19,381 |
Occupancy by Householder Income Bracket in Olimpo
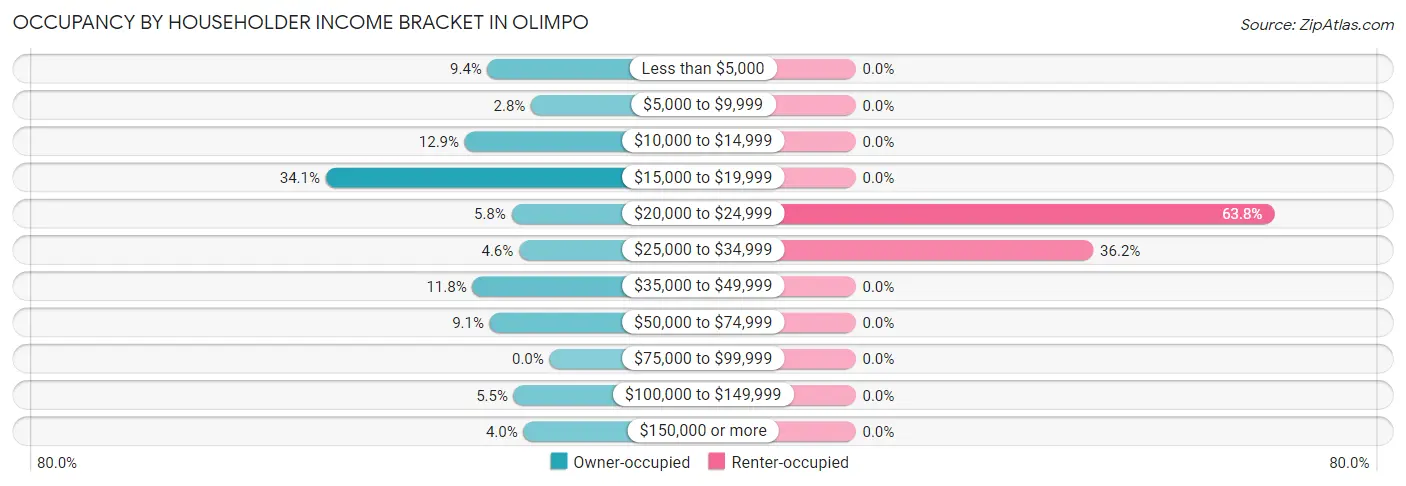
| Income Bracket | Owner-occupied | Renter-occupied |
| Less than $5,000 | 57 (9.4%) | 0 (0.0%) |
| $5,000 to $9,999 | 17 (2.8%) | 0 (0.0%) |
| $10,000 to $14,999 | 78 (12.9%) | 0 (0.0%) |
| $15,000 to $19,999 | 206 (34.1%) | 0 (0.0%) |
| $20,000 to $24,999 | 35 (5.8%) | 37 (63.8%) |
| $25,000 to $34,999 | 28 (4.6%) | 21 (36.2%) |
| $35,000 to $49,999 | 71 (11.7%) | 0 (0.0%) |
| $50,000 to $74,999 | 55 (9.1%) | 0 (0.0%) |
| $75,000 to $99,999 | 0 (0.0%) | 0 (0.0%) |
| $100,000 to $149,999 | 33 (5.5%) | 0 (0.0%) |
| $150,000 or more | 24 (4.0%) | 0 (0.0%) |
| Total | 604 (100.0%) | 58 (100.0%) |
Monthly Housing Cost Tiers in Olimpo
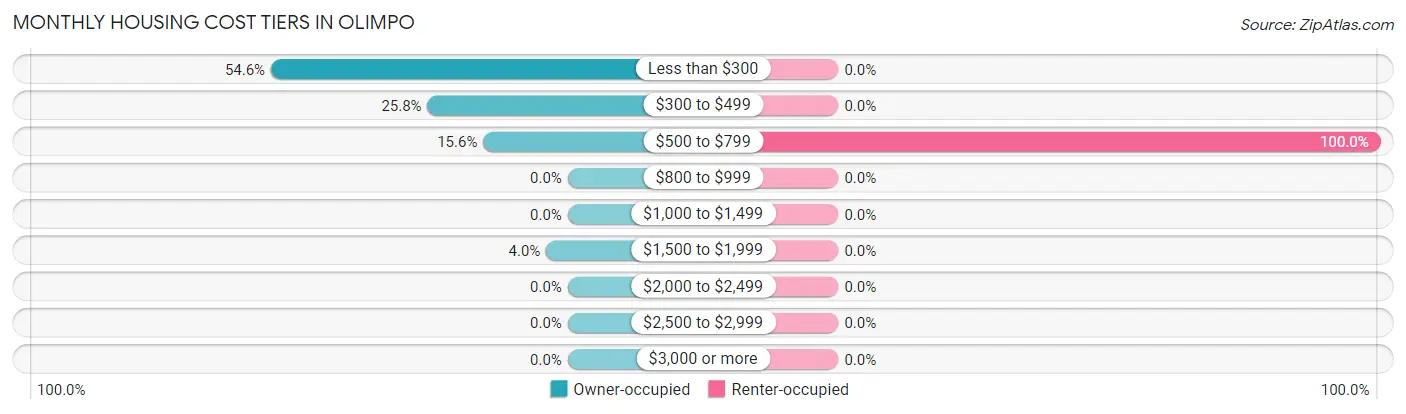
| Monthly Cost | Owner-occupied | Renter-occupied |
| Less than $300 | 330 (54.6%) | 0 (0.0%) |
| $300 to $499 | 156 (25.8%) | 0 (0.0%) |
| $500 to $799 | 94 (15.6%) | 58 (100.0%) |
| $800 to $999 | 0 (0.0%) | 0 (0.0%) |
| $1,000 to $1,499 | 0 (0.0%) | 0 (0.0%) |
| $1,500 to $1,999 | 24 (4.0%) | 0 (0.0%) |
| $2,000 to $2,499 | 0 (0.0%) | 0 (0.0%) |
| $2,500 to $2,999 | 0 (0.0%) | 0 (0.0%) |
| $3,000 or more | 0 (0.0%) | 0 (0.0%) |
| Total | 604 (100.0%) | 58 (100.0%) |
Physical Housing Characteristics in Olimpo
Housing Structures in Olimpo
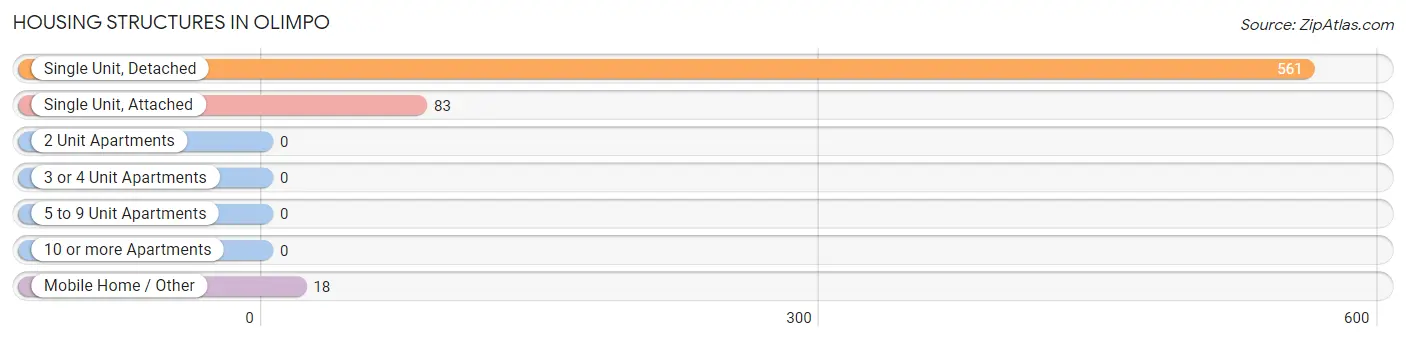
| Structure Type | # Housing Units | % Housing Units |
| Single Unit, Detached | 561 | 84.7% |
| Single Unit, Attached | 83 | 12.5% |
| 2 Unit Apartments | 0 | 0.0% |
| 3 or 4 Unit Apartments | 0 | 0.0% |
| 5 to 9 Unit Apartments | 0 | 0.0% |
| 10 or more Apartments | 0 | 0.0% |
| Mobile Home / Other | 18 | 2.7% |
| Total | 662 | 100.0% |
Housing Structures by Occupancy in Olimpo
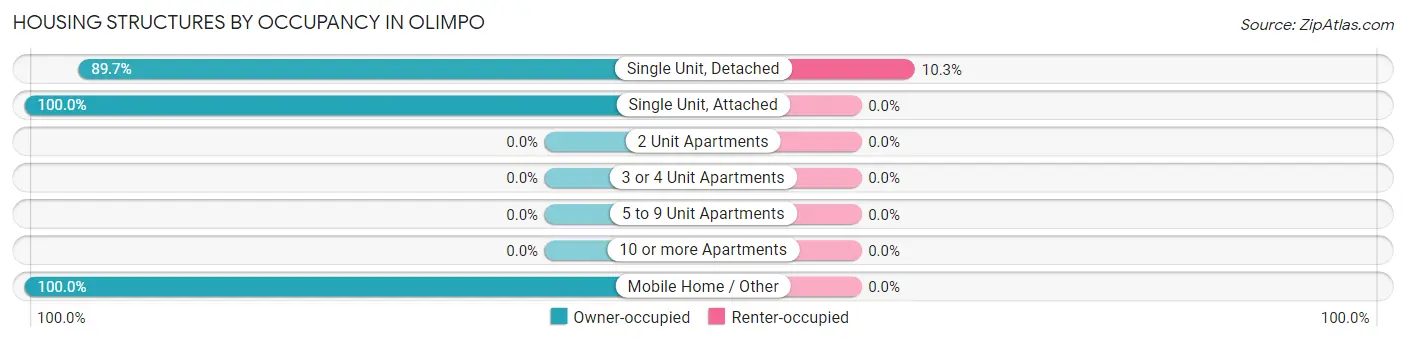
| Structure Type | Owner-occupied | Renter-occupied |
| Single Unit, Detached | 503 (89.7%) | 58 (10.3%) |
| Single Unit, Attached | 83 (100.0%) | 0 (0.0%) |
| 2 Unit Apartments | 0 (0.0%) | 0 (0.0%) |
| 3 or 4 Unit Apartments | 0 (0.0%) | 0 (0.0%) |
| 5 to 9 Unit Apartments | 0 (0.0%) | 0 (0.0%) |
| 10 or more Apartments | 0 (0.0%) | 0 (0.0%) |
| Mobile Home / Other | 18 (100.0%) | 0 (0.0%) |
| Total | 604 (91.2%) | 58 (8.8%) |
Housing Structures by Number of Rooms in Olimpo
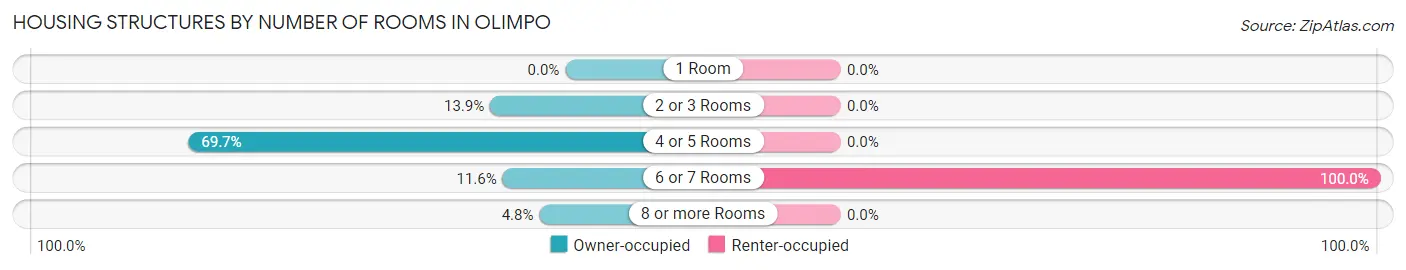
| Number of Rooms | Owner-occupied | Renter-occupied |
| 1 Room | 0 (0.0%) | 0 (0.0%) |
| 2 or 3 Rooms | 84 (13.9%) | 0 (0.0%) |
| 4 or 5 Rooms | 421 (69.7%) | 0 (0.0%) |
| 6 or 7 Rooms | 70 (11.6%) | 58 (100.0%) |
| 8 or more Rooms | 29 (4.8%) | 0 (0.0%) |
| Total | 604 (100.0%) | 58 (100.0%) |
Housing Structure by Heating Type in Olimpo
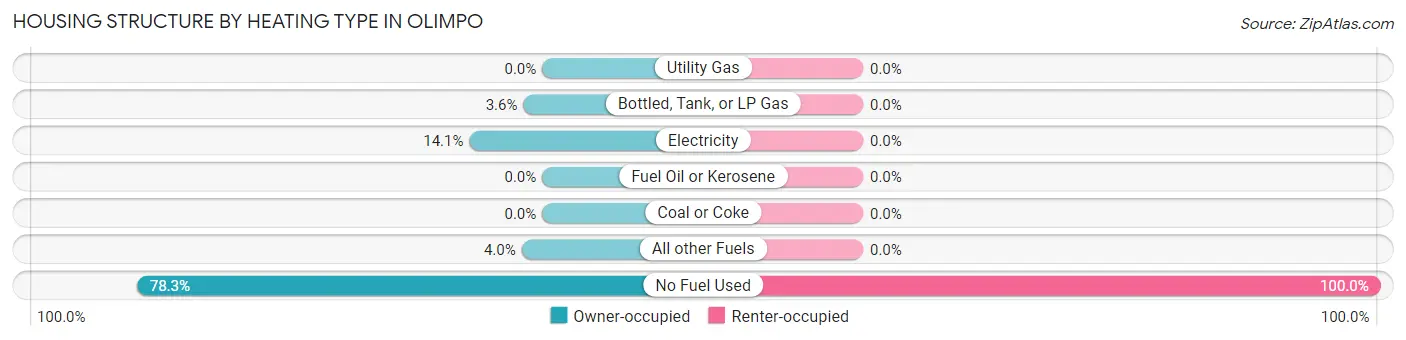
| Heating Type | Owner-occupied | Renter-occupied |
| Utility Gas | 0 (0.0%) | 0 (0.0%) |
| Bottled, Tank, or LP Gas | 22 (3.6%) | 0 (0.0%) |
| Electricity | 85 (14.1%) | 0 (0.0%) |
| Fuel Oil or Kerosene | 0 (0.0%) | 0 (0.0%) |
| Coal or Coke | 0 (0.0%) | 0 (0.0%) |
| All other Fuels | 24 (4.0%) | 0 (0.0%) |
| No Fuel Used | 473 (78.3%) | 58 (100.0%) |
| Total | 604 (100.0%) | 58 (100.0%) |
Household Vehicle Usage in Olimpo
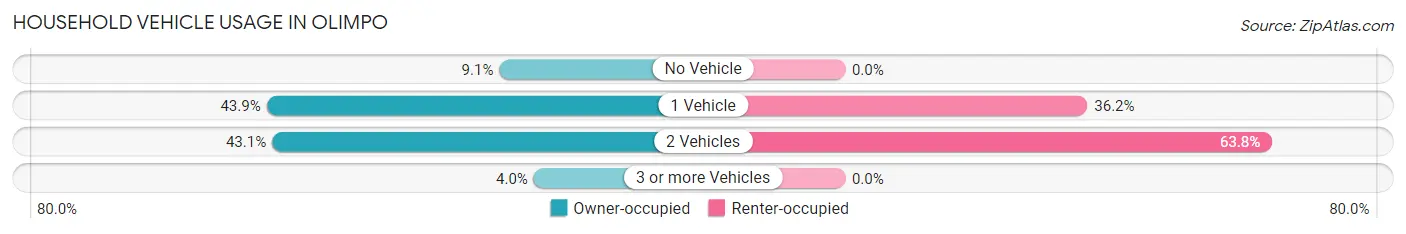
| Vehicles per Household | Owner-occupied | Renter-occupied |
| No Vehicle | 55 (9.1%) | 0 (0.0%) |
| 1 Vehicle | 265 (43.9%) | 21 (36.2%) |
| 2 Vehicles | 260 (43.0%) | 37 (63.8%) |
| 3 or more Vehicles | 24 (4.0%) | 0 (0.0%) |
| Total | 604 (100.0%) | 58 (100.0%) |
Real Estate & Mortgages in Olimpo
Real Estate and Mortgage Overview in Olimpo
| Characteristic | Without Mortgage | With Mortgage |
| Housing Units | 485 | 119 |
| Median Property Value | $91,500 | $99,100 |
| Median Household Income | $17,741 | $24 |
| Monthly Housing Costs | $190 | $0 |
| Real Estate Taxes | - | - |
Property Value by Mortgage Status in Olimpo
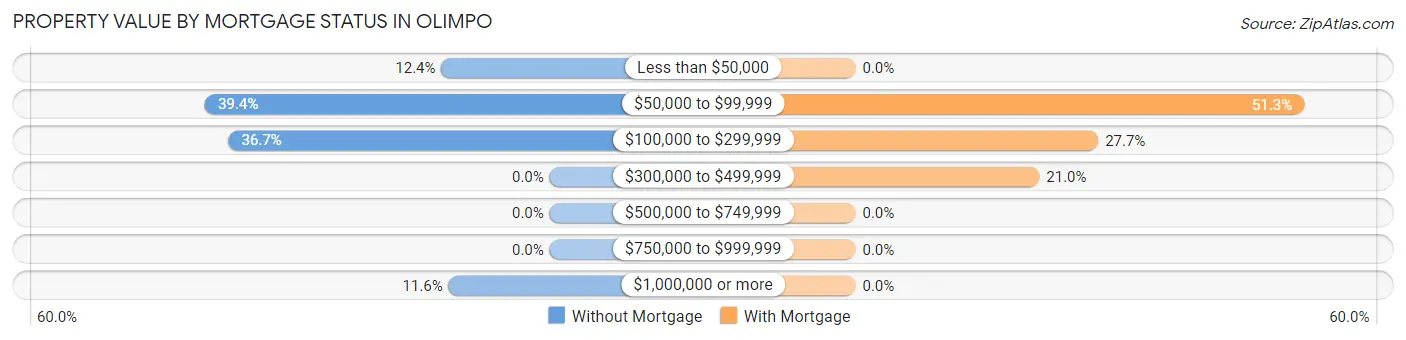
| Property Value | Without Mortgage | With Mortgage |
| Less than $50,000 | 60 (12.4%) | 0 (0.0%) |
| $50,000 to $99,999 | 191 (39.4%) | 61 (51.3%) |
| $100,000 to $299,999 | 178 (36.7%) | 33 (27.7%) |
| $300,000 to $499,999 | 0 (0.0%) | 25 (21.0%) |
| $500,000 to $749,999 | 0 (0.0%) | 0 (0.0%) |
| $750,000 to $999,999 | 0 (0.0%) | 0 (0.0%) |
| $1,000,000 or more | 56 (11.6%) | 0 (0.0%) |
| Total | 485 (100.0%) | 119 (100.0%) |
Household Income by Mortgage Status in Olimpo
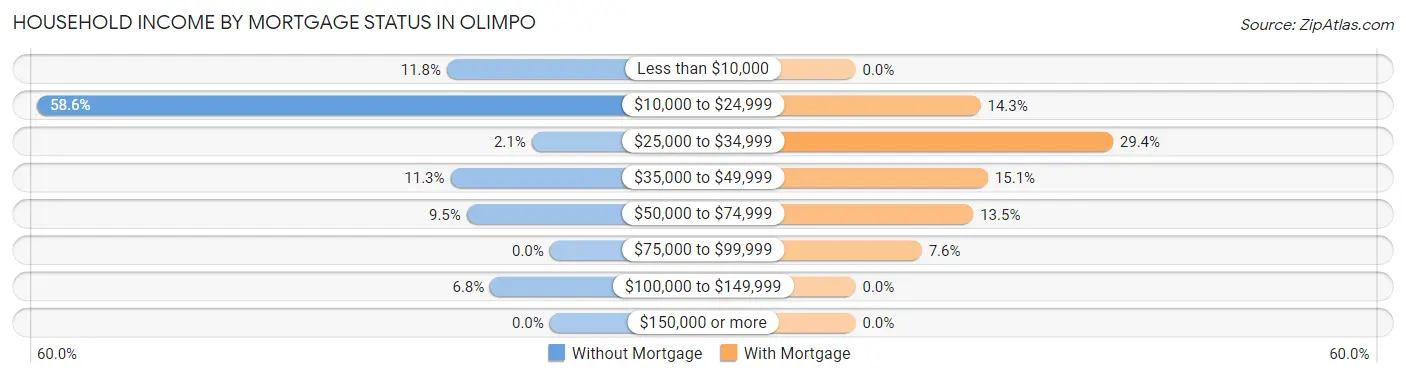
| Household Income | Without Mortgage | With Mortgage |
| Less than $10,000 | 57 (11.7%) | 0 (0.0%) |
| $10,000 to $24,999 | 284 (58.6%) | 17 (14.3%) |
| $25,000 to $34,999 | 10 (2.1%) | 35 (29.4%) |
| $35,000 to $49,999 | 55 (11.3%) | 18 (15.1%) |
| $50,000 to $74,999 | 46 (9.5%) | 16 (13.5%) |
| $75,000 to $99,999 | 0 (0.0%) | 9 (7.6%) |
| $100,000 to $149,999 | 33 (6.8%) | 0 (0.0%) |
| $150,000 or more | 0 (0.0%) | 0 (0.0%) |
| Total | 485 (100.0%) | 119 (100.0%) |
Property Value to Household Income Ratio in Olimpo
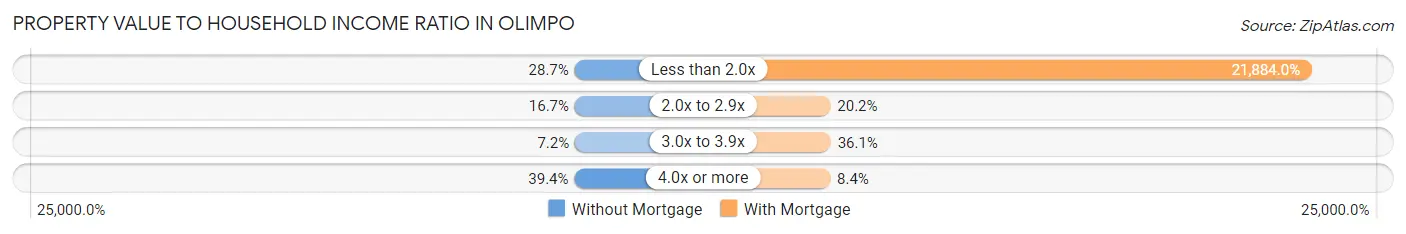
| Value-to-Income Ratio | Without Mortgage | With Mortgage |
| Less than 2.0x | 139 (28.7%) | 26,042 (21,884.0%) |
| 2.0x to 2.9x | 81 (16.7%) | 24 (20.2%) |
| 3.0x to 3.9x | 35 (7.2%) | 43 (36.1%) |
| 4.0x or more | 191 (39.4%) | 10 (8.4%) |
| Total | 485 (100.0%) | 119 (100.0%) |
Real Estate Taxes by Mortgage Status in Olimpo
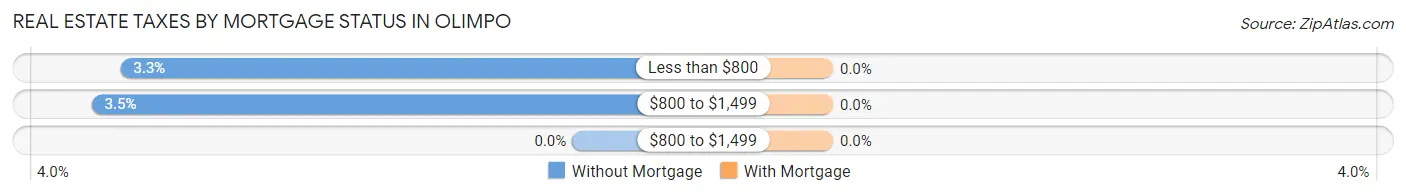
| Property Taxes | Without Mortgage | With Mortgage |
| Less than $800 | 16 (3.3%) | 0 (0.0%) |
| $800 to $1,499 | 17 (3.5%) | 0 (0.0%) |
| $800 to $1,499 | 0 (0.0%) | 0 (0.0%) |
| Total | 485 (100.0%) | 119 (100.0%) |
Health & Disability in Olimpo
Health Insurance Coverage by Age in Olimpo
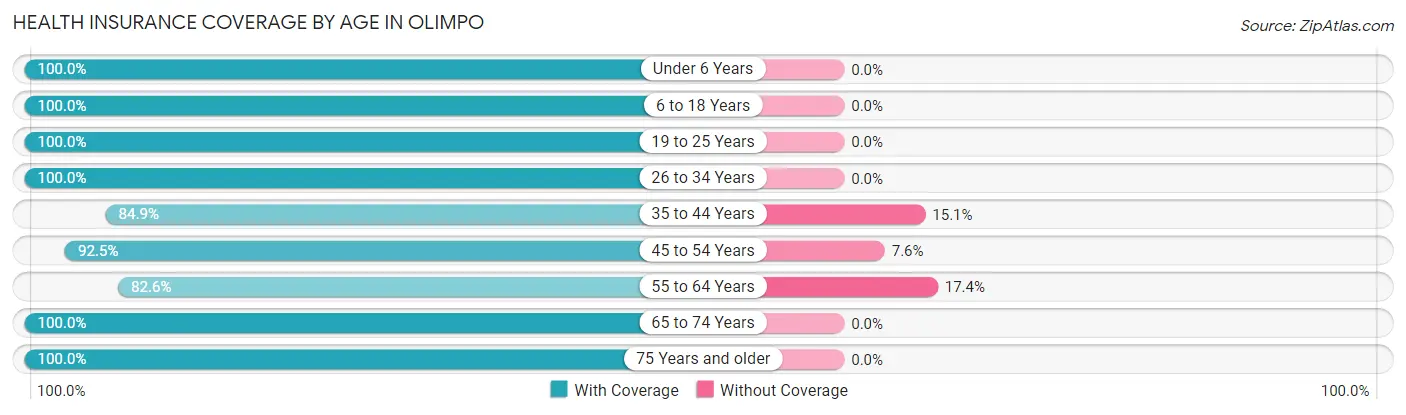
| Age Bracket | With Coverage | Without Coverage |
| Under 6 Years | 76 (100.0%) | 0 (0.0%) |
| 6 to 18 Years | 239 (100.0%) | 0 (0.0%) |
| 19 to 25 Years | 56 (100.0%) | 0 (0.0%) |
| 26 to 34 Years | 142 (100.0%) | 0 (0.0%) |
| 35 to 44 Years | 219 (84.9%) | 39 (15.1%) |
| 45 to 54 Years | 98 (92.4%) | 8 (7.5%) |
| 55 to 64 Years | 251 (82.6%) | 53 (17.4%) |
| 65 to 74 Years | 220 (100.0%) | 0 (0.0%) |
| 75 Years and older | 213 (100.0%) | 0 (0.0%) |
| Total | 1,514 (93.8%) | 100 (6.2%) |
Health Insurance Coverage by Citizenship Status in Olimpo
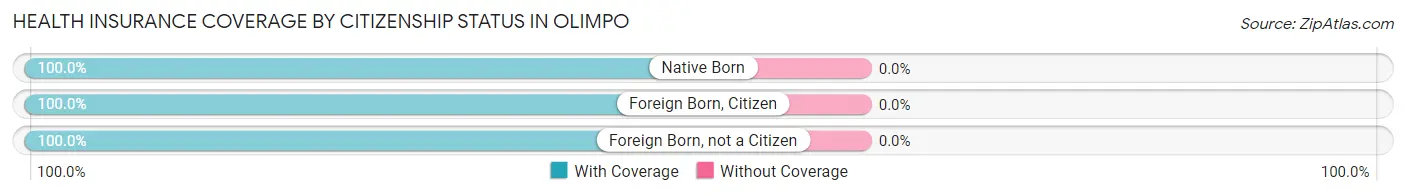
| Citizenship Status | With Coverage | Without Coverage |
| Native Born | 76 (100.0%) | 0 (0.0%) |
| Foreign Born, Citizen | 239 (100.0%) | 0 (0.0%) |
| Foreign Born, not a Citizen | 56 (100.0%) | 0 (0.0%) |
Health Insurance Coverage by Household Income in Olimpo
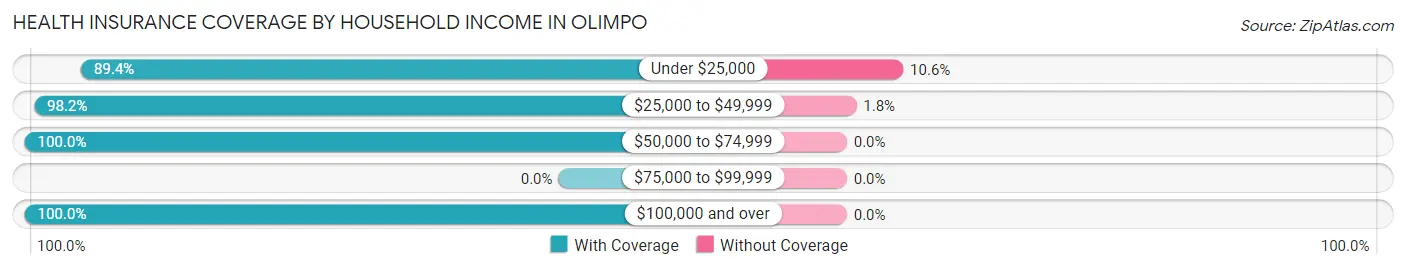
| Household Income | With Coverage | Without Coverage |
| Under $25,000 | 779 (89.4%) | 92 (10.6%) |
| $25,000 to $49,999 | 440 (98.2%) | 8 (1.8%) |
| $50,000 to $74,999 | 179 (100.0%) | 0 (0.0%) |
| $75,000 to $99,999 | 0 (0.0%) | 0 (0.0%) |
| $100,000 and over | 116 (100.0%) | 0 (0.0%) |
Public vs Private Health Insurance Coverage by Age in Olimpo
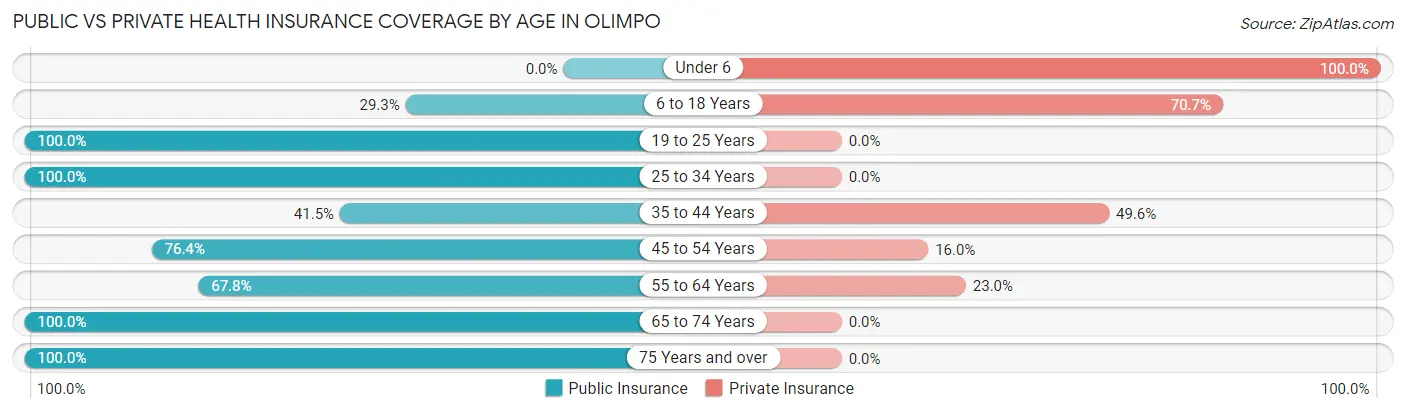
| Age Bracket | Public Insurance | Private Insurance |
| Under 6 | 0 (0.0%) | 76 (100.0%) |
| 6 to 18 Years | 70 (29.3%) | 169 (70.7%) |
| 19 to 25 Years | 56 (100.0%) | 0 (0.0%) |
| 25 to 34 Years | 142 (100.0%) | 0 (0.0%) |
| 35 to 44 Years | 107 (41.5%) | 128 (49.6%) |
| 45 to 54 Years | 81 (76.4%) | 17 (16.0%) |
| 55 to 64 Years | 206 (67.8%) | 70 (23.0%) |
| 65 to 74 Years | 220 (100.0%) | 0 (0.0%) |
| 75 Years and over | 213 (100.0%) | 0 (0.0%) |
| Total | 1,095 (67.8%) | 460 (28.5%) |
Disability Status by Sex by Age in Olimpo
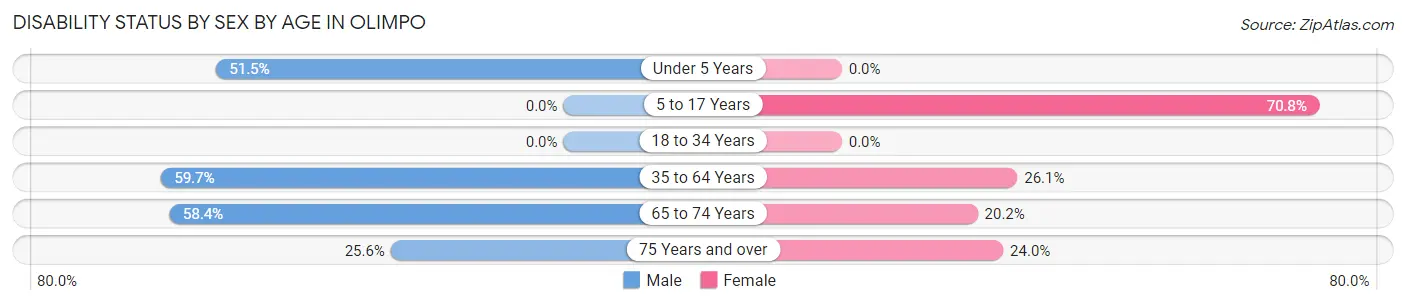
| Age Bracket | Male | Female |
| Under 5 Years | 17 (51.5%) | 0 (0.0%) |
| 5 to 17 Years | 0 (0.0%) | 102 (70.8%) |
| 18 to 34 Years | 0 (0.0%) | 0 (0.0%) |
| 35 to 64 Years | 117 (59.7%) | 123 (26.1%) |
| 65 to 74 Years | 59 (58.4%) | 24 (20.2%) |
| 75 Years and over | 30 (25.6%) | 23 (24.0%) |
Disability Class by Sex by Age in Olimpo
Disability Class: Hearing Difficulty
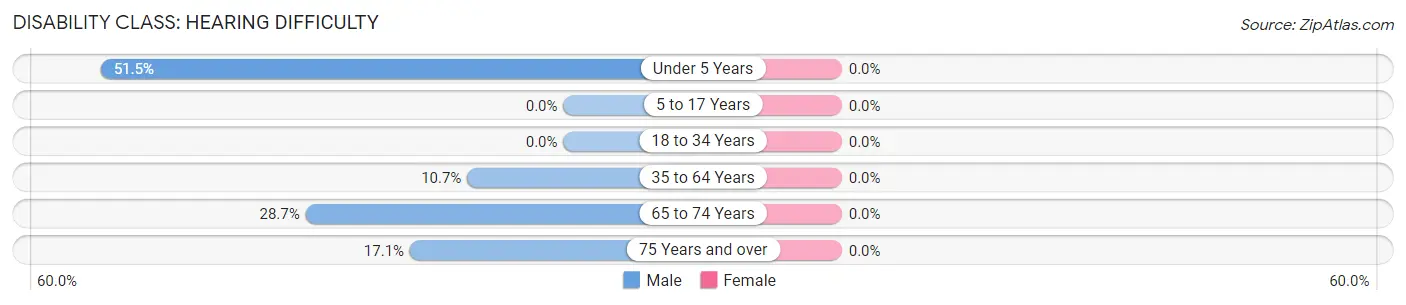
| Age Bracket | Male | Female |
| Under 5 Years | 17 (51.5%) | 0 (0.0%) |
| 5 to 17 Years | 0 (0.0%) | 0 (0.0%) |
| 18 to 34 Years | 0 (0.0%) | 0 (0.0%) |
| 35 to 64 Years | 21 (10.7%) | 0 (0.0%) |
| 65 to 74 Years | 29 (28.7%) | 0 (0.0%) |
| 75 Years and over | 20 (17.1%) | 0 (0.0%) |
Disability Class: Vision Difficulty
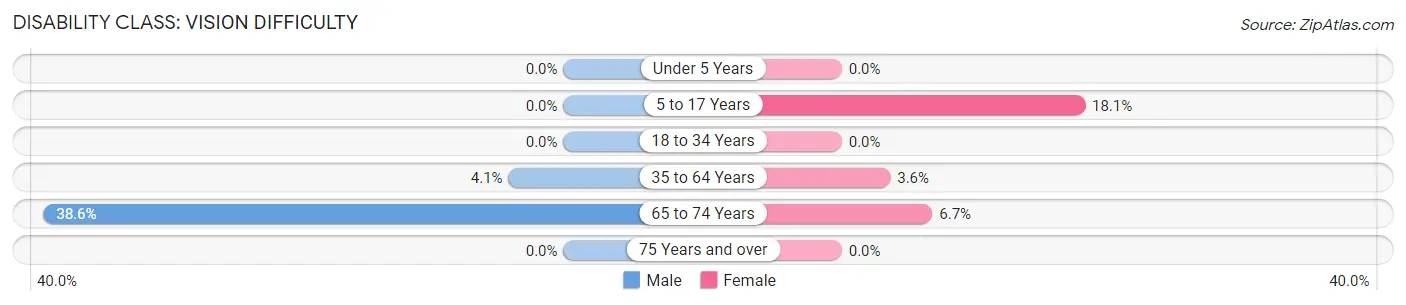
| Age Bracket | Male | Female |
| Under 5 Years | 0 (0.0%) | 0 (0.0%) |
| 5 to 17 Years | 0 (0.0%) | 26 (18.1%) |
| 18 to 34 Years | 0 (0.0%) | 0 (0.0%) |
| 35 to 64 Years | 8 (4.1%) | 17 (3.6%) |
| 65 to 74 Years | 39 (38.6%) | 8 (6.7%) |
| 75 Years and over | 0 (0.0%) | 0 (0.0%) |
Disability Class: Cognitive Difficulty
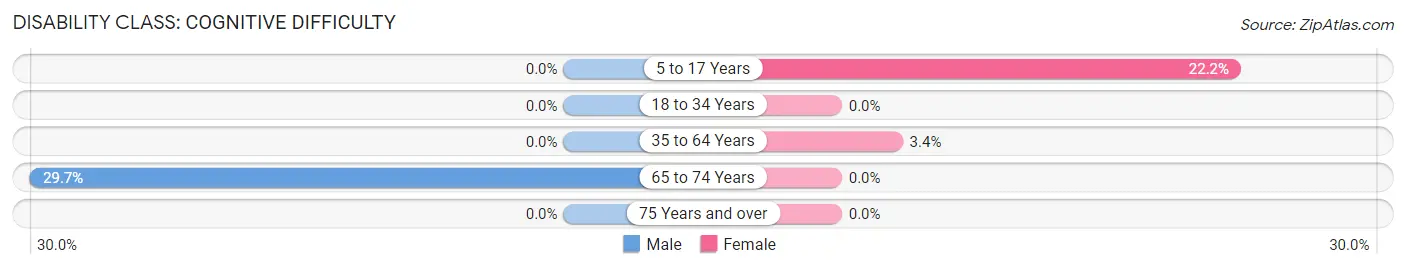
| Age Bracket | Male | Female |
| 5 to 17 Years | 0 (0.0%) | 32 (22.2%) |
| 18 to 34 Years | 0 (0.0%) | 0 (0.0%) |
| 35 to 64 Years | 0 (0.0%) | 16 (3.4%) |
| 65 to 74 Years | 30 (29.7%) | 0 (0.0%) |
| 75 Years and over | 0 (0.0%) | 0 (0.0%) |
Disability Class: Ambulatory Difficulty
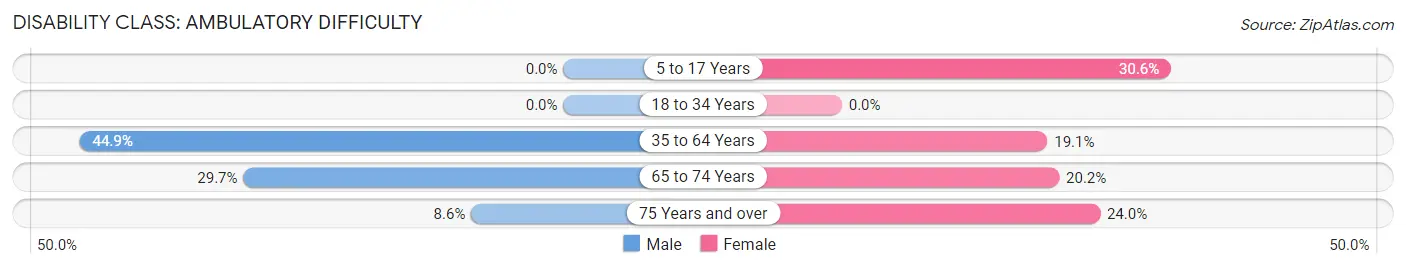
| Age Bracket | Male | Female |
| 5 to 17 Years | 0 (0.0%) | 44 (30.6%) |
| 18 to 34 Years | 0 (0.0%) | 0 (0.0%) |
| 35 to 64 Years | 88 (44.9%) | 90 (19.1%) |
| 65 to 74 Years | 30 (29.7%) | 24 (20.2%) |
| 75 Years and over | 10 (8.6%) | 23 (24.0%) |
Disability Class: Self-Care Difficulty
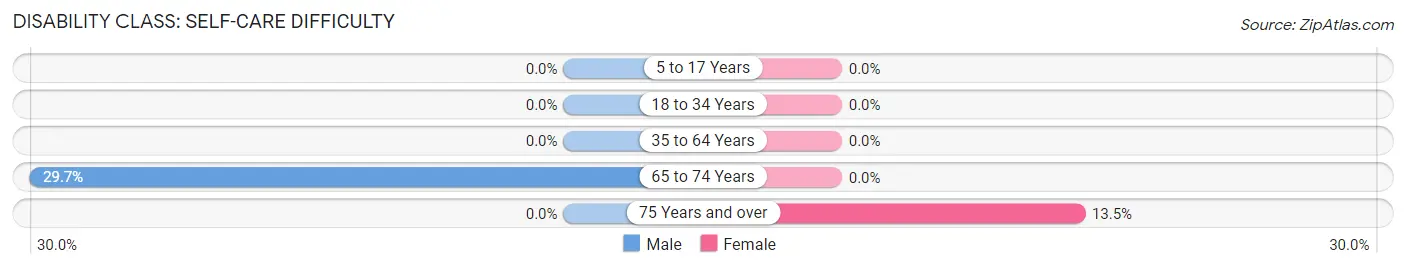
| Age Bracket | Male | Female |
| 5 to 17 Years | 0 (0.0%) | 0 (0.0%) |
| 18 to 34 Years | 0 (0.0%) | 0 (0.0%) |
| 35 to 64 Years | 0 (0.0%) | 0 (0.0%) |
| 65 to 74 Years | 30 (29.7%) | 0 (0.0%) |
| 75 Years and over | 0 (0.0%) | 13 (13.5%) |
Technology Access in Olimpo
Computing Device Access in Olimpo
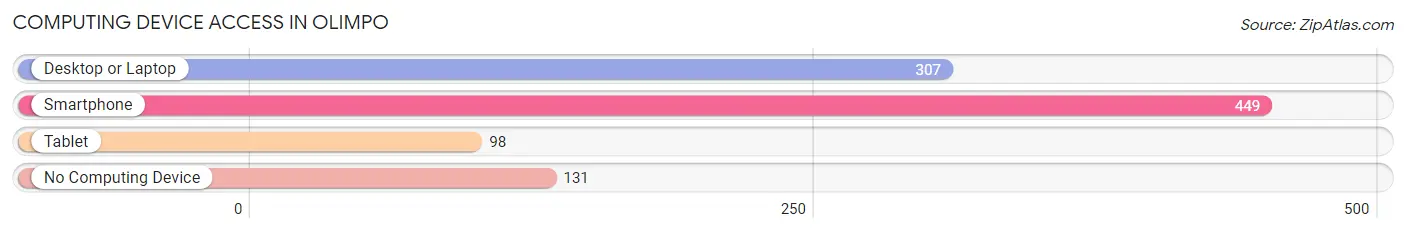
| Device Type | # Households | % Households |
| Desktop or Laptop | 307 | 46.4% |
| Smartphone | 449 | 67.8% |
| Tablet | 98 | 14.8% |
| No Computing Device | 131 | 19.8% |
| Total | 662 | 100.0% |
Internet Access in Olimpo
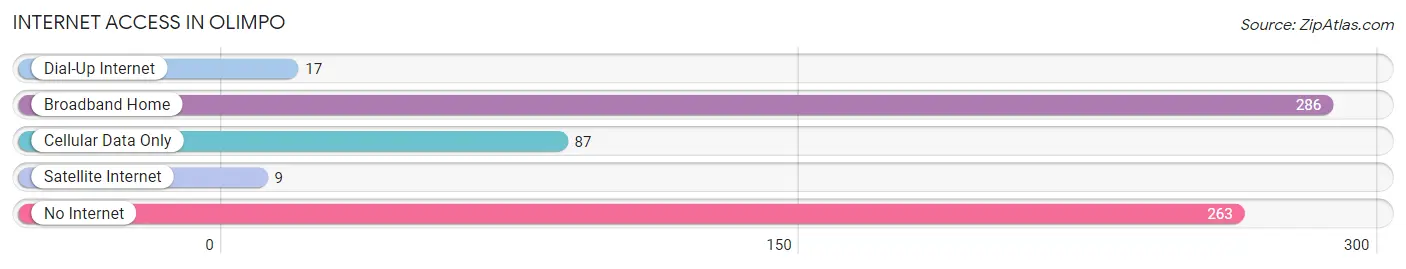
| Internet Type | # Households | % Households |
| Dial-Up Internet | 17 | 2.6% |
| Broadband Home | 286 | 43.2% |
| Cellular Data Only | 87 | 13.1% |
| Satellite Internet | 9 | 1.4% |
| No Internet | 263 | 39.7% |
| Total | 662 | 100.0% |
Olimpo Summary
Olimpo is a municipality located in the state of Paraná, Brazil. It is situated in the south of the state, in the region known as the Serra do Mar. The municipality covers an area of 545.7 km2 and has a population of approximately 8,000 people.
Geography
Olimpo is located in the south of the state of Paraná, in the Serra do Mar region. It is bordered by the municipalities of São José dos Pinhais, Campo Largo, and Quatro Barras. The municipality is situated in a mountainous region, with elevations ranging from 500 to 1,000 meters above sea level. The highest point in the municipality is the peak of the Serra do Mar, at 1,000 meters. The municipality is crossed by several rivers, including the Rio Tibagi, Rio Iguaçu, and Rio Piquiri.
Climate
Olimpo has a subtropical climate, with hot summers and mild winters. The average annual temperature is around 22°C, with temperatures ranging from a low of 10°C in the winter to a high of 33°C in the summer. The average annual precipitation is around 1,400 mm.
History
The area that is now Olimpo was first settled by the indigenous Guarani people. The first European settlers arrived in the area in the late 19th century, and the municipality was officially established in 1891. The name Olimpo was chosen in honor of the Greek god Zeus, who was known as Olimpo in the Guarani language.
Economy
The economy of Olimpo is largely based on agriculture and livestock. The main crops grown in the municipality are coffee, corn, soybeans, and wheat. Livestock production is also important, with cattle, pigs, and poultry being the main animals raised. The municipality also has some light industry, including food processing and furniture manufacturing.
Demographics
As of 2020, the population of Olimpo was estimated to be around 8,000 people. The majority of the population is of European descent, with a small minority of Afro-Brazilians and indigenous people. The majority of the population is Roman Catholic, with a small minority of Protestants. The official language of the municipality is Portuguese.
Conclusion
Olimpo is a municipality located in the state of Paraná, Brazil. It is situated in the south of the state, in the region known as the Serra do Mar. The municipality covers an area of 545.7 km2 and has a population of approximately 8,000 people. The economy of Olimpo is largely based on agriculture and livestock, with coffee, corn, soybeans, and wheat being the main crops grown in the municipality. The majority of the population is of European descent, with a small minority of Afro-Brazilians and indigenous people. The official language of the municipality is Portuguese.
Common Questions
What is Per Capita Income in Olimpo?
Per Capita income in Olimpo is $13,483.
What is the Median Family Income in Olimpo?
Median Family Income in Olimpo is $22,679.
What is the Median Household income in Olimpo?
Median Household Income in Olimpo is $19,381.
What is Income or Wage Gap in Olimpo?
Income or Wage Gap in Olimpo is 59.0%.
Women in Olimpo earn 41.0 cents for every dollar earned by a man.
What is Family Income Deficit in Olimpo?
Family Income Deficit in Olimpo is $5,667.
Families that are below poverty line in Olimpo earn $5,667 less on average than the poverty threshold level.
What is Inequality or Gini Index in Olimpo?
Inequality or Gini Index in Olimpo is 0.48.
What is the Total Population of Olimpo?
Total Population of Olimpo is 1,621.
What is the Total Male Population of Olimpo?
Total Male Population of Olimpo is 670.
What is the Total Female Population of Olimpo?
Total Female Population of Olimpo is 951.
What is the Ratio of Males per 100 Females in Olimpo?
There are 70.45 Males per 100 Females in Olimpo.
What is the Ratio of Females per 100 Males in Olimpo?
There are 141.94 Females per 100 Males in Olimpo.
What is the Median Population Age in Olimpo?
Median Population Age in Olimpo is 48.3 Years.
What is the Average Family Size in Olimpo
Average Family Size in Olimpo is 2.8 People.
What is the Average Household Size in Olimpo
Average Household Size in Olimpo is 2.4 People.
How Large is the Labor Force in Olimpo?
There are 356 People in the Labor Forcein in Olimpo.
What is the Percentage of People in the Labor Force in Olimpo?
25.4% of People are in the Labor Force in Olimpo.