Caban, PR Map & Demographics
Caban Overview
$9,061
PER CAPITA INCOME
$16,205
AVG FAMILY INCOME
$14,202
AVG HOUSEHOLD INCOME
35.6%
WAGE / INCOME GAP [ % ]
64.4¢/ $1
WAGE / INCOME GAP [ $ ]
0.56
INEQUALITY / GINI INDEX
3,310
TOTAL POPULATION
1,551
MALE POPULATION
1,759
FEMALE POPULATION
88.18
MALES / 100 FEMALES
113.41
FEMALES / 100 MALES
42.9
MEDIAN AGE
2.8
AVG FAMILY SIZE
2.3
AVG HOUSEHOLD SIZE
867
LABOR FORCE [ PEOPLE ]
31.9%
PERCENT IN LABOR FORCE
6.2%
UNEMPLOYMENT RATE
Income in Caban
Income Overview in Caban
Per Capita Income in Caban is $9,061, while median incomes of families and households are $16,205 and $14,202 respectively.
| Characteristic | Number | Measure |
| Per Capita Income | 3,310 | $9,061 |
| Median Family Income | 999 | $16,205 |
| Mean Family Income | 999 | $22,468 |
| Median Household Income | 1,414 | $14,202 |
| Mean Household Income | 1,414 | $20,087 |
| Income Deficit | 999 | $0 |
| Wage / Income Gap (%) | 3,310 | 35.62% |
| Wage / Income Gap ($) | 3,310 | 64.38¢ per $1 |
| Gini / Inequality Index | 3,310 | 0.56 |
Earnings by Sex in Caban
Average Earnings in Caban are $13,194, $16,250 for men and $10,461 for women, a difference of 35.6%.
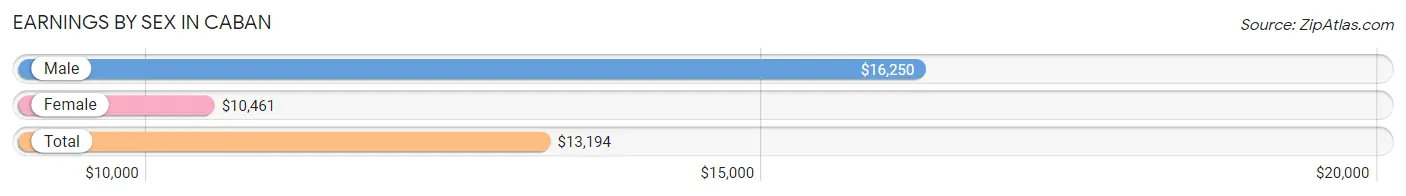
| Sex | Number | Average Earnings |
| Male | 541 (60.0%) | $16,250 |
| Female | 360 (40.0%) | $10,461 |
| Total | 901 (100.0%) | $13,194 |
Earnings by Sex by Income Bracket in Caban
The most common earnings brackets in Caban are $25,000 to $29,999 for men (89 | 16.5%) and $7,500 to $9,999 for women (67 | 18.6%).
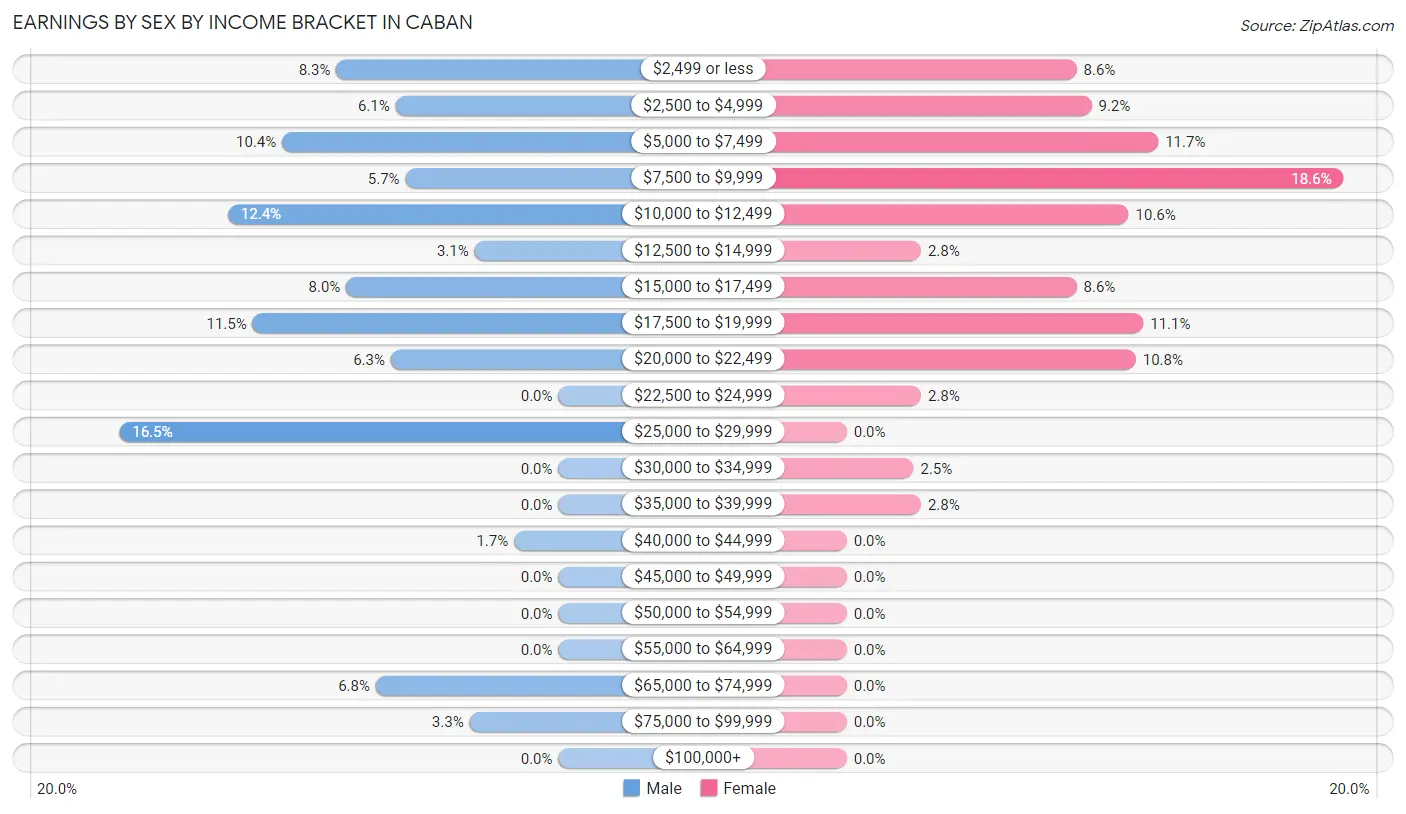
| Income | Male | Female |
| $2,499 or less | 45 (8.3%) | 31 (8.6%) |
| $2,500 to $4,999 | 33 (6.1%) | 33 (9.2%) |
| $5,000 to $7,499 | 56 (10.3%) | 42 (11.7%) |
| $7,500 to $9,999 | 31 (5.7%) | 67 (18.6%) |
| $10,000 to $12,499 | 67 (12.4%) | 38 (10.6%) |
| $12,500 to $14,999 | 17 (3.1%) | 10 (2.8%) |
| $15,000 to $17,499 | 43 (8.0%) | 31 (8.6%) |
| $17,500 to $19,999 | 62 (11.5%) | 40 (11.1%) |
| $20,000 to $22,499 | 34 (6.3%) | 39 (10.8%) |
| $22,500 to $24,999 | 0 (0.0%) | 10 (2.8%) |
| $25,000 to $29,999 | 89 (16.5%) | 0 (0.0%) |
| $30,000 to $34,999 | 0 (0.0%) | 9 (2.5%) |
| $35,000 to $39,999 | 0 (0.0%) | 10 (2.8%) |
| $40,000 to $44,999 | 9 (1.7%) | 0 (0.0%) |
| $45,000 to $49,999 | 0 (0.0%) | 0 (0.0%) |
| $50,000 to $54,999 | 0 (0.0%) | 0 (0.0%) |
| $55,000 to $64,999 | 0 (0.0%) | 0 (0.0%) |
| $65,000 to $74,999 | 37 (6.8%) | 0 (0.0%) |
| $75,000 to $99,999 | 18 (3.3%) | 0 (0.0%) |
| $100,000+ | 0 (0.0%) | 0 (0.0%) |
| Total | 541 (100.0%) | 360 (100.0%) |
Earnings by Sex by Educational Attainment in Caban
Average earnings in Caban are $16,250 for men and $10,461 for women, a difference of 35.6%. Men with an educational attainment of high school diploma enjoy the highest average annual earnings of $15,843, while those with high school diploma education earn the least with $15,843. Women with an educational attainment of graduate degree earn the most with the average annual earnings of $20,417, while those with high school diploma education have the smallest earnings of $8,261.
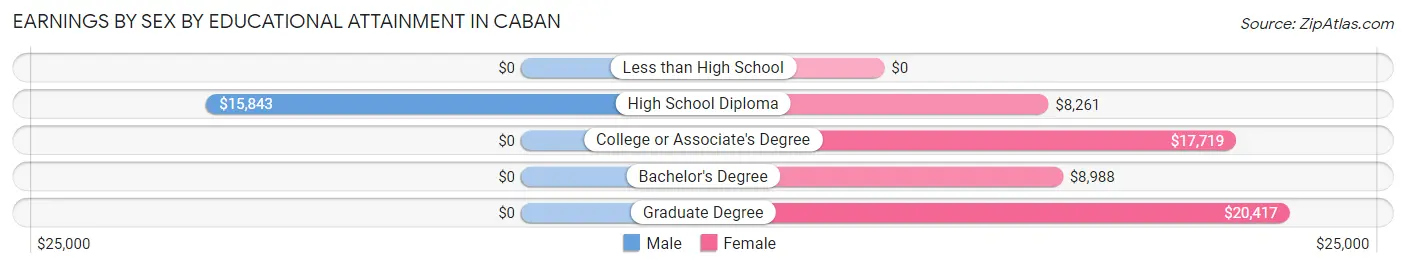
| Educational Attainment | Male Income | Female Income |
| Less than High School | - | - |
| High School Diploma | $15,843 | $8,261 |
| College or Associate's Degree | - | - |
| Bachelor's Degree | - | - |
| Graduate Degree | - | - |
| Total | $16,250 | $10,461 |
Family Income in Caban
Family Income Brackets in Caban
According to the Caban family income data, there are 386 families falling into the less than $10,000 income range, which is the most common income bracket and makes up 38.6% of all families.
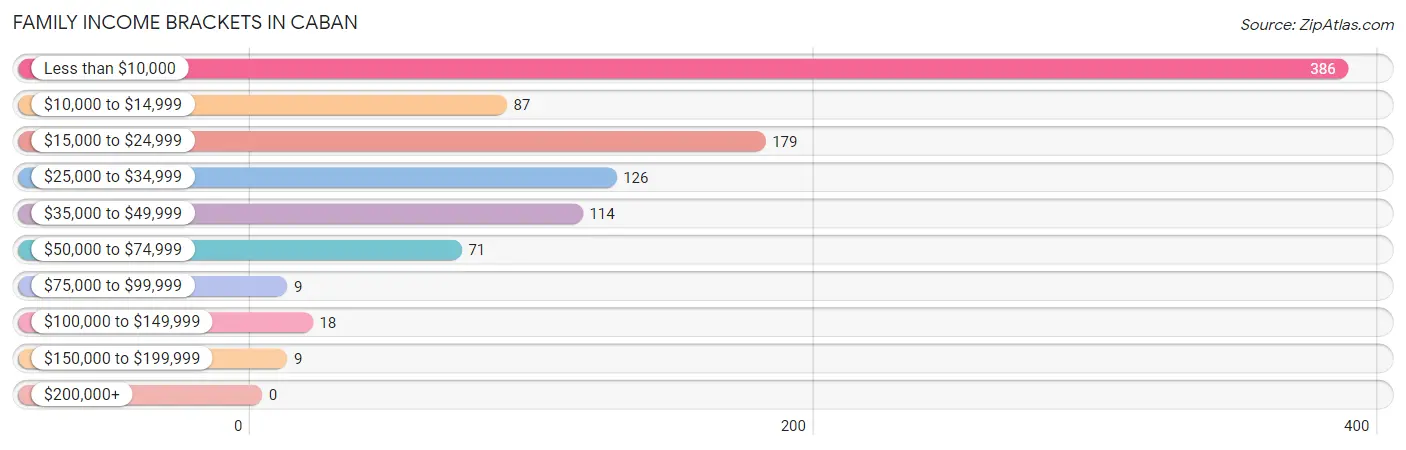
| Income Bracket | # Families | % Families |
| Less than $10,000 | 386 | 38.6% |
| $10,000 to $14,999 | 87 | 8.7% |
| $15,000 to $24,999 | 179 | 17.9% |
| $25,000 to $34,999 | 126 | 12.6% |
| $35,000 to $49,999 | 114 | 11.4% |
| $50,000 to $74,999 | 71 | 7.1% |
| $75,000 to $99,999 | 9 | 0.9% |
| $100,000 to $149,999 | 18 | 1.8% |
| $150,000 to $199,999 | 9 | 0.9% |
| $200,000+ | 0 | 0.0% |
Family Income by Famaliy Size in Caban
5-person families (57 | 5.7%) account for the highest median family income in Caban with $38,750 per family, while 2-person families (618 | 61.9%) have the highest median income of $9,088 per family member.
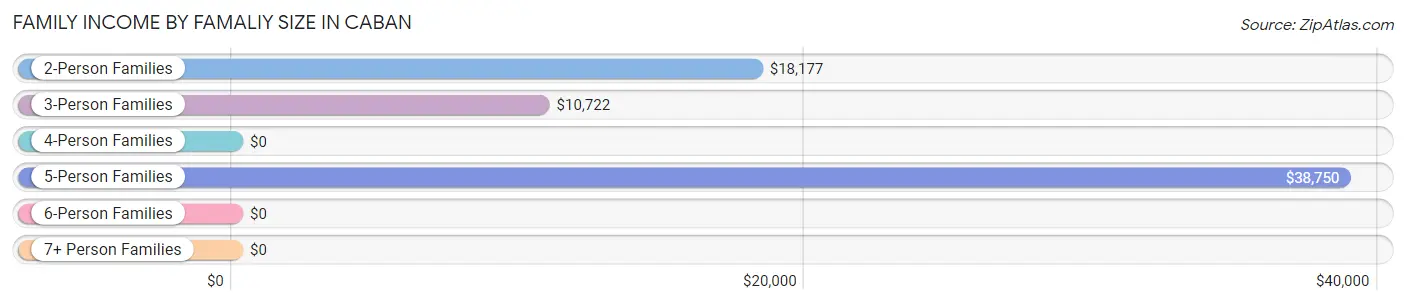
| Income Bracket | # Families | Median Income |
| 2-Person Families | 618 (61.9%) | $18,177 |
| 3-Person Families | 236 (23.6%) | $10,722 |
| 4-Person Families | 88 (8.8%) | $0 |
| 5-Person Families | 57 (5.7%) | $38,750 |
| 6-Person Families | 0 (0.0%) | $0 |
| 7+ Person Families | 0 (0.0%) | $0 |
| Total | 999 (100.0%) | $16,205 |
Family Income by Number of Earners in Caban
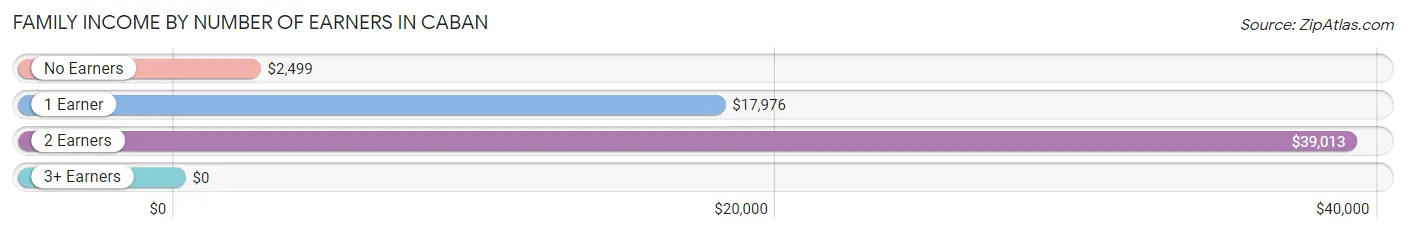
| Number of Earners | # Families | Median Income |
| No Earners | 454 (45.5%) | $2,499 |
| 1 Earner | 420 (42.0%) | $17,976 |
| 2 Earners | 125 (12.5%) | $39,013 |
| 3+ Earners | 0 (0.0%) | $0 |
| Total | 999 (100.0%) | $16,205 |
Household Income in Caban
Household Income Brackets in Caban
With 554 households falling in the category, the less than $10,000 income range is the most frequent in Caban, accounting for 39.2% of all households.
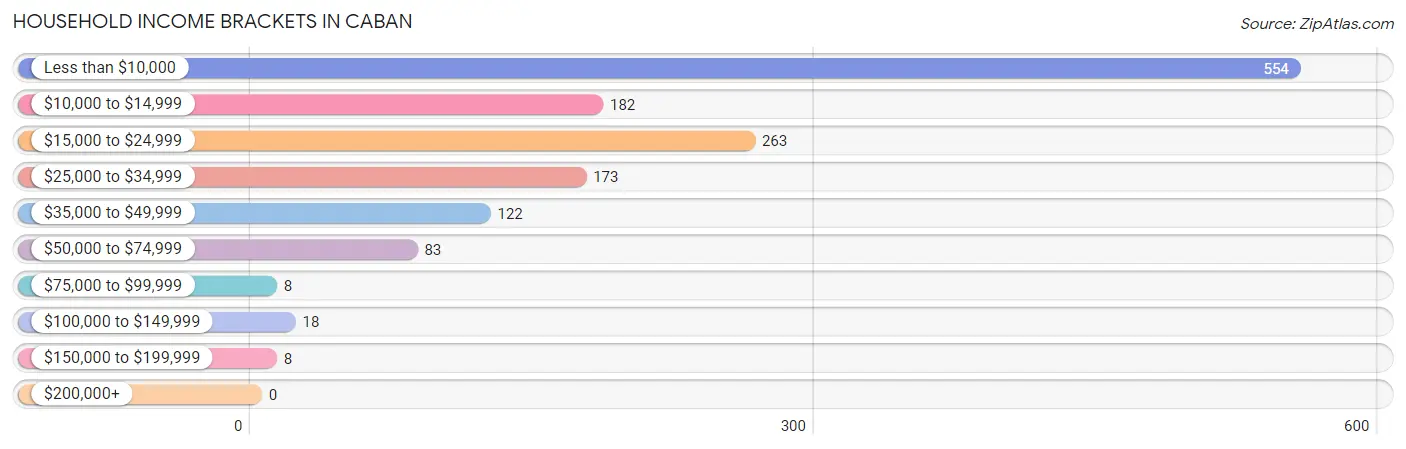
| Income Bracket | # Households | % Households |
| Less than $10,000 | 554 | 39.2% |
| $10,000 to $14,999 | 182 | 12.9% |
| $15,000 to $24,999 | 263 | 18.6% |
| $25,000 to $34,999 | 173 | 12.2% |
| $35,000 to $49,999 | 122 | 8.6% |
| $50,000 to $74,999 | 83 | 5.9% |
| $75,000 to $99,999 | 8 | 0.6% |
| $100,000 to $149,999 | 18 | 1.3% |
| $150,000 to $199,999 | 8 | 0.6% |
| $200,000+ | 0 | 0.0% |
Household Income by Householder Age in Caban
The median household income in Caban is $14,202, with the highest median household income of $24,278 found in the 45 to 64 years age bracket for the primary householder. A total of 428 households (30.3%) fall into this category. Meanwhile, the 15 to 24 years age bracket for the primary householder has the lowest median household income of $2,499, with 84 households (5.9%) in this group.
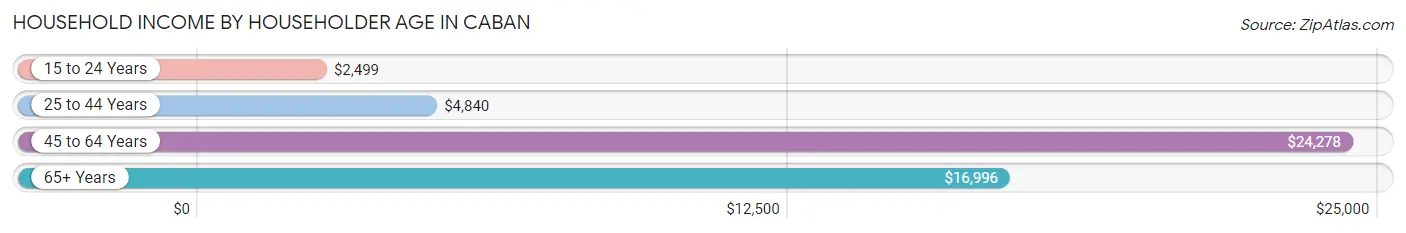
| Income Bracket | # Households | Median Income |
| 15 to 24 Years | 84 (5.9%) | $2,499 |
| 25 to 44 Years | 417 (29.5%) | $4,840 |
| 45 to 64 Years | 428 (30.3%) | $24,278 |
| 65+ Years | 485 (34.3%) | $16,996 |
| Total | 1,414 (100.0%) | $14,202 |
Poverty in Caban
Income Below Poverty by Sex and Age in Caban
With 50.4% poverty level for males and 61.5% for females among the residents of Caban, under 5 year old males and 5 year old females are the most vulnerable to poverty, with 83 males (100.0%) and 30 females (100.0%) in their respective age groups living below the poverty level.
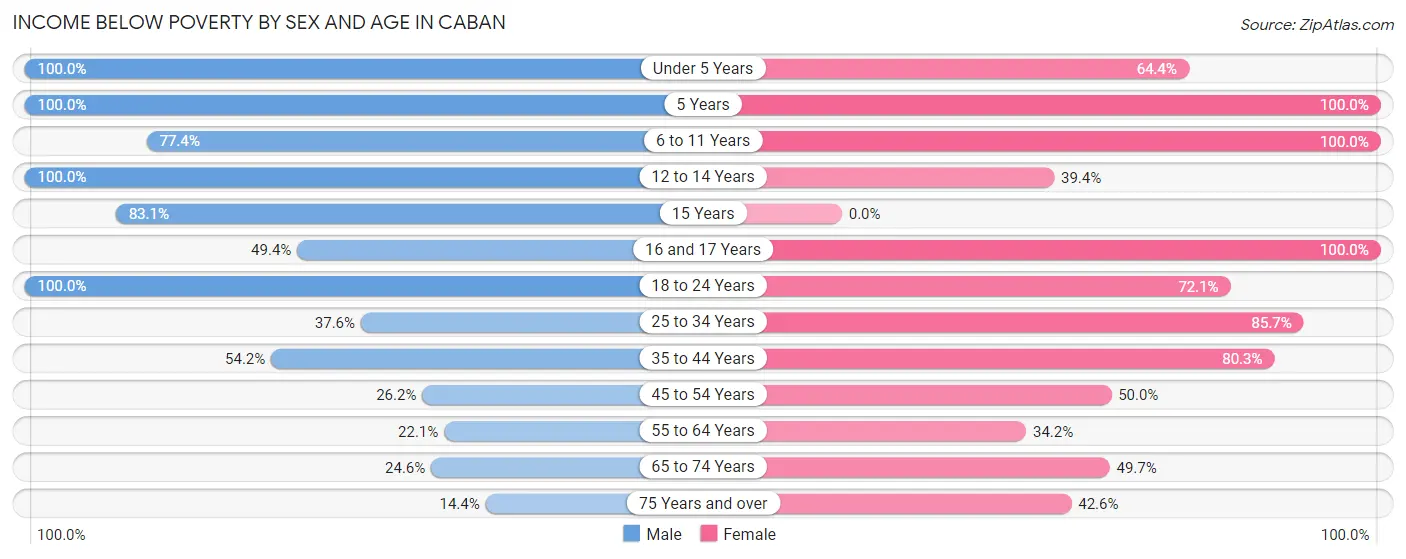
| Age Bracket | Male | Female |
| Under 5 Years | 83 (100.0%) | 38 (64.4%) |
| 5 Years | 15 (100.0%) | 30 (100.0%) |
| 6 to 11 Years | 82 (77.4%) | 101 (100.0%) |
| 12 to 14 Years | 35 (100.0%) | 39 (39.4%) |
| 15 Years | 54 (83.1%) | 0 (0.0%) |
| 16 and 17 Years | 42 (49.4%) | 19 (100.0%) |
| 18 to 24 Years | 143 (100.0%) | 44 (72.1%) |
| 25 to 34 Years | 56 (37.6%) | 240 (85.7%) |
| 35 to 44 Years | 128 (54.2%) | 179 (80.3%) |
| 45 to 54 Years | 22 (26.2%) | 130 (50.0%) |
| 55 to 64 Years | 52 (22.1%) | 79 (34.2%) |
| 65 to 74 Years | 54 (24.5%) | 84 (49.7%) |
| 75 Years and over | 13 (14.4%) | 92 (42.6%) |
| Total | 779 (50.4%) | 1,075 (61.5%) |
Income Above Poverty by Sex and Age in Caban
According to the poverty statistics in Caban, males aged 75 years and over and females aged 55 to 64 years are the age groups that are most secure financially, with 85.6% of males and 65.8% of females in these age groups living above the poverty line.
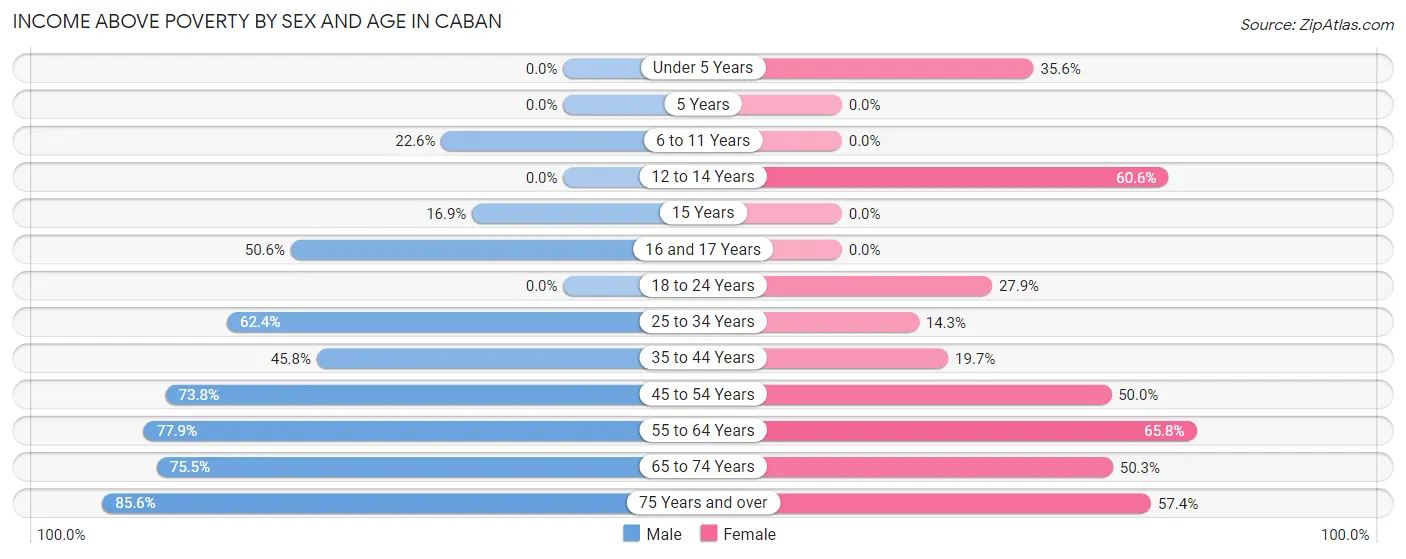
| Age Bracket | Male | Female |
| Under 5 Years | 0 (0.0%) | 21 (35.6%) |
| 5 Years | 0 (0.0%) | 0 (0.0%) |
| 6 to 11 Years | 24 (22.6%) | 0 (0.0%) |
| 12 to 14 Years | 0 (0.0%) | 60 (60.6%) |
| 15 Years | 11 (16.9%) | 0 (0.0%) |
| 16 and 17 Years | 43 (50.6%) | 0 (0.0%) |
| 18 to 24 Years | 0 (0.0%) | 17 (27.9%) |
| 25 to 34 Years | 93 (62.4%) | 40 (14.3%) |
| 35 to 44 Years | 108 (45.8%) | 44 (19.7%) |
| 45 to 54 Years | 62 (73.8%) | 130 (50.0%) |
| 55 to 64 Years | 183 (77.9%) | 152 (65.8%) |
| 65 to 74 Years | 166 (75.4%) | 85 (50.3%) |
| 75 Years and over | 77 (85.6%) | 124 (57.4%) |
| Total | 767 (49.6%) | 673 (38.5%) |
Income Below Poverty Among Married-Couple Families in Caban
The poverty statistics for married-couple families in Caban show that 31.2% or 125 of the total 400 families live below the poverty line. Families with 1 or 2 children have the highest poverty rate of 45.7%, comprising of 37 families. On the other hand, families with 3 or 4 children have the lowest poverty rate of 0.0%, which includes 0 families.
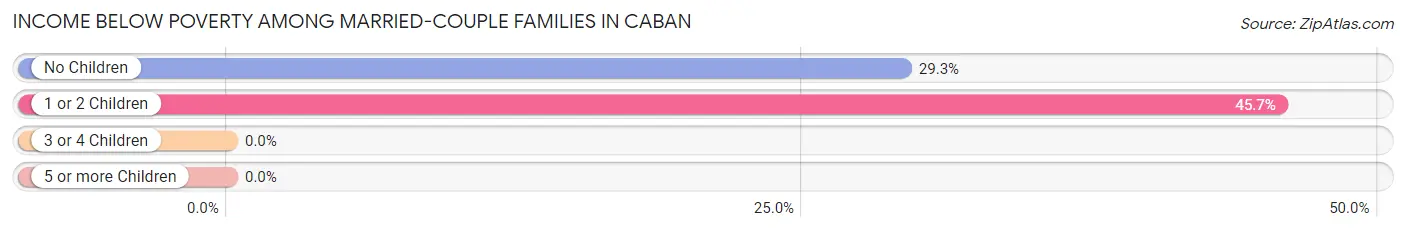
| Children | Above Poverty | Below Poverty |
| No Children | 212 (70.7%) | 88 (29.3%) |
| 1 or 2 Children | 44 (54.3%) | 37 (45.7%) |
| 3 or 4 Children | 19 (100.0%) | 0 (0.0%) |
| 5 or more Children | 0 (0.0%) | 0 (0.0%) |
| Total | 275 (68.8%) | 125 (31.2%) |
Income Below Poverty Among Single-Parent Households in Caban
According to the poverty data in Caban, 31.5% or 28 single-father households and 82.6% or 421 single-mother households are living below the poverty line. Among single-father households, those with 1 or 2 children have the highest poverty rate, with 19 households (100.0%) experiencing poverty. Likewise, among single-mother households, those with 1 or 2 children have the highest poverty rate, with 278 households (100.0%) falling below the poverty line.
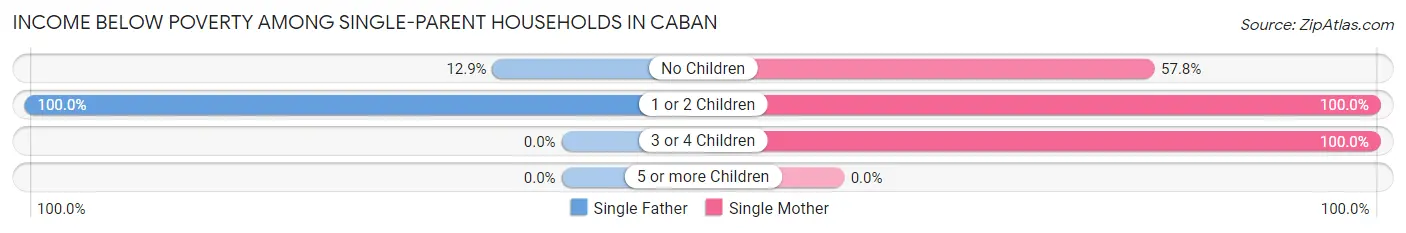
| Children | Single Father | Single Mother |
| No Children | 9 (12.9%) | 122 (57.8%) |
| 1 or 2 Children | 19 (100.0%) | 278 (100.0%) |
| 3 or 4 Children | 0 (0.0%) | 21 (100.0%) |
| 5 or more Children | 0 (0.0%) | 0 (0.0%) |
| Total | 28 (31.5%) | 421 (82.6%) |
Income Below Poverty Among Married-Couple vs Single-Parent Households in Caban
The poverty data for Caban shows that 125 of the married-couple family households (31.2%) and 449 of the single-parent households (75.0%) are living below the poverty level. Within the married-couple family households, those with 1 or 2 children have the highest poverty rate, with 37 households (45.7%) falling below the poverty line. Among the single-parent households, those with 1 or 2 children have the highest poverty rate, with 297 household (100.0%) living below poverty.
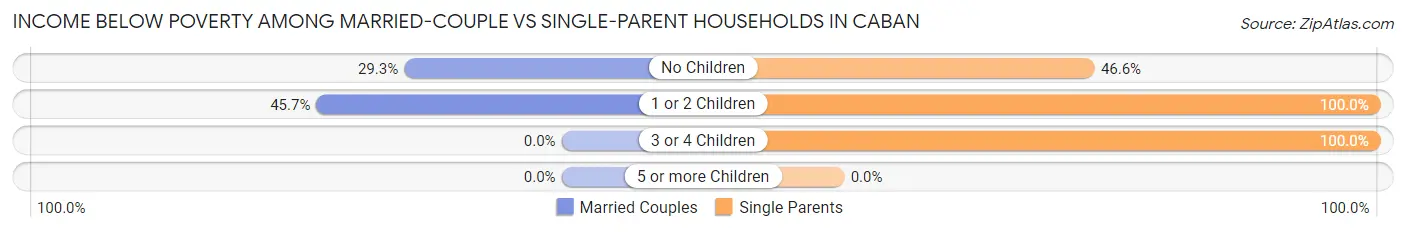
| Children | Married-Couple Families | Single-Parent Households |
| No Children | 88 (29.3%) | 131 (46.6%) |
| 1 or 2 Children | 37 (45.7%) | 297 (100.0%) |
| 3 or 4 Children | 0 (0.0%) | 21 (100.0%) |
| 5 or more Children | 0 (0.0%) | 0 (0.0%) |
| Total | 125 (31.2%) | 449 (75.0%) |
Race in Caban
The most populous races in Caban are Hispanic or Latino (3,310 | 100.0%), White / Caucasian (2,485 | 75.1%), and Two or more Races (386 | 11.7%).
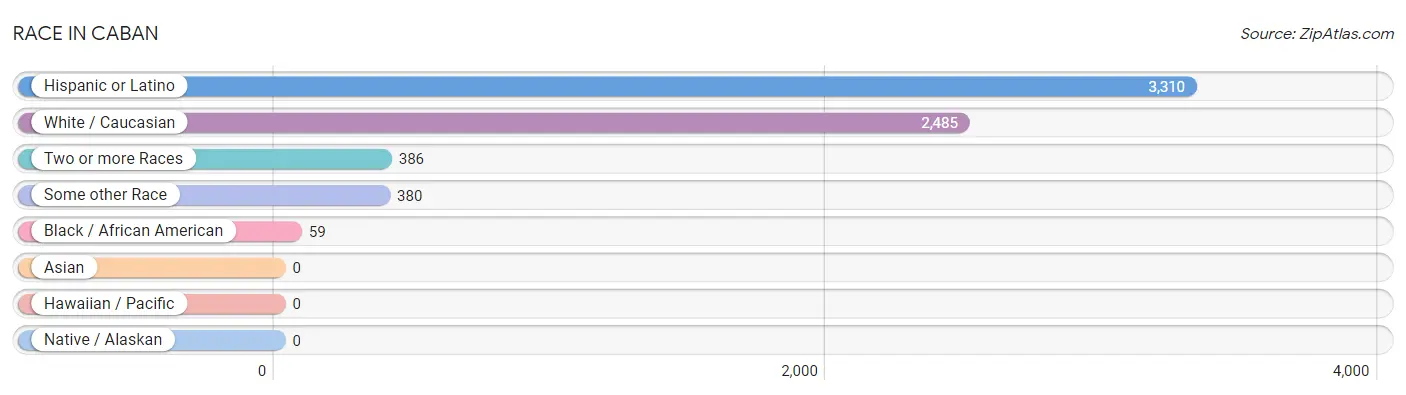
| Race | # Population | % Population |
| Asian | 0 | 0.0% |
| Black / African American | 59 | 1.8% |
| Hawaiian / Pacific | 0 | 0.0% |
| Hispanic or Latino | 3,310 | 100.0% |
| Native / Alaskan | 0 | 0.0% |
| White / Caucasian | 2,485 | 75.1% |
| Two or more Races | 386 | 11.7% |
| Some other Race | 380 | 11.5% |
| Total | 3,310 | 100.0% |
Ancestry in Caban
The most populous ancestries reported in Caban are Puerto Rican (3,214 | 97.1%), Spaniard (69 | 2.1%), American (64 | 1.9%), Central American Indian (39 | 1.2%), and Cuban (15 | 0.4%), together accounting for 102.7% of all Caban residents.
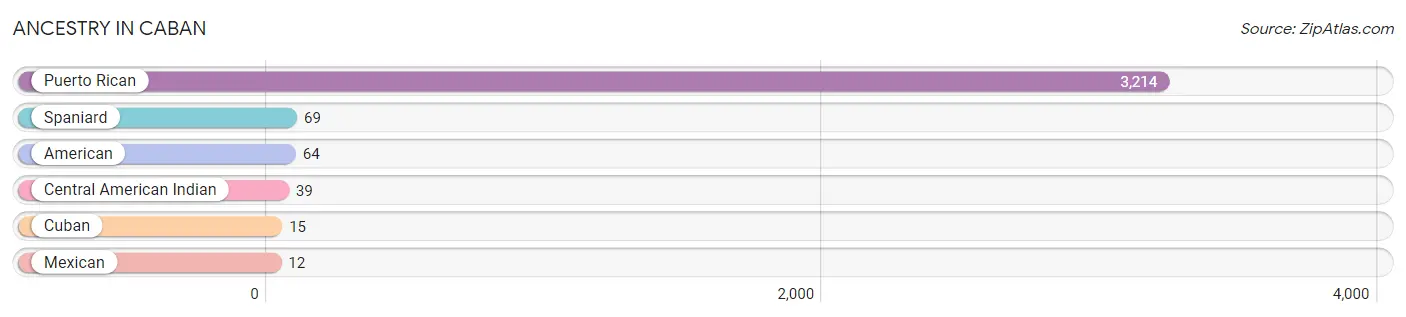
| Ancestry | # Population | % Population |
| American | 64 | 1.9% |
| Central American Indian | 39 | 1.2% |
| Cuban | 15 | 0.4% |
| Mexican | 12 | 0.4% |
| Puerto Rican | 3,214 | 97.1% |
| Spaniard | 69 | 2.1% | View All 6 Rows |
Immigrants in Caban

| Immigration Origin | # Population | % Population | View All 0 Rows |
Sex and Age in Caban
Sex and Age in Caban
The most populous age groups in Caban are 15 to 19 Years (253 | 16.3%) for men and 30 to 34 Years (187 | 10.6%) for women.
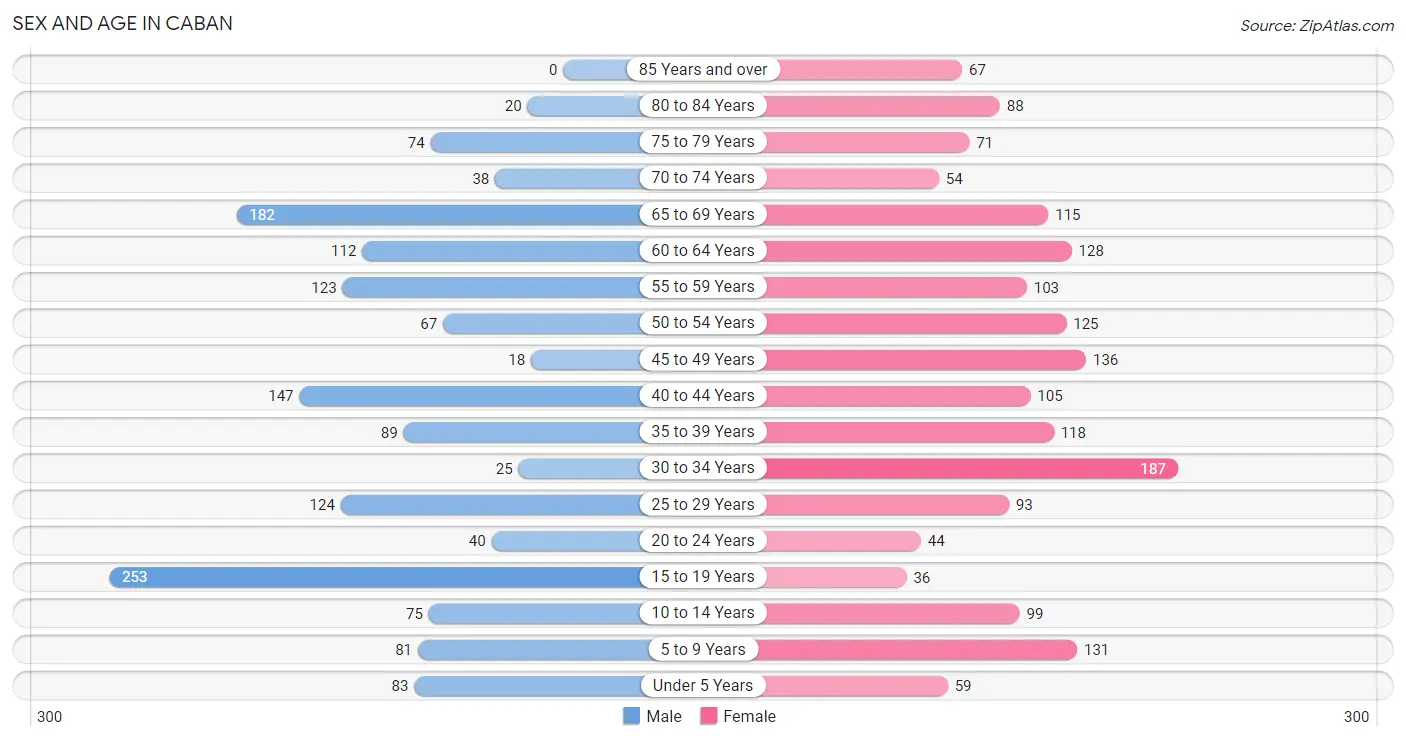
| Age Bracket | Male | Female |
| Under 5 Years | 83 (5.3%) | 59 (3.4%) |
| 5 to 9 Years | 81 (5.2%) | 131 (7.4%) |
| 10 to 14 Years | 75 (4.8%) | 99 (5.6%) |
| 15 to 19 Years | 253 (16.3%) | 36 (2.1%) |
| 20 to 24 Years | 40 (2.6%) | 44 (2.5%) |
| 25 to 29 Years | 124 (8.0%) | 93 (5.3%) |
| 30 to 34 Years | 25 (1.6%) | 187 (10.6%) |
| 35 to 39 Years | 89 (5.7%) | 118 (6.7%) |
| 40 to 44 Years | 147 (9.5%) | 105 (6.0%) |
| 45 to 49 Years | 18 (1.2%) | 136 (7.7%) |
| 50 to 54 Years | 67 (4.3%) | 125 (7.1%) |
| 55 to 59 Years | 123 (7.9%) | 103 (5.9%) |
| 60 to 64 Years | 112 (7.2%) | 128 (7.3%) |
| 65 to 69 Years | 182 (11.7%) | 115 (6.5%) |
| 70 to 74 Years | 38 (2.5%) | 54 (3.1%) |
| 75 to 79 Years | 74 (4.8%) | 71 (4.0%) |
| 80 to 84 Years | 20 (1.3%) | 88 (5.0%) |
| 85 Years and over | 0 (0.0%) | 67 (3.8%) |
| Total | 1,551 (100.0%) | 1,759 (100.0%) |
Families and Households in Caban
Median Family Size in Caban
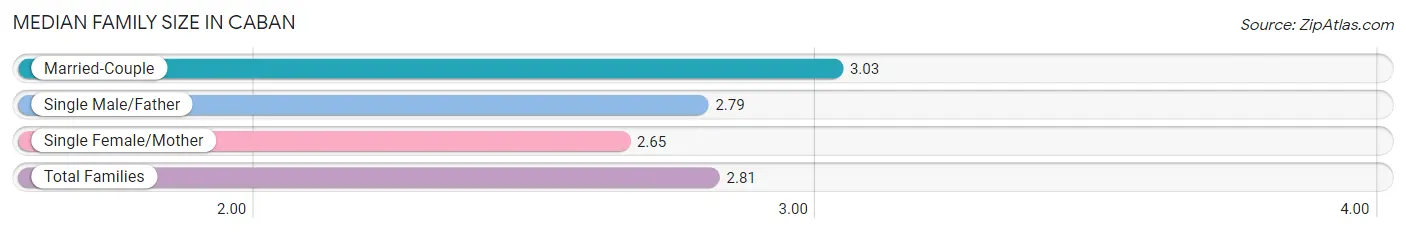
The median family size in Caban is 2.81 persons per family, with married-couple families (400 | 40.0%) accounting for the largest median family size of 3.03 persons per family. On the other hand, single female/mother families (510 | 51.0%) represent the smallest median family size with 2.65 persons per family.
| Family Type | # Families | Family Size |
| Married-Couple | 400 (40.0%) | 3.03 |
| Single Male/Father | 89 (8.9%) | 2.79 |
| Single Female/Mother | 510 (51.0%) | 2.65 |
| Total Families | 999 (100.0%) | 2.81 |
Median Household Size in Caban
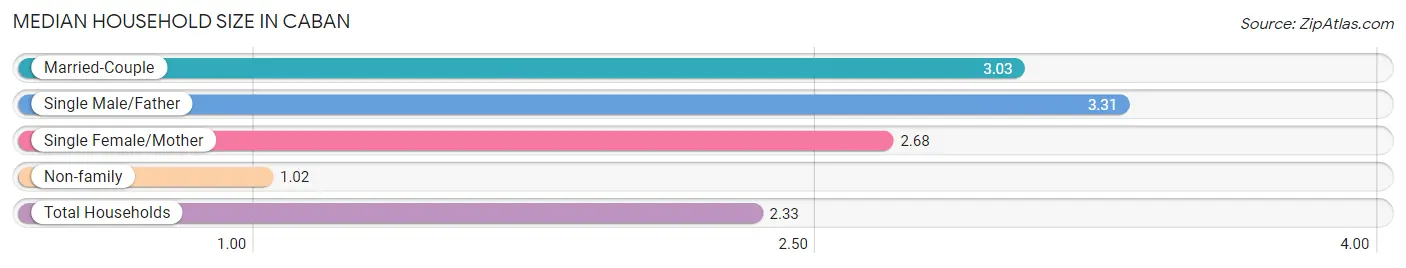
The median household size in Caban is 2.33 persons per household, with single male/father households (89 | 6.3%) accounting for the largest median household size of 3.31 persons per household. non-family households (415 | 29.3%) represent the smallest median household size with 1.02 persons per household.
| Household Type | # Households | Household Size |
| Married-Couple | 400 (28.3%) | 3.03 |
| Single Male/Father | 89 (6.3%) | 3.31 |
| Single Female/Mother | 510 (36.1%) | 2.68 |
| Non-family | 415 (29.3%) | 1.02 |
| Total Households | 1,414 (100.0%) | 2.33 |
Household Size by Marriage Status in Caban
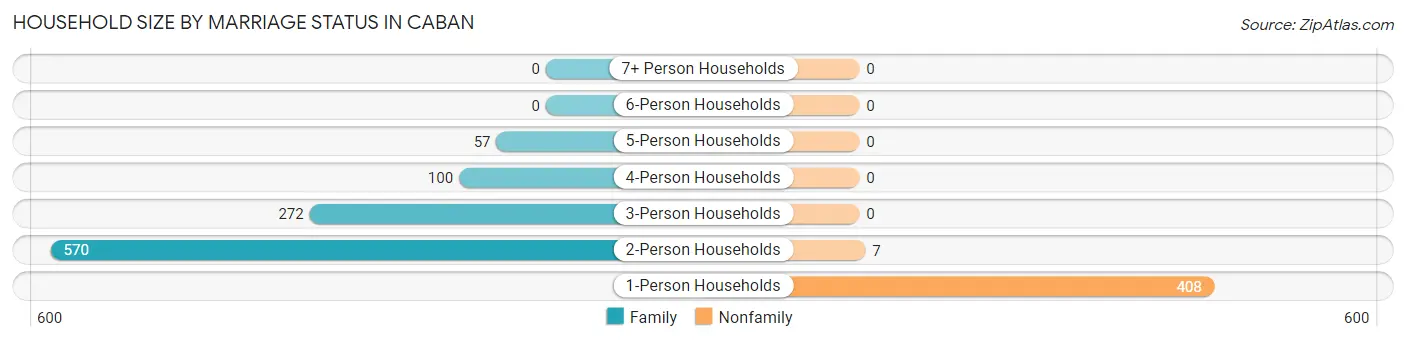
Out of a total of 1,414 households in Caban, 999 (70.7%) are family households, while 415 (29.3%) are nonfamily households. The most numerous type of family households are 2-person households, comprising 570, and the most common type of nonfamily households are 1-person households, comprising 408.
| Household Size | Family Households | Nonfamily Households |
| 1-Person Households | - | 408 (28.8%) |
| 2-Person Households | 570 (40.3%) | 7 (0.5%) |
| 3-Person Households | 272 (19.2%) | 0 (0.0%) |
| 4-Person Households | 100 (7.1%) | 0 (0.0%) |
| 5-Person Households | 57 (4.0%) | 0 (0.0%) |
| 6-Person Households | 0 (0.0%) | 0 (0.0%) |
| 7+ Person Households | 0 (0.0%) | 0 (0.0%) |
| Total | 999 (70.7%) | 415 (29.3%) |
Female Fertility in Caban
Fertility by Age in Caban

| Age Bracket | Women with Births | Births / 1,000 Women |
| 15 to 19 years | 0 (0.0%) | 0.0 |
| 20 to 34 years | 0 (0.0%) | 0.0 |
| 35 to 50 years | 0 (0.0%) | 0.0 |
| Total | 0 (0.0%) | 0.0 |
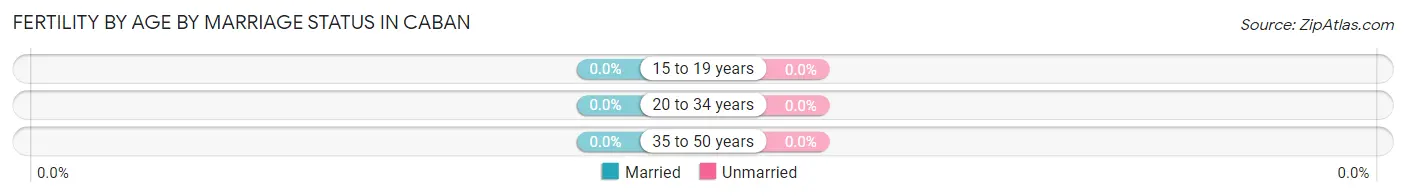
Fertility by Age by Marriage Status in Caban
| Age Bracket | Married | Unmarried |
| 15 to 19 years | 0 (0.0%) | 0 (0.0%) |
| 20 to 34 years | 0 (0.0%) | 0 (0.0%) |
| 35 to 50 years | 0 (0.0%) | 0 (0.0%) |
| Total | 0 (0.0%) | 0 (0.0%) |
Fertility by Education in Caban
| Educational Attainment | Women with Births | Births / 1,000 Women |
| Less than High School | 0 (0.0%) | 0.0 |
| High School Diploma | 0 (0.0%) | 0.0 |
| College or Associate's Degree | 0 (0.0%) | 0.0 |
| Bachelor's Degree | 0 (0.0%) | 0.0 |
| Graduate Degree | 0 (0.0%) | 0.0 |
| Total | 0 (0.0%) | 0.0 |
Fertility by Education by Marriage Status in Caban
| Educational Attainment | Married | Unmarried |
| Less than High School | 0 (0.0%) | 0 (0.0%) |
| High School Diploma | 0 (0.0%) | 0 (0.0%) |
| College or Associate's Degree | 0 (0.0%) | 0 (0.0%) |
| Bachelor's Degree | 0 (0.0%) | 0 (0.0%) |
| Graduate Degree | 0 (0.0%) | 0 (0.0%) |
| Total | 0 (0.0%) | 0 (0.0%) |
Employment Characteristics in Caban
Employment by Class of Employer in Caban
Among the 724 employed individuals in Caban, private company employees (444 | 61.3%), self-employed (not incorporated) (140 | 19.3%), and state government employees (35 | 4.8%) make up the most common classes of employment.
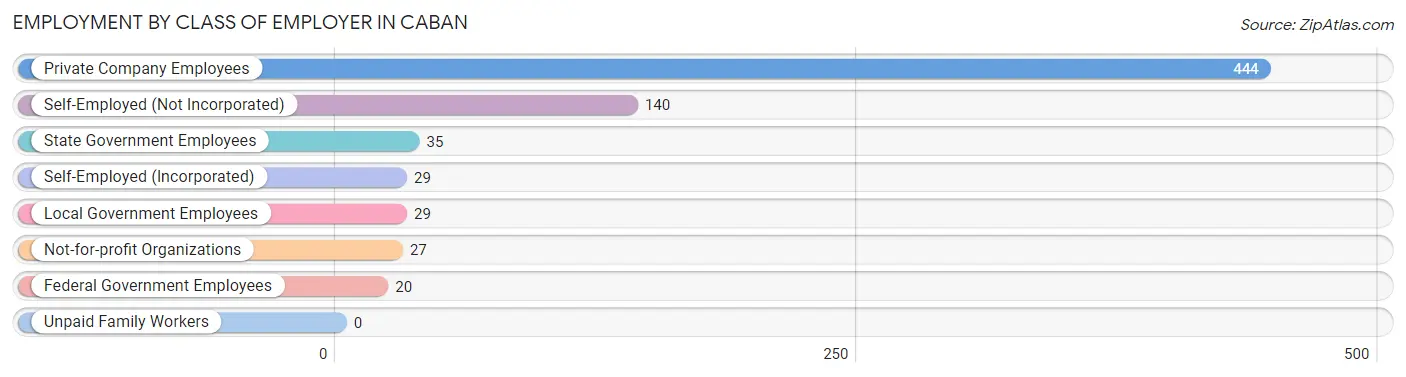
| Employer Class | # Employees | % Employees |
| Private Company Employees | 444 | 61.3% |
| Self-Employed (Incorporated) | 29 | 4.0% |
| Self-Employed (Not Incorporated) | 140 | 19.3% |
| Not-for-profit Organizations | 27 | 3.7% |
| Local Government Employees | 29 | 4.0% |
| State Government Employees | 35 | 4.8% |
| Federal Government Employees | 20 | 2.8% |
| Unpaid Family Workers | 0 | 0.0% |
| Total | 724 | 100.0% |
Employment Status by Age in Caban
According to the labor force statistics for Caban, out of the total population over 16 years of age (2,717), 31.9% or 867 individuals are in the labor force, with 6.2% or 54 of them unemployed. The age group with the highest labor force participation rate is 30 to 34 years, with 66.5% or 141 individuals in the labor force. Within the labor force, the 35 to 44 years age range has the highest percentage of unemployed individuals, with 11.8% or 36 of them being unemployed.
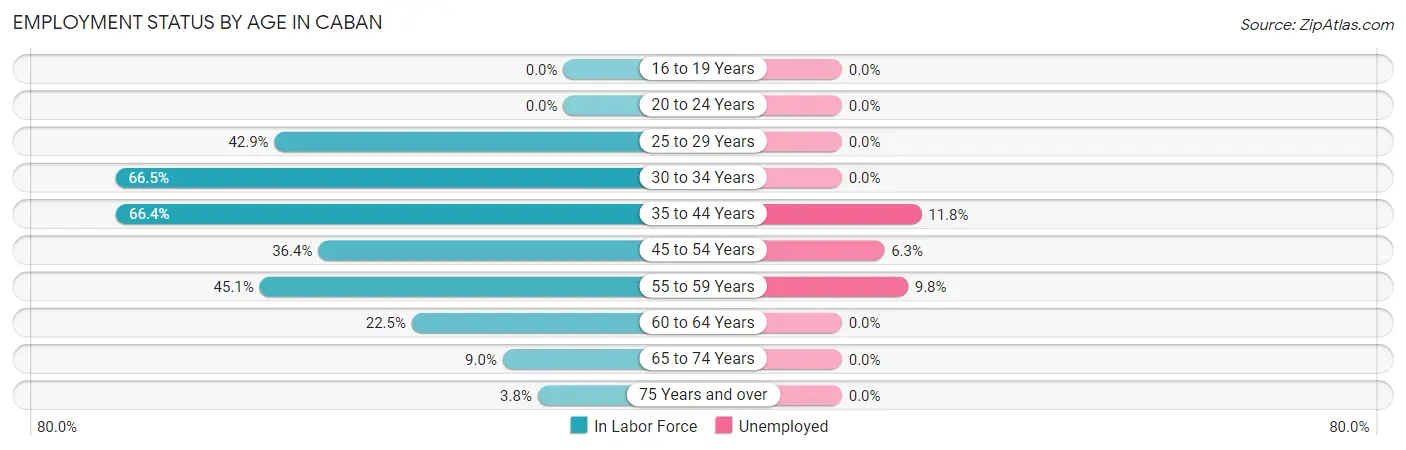
| Age Bracket | In Labor Force | Unemployed |
| 16 to 19 Years | 0 (0.0%) | 0 (0.0%) |
| 20 to 24 Years | 0 (0.0%) | 0 (0.0%) |
| 25 to 29 Years | 93 (42.9%) | 0 (0.0%) |
| 30 to 34 Years | 141 (66.5%) | 0 (0.0%) |
| 35 to 44 Years | 305 (66.4%) | 36 (11.8%) |
| 45 to 54 Years | 126 (36.4%) | 8 (6.3%) |
| 55 to 59 Years | 102 (45.1%) | 10 (9.8%) |
| 60 to 64 Years | 54 (22.5%) | 0 (0.0%) |
| 65 to 74 Years | 35 (9.0%) | 0 (0.0%) |
| 75 Years and over | 12 (3.8%) | 0 (0.0%) |
| Total | 867 (31.9%) | 54 (6.2%) |
Employment Status by Educational Attainment in Caban
According to labor force statistics for Caban, 48.3% of individuals (821) out of the total population between 25 and 64 years of age (1,700) are in the labor force, with 6.6% or 54 of them being unemployed. The group with the highest labor force participation rate are those with the educational attainment of college / associate degree, with 75.3% or 225 individuals in the labor force. Within the labor force, individuals with less than high school education have the highest percentage of unemployment, with 31.7% or 19 of them being unemployed.
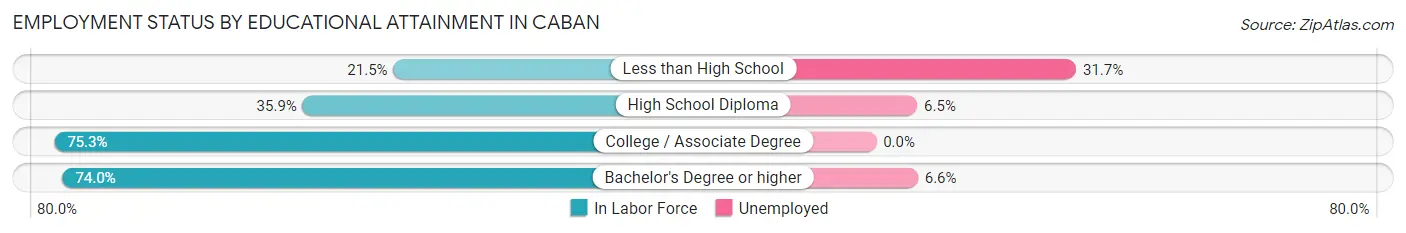
| Educational Attainment | In Labor Force | Unemployed |
| Less than High School | 60 (21.5%) | 88 (31.7%) |
| High School Diploma | 277 (35.9%) | 50 (6.5%) |
| College / Associate Degree | 225 (75.3%) | 0 (0.0%) |
| Bachelor's Degree or higher | 259 (74.0%) | 23 (6.6%) |
| Total | 821 (48.3%) | 112 (6.6%) |
Employment Occupations by Sex in Caban
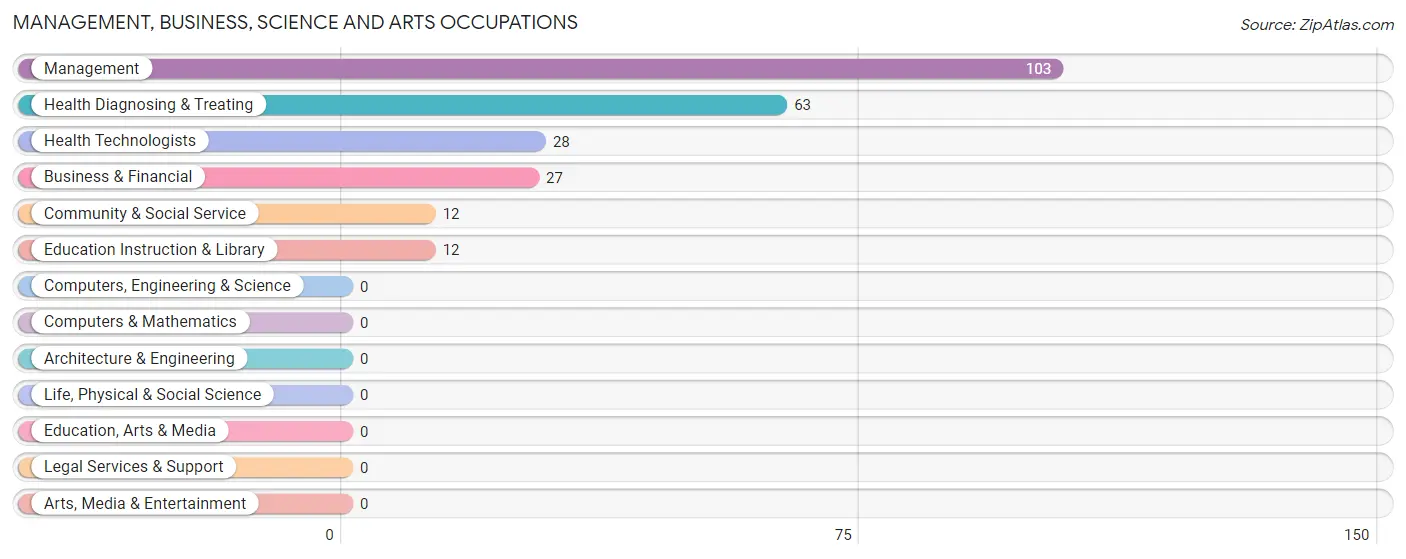
Management, Business, Science and Arts Occupations
The most common Management, Business, Science and Arts occupations in Caban are Management (103 | 12.7%), Health Diagnosing & Treating (63 | 7.7%), Health Technologists (28 | 3.4%), Business & Financial (27 | 3.3%), and Community & Social Service (12 | 1.5%).
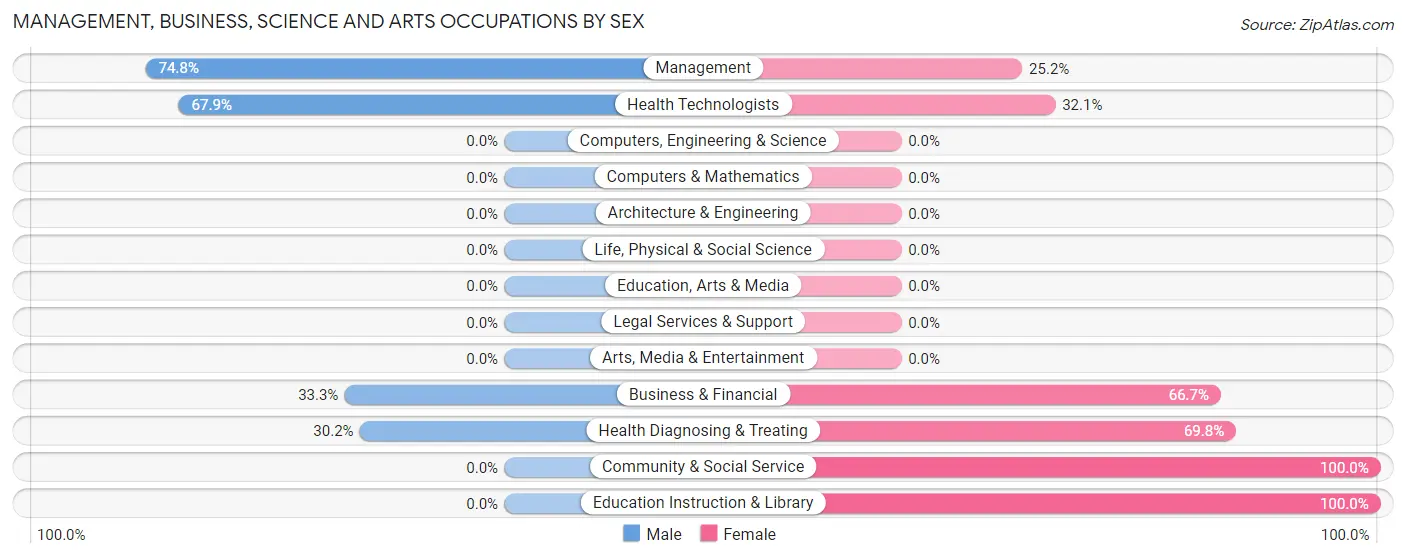
Management, Business, Science and Arts Occupations by Sex
Within the Management, Business, Science and Arts occupations in Caban, the most male-oriented occupations are Management (74.8%), Health Technologists (67.9%), and Business & Financial (33.3%), while the most female-oriented occupations are Community & Social Service (100.0%), Education Instruction & Library (100.0%), and Health Diagnosing & Treating (69.8%).
| Occupation | Male | Female |
| Management | 77 (74.8%) | 26 (25.2%) |
| Business & Financial | 9 (33.3%) | 18 (66.7%) |
| Computers, Engineering & Science | 0 (0.0%) | 0 (0.0%) |
| Computers & Mathematics | 0 (0.0%) | 0 (0.0%) |
| Architecture & Engineering | 0 (0.0%) | 0 (0.0%) |
| Life, Physical & Social Science | 0 (0.0%) | 0 (0.0%) |
| Community & Social Service | 0 (0.0%) | 12 (100.0%) |
| Education, Arts & Media | 0 (0.0%) | 0 (0.0%) |
| Legal Services & Support | 0 (0.0%) | 0 (0.0%) |
| Education Instruction & Library | 0 (0.0%) | 12 (100.0%) |
| Arts, Media & Entertainment | 0 (0.0%) | 0 (0.0%) |
| Health Diagnosing & Treating | 19 (30.2%) | 44 (69.8%) |
| Health Technologists | 19 (67.9%) | 9 (32.1%) |
| Total (Category) | 105 (51.2%) | 100 (48.8%) |
| Total (Overall) | 510 (62.6%) | 304 (37.3%) |
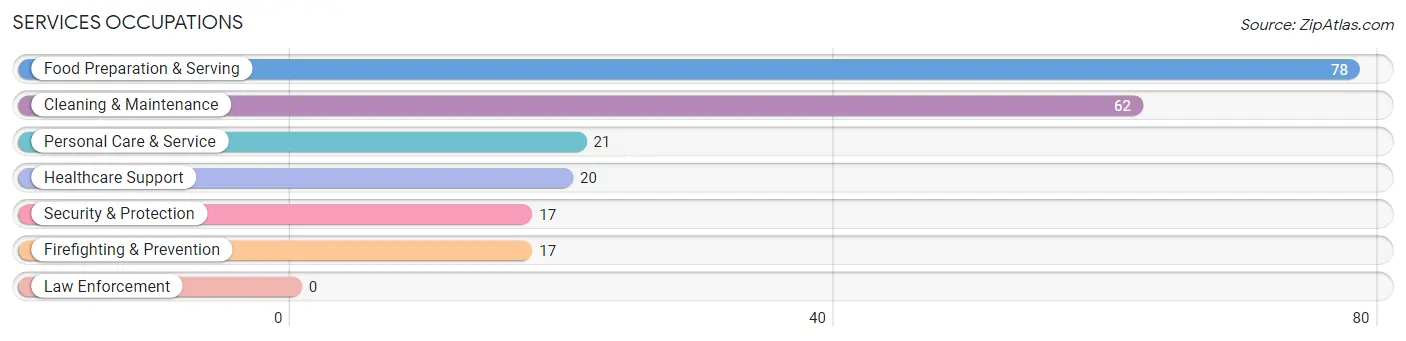
Services Occupations
The most common Services occupations in Caban are Food Preparation & Serving (78 | 9.6%), Cleaning & Maintenance (62 | 7.6%), Personal Care & Service (21 | 2.6%), Healthcare Support (20 | 2.5%), and Security & Protection (17 | 2.1%).
Services Occupations by Sex
Within the Services occupations in Caban, the most male-oriented occupations are Security & Protection (100.0%), Firefighting & Prevention (100.0%), and Food Preparation & Serving (100.0%), while the most female-oriented occupations are Healthcare Support (100.0%), and Personal Care & Service (100.0%).
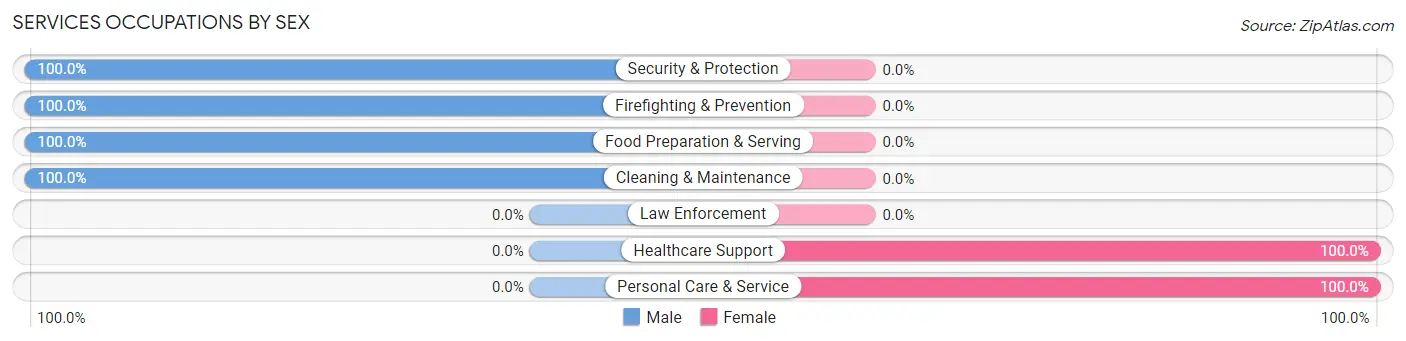
| Occupation | Male | Female |
| Healthcare Support | 0 (0.0%) | 20 (100.0%) |
| Security & Protection | 17 (100.0%) | 0 (0.0%) |
| Firefighting & Prevention | 17 (100.0%) | 0 (0.0%) |
| Law Enforcement | 0 (0.0%) | 0 (0.0%) |
| Food Preparation & Serving | 78 (100.0%) | 0 (0.0%) |
| Cleaning & Maintenance | 62 (100.0%) | 0 (0.0%) |
| Personal Care & Service | 0 (0.0%) | 21 (100.0%) |
| Total (Category) | 157 (79.3%) | 41 (20.7%) |
| Total (Overall) | 510 (62.6%) | 304 (37.3%) |
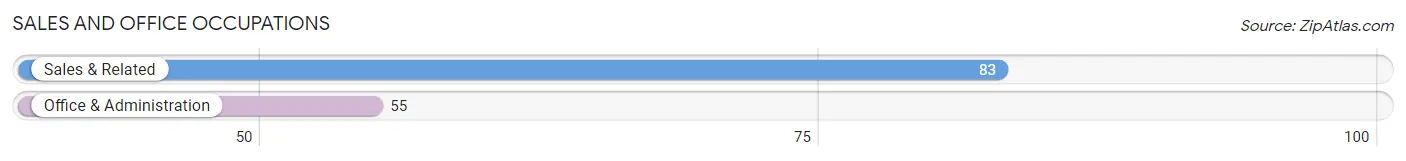
Sales and Office Occupations
The most common Sales and Office occupations in Caban are Sales & Related (83 | 10.2%), and Office & Administration (55 | 6.8%).
Sales and Office Occupations by Sex
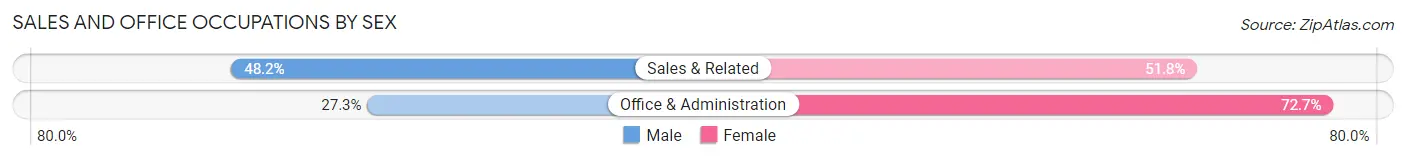
| Occupation | Male | Female |
| Sales & Related | 40 (48.2%) | 43 (51.8%) |
| Office & Administration | 15 (27.3%) | 40 (72.7%) |
| Total (Category) | 55 (39.9%) | 83 (60.1%) |
| Total (Overall) | 510 (62.6%) | 304 (37.3%) |
Natural Resources, Construction and Maintenance Occupations
The most common Natural Resources, Construction and Maintenance occupations in Caban are Construction & Extraction (51 | 6.3%), and Installation, Maintenance & Repair (48 | 5.9%).
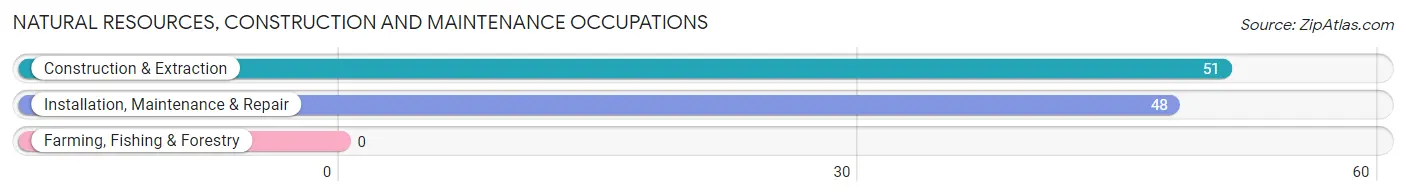
Natural Resources, Construction and Maintenance Occupations by Sex
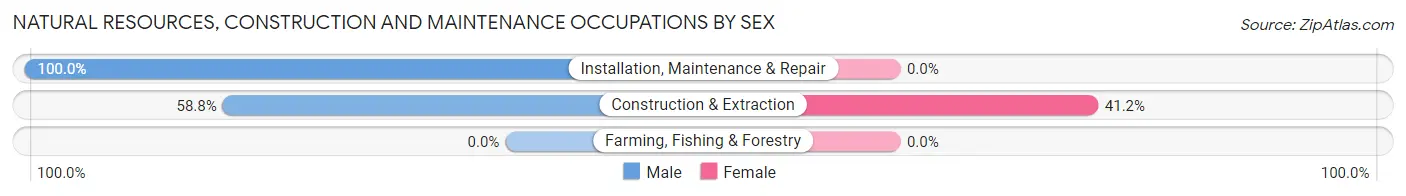
| Occupation | Male | Female |
| Farming, Fishing & Forestry | 0 (0.0%) | 0 (0.0%) |
| Construction & Extraction | 30 (58.8%) | 21 (41.2%) |
| Installation, Maintenance & Repair | 48 (100.0%) | 0 (0.0%) |
| Total (Category) | 78 (78.8%) | 21 (21.2%) |
| Total (Overall) | 510 (62.6%) | 304 (37.3%) |
Production, Transportation and Moving Occupations
The most common Production, Transportation and Moving occupations in Caban are Production (130 | 16.0%), and Material Moving (44 | 5.4%).
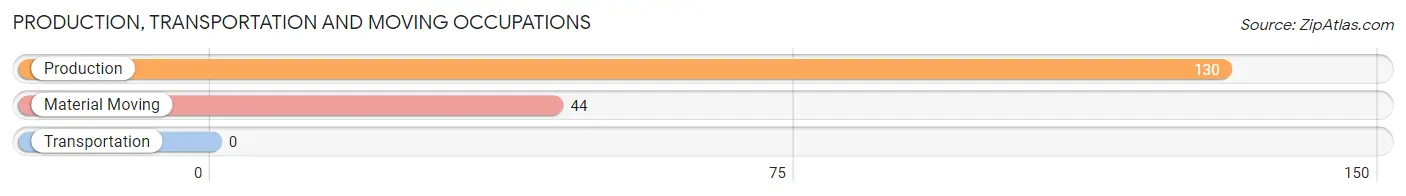
Production, Transportation and Moving Occupations by Sex
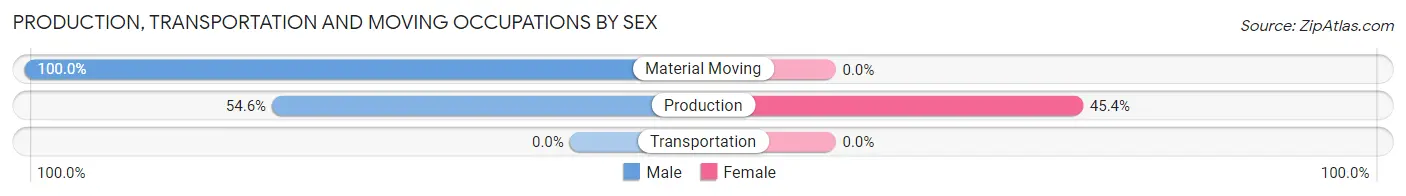
| Occupation | Male | Female |
| Production | 71 (54.6%) | 59 (45.4%) |
| Transportation | 0 (0.0%) | 0 (0.0%) |
| Material Moving | 44 (100.0%) | 0 (0.0%) |
| Total (Category) | 115 (66.1%) | 59 (33.9%) |
| Total (Overall) | 510 (62.6%) | 304 (37.3%) |
Employment Industries by Sex in Caban
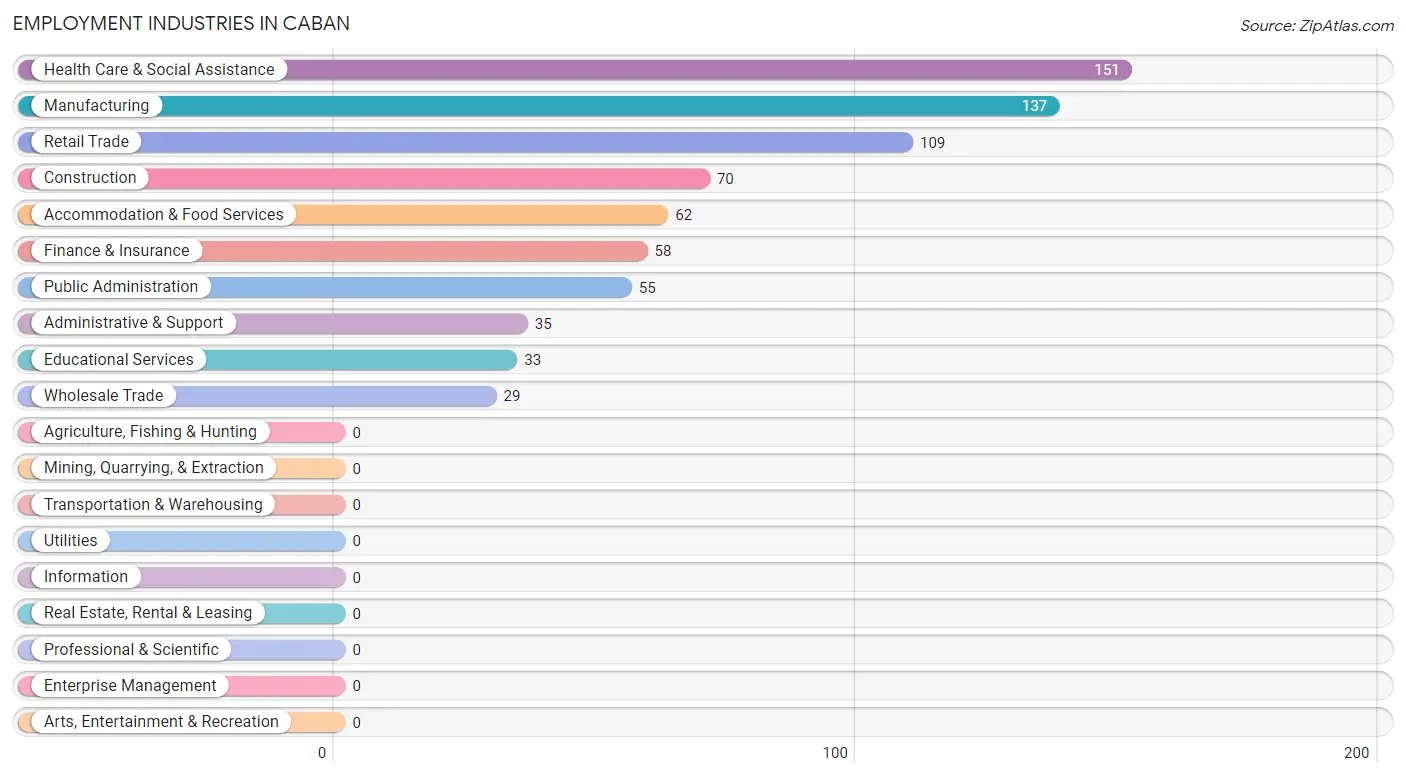
Employment Industries in Caban
The major employment industries in Caban include Health Care & Social Assistance (151 | 18.5%), Manufacturing (137 | 16.8%), Retail Trade (109 | 13.4%), Construction (70 | 8.6%), and Accommodation & Food Services (62 | 7.6%).
Employment Industries by Sex in Caban
The Caban industries that see more men than women are Wholesale Trade (100.0%), Administrative & Support (100.0%), and Accommodation & Food Services (100.0%), whereas the industries that tend to have a higher number of women are Educational Services (100.0%), Finance & Insurance (69.0%), and Retail Trade (56.0%).
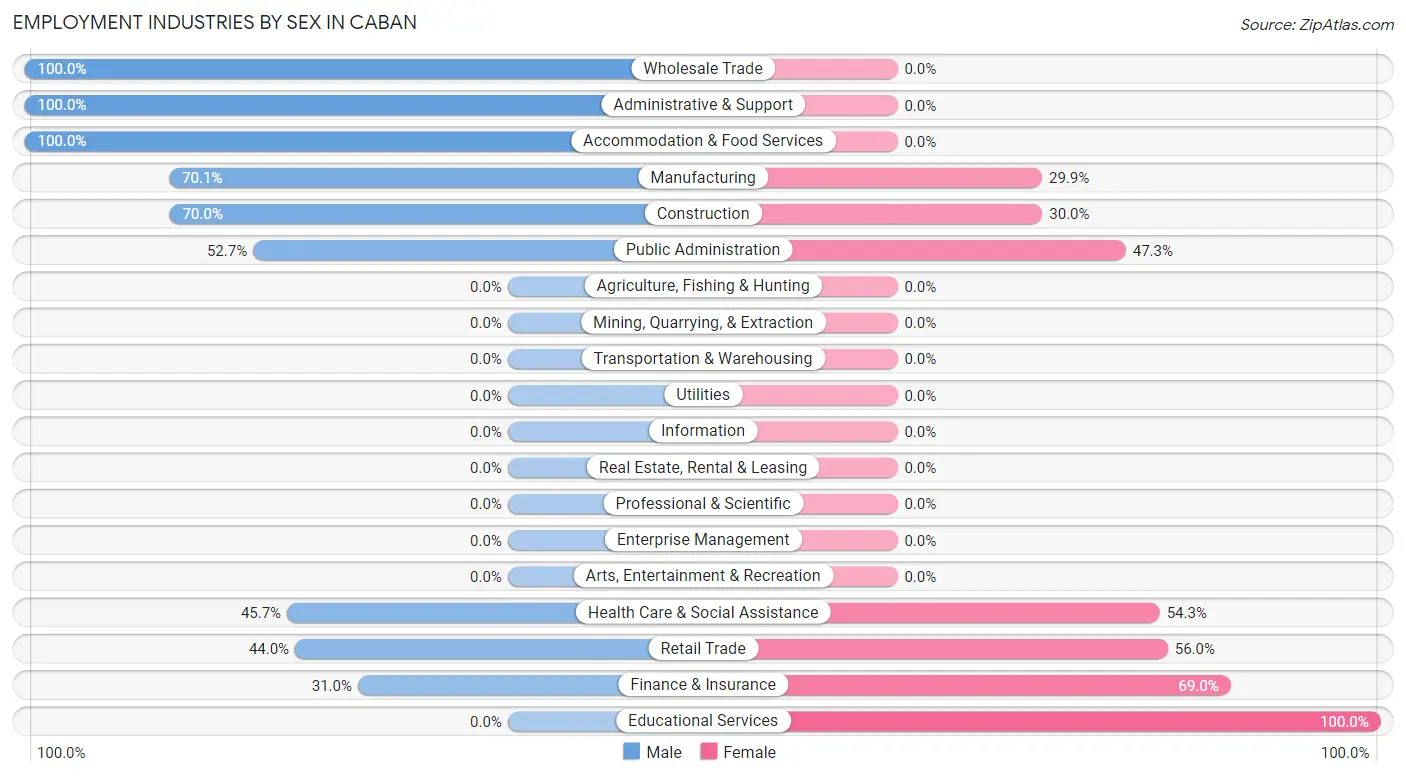
| Industry | Male | Female |
| Agriculture, Fishing & Hunting | 0 (0.0%) | 0 (0.0%) |
| Mining, Quarrying, & Extraction | 0 (0.0%) | 0 (0.0%) |
| Construction | 49 (70.0%) | 21 (30.0%) |
| Manufacturing | 96 (70.1%) | 41 (29.9%) |
| Wholesale Trade | 29 (100.0%) | 0 (0.0%) |
| Retail Trade | 48 (44.0%) | 61 (56.0%) |
| Transportation & Warehousing | 0 (0.0%) | 0 (0.0%) |
| Utilities | 0 (0.0%) | 0 (0.0%) |
| Information | 0 (0.0%) | 0 (0.0%) |
| Finance & Insurance | 18 (31.0%) | 40 (69.0%) |
| Real Estate, Rental & Leasing | 0 (0.0%) | 0 (0.0%) |
| Professional & Scientific | 0 (0.0%) | 0 (0.0%) |
| Enterprise Management | 0 (0.0%) | 0 (0.0%) |
| Administrative & Support | 35 (100.0%) | 0 (0.0%) |
| Educational Services | 0 (0.0%) | 33 (100.0%) |
| Health Care & Social Assistance | 69 (45.7%) | 82 (54.3%) |
| Arts, Entertainment & Recreation | 0 (0.0%) | 0 (0.0%) |
| Accommodation & Food Services | 62 (100.0%) | 0 (0.0%) |
| Public Administration | 29 (52.7%) | 26 (47.3%) |
| Total | 510 (62.6%) | 304 (37.3%) |
Education in Caban
School Enrollment in Caban
The most common levels of schooling among the 764 students in Caban are high school (238 | 31.1%), elementary school (186 | 24.3%), and college / undergraduate (156 | 20.4%).
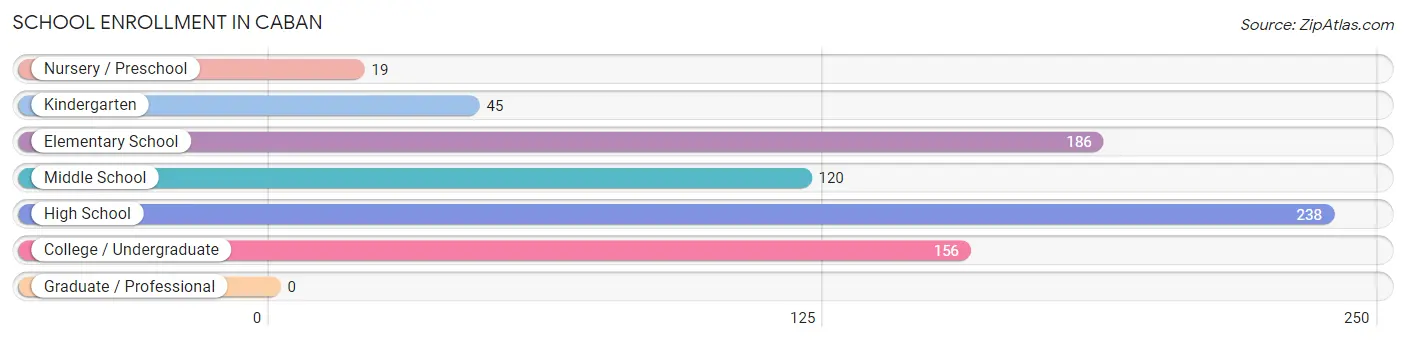
| School Level | # Students | % Students |
| Nursery / Preschool | 19 | 2.5% |
| Kindergarten | 45 | 5.9% |
| Elementary School | 186 | 24.3% |
| Middle School | 120 | 15.7% |
| High School | 238 | 31.1% |
| College / Undergraduate | 156 | 20.4% |
| Graduate / Professional | 0 | 0.0% |
| Total | 764 | 100.0% |
School Enrollment by Age by Funding Source in Caban
Out of a total of 764 students who are enrolled in schools in Caban, 225 (29.5%) attend a private institution, while the remaining 539 (70.5%) are enrolled in public schools. The age group of 25 to 34 year olds has the highest likelihood of being enrolled in private schools, with 43 (100.0% in the age bracket) enrolled. Conversely, the age group of 3 to 4 year olds has the lowest likelihood of being enrolled in a private school, with 19 (100.0% in the age bracket) attending a public institution.
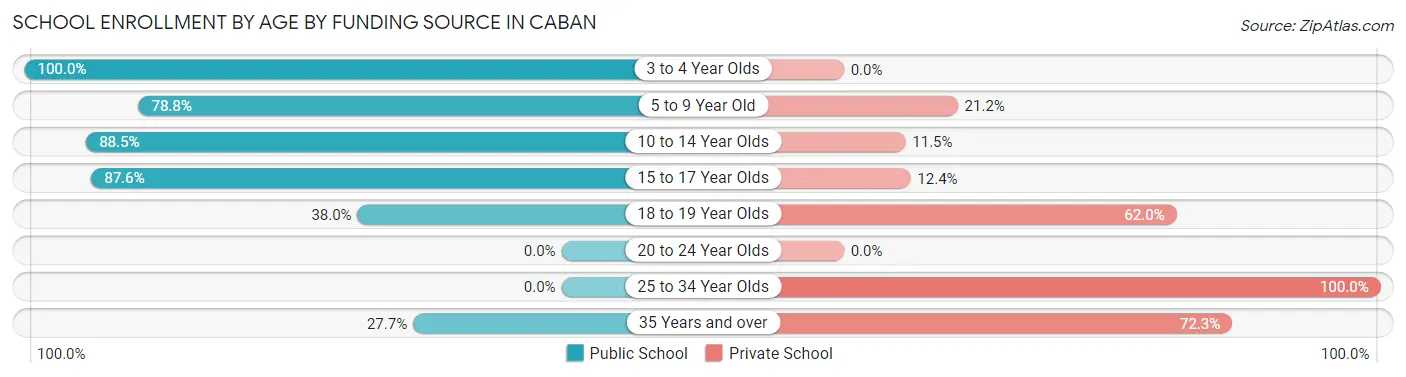
| Age Bracket | Public School | Private School |
| 3 to 4 Year Olds | 19 (100.0%) | 0 (0.0%) |
| 5 to 9 Year Old | 167 (78.8%) | 45 (21.2%) |
| 10 to 14 Year Olds | 154 (88.5%) | 20 (11.5%) |
| 15 to 17 Year Olds | 148 (87.6%) | 21 (12.4%) |
| 18 to 19 Year Olds | 38 (38.0%) | 62 (62.0%) |
| 20 to 24 Year Olds | 0 (0.0%) | 0 (0.0%) |
| 25 to 34 Year Olds | 0 (0.0%) | 43 (100.0%) |
| 35 Years and over | 13 (27.7%) | 34 (72.3%) |
| Total | 539 (70.5%) | 225 (29.5%) |
Educational Attainment by Field of Study in Caban
Business (143 | 36.8%), science & technology (46 | 11.8%), bio, nature & agricultural (43 | 11.1%), education (36 | 9.2%), and social sciences (33 | 8.5%) are the most common fields of study among 389 individuals in Caban who have obtained a bachelor's degree or higher.
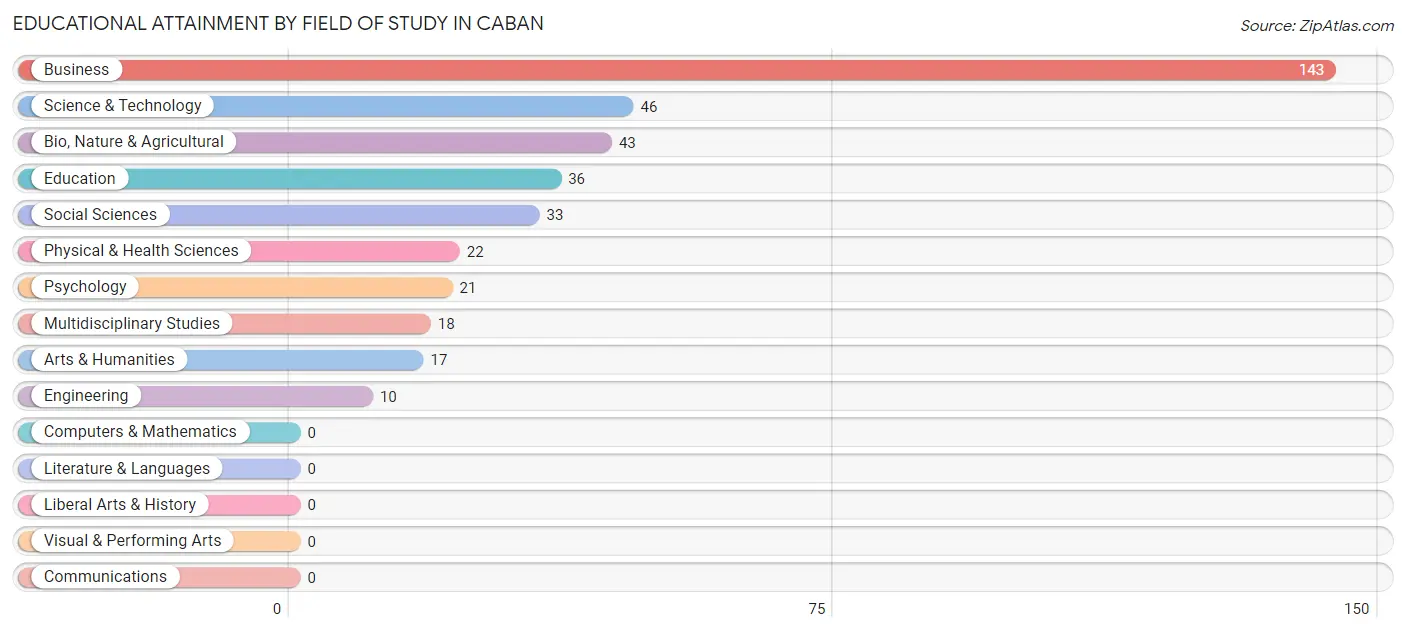
| Field of Study | # Graduates | % Graduates |
| Computers & Mathematics | 0 | 0.0% |
| Bio, Nature & Agricultural | 43 | 11.1% |
| Physical & Health Sciences | 22 | 5.7% |
| Psychology | 21 | 5.4% |
| Social Sciences | 33 | 8.5% |
| Engineering | 10 | 2.6% |
| Multidisciplinary Studies | 18 | 4.6% |
| Science & Technology | 46 | 11.8% |
| Business | 143 | 36.8% |
| Education | 36 | 9.2% |
| Literature & Languages | 0 | 0.0% |
| Liberal Arts & History | 0 | 0.0% |
| Visual & Performing Arts | 0 | 0.0% |
| Communications | 0 | 0.0% |
| Arts & Humanities | 17 | 4.4% |
| Total | 389 | 100.0% |
Transportation & Commute in Caban
Vehicle Availability by Sex in Caban
The most prevalent vehicle ownership categories in Caban are males with 2 vehicles (197, accounting for 42.4%) and females with 2 vehicles (49, making up 76.1%).
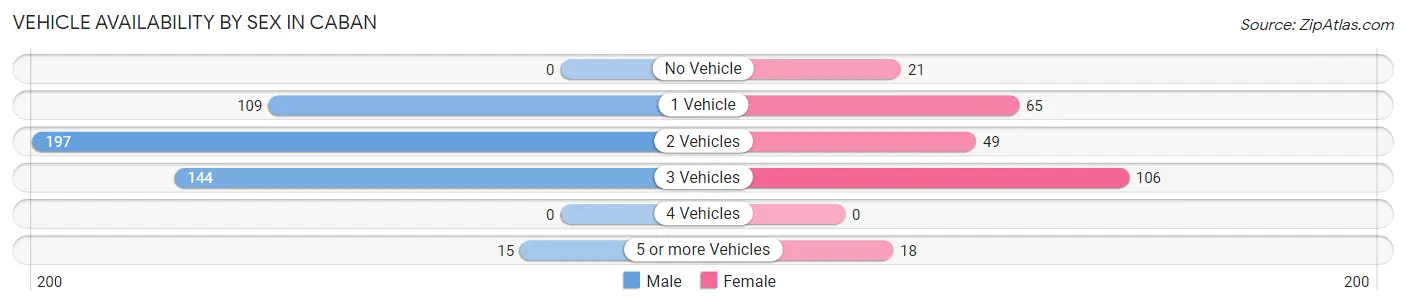
| Vehicles Available | Male | Female |
| No Vehicle | 0 (0.0%) | 21 (8.1%) |
| 1 Vehicle | 109 (23.4%) | 65 (25.1%) |
| 2 Vehicles | 197 (42.4%) | 49 (18.9%) |
| 3 Vehicles | 144 (31.0%) | 106 (40.9%) |
| 4 Vehicles | 0 (0.0%) | 0 (0.0%) |
| 5 or more Vehicles | 15 (3.2%) | 18 (7.0%) |
| Total | 465 (100.0%) | 259 (100.0%) |
Commute Time in Caban
The most frequently occuring commute durations in Caban are 15 to 19 minutes (267 commuters, 38.0%), 10 to 14 minutes (168 commuters, 23.9%), and 20 to 24 minutes (123 commuters, 17.5%).
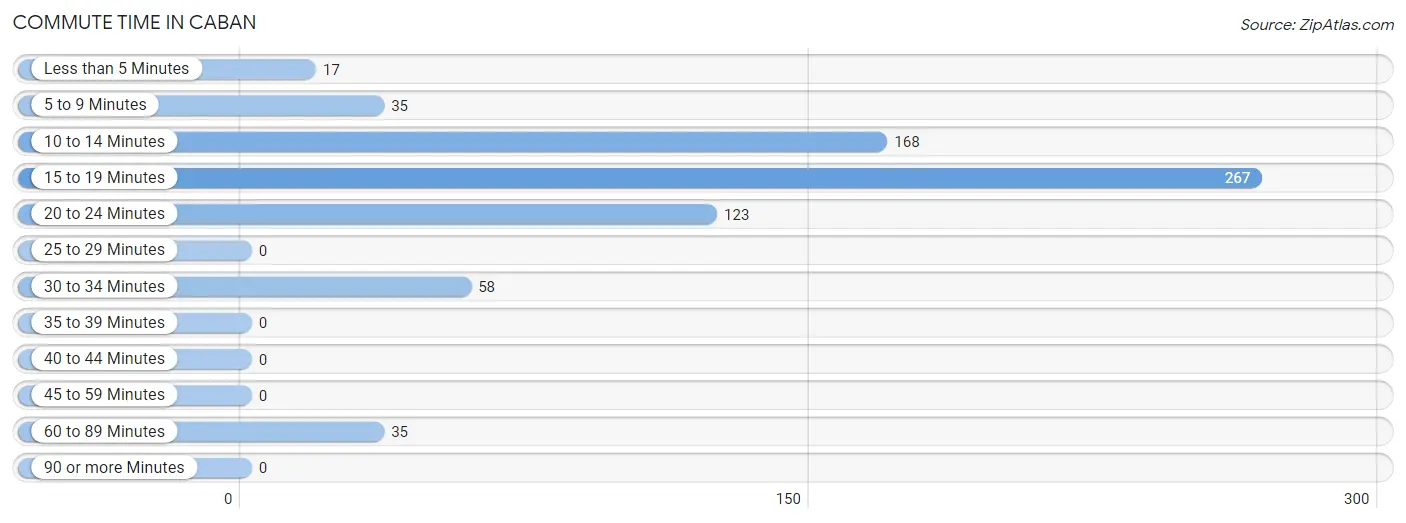
| Commute Time | # Commuters | % Commuters |
| Less than 5 Minutes | 17 | 2.4% |
| 5 to 9 Minutes | 35 | 5.0% |
| 10 to 14 Minutes | 168 | 23.9% |
| 15 to 19 Minutes | 267 | 38.0% |
| 20 to 24 Minutes | 123 | 17.5% |
| 25 to 29 Minutes | 0 | 0.0% |
| 30 to 34 Minutes | 58 | 8.3% |
| 35 to 39 Minutes | 0 | 0.0% |
| 40 to 44 Minutes | 0 | 0.0% |
| 45 to 59 Minutes | 0 | 0.0% |
| 60 to 89 Minutes | 35 | 5.0% |
| 90 or more Minutes | 0 | 0.0% |
Commute Time by Sex in Caban
The most common commute times in Caban are 10 to 14 minutes (127 commuters, 27.3%) for males and 15 to 19 minutes (177 commuters, 74.4%) for females.
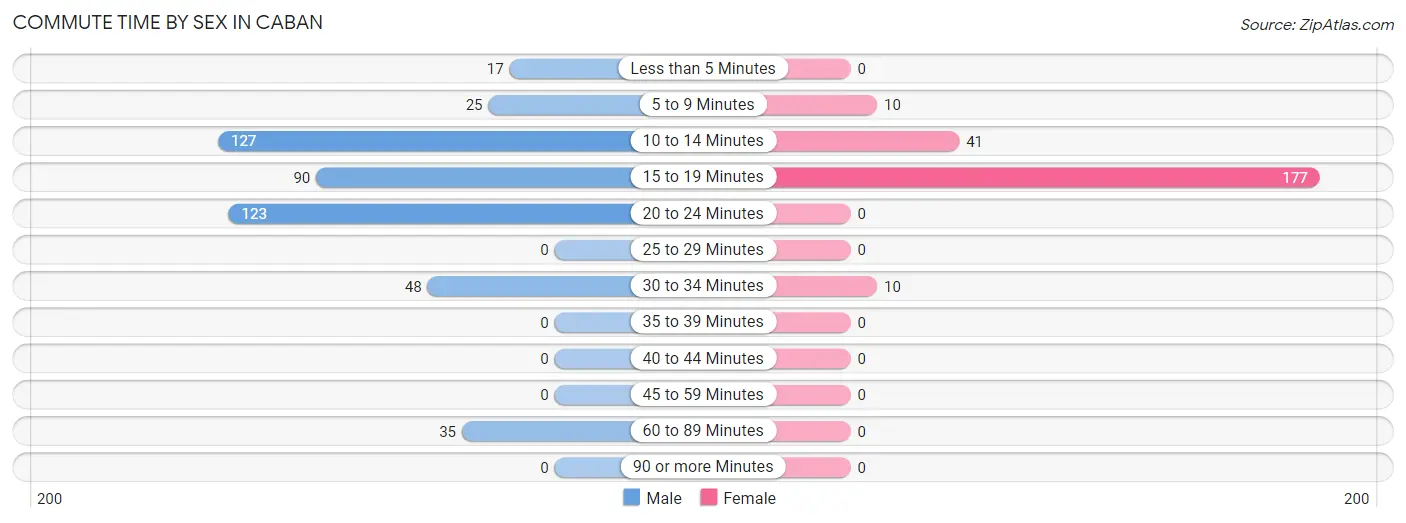
| Commute Time | Male | Female |
| Less than 5 Minutes | 17 (3.7%) | 0 (0.0%) |
| 5 to 9 Minutes | 25 (5.4%) | 10 (4.2%) |
| 10 to 14 Minutes | 127 (27.3%) | 41 (17.2%) |
| 15 to 19 Minutes | 90 (19.4%) | 177 (74.4%) |
| 20 to 24 Minutes | 123 (26.5%) | 0 (0.0%) |
| 25 to 29 Minutes | 0 (0.0%) | 0 (0.0%) |
| 30 to 34 Minutes | 48 (10.3%) | 10 (4.2%) |
| 35 to 39 Minutes | 0 (0.0%) | 0 (0.0%) |
| 40 to 44 Minutes | 0 (0.0%) | 0 (0.0%) |
| 45 to 59 Minutes | 0 (0.0%) | 0 (0.0%) |
| 60 to 89 Minutes | 35 (7.5%) | 0 (0.0%) |
| 90 or more Minutes | 0 (0.0%) | 0 (0.0%) |
Time of Departure to Work by Sex in Caban
The most frequent times of departure to work in Caban are 7:30 AM to 7:59 AM (91, 19.6%) for males and 7:30 AM to 7:59 AM (71, 29.8%) for females.
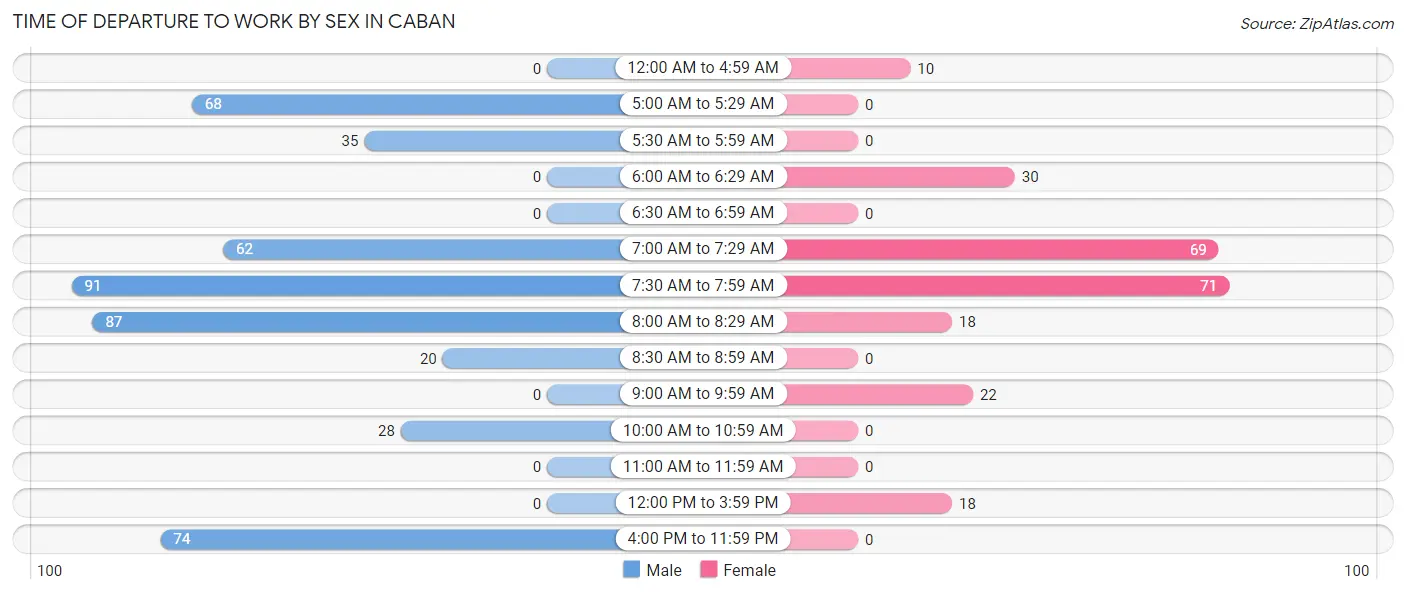
| Time of Departure | Male | Female |
| 12:00 AM to 4:59 AM | 0 (0.0%) | 10 (4.2%) |
| 5:00 AM to 5:29 AM | 68 (14.6%) | 0 (0.0%) |
| 5:30 AM to 5:59 AM | 35 (7.5%) | 0 (0.0%) |
| 6:00 AM to 6:29 AM | 0 (0.0%) | 30 (12.6%) |
| 6:30 AM to 6:59 AM | 0 (0.0%) | 0 (0.0%) |
| 7:00 AM to 7:29 AM | 62 (13.3%) | 69 (29.0%) |
| 7:30 AM to 7:59 AM | 91 (19.6%) | 71 (29.8%) |
| 8:00 AM to 8:29 AM | 87 (18.7%) | 18 (7.6%) |
| 8:30 AM to 8:59 AM | 20 (4.3%) | 0 (0.0%) |
| 9:00 AM to 9:59 AM | 0 (0.0%) | 22 (9.2%) |
| 10:00 AM to 10:59 AM | 28 (6.0%) | 0 (0.0%) |
| 11:00 AM to 11:59 AM | 0 (0.0%) | 0 (0.0%) |
| 12:00 PM to 3:59 PM | 0 (0.0%) | 18 (7.6%) |
| 4:00 PM to 11:59 PM | 74 (15.9%) | 0 (0.0%) |
| Total | 465 (100.0%) | 238 (100.0%) |
Housing Occupancy in Caban
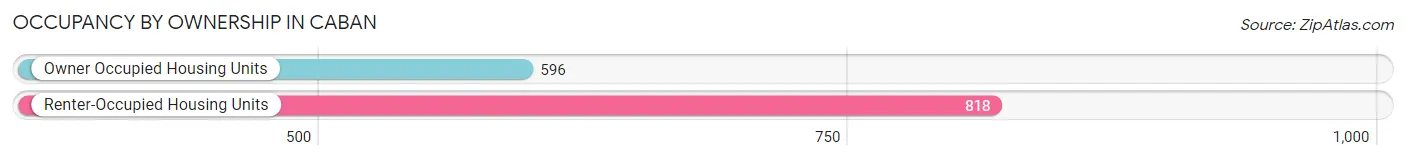
Occupancy by Ownership in Caban
Of the total 1,414 dwellings in Caban, owner-occupied units account for 596 (42.1%), while renter-occupied units make up 818 (57.9%).
| Occupancy | # Housing Units | % Housing Units |
| Owner Occupied Housing Units | 596 | 42.1% |
| Renter-Occupied Housing Units | 818 | 57.9% |
| Total Occupied Housing Units | 1,414 | 100.0% |
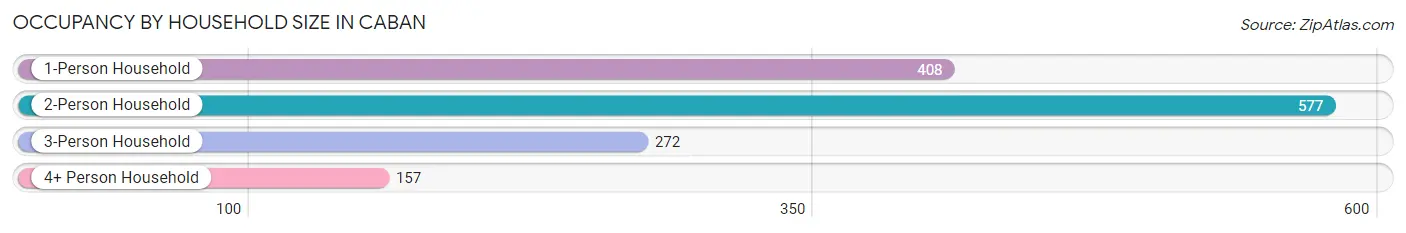
Occupancy by Household Size in Caban
| Household Size | # Housing Units | % Housing Units |
| 1-Person Household | 408 | 28.8% |
| 2-Person Household | 577 | 40.8% |
| 3-Person Household | 272 | 19.2% |
| 4+ Person Household | 157 | 11.1% |
| Total Housing Units | 1,414 | 100.0% |
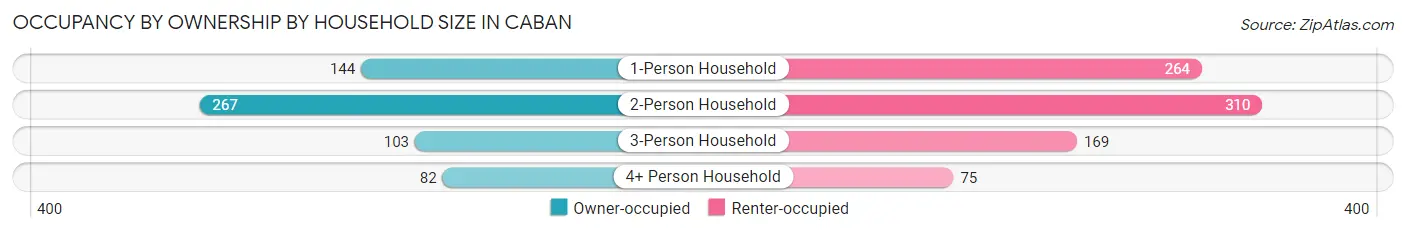
Occupancy by Ownership by Household Size in Caban
| Household Size | Owner-occupied | Renter-occupied |
| 1-Person Household | 144 (35.3%) | 264 (64.7%) |
| 2-Person Household | 267 (46.3%) | 310 (53.7%) |
| 3-Person Household | 103 (37.9%) | 169 (62.1%) |
| 4+ Person Household | 82 (52.2%) | 75 (47.8%) |
| Total Housing Units | 596 (42.1%) | 818 (57.9%) |
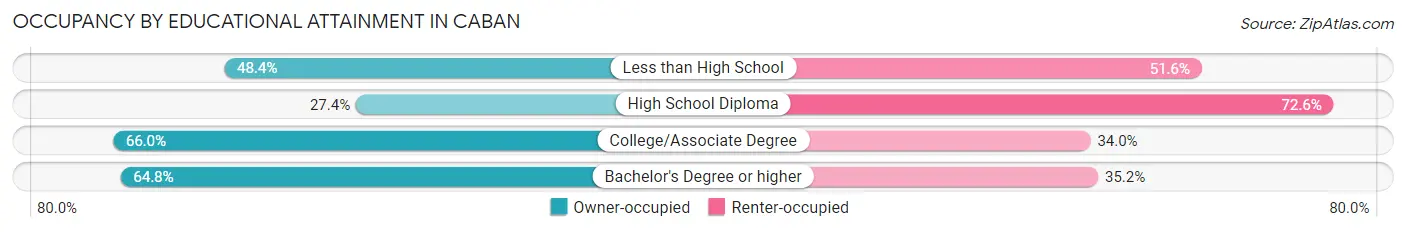
Occupancy by Educational Attainment in Caban
| Household Size | Owner-occupied | Renter-occupied |
| Less than High School | 251 (48.4%) | 268 (51.6%) |
| High School Diploma | 174 (27.4%) | 460 (72.6%) |
| College/Associate Degree | 101 (66.0%) | 52 (34.0%) |
| Bachelor's Degree or higher | 70 (64.8%) | 38 (35.2%) |
Occupancy by Age of Householder in Caban
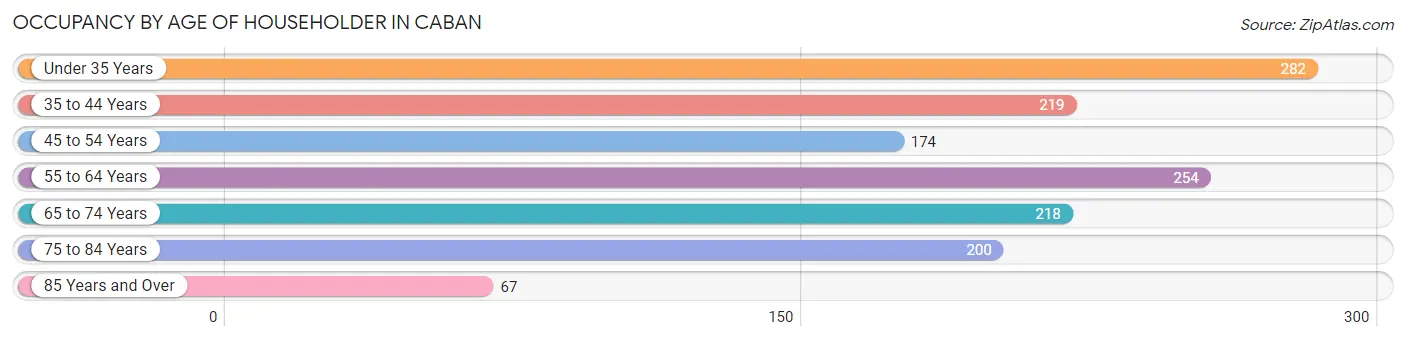
| Age Bracket | # Households | % Households |
| Under 35 Years | 282 | 19.9% |
| 35 to 44 Years | 219 | 15.5% |
| 45 to 54 Years | 174 | 12.3% |
| 55 to 64 Years | 254 | 18.0% |
| 65 to 74 Years | 218 | 15.4% |
| 75 to 84 Years | 200 | 14.1% |
| 85 Years and Over | 67 | 4.7% |
| Total | 1,414 | 100.0% |
Housing Finances in Caban
Median Income by Occupancy in Caban
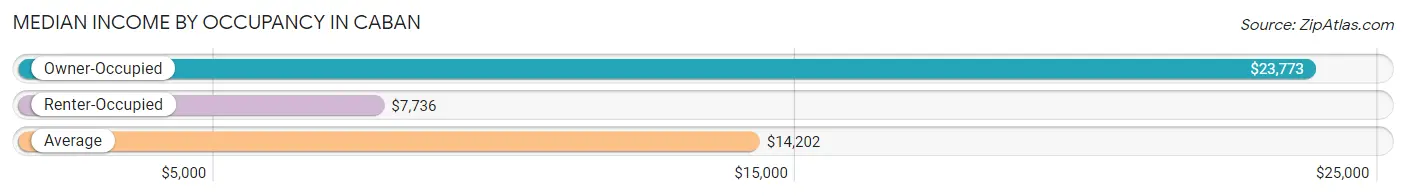
| Occupancy Type | # Households | Median Income |
| Owner-Occupied | 596 (42.1%) | $23,773 |
| Renter-Occupied | 818 (57.9%) | $7,736 |
| Average | 1,414 (100.0%) | $14,202 |
Occupancy by Householder Income Bracket in Caban
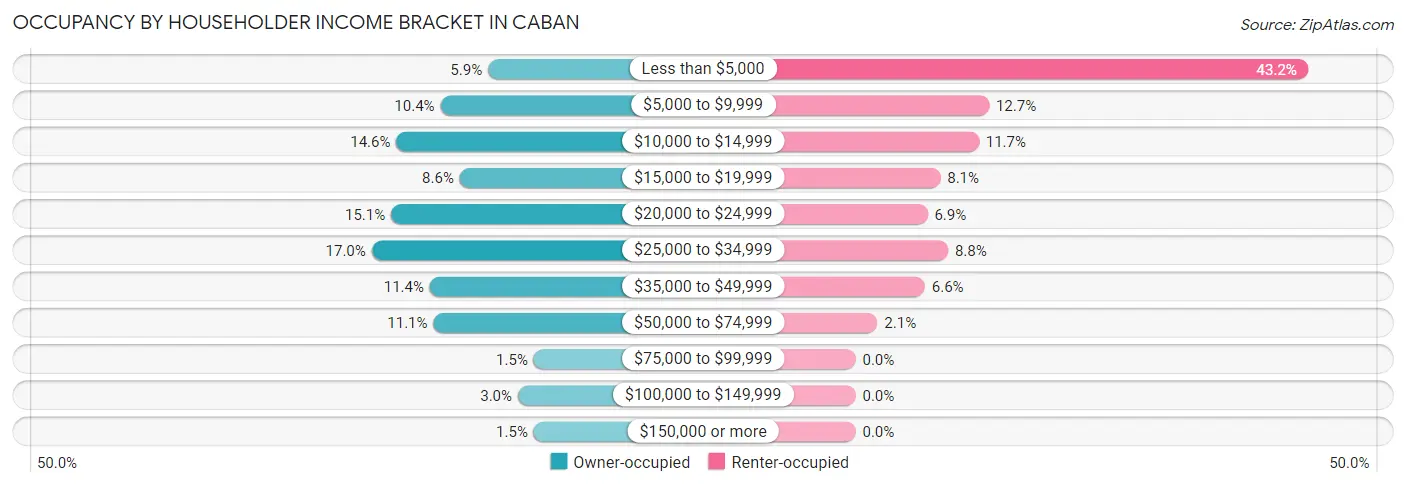
| Income Bracket | Owner-occupied | Renter-occupied |
| Less than $5,000 | 35 (5.9%) | 353 (43.1%) |
| $5,000 to $9,999 | 62 (10.4%) | 104 (12.7%) |
| $10,000 to $14,999 | 87 (14.6%) | 96 (11.7%) |
| $15,000 to $19,999 | 51 (8.6%) | 66 (8.1%) |
| $20,000 to $24,999 | 90 (15.1%) | 56 (6.9%) |
| $25,000 to $34,999 | 101 (17.0%) | 72 (8.8%) |
| $35,000 to $49,999 | 68 (11.4%) | 54 (6.6%) |
| $50,000 to $74,999 | 66 (11.1%) | 17 (2.1%) |
| $75,000 to $99,999 | 9 (1.5%) | 0 (0.0%) |
| $100,000 to $149,999 | 18 (3.0%) | 0 (0.0%) |
| $150,000 or more | 9 (1.5%) | 0 (0.0%) |
| Total | 596 (100.0%) | 818 (100.0%) |
Monthly Housing Cost Tiers in Caban
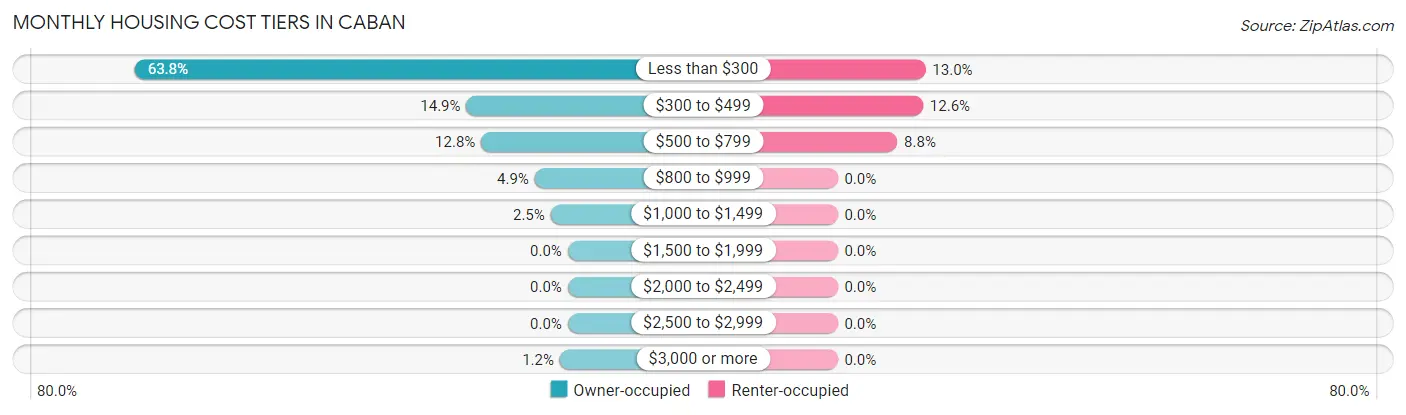
| Monthly Cost | Owner-occupied | Renter-occupied |
| Less than $300 | 380 (63.8%) | 106 (13.0%) |
| $300 to $499 | 89 (14.9%) | 103 (12.6%) |
| $500 to $799 | 76 (12.8%) | 72 (8.8%) |
| $800 to $999 | 29 (4.9%) | 0 (0.0%) |
| $1,000 to $1,499 | 15 (2.5%) | 0 (0.0%) |
| $1,500 to $1,999 | 0 (0.0%) | 0 (0.0%) |
| $2,000 to $2,499 | 0 (0.0%) | 0 (0.0%) |
| $2,500 to $2,999 | 0 (0.0%) | 0 (0.0%) |
| $3,000 or more | 7 (1.2%) | 0 (0.0%) |
| Total | 596 (100.0%) | 818 (100.0%) |
Physical Housing Characteristics in Caban
Housing Structures in Caban
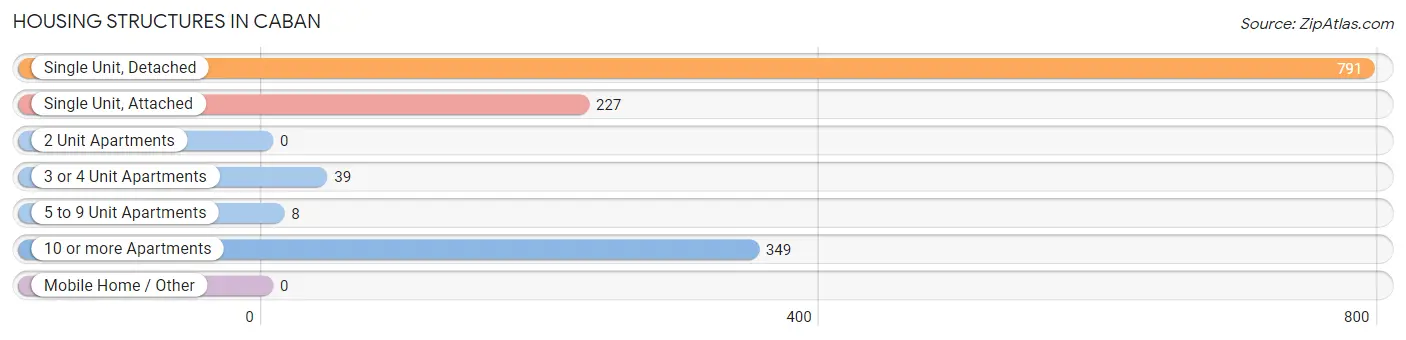
| Structure Type | # Housing Units | % Housing Units |
| Single Unit, Detached | 791 | 55.9% |
| Single Unit, Attached | 227 | 16.1% |
| 2 Unit Apartments | 0 | 0.0% |
| 3 or 4 Unit Apartments | 39 | 2.8% |
| 5 to 9 Unit Apartments | 8 | 0.6% |
| 10 or more Apartments | 349 | 24.7% |
| Mobile Home / Other | 0 | 0.0% |
| Total | 1,414 | 100.0% |
Housing Structures by Occupancy in Caban
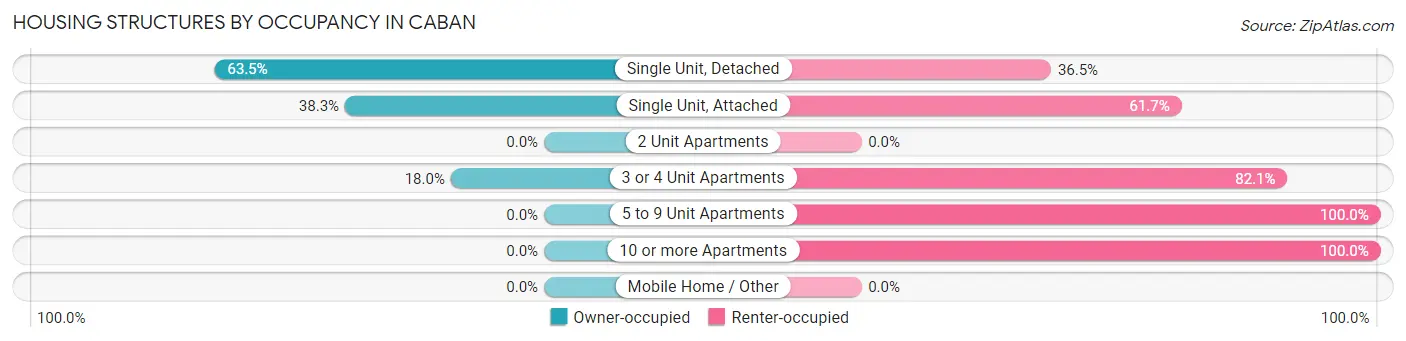
| Structure Type | Owner-occupied | Renter-occupied |
| Single Unit, Detached | 502 (63.5%) | 289 (36.5%) |
| Single Unit, Attached | 87 (38.3%) | 140 (61.7%) |
| 2 Unit Apartments | 0 (0.0%) | 0 (0.0%) |
| 3 or 4 Unit Apartments | 7 (17.9%) | 32 (82.1%) |
| 5 to 9 Unit Apartments | 0 (0.0%) | 8 (100.0%) |
| 10 or more Apartments | 0 (0.0%) | 349 (100.0%) |
| Mobile Home / Other | 0 (0.0%) | 0 (0.0%) |
| Total | 596 (42.1%) | 818 (57.9%) |
Housing Structures by Number of Rooms in Caban
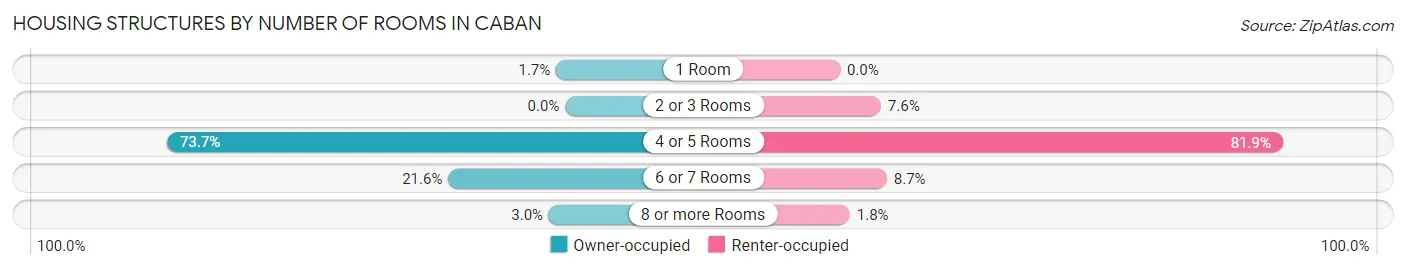
| Number of Rooms | Owner-occupied | Renter-occupied |
| 1 Room | 10 (1.7%) | 0 (0.0%) |
| 2 or 3 Rooms | 0 (0.0%) | 62 (7.6%) |
| 4 or 5 Rooms | 439 (73.7%) | 670 (81.9%) |
| 6 or 7 Rooms | 129 (21.6%) | 71 (8.7%) |
| 8 or more Rooms | 18 (3.0%) | 15 (1.8%) |
| Total | 596 (100.0%) | 818 (100.0%) |
Housing Structure by Heating Type in Caban
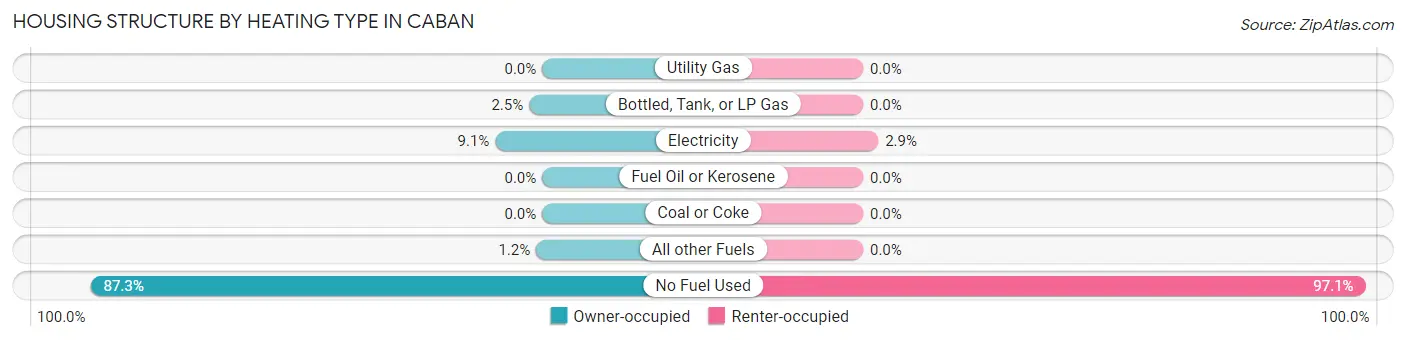
| Heating Type | Owner-occupied | Renter-occupied |
| Utility Gas | 0 (0.0%) | 0 (0.0%) |
| Bottled, Tank, or LP Gas | 15 (2.5%) | 0 (0.0%) |
| Electricity | 54 (9.1%) | 24 (2.9%) |
| Fuel Oil or Kerosene | 0 (0.0%) | 0 (0.0%) |
| Coal or Coke | 0 (0.0%) | 0 (0.0%) |
| All other Fuels | 7 (1.2%) | 0 (0.0%) |
| No Fuel Used | 520 (87.3%) | 794 (97.1%) |
| Total | 596 (100.0%) | 818 (100.0%) |
Household Vehicle Usage in Caban
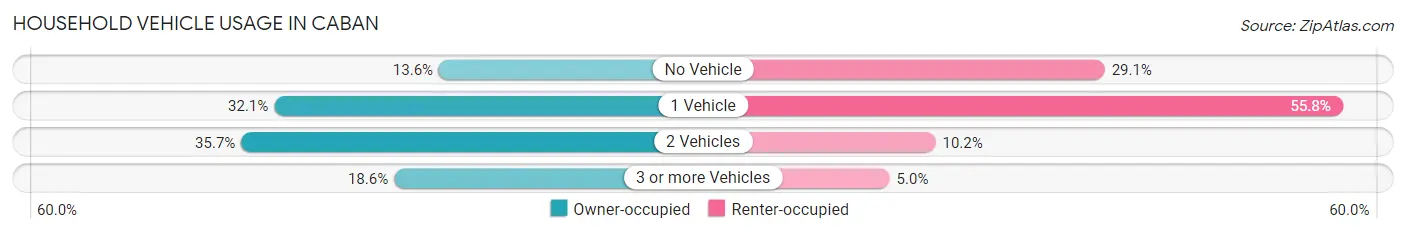
| Vehicles per Household | Owner-occupied | Renter-occupied |
| No Vehicle | 81 (13.6%) | 238 (29.1%) |
| 1 Vehicle | 191 (32.1%) | 456 (55.7%) |
| 2 Vehicles | 213 (35.7%) | 83 (10.2%) |
| 3 or more Vehicles | 111 (18.6%) | 41 (5.0%) |
| Total | 596 (100.0%) | 818 (100.0%) |
Real Estate & Mortgages in Caban
Real Estate and Mortgage Overview in Caban
| Characteristic | Without Mortgage | With Mortgage |
| Housing Units | 447 | 149 |
| Median Property Value | $97,900 | $145,600 |
| Median Household Income | $21,821 | $0 |
| Monthly Housing Costs | $184 | $0 |
| Real Estate Taxes | - | - |
Property Value by Mortgage Status in Caban
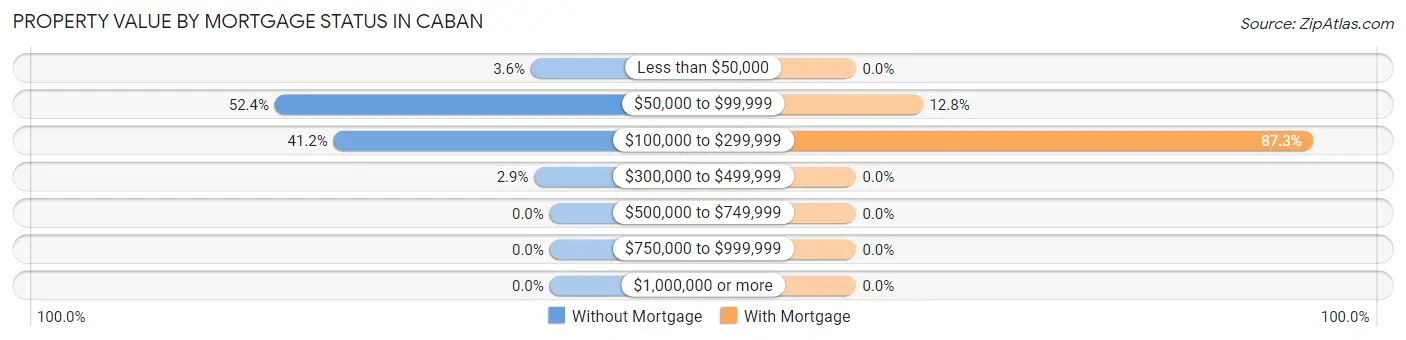
| Property Value | Without Mortgage | With Mortgage |
| Less than $50,000 | 16 (3.6%) | 0 (0.0%) |
| $50,000 to $99,999 | 234 (52.3%) | 19 (12.8%) |
| $100,000 to $299,999 | 184 (41.2%) | 130 (87.3%) |
| $300,000 to $499,999 | 13 (2.9%) | 0 (0.0%) |
| $500,000 to $749,999 | 0 (0.0%) | 0 (0.0%) |
| $750,000 to $999,999 | 0 (0.0%) | 0 (0.0%) |
| $1,000,000 or more | 0 (0.0%) | 0 (0.0%) |
| Total | 447 (100.0%) | 149 (100.0%) |
Household Income by Mortgage Status in Caban
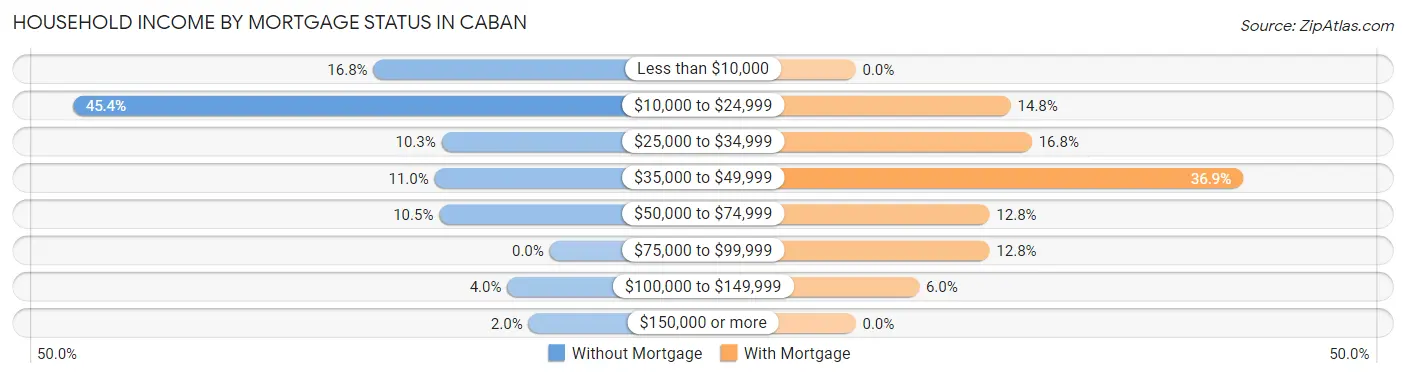
| Household Income | Without Mortgage | With Mortgage |
| Less than $10,000 | 75 (16.8%) | 0 (0.0%) |
| $10,000 to $24,999 | 203 (45.4%) | 22 (14.8%) |
| $25,000 to $34,999 | 46 (10.3%) | 25 (16.8%) |
| $35,000 to $49,999 | 49 (11.0%) | 55 (36.9%) |
| $50,000 to $74,999 | 47 (10.5%) | 19 (12.8%) |
| $75,000 to $99,999 | 0 (0.0%) | 19 (12.8%) |
| $100,000 to $149,999 | 18 (4.0%) | 9 (6.0%) |
| $150,000 or more | 9 (2.0%) | 0 (0.0%) |
| Total | 447 (100.0%) | 149 (100.0%) |
Property Value to Household Income Ratio in Caban
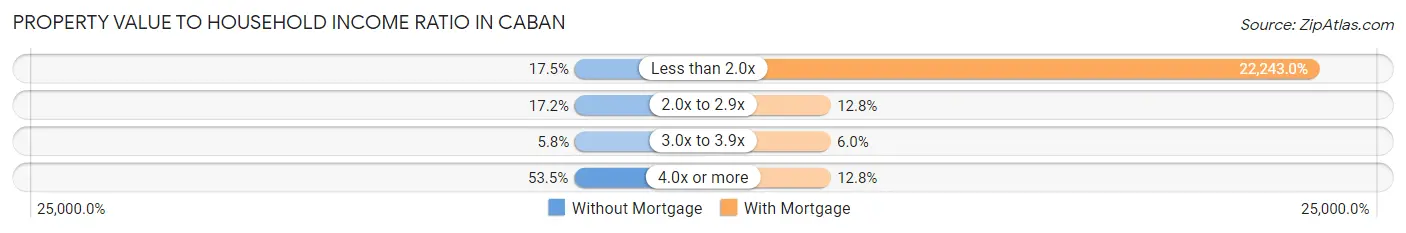
| Value-to-Income Ratio | Without Mortgage | With Mortgage |
| Less than 2.0x | 78 (17.4%) | 33,142 (22,242.9%) |
| 2.0x to 2.9x | 77 (17.2%) | 19 (12.8%) |
| 3.0x to 3.9x | 26 (5.8%) | 9 (6.0%) |
| 4.0x or more | 239 (53.5%) | 19 (12.8%) |
| Total | 447 (100.0%) | 149 (100.0%) |
Real Estate Taxes by Mortgage Status in Caban
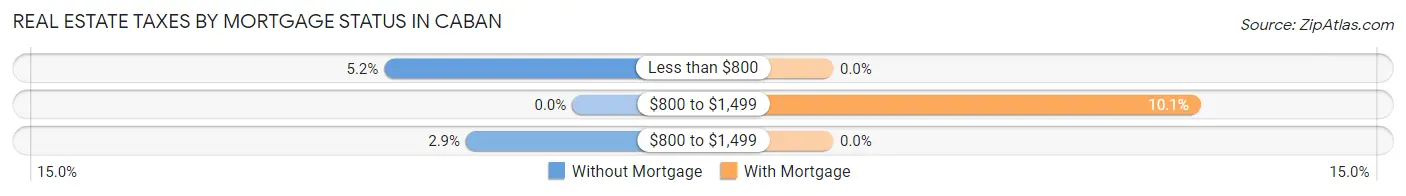
| Property Taxes | Without Mortgage | With Mortgage |
| Less than $800 | 23 (5.1%) | 0 (0.0%) |
| $800 to $1,499 | 0 (0.0%) | 15 (10.1%) |
| $800 to $1,499 | 13 (2.9%) | 0 (0.0%) |
| Total | 447 (100.0%) | 149 (100.0%) |
Health & Disability in Caban
Health Insurance Coverage by Age in Caban
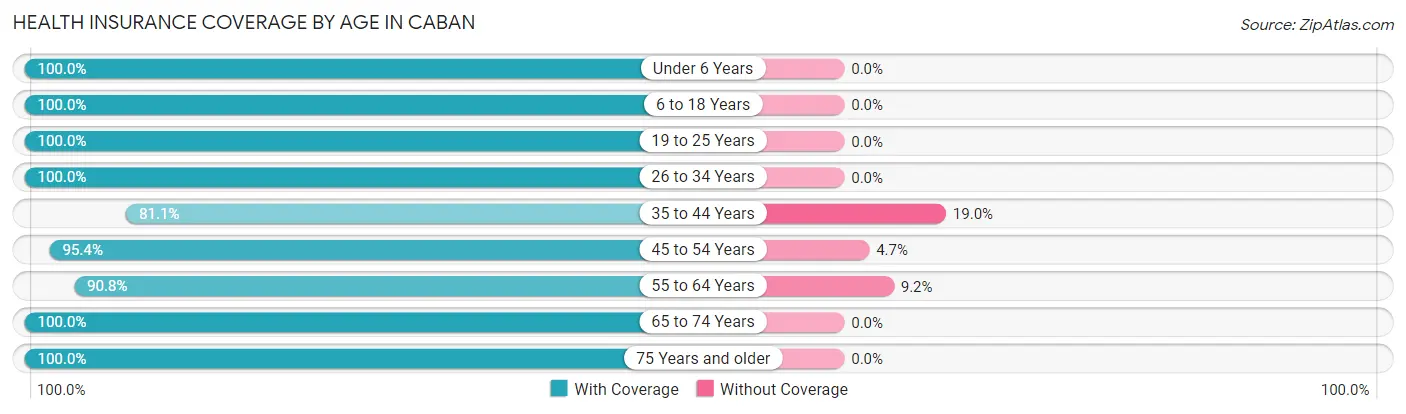
| Age Bracket | With Coverage | Without Coverage |
| Under 6 Years | 187 (100.0%) | 0 (0.0%) |
| 6 to 18 Years | 531 (100.0%) | 0 (0.0%) |
| 19 to 25 Years | 276 (100.0%) | 0 (0.0%) |
| 26 to 34 Years | 336 (100.0%) | 0 (0.0%) |
| 35 to 44 Years | 372 (81.0%) | 87 (19.0%) |
| 45 to 54 Years | 328 (95.4%) | 16 (4.6%) |
| 55 to 64 Years | 423 (90.8%) | 43 (9.2%) |
| 65 to 74 Years | 389 (100.0%) | 0 (0.0%) |
| 75 Years and older | 306 (100.0%) | 0 (0.0%) |
| Total | 3,148 (95.6%) | 146 (4.4%) |
Health Insurance Coverage by Citizenship Status in Caban
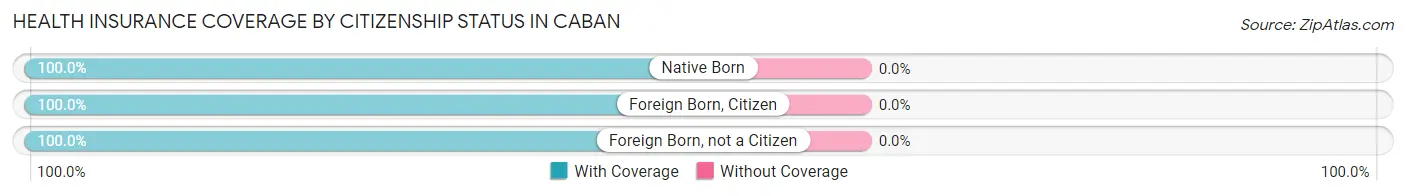
| Citizenship Status | With Coverage | Without Coverage |
| Native Born | 187 (100.0%) | 0 (0.0%) |
| Foreign Born, Citizen | 531 (100.0%) | 0 (0.0%) |
| Foreign Born, not a Citizen | 276 (100.0%) | 0 (0.0%) |
Health Insurance Coverage by Household Income in Caban
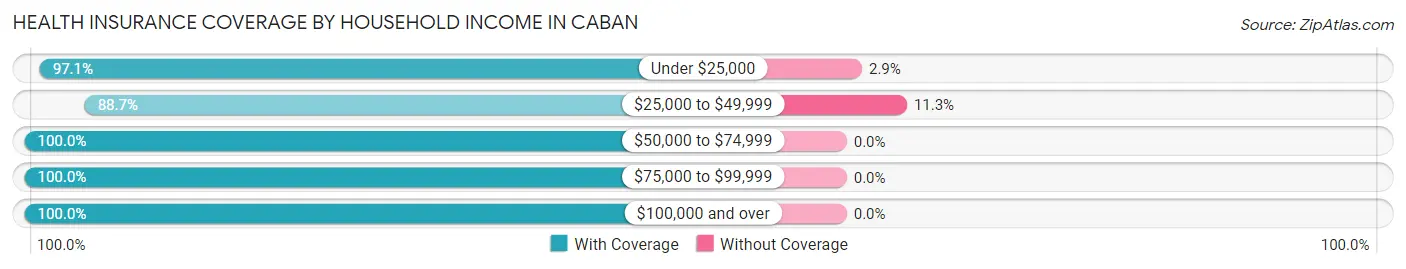
| Household Income | With Coverage | Without Coverage |
| Under $25,000 | 2,001 (97.1%) | 59 (2.9%) |
| $25,000 to $49,999 | 685 (88.7%) | 87 (11.3%) |
| $50,000 to $74,999 | 350 (100.0%) | 0 (0.0%) |
| $75,000 to $99,999 | 19 (100.0%) | 0 (0.0%) |
| $100,000 and over | 93 (100.0%) | 0 (0.0%) |
Public vs Private Health Insurance Coverage by Age in Caban
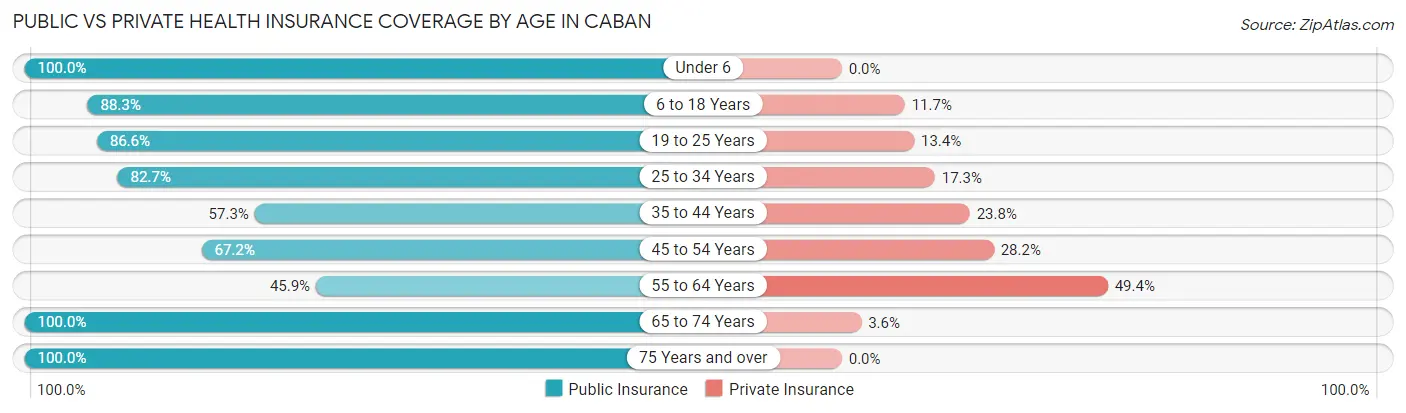
| Age Bracket | Public Insurance | Private Insurance |
| Under 6 | 187 (100.0%) | 0 (0.0%) |
| 6 to 18 Years | 469 (88.3%) | 62 (11.7%) |
| 19 to 25 Years | 239 (86.6%) | 37 (13.4%) |
| 25 to 34 Years | 278 (82.7%) | 58 (17.3%) |
| 35 to 44 Years | 263 (57.3%) | 109 (23.7%) |
| 45 to 54 Years | 231 (67.1%) | 97 (28.2%) |
| 55 to 64 Years | 214 (45.9%) | 230 (49.4%) |
| 65 to 74 Years | 389 (100.0%) | 14 (3.6%) |
| 75 Years and over | 306 (100.0%) | 0 (0.0%) |
| Total | 2,576 (78.2%) | 607 (18.4%) |
Disability Status by Sex by Age in Caban
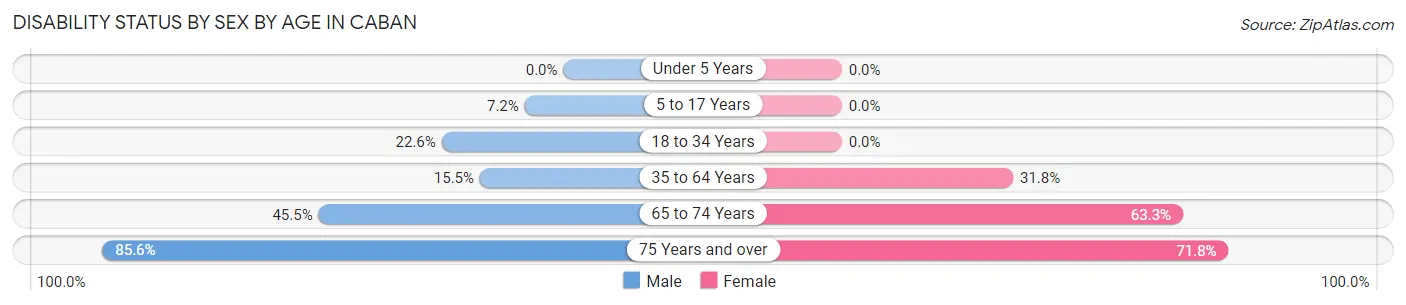
| Age Bracket | Male | Female |
| Under 5 Years | 0 (0.0%) | 0 (0.0%) |
| 5 to 17 Years | 22 (7.2%) | 0 (0.0%) |
| 18 to 34 Years | 66 (22.6%) | 0 (0.0%) |
| 35 to 64 Years | 86 (15.5%) | 227 (31.8%) |
| 65 to 74 Years | 100 (45.5%) | 107 (63.3%) |
| 75 Years and over | 77 (85.6%) | 155 (71.8%) |
Disability Class by Sex by Age in Caban
Disability Class: Hearing Difficulty
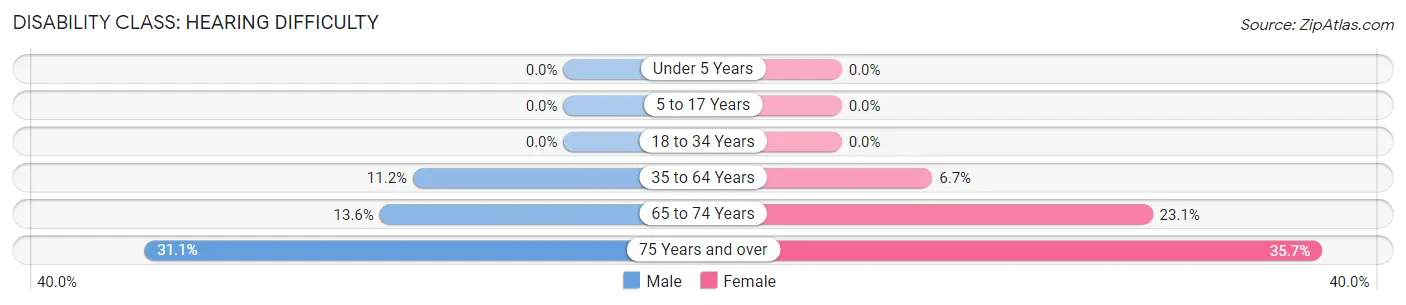
| Age Bracket | Male | Female |
| Under 5 Years | 0 (0.0%) | 0 (0.0%) |
| 5 to 17 Years | 0 (0.0%) | 0 (0.0%) |
| 18 to 34 Years | 0 (0.0%) | 0 (0.0%) |
| 35 to 64 Years | 62 (11.2%) | 48 (6.7%) |
| 65 to 74 Years | 30 (13.6%) | 39 (23.1%) |
| 75 Years and over | 28 (31.1%) | 77 (35.6%) |
Disability Class: Vision Difficulty
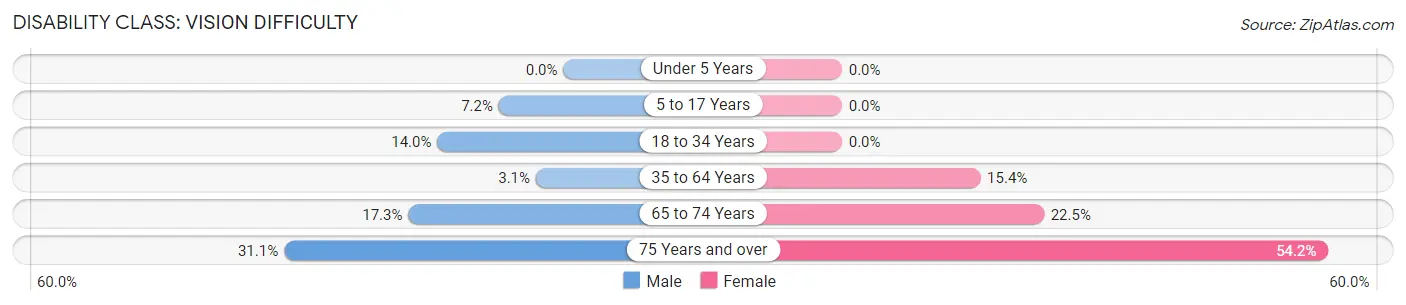
| Age Bracket | Male | Female |
| Under 5 Years | 0 (0.0%) | 0 (0.0%) |
| 5 to 17 Years | 22 (7.2%) | 0 (0.0%) |
| 18 to 34 Years | 41 (14.0%) | 0 (0.0%) |
| 35 to 64 Years | 17 (3.1%) | 110 (15.4%) |
| 65 to 74 Years | 38 (17.3%) | 38 (22.5%) |
| 75 Years and over | 28 (31.1%) | 117 (54.2%) |
Disability Class: Cognitive Difficulty
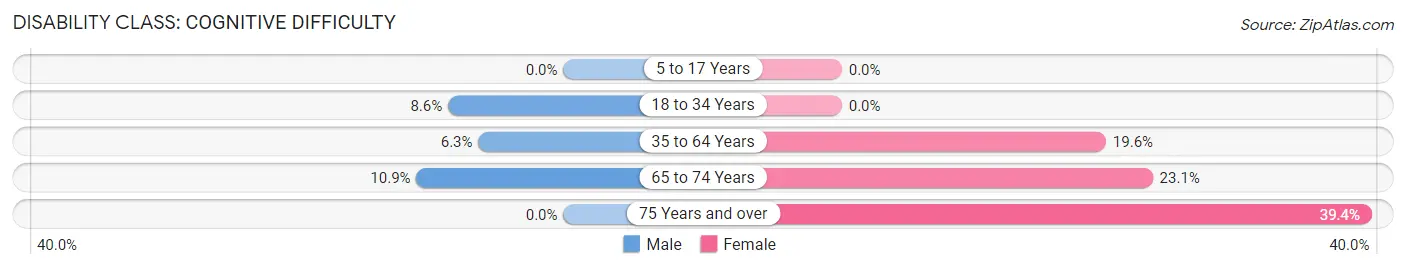
| Age Bracket | Male | Female |
| 5 to 17 Years | 0 (0.0%) | 0 (0.0%) |
| 18 to 34 Years | 25 (8.6%) | 0 (0.0%) |
| 35 to 64 Years | 35 (6.3%) | 140 (19.6%) |
| 65 to 74 Years | 24 (10.9%) | 39 (23.1%) |
| 75 Years and over | 0 (0.0%) | 85 (39.4%) |
Disability Class: Ambulatory Difficulty
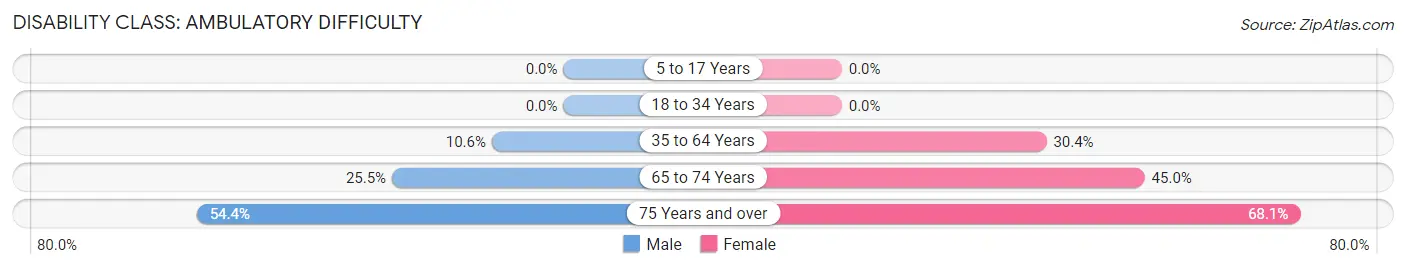
| Age Bracket | Male | Female |
| 5 to 17 Years | 0 (0.0%) | 0 (0.0%) |
| 18 to 34 Years | 0 (0.0%) | 0 (0.0%) |
| 35 to 64 Years | 59 (10.6%) | 217 (30.4%) |
| 65 to 74 Years | 56 (25.5%) | 76 (45.0%) |
| 75 Years and over | 49 (54.4%) | 147 (68.1%) |
Disability Class: Self-Care Difficulty
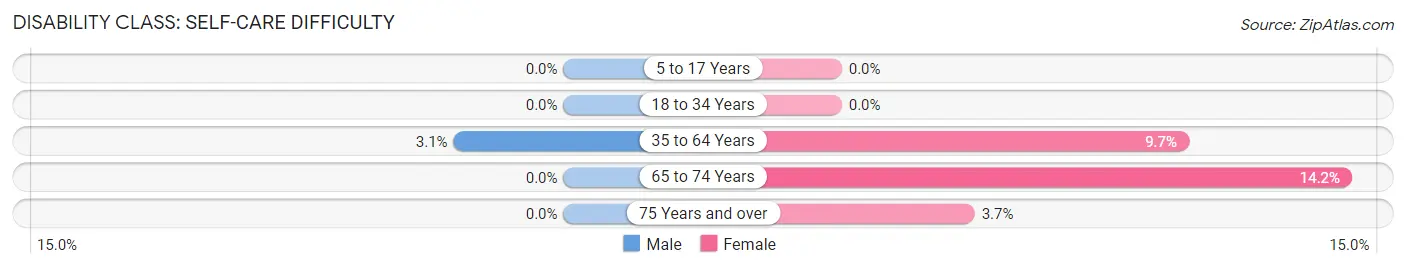
| Age Bracket | Male | Female |
| 5 to 17 Years | 0 (0.0%) | 0 (0.0%) |
| 18 to 34 Years | 0 (0.0%) | 0 (0.0%) |
| 35 to 64 Years | 17 (3.1%) | 69 (9.7%) |
| 65 to 74 Years | 0 (0.0%) | 24 (14.2%) |
| 75 Years and over | 0 (0.0%) | 8 (3.7%) |
Technology Access in Caban
Computing Device Access in Caban
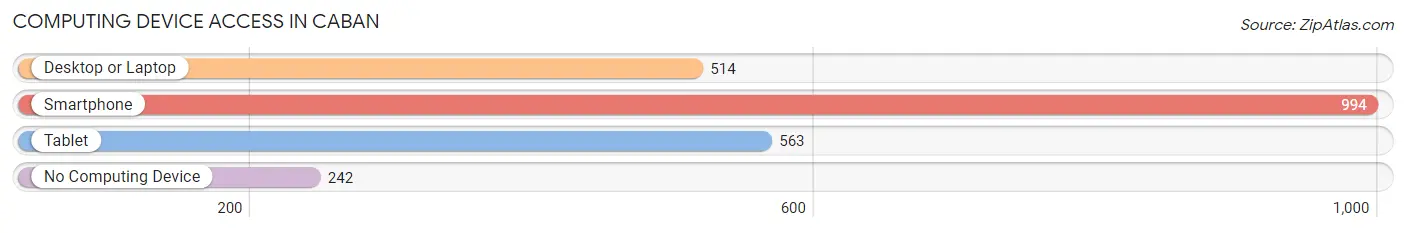
| Device Type | # Households | % Households |
| Desktop or Laptop | 514 | 36.3% |
| Smartphone | 994 | 70.3% |
| Tablet | 563 | 39.8% |
| No Computing Device | 242 | 17.1% |
| Total | 1,414 | 100.0% |
Internet Access in Caban
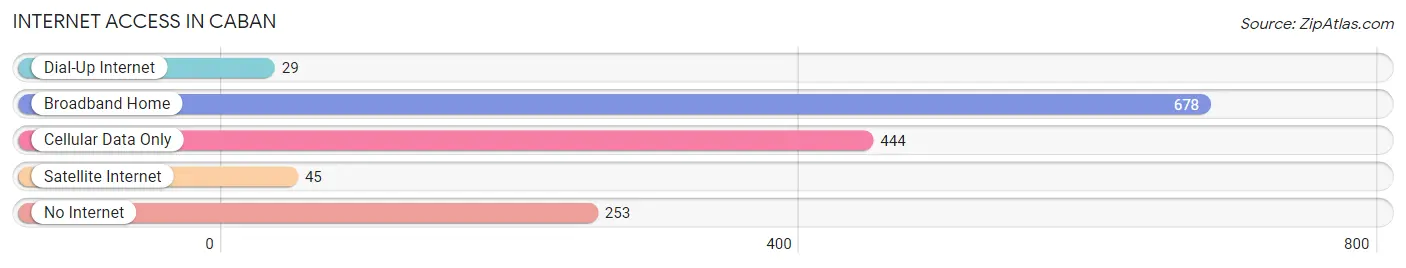
| Internet Type | # Households | % Households |
| Dial-Up Internet | 29 | 2.1% |
| Broadband Home | 678 | 47.9% |
| Cellular Data Only | 444 | 31.4% |
| Satellite Internet | 45 | 3.2% |
| No Internet | 253 | 17.9% |
| Total | 1,414 | 100.0% |
Caban Summary
Puerto Rico is an unincorporated territory of the United States located in the Caribbean Sea. It is the easternmost and smallest of the Greater Antilles, and is composed of the main island of Puerto Rico and several smaller islands. The capital and largest city is San Juan. The population of Puerto Rico is estimated to be 3.2 million people, making it the second-most populous Caribbean nation after Cuba.
The history of Puerto Rico dates back to the early 16th century, when it was colonized by the Spanish. The island was ceded to the United States in 1898 following the Spanish-American War. In 1917, Puerto Ricans were granted U.S. citizenship, and in 1952, the island became an unincorporated territory of the United States.
Geographically, Puerto Rico is located in the Caribbean Sea, east of the Dominican Republic and west of the Virgin Islands. It is the smallest of the Greater Antilles, with an area of 5,320 square miles. The terrain is mostly mountainous, with the highest point being Cerro de Punta at 4,390 feet. The climate is tropical, with temperatures ranging from the mid-70s to the mid-80s.
The economy of Puerto Rico is largely based on services, with tourism being the largest sector. Other important industries include manufacturing, pharmaceuticals, and agriculture. The island is also home to a large number of U.S. military bases. The unemployment rate in Puerto Rico is higher than the national average, and the poverty rate is also higher than the national average.
Demographically, Puerto Rico is a diverse society, with a mix of ethnicities and cultures. The majority of the population is of Hispanic or Latino origin, with the largest ethnic group being Puerto Ricans. Other ethnic groups include African Americans, Europeans, and Asians. The official language is Spanish, although English is also widely spoken. The majority of the population is Roman Catholic, although there are also other religious groups present.
Puerto Rico is a vibrant and diverse society with a rich history and culture. It is an important part of the United States, and its people are proud of their heritage and identity. The island has a strong economy and is home to a diverse population, making it an important part of the Caribbean region.
Common Questions
What is Per Capita Income in Caban?
Per Capita income in Caban is $9,061.
What is the Median Family Income in Caban?
Median Family Income in Caban is $16,205.
What is the Median Household income in Caban?
Median Household Income in Caban is $14,202.
What is Income or Wage Gap in Caban?
Income or Wage Gap in Caban is 35.6%.
Women in Caban earn 64.4 cents for every dollar earned by a man.
What is Inequality or Gini Index in Caban?
Inequality or Gini Index in Caban is 0.56.
What is the Total Population of Caban?
Total Population of Caban is 3,310.
What is the Total Male Population of Caban?
Total Male Population of Caban is 1,551.
What is the Total Female Population of Caban?
Total Female Population of Caban is 1,759.
What is the Ratio of Males per 100 Females in Caban?
There are 88.18 Males per 100 Females in Caban.
What is the Ratio of Females per 100 Males in Caban?
There are 113.41 Females per 100 Males in Caban.
What is the Median Population Age in Caban?
Median Population Age in Caban is 42.9 Years.
What is the Average Family Size in Caban
Average Family Size in Caban is 2.8 People.
What is the Average Household Size in Caban
Average Household Size in Caban is 2.3 People.
How Large is the Labor Force in Caban?
There are 867 People in the Labor Forcein in Caban.
What is the Percentage of People in the Labor Force in Caban?
31.9% of People are in the Labor Force in Caban.
What is the Unemployment Rate in Caban?
Unemployment Rate in Caban is 6.2%.