El Tumbao, PR Map & Demographics
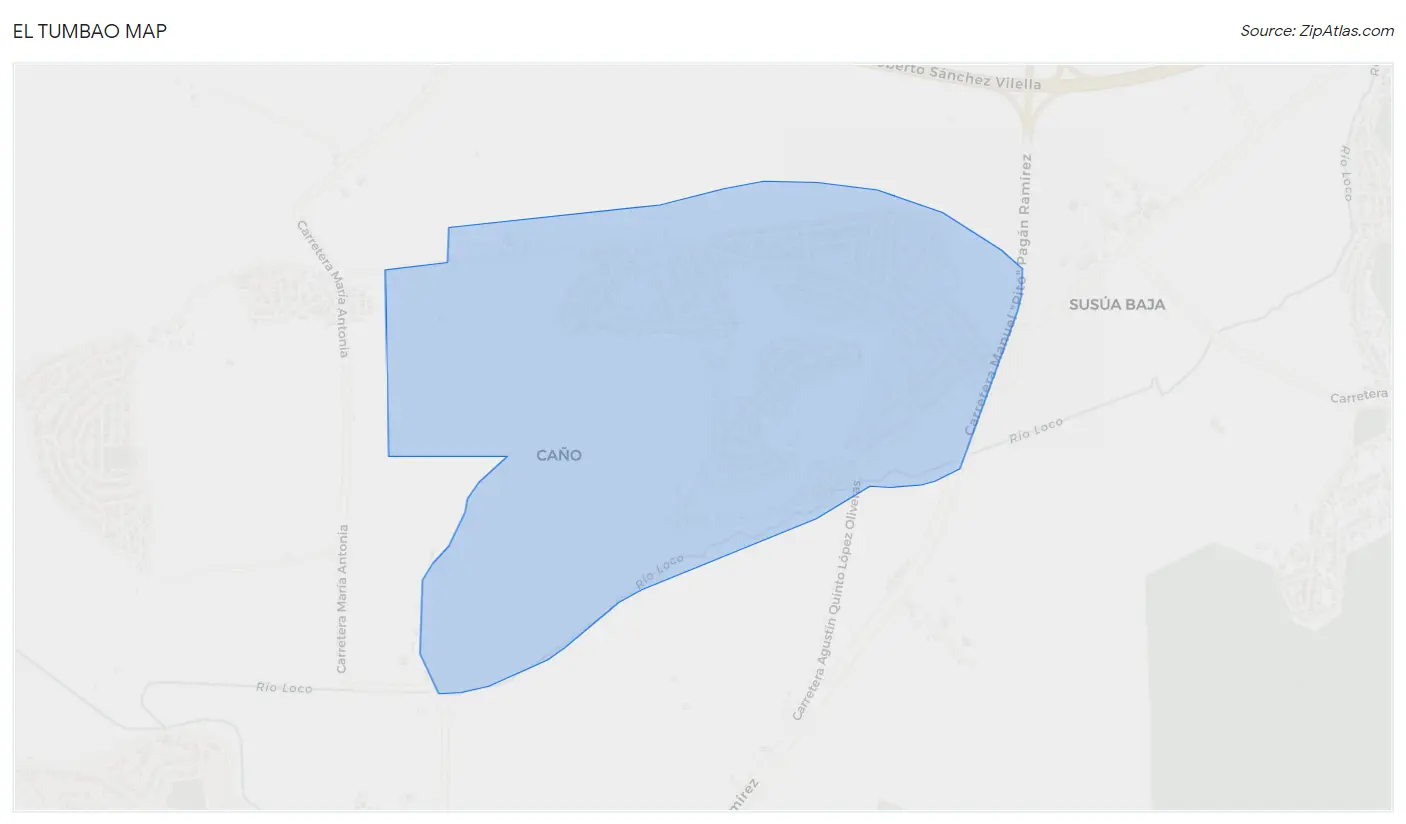
El Tumbao Map
El Tumbao Overview
$8,638
PER CAPITA INCOME
$16,691
AVG FAMILY INCOME
$14,050
AVG HOUSEHOLD INCOME
7.7%
WAGE / INCOME GAP [ % ]
92.3¢/ $1
WAGE / INCOME GAP [ $ ]
0.46
INEQUALITY / GINI INDEX
1,291
TOTAL POPULATION
567
MALE POPULATION
724
FEMALE POPULATION
78.31
MALES / 100 FEMALES
127.69
FEMALES / 100 MALES
46.0
MEDIAN AGE
3.2
AVG FAMILY SIZE
2.4
AVG HOUSEHOLD SIZE
425
LABOR FORCE [ PEOPLE ]
38.1%
PERCENT IN LABOR FORCE
18.6%
UNEMPLOYMENT RATE
Income in El Tumbao
Income Overview in El Tumbao
Per Capita Income in El Tumbao is $8,638, while median incomes of families and households are $16,691 and $14,050 respectively.
| Characteristic | Number | Measure |
| Per Capita Income | 1,291 | $8,638 |
| Median Family Income | 289 | $16,691 |
| Mean Family Income | 289 | $23,100 |
| Median Household Income | 541 | $14,050 |
| Mean Household Income | 541 | $20,232 |
| Income Deficit | 289 | $0 |
| Wage / Income Gap (%) | 1,291 | 7.70% |
| Wage / Income Gap ($) | 1,291 | 92.30¢ per $1 |
| Gini / Inequality Index | 1,291 | 0.46 |
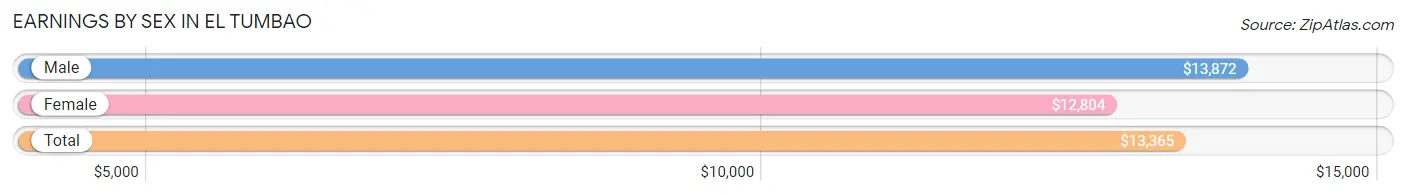
Earnings by Sex in El Tumbao
Average Earnings in El Tumbao are $13,365, $13,872 for men and $12,804 for women, a difference of 7.7%.
| Sex | Number | Average Earnings |
| Male | 209 (53.3%) | $13,872 |
| Female | 183 (46.7%) | $12,804 |
| Total | 392 (100.0%) | $13,365 |
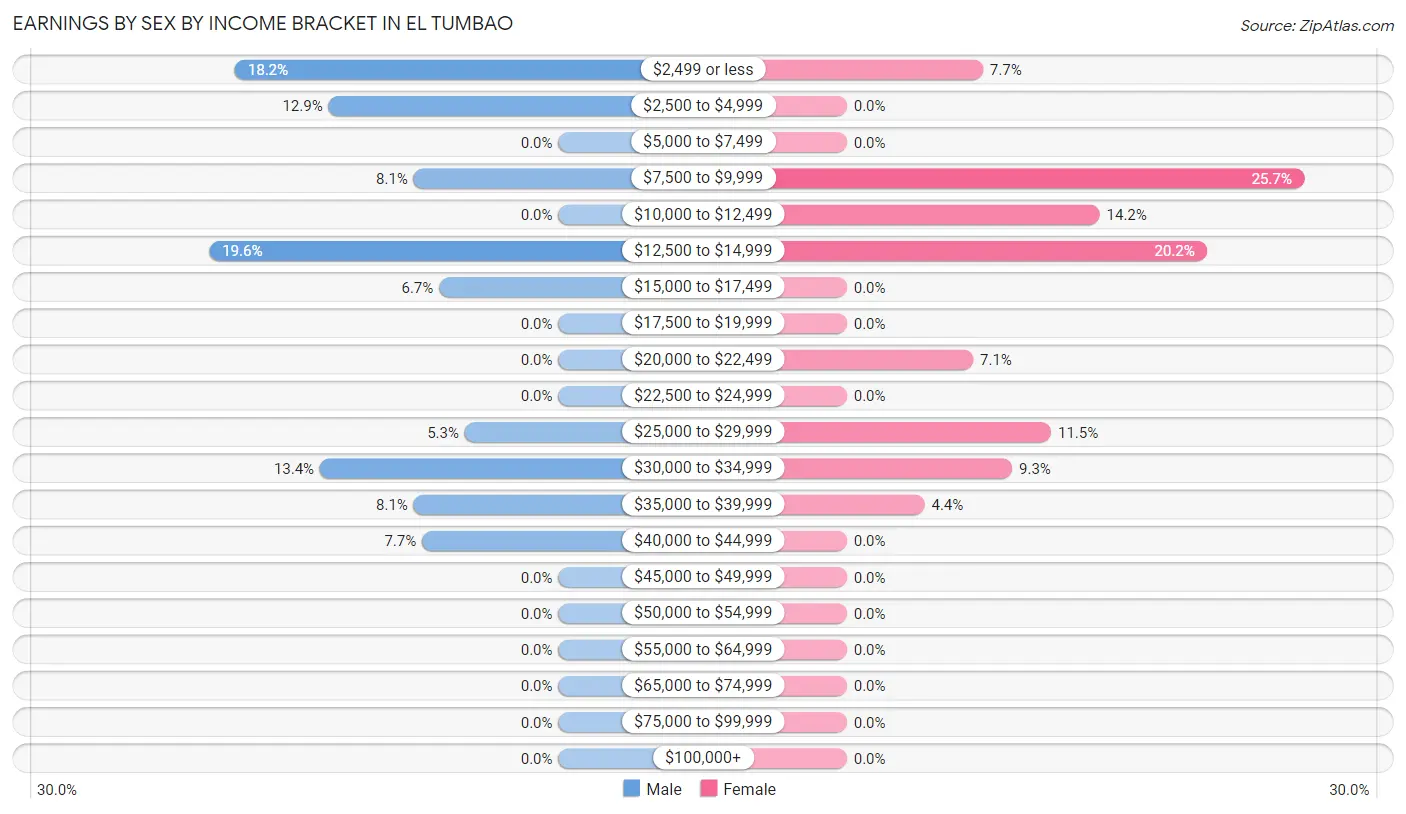
Earnings by Sex by Income Bracket in El Tumbao
The most common earnings brackets in El Tumbao are $12,500 to $14,999 for men (41 | 19.6%) and $7,500 to $9,999 for women (47 | 25.7%).
| Income | Male | Female |
| $2,499 or less | 38 (18.2%) | 14 (7.6%) |
| $2,500 to $4,999 | 27 (12.9%) | 0 (0.0%) |
| $5,000 to $7,499 | 0 (0.0%) | 0 (0.0%) |
| $7,500 to $9,999 | 17 (8.1%) | 47 (25.7%) |
| $10,000 to $12,499 | 0 (0.0%) | 26 (14.2%) |
| $12,500 to $14,999 | 41 (19.6%) | 37 (20.2%) |
| $15,000 to $17,499 | 14 (6.7%) | 0 (0.0%) |
| $17,500 to $19,999 | 0 (0.0%) | 0 (0.0%) |
| $20,000 to $22,499 | 0 (0.0%) | 13 (7.1%) |
| $22,500 to $24,999 | 0 (0.0%) | 0 (0.0%) |
| $25,000 to $29,999 | 11 (5.3%) | 21 (11.5%) |
| $30,000 to $34,999 | 28 (13.4%) | 17 (9.3%) |
| $35,000 to $39,999 | 17 (8.1%) | 8 (4.4%) |
| $40,000 to $44,999 | 16 (7.7%) | 0 (0.0%) |
| $45,000 to $49,999 | 0 (0.0%) | 0 (0.0%) |
| $50,000 to $54,999 | 0 (0.0%) | 0 (0.0%) |
| $55,000 to $64,999 | 0 (0.0%) | 0 (0.0%) |
| $65,000 to $74,999 | 0 (0.0%) | 0 (0.0%) |
| $75,000 to $99,999 | 0 (0.0%) | 0 (0.0%) |
| $100,000+ | 0 (0.0%) | 0 (0.0%) |
| Total | 209 (100.0%) | 183 (100.0%) |
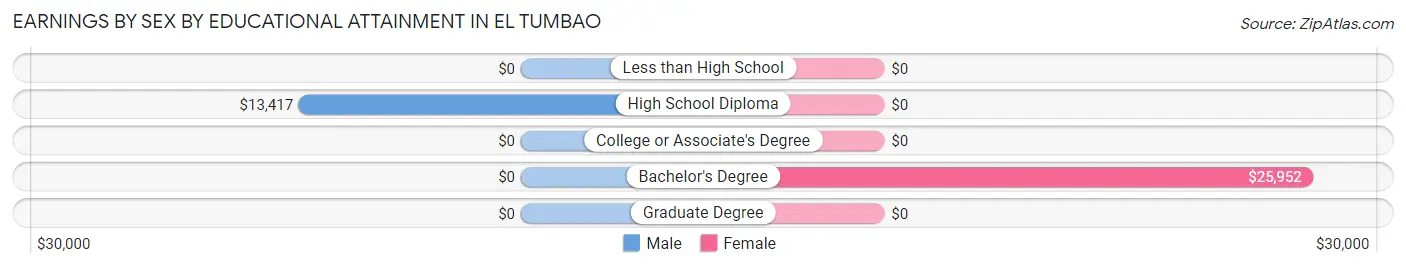
Earnings by Sex by Educational Attainment in El Tumbao
Average earnings in El Tumbao are $13,872 for men and $13,547 for women, a difference of 2.3%. Men with an educational attainment of high school diploma enjoy the highest average annual earnings of $13,417, while those with high school diploma education earn the least with $13,417. Women with an educational attainment of bachelor's degree earn the most with the average annual earnings of $25,952, while those with bachelor's degree education have the smallest earnings of $25,952.
| Educational Attainment | Male Income | Female Income |
| Less than High School | - | - |
| High School Diploma | $13,417 | $0 |
| College or Associate's Degree | - | - |
| Bachelor's Degree | - | - |
| Graduate Degree | - | - |
| Total | $13,872 | $13,547 |
Family Income in El Tumbao
Family Income Brackets in El Tumbao
According to the El Tumbao family income data, there are 108 families falling into the less than $10,000 income range, which is the most common income bracket and makes up 37.4% of all families.
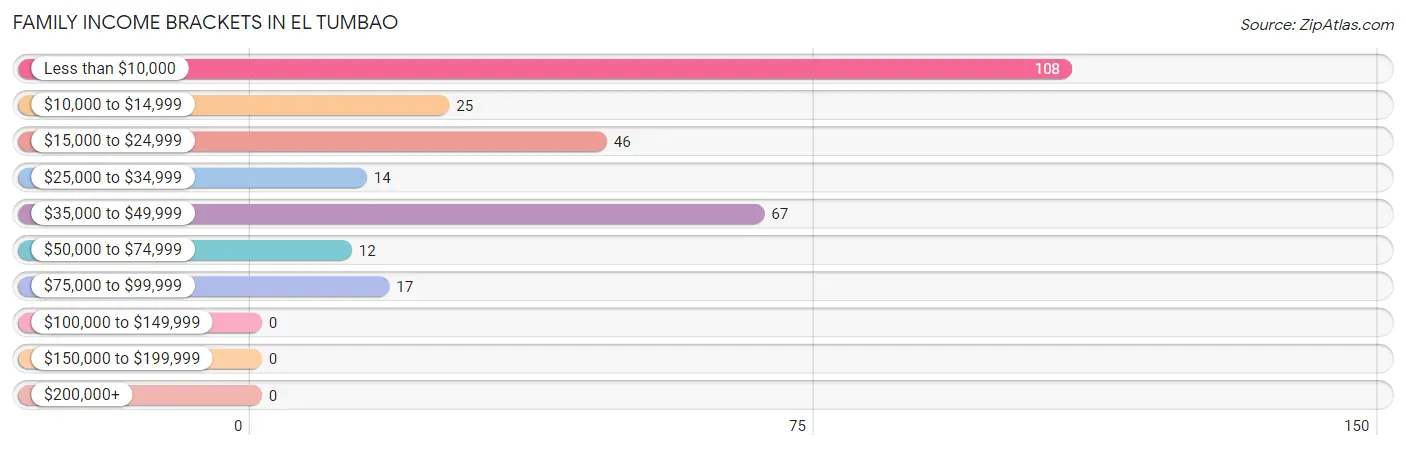
| Income Bracket | # Families | % Families |
| Less than $10,000 | 108 | 37.4% |
| $10,000 to $14,999 | 25 | 8.7% |
| $15,000 to $24,999 | 46 | 15.9% |
| $25,000 to $34,999 | 14 | 4.8% |
| $35,000 to $49,999 | 67 | 23.2% |
| $50,000 to $74,999 | 12 | 4.2% |
| $75,000 to $99,999 | 17 | 5.9% |
| $100,000 to $149,999 | 0 | 0.0% |
| $150,000 to $199,999 | 0 | 0.0% |
| $200,000+ | 0 | 0.0% |
Family Income by Famaliy Size in El Tumbao
4-person families (71 | 24.6%) account for the highest median family income in El Tumbao with $40,958 per family, while 4-person families (71 | 24.6%) have the highest median income of $10,240 per family member.
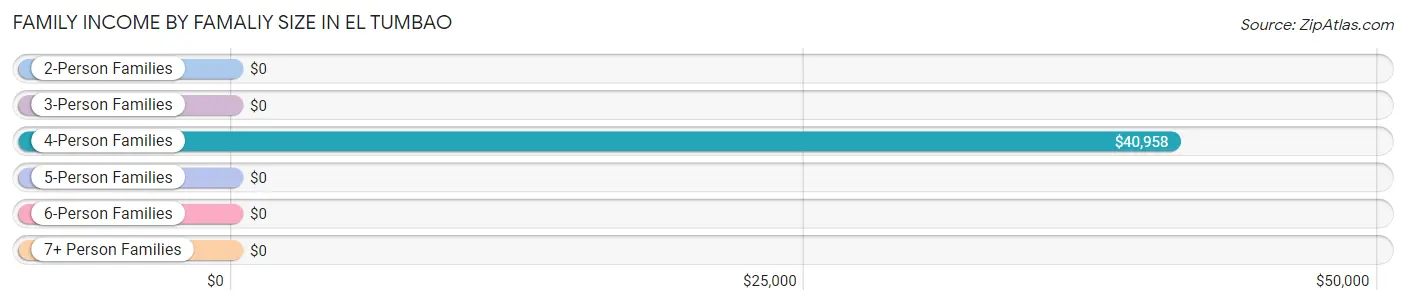
| Income Bracket | # Families | Median Income |
| 2-Person Families | 135 (46.7%) | $0 |
| 3-Person Families | 83 (28.7%) | $0 |
| 4-Person Families | 71 (24.6%) | $40,958 |
| 5-Person Families | 0 (0.0%) | $0 |
| 6-Person Families | 0 (0.0%) | $0 |
| 7+ Person Families | 0 (0.0%) | $0 |
| Total | 289 (100.0%) | $16,691 |
Family Income by Number of Earners in El Tumbao
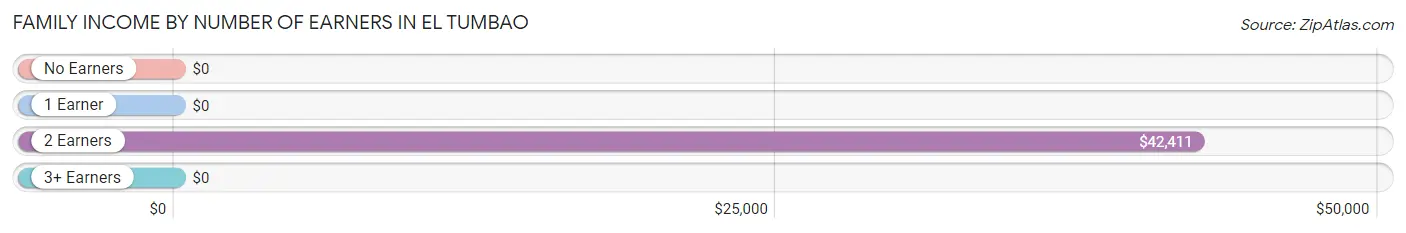
| Number of Earners | # Families | Median Income |
| No Earners | 159 (55.0%) | $0 |
| 1 Earner | 71 (24.6%) | $0 |
| 2 Earners | 59 (20.4%) | $42,411 |
| 3+ Earners | 0 (0.0%) | $0 |
| Total | 289 (100.0%) | $16,691 |
Household Income in El Tumbao
Household Income Brackets in El Tumbao
With 224 households falling in the category, the less than $10,000 income range is the most frequent in El Tumbao, accounting for 41.4% of all households.
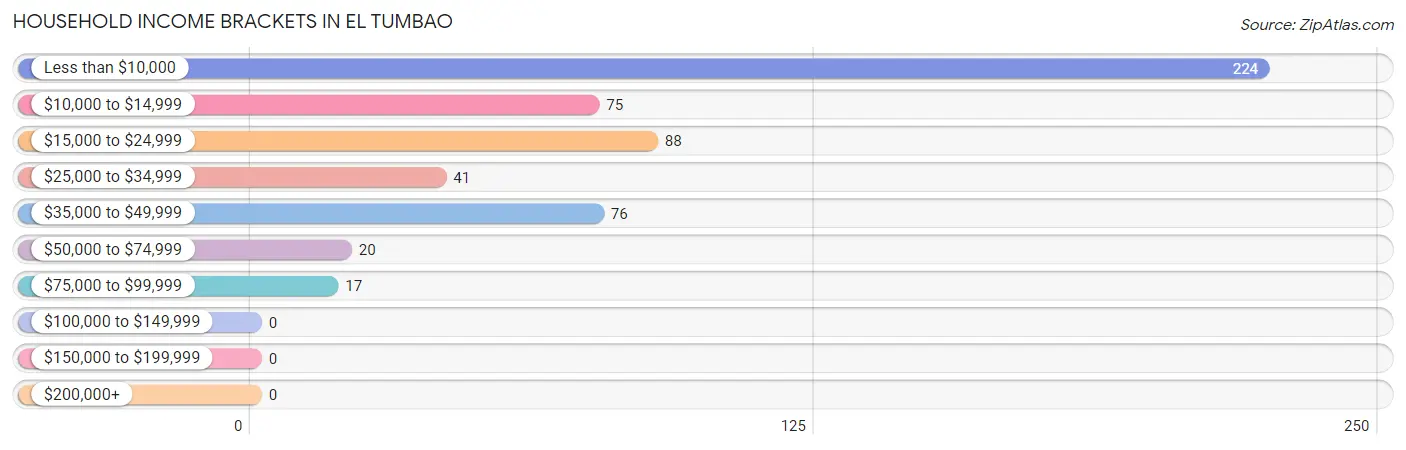
| Income Bracket | # Households | % Households |
| Less than $10,000 | 224 | 41.4% |
| $10,000 to $14,999 | 75 | 13.9% |
| $15,000 to $24,999 | 88 | 16.3% |
| $25,000 to $34,999 | 41 | 7.6% |
| $35,000 to $49,999 | 76 | 14.0% |
| $50,000 to $74,999 | 20 | 3.7% |
| $75,000 to $99,999 | 17 | 3.1% |
| $100,000 to $149,999 | 0 | 0.0% |
| $150,000 to $199,999 | 0 | 0.0% |
| $200,000+ | 0 | 0.0% |
Household Income by Householder Age in El Tumbao
The median household income in El Tumbao is $14,050, with the highest median household income of $30,938 found in the 45 to 64 years age bracket for the primary householder. A total of 214 households (39.6%) fall into this category.

| Income Bracket | # Households | Median Income |
| 15 to 24 Years | 0 (0.0%) | $0 |
| 25 to 44 Years | 138 (25.5%) | $13,375 |
| 45 to 64 Years | 214 (39.6%) | $30,938 |
| 65+ Years | 189 (34.9%) | $9,869 |
| Total | 541 (100.0%) | $14,050 |
Poverty in El Tumbao
Income Below Poverty by Sex and Age in El Tumbao
With 49.6% poverty level for males and 58.3% for females among the residents of El Tumbao, 15 year old males and 25 to 34 year old females are the most vulnerable to poverty, with 28 males (100.0%) and 50 females (100.0%) in their respective age groups living below the poverty level.
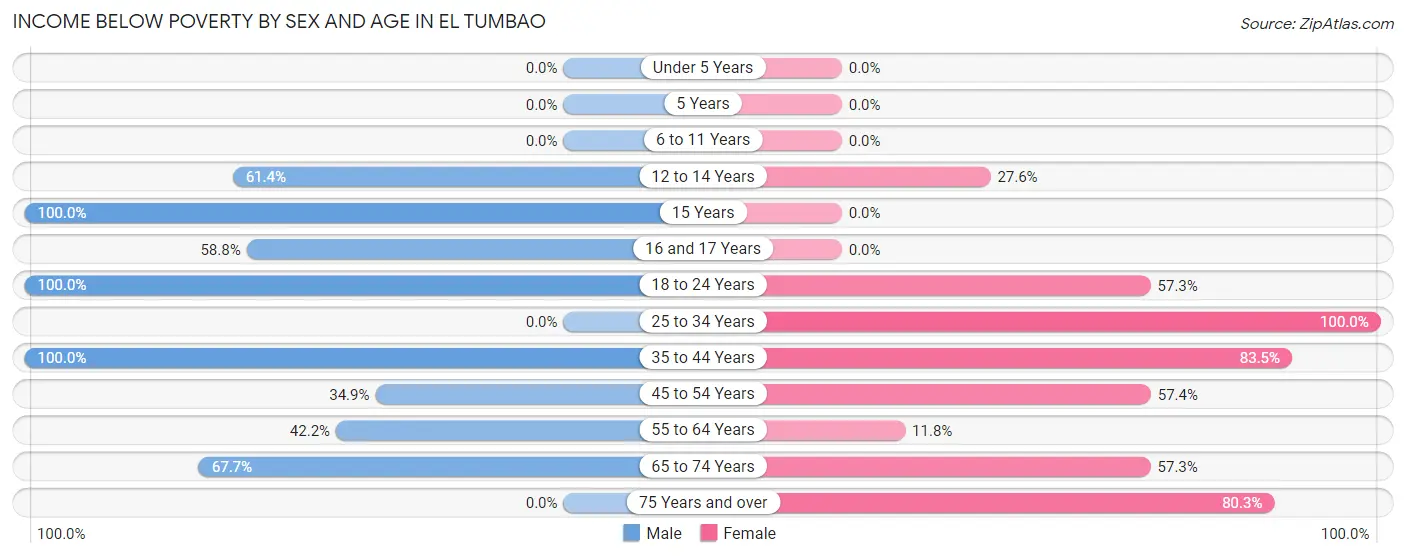
| Age Bracket | Male | Female |
| Under 5 Years | 0 (0.0%) | 0 (0.0%) |
| 5 Years | 0 (0.0%) | 0 (0.0%) |
| 6 to 11 Years | 0 (0.0%) | 0 (0.0%) |
| 12 to 14 Years | 27 (61.4%) | 16 (27.6%) |
| 15 Years | 28 (100.0%) | 0 (0.0%) |
| 16 and 17 Years | 20 (58.8%) | 0 (0.0%) |
| 18 to 24 Years | 31 (100.0%) | 90 (57.3%) |
| 25 to 34 Years | 0 (0.0%) | 50 (100.0%) |
| 35 to 44 Years | 50 (100.0%) | 71 (83.5%) |
| 45 to 54 Years | 37 (34.9%) | 74 (57.4%) |
| 55 to 64 Years | 38 (42.2%) | 8 (11.8%) |
| 65 to 74 Years | 46 (67.6%) | 47 (57.3%) |
| 75 Years and over | 0 (0.0%) | 61 (80.3%) |
| Total | 277 (49.6%) | 417 (58.3%) |
Income Above Poverty by Sex and Age in El Tumbao
According to the poverty statistics in El Tumbao, males aged 6 to 11 years and females aged 6 to 11 years are the age groups that are most secure financially, with 100.0% of males and 100.0% of females in these age groups living above the poverty line.
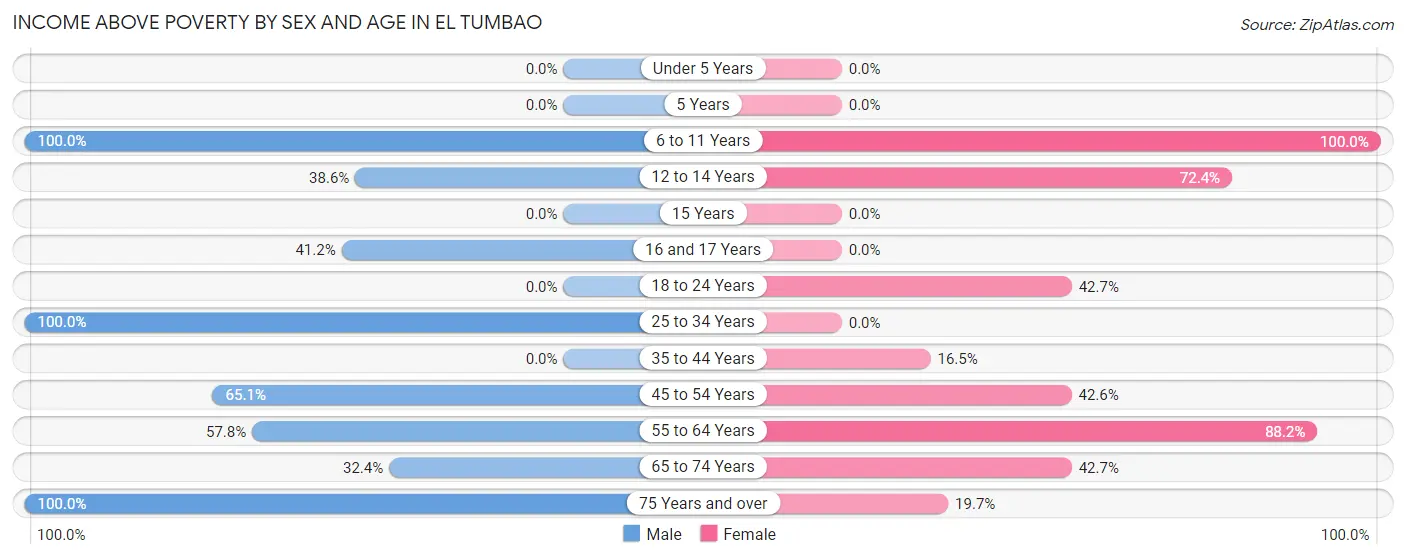
| Age Bracket | Male | Female |
| Under 5 Years | 0 (0.0%) | 0 (0.0%) |
| 5 Years | 0 (0.0%) | 0 (0.0%) |
| 6 to 11 Years | 35 (100.0%) | 10 (100.0%) |
| 12 to 14 Years | 17 (38.6%) | 42 (72.4%) |
| 15 Years | 0 (0.0%) | 0 (0.0%) |
| 16 and 17 Years | 14 (41.2%) | 0 (0.0%) |
| 18 to 24 Years | 0 (0.0%) | 67 (42.7%) |
| 25 to 34 Years | 31 (100.0%) | 0 (0.0%) |
| 35 to 44 Years | 0 (0.0%) | 14 (16.5%) |
| 45 to 54 Years | 69 (65.1%) | 55 (42.6%) |
| 55 to 64 Years | 52 (57.8%) | 60 (88.2%) |
| 65 to 74 Years | 22 (32.4%) | 35 (42.7%) |
| 75 Years and over | 41 (100.0%) | 15 (19.7%) |
| Total | 281 (50.4%) | 298 (41.7%) |
Income Below Poverty Among Married-Couple Families in El Tumbao
The poverty statistics for married-couple families in El Tumbao show that 35.0% or 48 of the total 137 families live below the poverty line. Families with 1 or 2 children have the highest poverty rate of 100.0%, comprising of 21 families. On the other hand, families with no children have the lowest poverty rate of 23.3%, which includes 27 families.
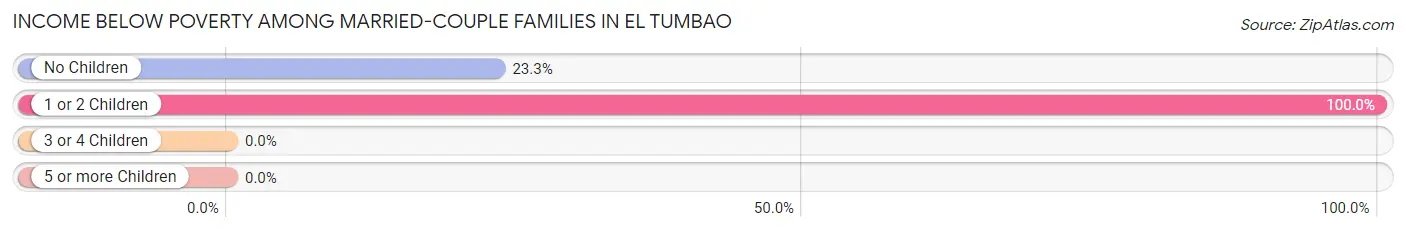
| Children | Above Poverty | Below Poverty |
| No Children | 89 (76.7%) | 27 (23.3%) |
| 1 or 2 Children | 0 (0.0%) | 21 (100.0%) |
| 3 or 4 Children | 0 (0.0%) | 0 (0.0%) |
| 5 or more Children | 0 (0.0%) | 0 (0.0%) |
| Total | 89 (65.0%) | 48 (35.0%) |
Income Below Poverty Among Single-Parent Households in El Tumbao
According to the poverty data in El Tumbao, 27.3% or 12 single-father households and 92.6% or 100 single-mother households are living below the poverty line. Among single-father households, those with 1 or 2 children have the highest poverty rate, with 12 households (42.9%) experiencing poverty. Likewise, among single-mother households, those with no children have the highest poverty rate, with 57 households (100.0%) falling below the poverty line.
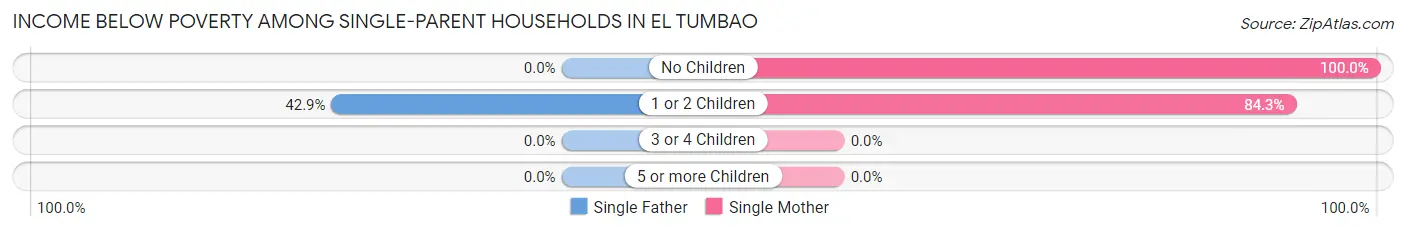
| Children | Single Father | Single Mother |
| No Children | 0 (0.0%) | 57 (100.0%) |
| 1 or 2 Children | 12 (42.9%) | 43 (84.3%) |
| 3 or 4 Children | 0 (0.0%) | 0 (0.0%) |
| 5 or more Children | 0 (0.0%) | 0 (0.0%) |
| Total | 12 (27.3%) | 100 (92.6%) |
Income Below Poverty Among Married-Couple vs Single-Parent Households in El Tumbao
The poverty data for El Tumbao shows that 48 of the married-couple family households (35.0%) and 112 of the single-parent households (73.7%) are living below the poverty level. Within the married-couple family households, those with 1 or 2 children have the highest poverty rate, with 21 households (100.0%) falling below the poverty line. Among the single-parent households, those with no children have the highest poverty rate, with 57 household (100.0%) living below poverty.
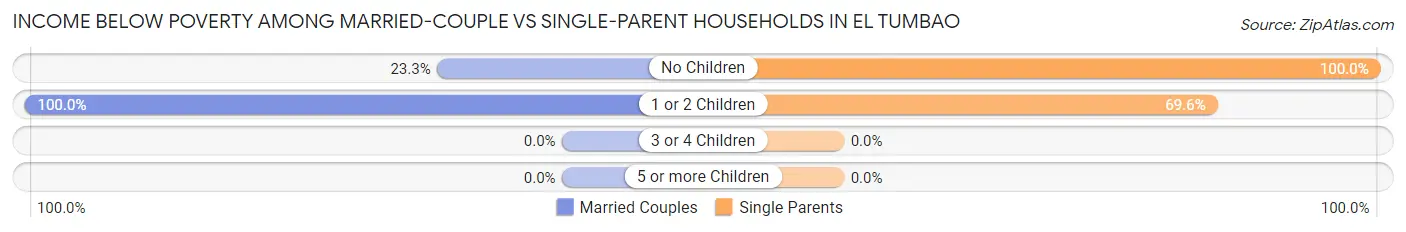
| Children | Married-Couple Families | Single-Parent Households |
| No Children | 27 (23.3%) | 57 (100.0%) |
| 1 or 2 Children | 21 (100.0%) | 55 (69.6%) |
| 3 or 4 Children | 0 (0.0%) | 0 (0.0%) |
| 5 or more Children | 0 (0.0%) | 0 (0.0%) |
| Total | 48 (35.0%) | 112 (73.7%) |
Race in El Tumbao
The most populous races in El Tumbao are Hispanic or Latino (1,266 | 98.1%), White / Caucasian (592 | 45.9%), and Some other Race (475 | 36.8%).
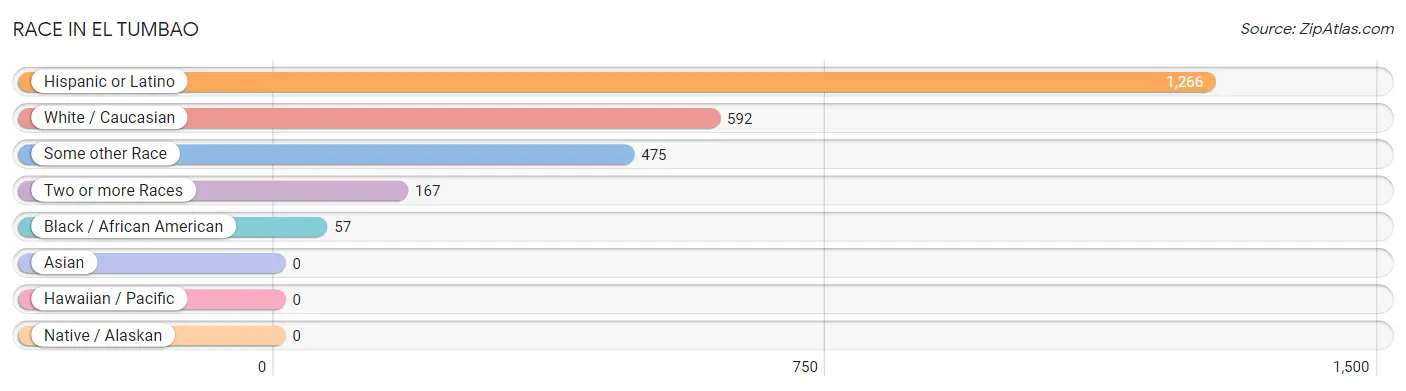
| Race | # Population | % Population |
| Asian | 0 | 0.0% |
| Black / African American | 57 | 4.4% |
| Hawaiian / Pacific | 0 | 0.0% |
| Hispanic or Latino | 1,266 | 98.1% |
| Native / Alaskan | 0 | 0.0% |
| White / Caucasian | 592 | 45.9% |
| Two or more Races | 167 | 12.9% |
| Some other Race | 475 | 36.8% |
| Total | 1,291 | 100.0% |
Ancestry in El Tumbao
The most populous ancestries reported in El Tumbao are , and Puerto Rican (1,266 | 98.1%), together accounting for 98.1% of all El Tumbao residents.

| Ancestry | # Population | % Population |
| Puerto Rican | 1,266 | 98.1% | View All 1 Rows |
Immigrants in El Tumbao

| Immigration Origin | # Population | % Population | View All 0 Rows |
Sex and Age in El Tumbao
Sex and Age in El Tumbao
The most populous age groups in El Tumbao are 15 to 19 Years (93 | 16.4%) for men and 20 to 24 Years (120 | 16.6%) for women.
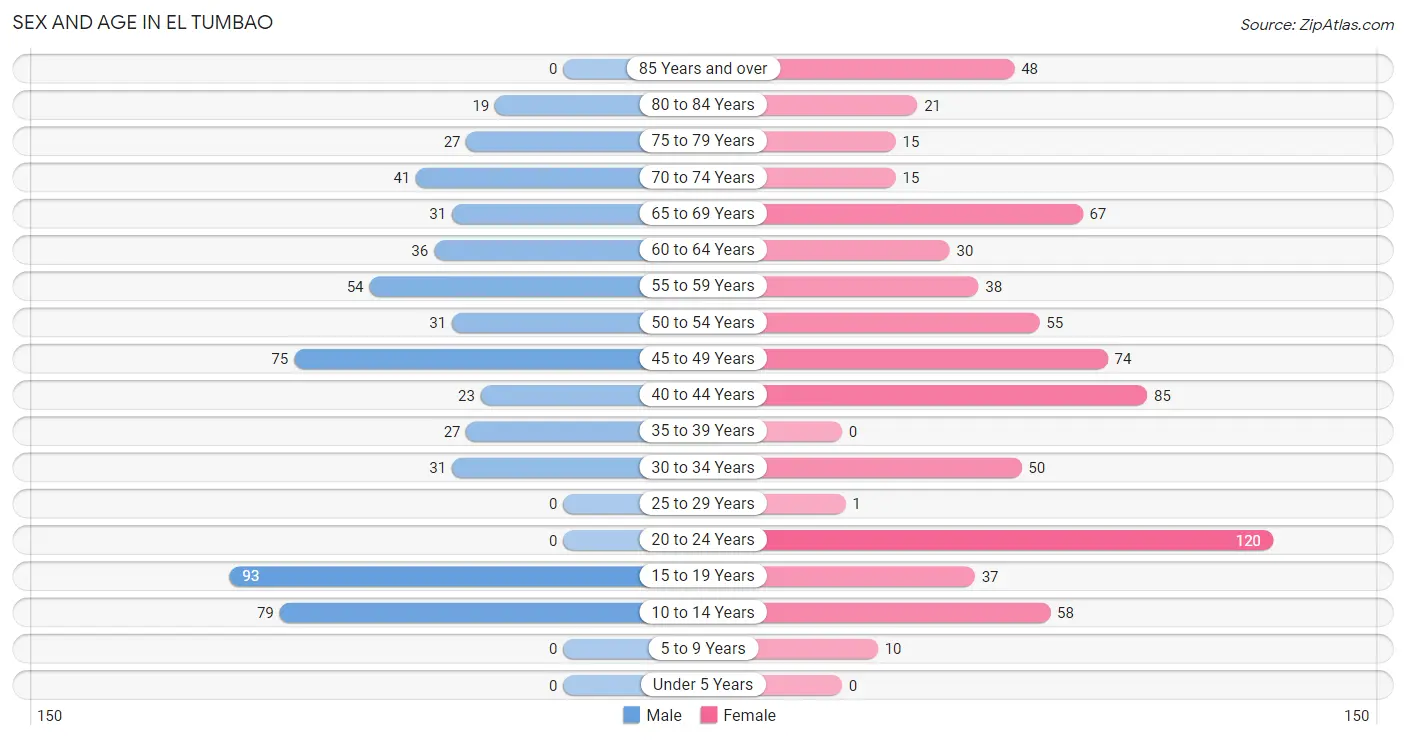
| Age Bracket | Male | Female |
| Under 5 Years | 0 (0.0%) | 0 (0.0%) |
| 5 to 9 Years | 0 (0.0%) | 10 (1.4%) |
| 10 to 14 Years | 79 (13.9%) | 58 (8.0%) |
| 15 to 19 Years | 93 (16.4%) | 37 (5.1%) |
| 20 to 24 Years | 0 (0.0%) | 120 (16.6%) |
| 25 to 29 Years | 0 (0.0%) | 1 (0.1%) |
| 30 to 34 Years | 31 (5.5%) | 50 (6.9%) |
| 35 to 39 Years | 27 (4.8%) | 0 (0.0%) |
| 40 to 44 Years | 23 (4.1%) | 85 (11.7%) |
| 45 to 49 Years | 75 (13.2%) | 74 (10.2%) |
| 50 to 54 Years | 31 (5.5%) | 55 (7.6%) |
| 55 to 59 Years | 54 (9.5%) | 38 (5.2%) |
| 60 to 64 Years | 36 (6.4%) | 30 (4.1%) |
| 65 to 69 Years | 31 (5.5%) | 67 (9.2%) |
| 70 to 74 Years | 41 (7.2%) | 15 (2.1%) |
| 75 to 79 Years | 27 (4.8%) | 15 (2.1%) |
| 80 to 84 Years | 19 (3.4%) | 21 (2.9%) |
| 85 Years and over | 0 (0.0%) | 48 (6.6%) |
| Total | 567 (100.0%) | 724 (100.0%) |
Families and Households in El Tumbao
Median Family Size in El Tumbao
The median family size in El Tumbao is 3.20 persons per family, with single male/father families (44 | 15.2%) accounting for the largest median family size of 4.93 persons per family. On the other hand, single female/mother families (108 | 37.4%) represent the smallest median family size with 2.63 persons per family.
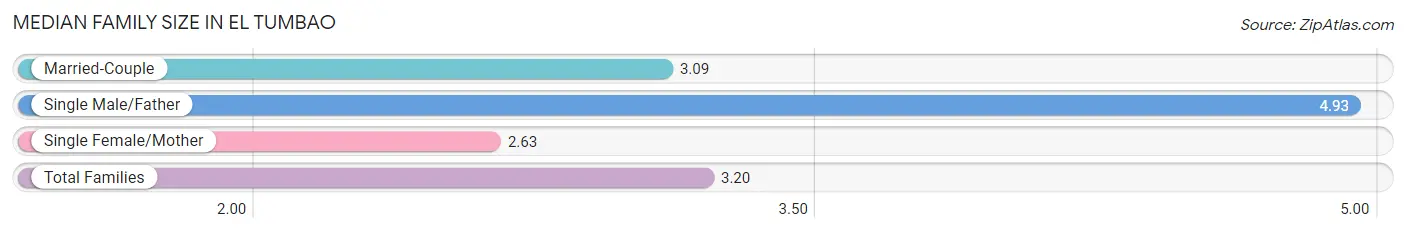
| Family Type | # Families | Family Size |
| Married-Couple | 137 (47.4%) | 3.09 |
| Single Male/Father | 44 (15.2%) | 4.93 |
| Single Female/Mother | 108 (37.4%) | 2.63 |
| Total Families | 289 (100.0%) | 3.20 |
Median Household Size in El Tumbao
The median household size in El Tumbao is 2.35 persons per household, with single male/father households (44 | 8.1%) accounting for the largest median household size of 6.41 persons per household. non-family households (252 | 46.6%) represent the smallest median household size with 1.02 persons per household.
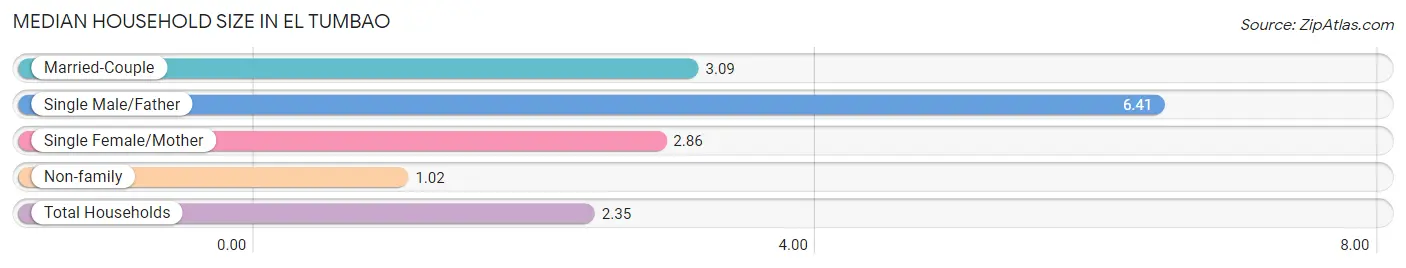
| Household Type | # Households | Household Size |
| Married-Couple | 137 (25.3%) | 3.09 |
| Single Male/Father | 44 (8.1%) | 6.41 |
| Single Female/Mother | 108 (20.0%) | 2.86 |
| Non-family | 252 (46.6%) | 1.02 |
| Total Households | 541 (100.0%) | 2.35 |
Household Size by Marriage Status in El Tumbao
Out of a total of 541 households in El Tumbao, 289 (53.4%) are family households, while 252 (46.6%) are nonfamily households. The most numerous type of family households are 2-person households, comprising 105, and the most common type of nonfamily households are 1-person households, comprising 243.
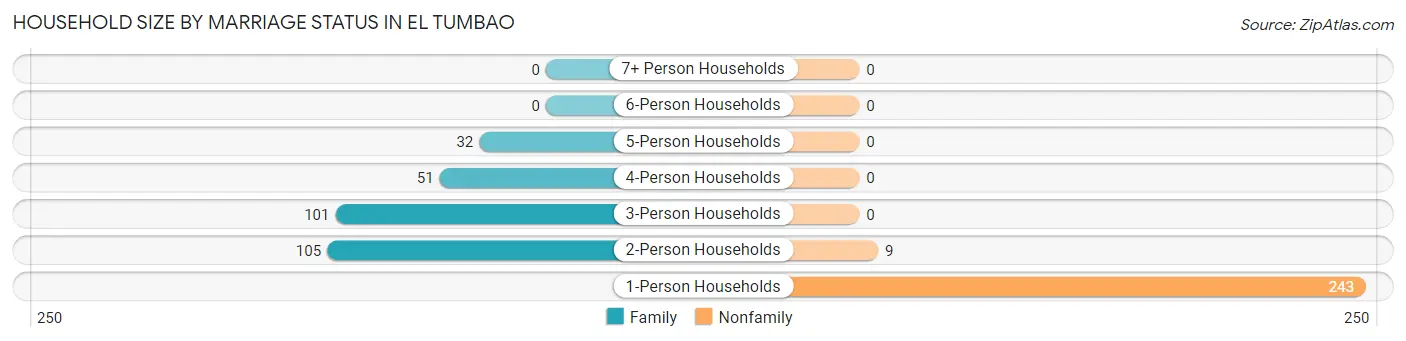
| Household Size | Family Households | Nonfamily Households |
| 1-Person Households | - | 243 (44.9%) |
| 2-Person Households | 105 (19.4%) | 9 (1.7%) |
| 3-Person Households | 101 (18.7%) | 0 (0.0%) |
| 4-Person Households | 51 (9.4%) | 0 (0.0%) |
| 5-Person Households | 32 (5.9%) | 0 (0.0%) |
| 6-Person Households | 0 (0.0%) | 0 (0.0%) |
| 7+ Person Households | 0 (0.0%) | 0 (0.0%) |
| Total | 289 (53.4%) | 252 (46.6%) |
Female Fertility in El Tumbao
Fertility by Age in El Tumbao
| Age Bracket | Women with Births | Births / 1,000 Women |
| 15 to 19 years | 0 (0.0%) | 0.0 |
| 20 to 34 years | 0 (0.0%) | 0.0 |
| 35 to 50 years | 0 (0.0%) | 0.0 |
| Total | 0 (0.0%) | 0.0 |
Fertility by Age by Marriage Status in El Tumbao
| Age Bracket | Married | Unmarried |
| 15 to 19 years | 0 (0.0%) | 0 (0.0%) |
| 20 to 34 years | 0 (0.0%) | 0 (0.0%) |
| 35 to 50 years | 0 (0.0%) | 0 (0.0%) |
| Total | 0 (0.0%) | 0 (0.0%) |
Fertility by Education in El Tumbao
| Educational Attainment | Women with Births | Births / 1,000 Women |
| Less than High School | 0 (0.0%) | 0.0 |
| High School Diploma | 0 (0.0%) | 0.0 |
| College or Associate's Degree | 0 (0.0%) | 0.0 |
| Bachelor's Degree | 0 (0.0%) | 0.0 |
| Graduate Degree | 0 (0.0%) | 0.0 |
| Total | 0 (0.0%) | 0.0 |
Fertility by Education by Marriage Status in El Tumbao
| Educational Attainment | Married | Unmarried |
| Less than High School | 0 (0.0%) | 0 (0.0%) |
| High School Diploma | 0 (0.0%) | 0 (0.0%) |
| College or Associate's Degree | 0 (0.0%) | 0 (0.0%) |
| Bachelor's Degree | 0 (0.0%) | 0 (0.0%) |
| Graduate Degree | 0 (0.0%) | 0 (0.0%) |
| Total | 0 (0.0%) | 0 (0.0%) |
Employment Characteristics in El Tumbao
Employment by Class of Employer in El Tumbao
Among the 333 employed individuals in El Tumbao, private company employees (210 | 63.1%), state government employees (85 | 25.5%), and self-employed (not incorporated) (25 | 7.5%) make up the most common classes of employment.
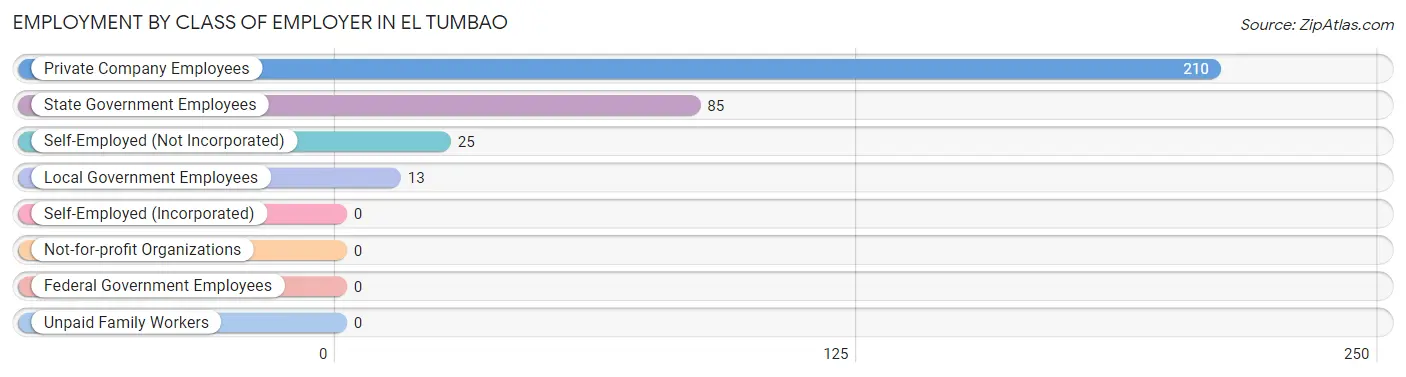
| Employer Class | # Employees | % Employees |
| Private Company Employees | 210 | 63.1% |
| Self-Employed (Incorporated) | 0 | 0.0% |
| Self-Employed (Not Incorporated) | 25 | 7.5% |
| Not-for-profit Organizations | 0 | 0.0% |
| Local Government Employees | 13 | 3.9% |
| State Government Employees | 85 | 25.5% |
| Federal Government Employees | 0 | 0.0% |
| Unpaid Family Workers | 0 | 0.0% |
| Total | 333 | 100.0% |
Employment Status by Age in El Tumbao
According to the labor force statistics for El Tumbao, out of the total population over 16 years of age (1,116), 38.1% or 425 individuals are in the labor force, with 18.6% or 79 of them unemployed. The age group with the highest labor force participation rate is 30 to 34 years, with 85.2% or 69 individuals in the labor force. Within the labor force, the 60 to 64 years age range has the highest percentage of unemployed individuals, with 66.7% or 14 of them being unemployed.
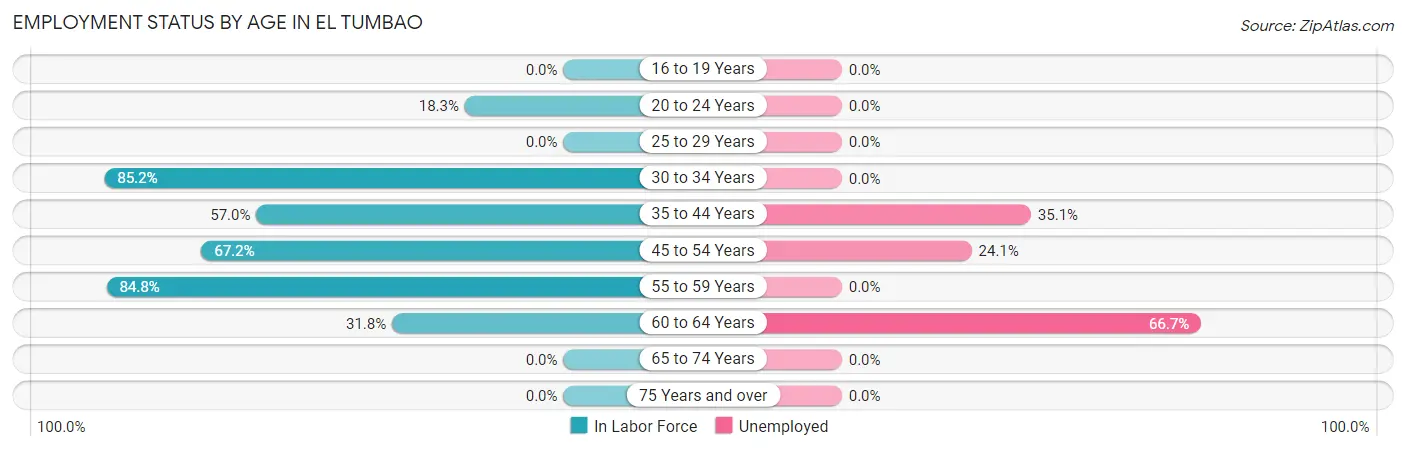
| Age Bracket | In Labor Force | Unemployed |
| 16 to 19 Years | 0 (0.0%) | 0 (0.0%) |
| 20 to 24 Years | 22 (18.3%) | 0 (0.0%) |
| 25 to 29 Years | 0 (0.0%) | 0 (0.0%) |
| 30 to 34 Years | 69 (85.2%) | 0 (0.0%) |
| 35 to 44 Years | 77 (57.0%) | 27 (35.1%) |
| 45 to 54 Years | 158 (67.2%) | 38 (24.1%) |
| 55 to 59 Years | 78 (84.8%) | 0 (0.0%) |
| 60 to 64 Years | 21 (31.8%) | 14 (66.7%) |
| 65 to 74 Years | 0 (0.0%) | 0 (0.0%) |
| 75 Years and over | 0 (0.0%) | 0 (0.0%) |
| Total | 425 (38.1%) | 79 (18.6%) |
Employment Status by Educational Attainment in El Tumbao
According to labor force statistics for El Tumbao, 66.1% of individuals (403) out of the total population between 25 and 64 years of age (610) are in the labor force, with 19.6% or 79 of them being unemployed. The group with the highest labor force participation rate are those with the educational attainment of college / associate degree, with 88.1% or 104 individuals in the labor force. Within the labor force, individuals with less than high school education have the highest percentage of unemployment, with 60.7% or 65 of them being unemployed.
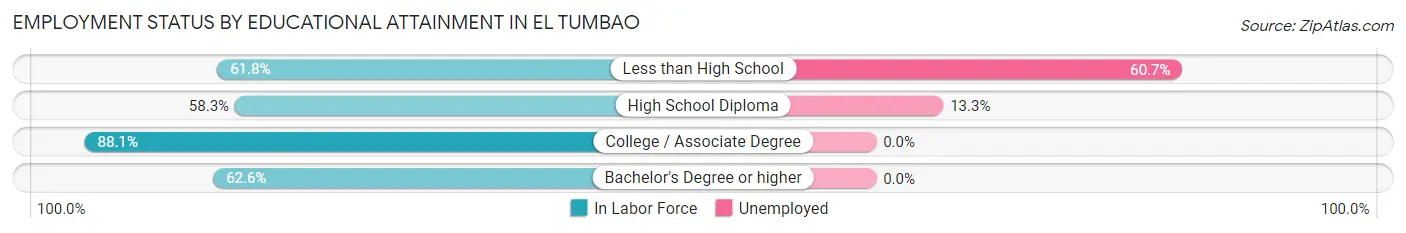
| Educational Attainment | In Labor Force | Unemployed |
| Less than High School | 107 (61.8%) | 105 (60.7%) |
| High School Diploma | 105 (58.3%) | 24 (13.3%) |
| College / Associate Degree | 104 (88.1%) | 0 (0.0%) |
| Bachelor's Degree or higher | 87 (62.6%) | 0 (0.0%) |
| Total | 403 (66.1%) | 120 (19.6%) |
Employment Occupations by Sex in El Tumbao
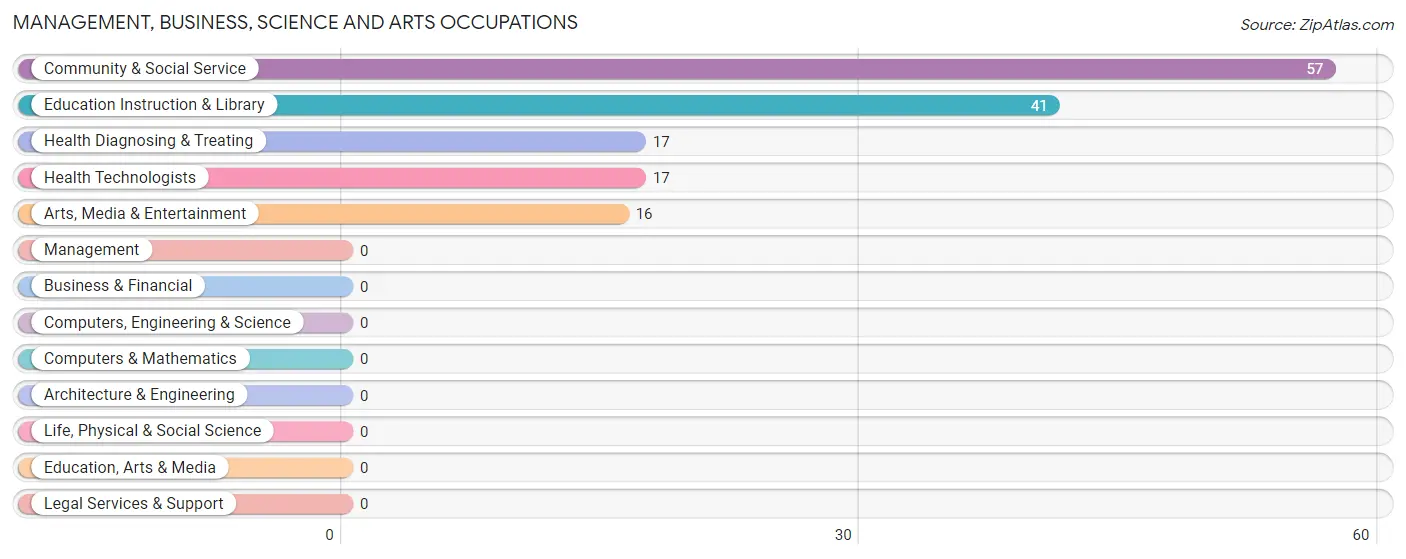
Management, Business, Science and Arts Occupations
The most common Management, Business, Science and Arts occupations in El Tumbao are Community & Social Service (57 | 16.5%), Education Instruction & Library (41 | 11.8%), Health Diagnosing & Treating (17 | 4.9%), Health Technologists (17 | 4.9%), and Arts, Media & Entertainment (16 | 4.6%).
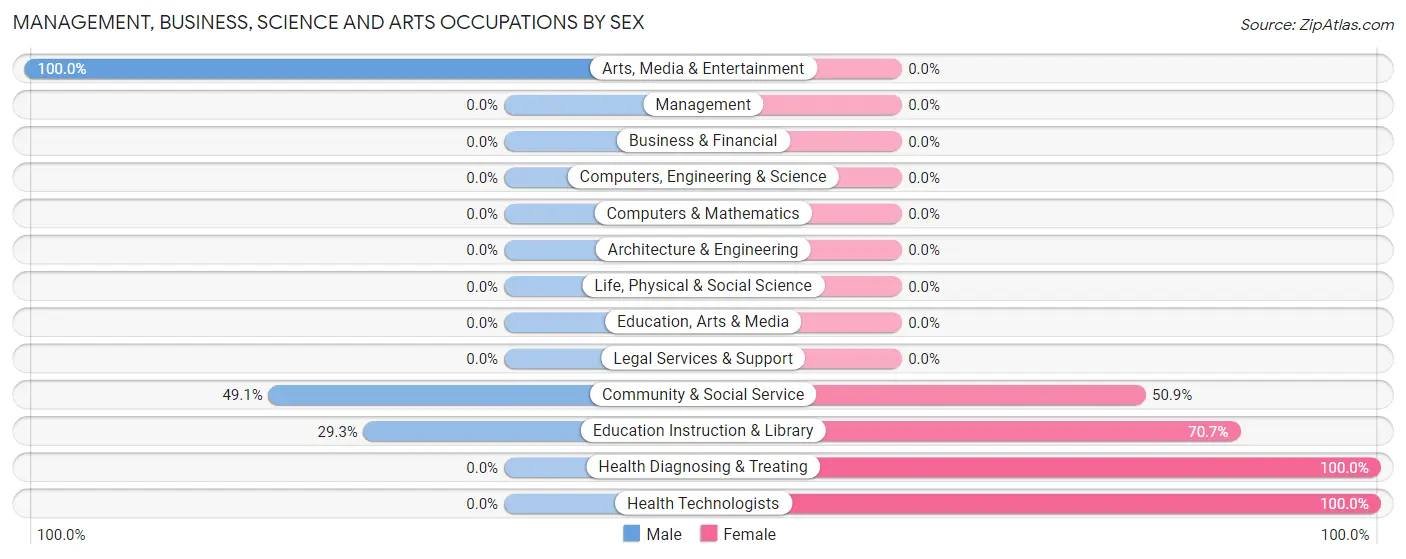
Management, Business, Science and Arts Occupations by Sex
Within the Management, Business, Science and Arts occupations in El Tumbao, the most male-oriented occupations are Arts, Media & Entertainment (100.0%), Community & Social Service (49.1%), and Education Instruction & Library (29.3%), while the most female-oriented occupations are Health Diagnosing & Treating (100.0%), Health Technologists (100.0%), and Education Instruction & Library (70.7%).
| Occupation | Male | Female |
| Management | 0 (0.0%) | 0 (0.0%) |
| Business & Financial | 0 (0.0%) | 0 (0.0%) |
| Computers, Engineering & Science | 0 (0.0%) | 0 (0.0%) |
| Computers & Mathematics | 0 (0.0%) | 0 (0.0%) |
| Architecture & Engineering | 0 (0.0%) | 0 (0.0%) |
| Life, Physical & Social Science | 0 (0.0%) | 0 (0.0%) |
| Community & Social Service | 28 (49.1%) | 29 (50.9%) |
| Education, Arts & Media | 0 (0.0%) | 0 (0.0%) |
| Legal Services & Support | 0 (0.0%) | 0 (0.0%) |
| Education Instruction & Library | 12 (29.3%) | 29 (70.7%) |
| Arts, Media & Entertainment | 16 (100.0%) | 0 (0.0%) |
| Health Diagnosing & Treating | 0 (0.0%) | 17 (100.0%) |
| Health Technologists | 0 (0.0%) | 17 (100.0%) |
| Total (Category) | 28 (37.8%) | 46 (62.2%) |
| Total (Overall) | 163 (47.1%) | 183 (52.9%) |
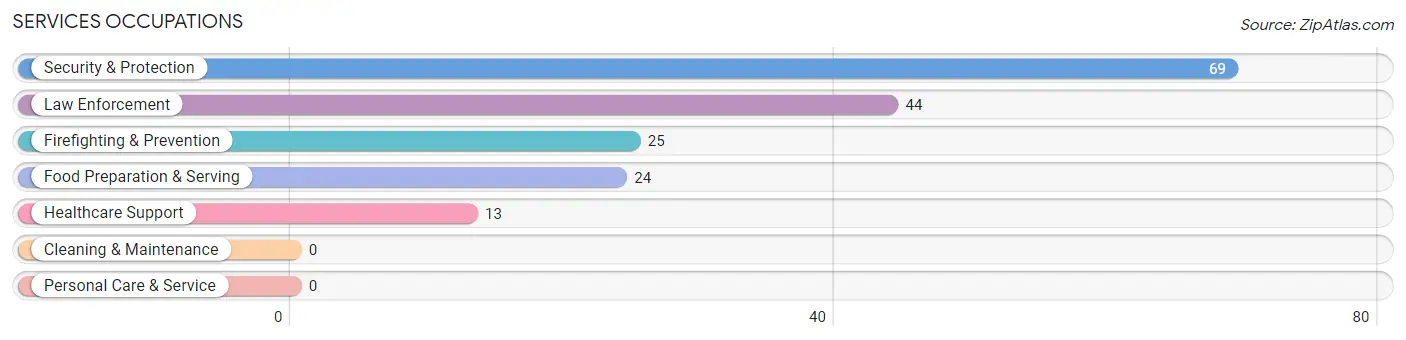
Services Occupations
The most common Services occupations in El Tumbao are Security & Protection (69 | 19.9%), Law Enforcement (44 | 12.7%), Firefighting & Prevention (25 | 7.2%), Food Preparation & Serving (24 | 6.9%), and Healthcare Support (13 | 3.8%).
Services Occupations by Sex
Within the Services occupations in El Tumbao, the most male-oriented occupations are Security & Protection (100.0%), Firefighting & Prevention (100.0%), and Law Enforcement (100.0%), while the most female-oriented occupations are Healthcare Support (100.0%), and Food Preparation & Serving (100.0%).
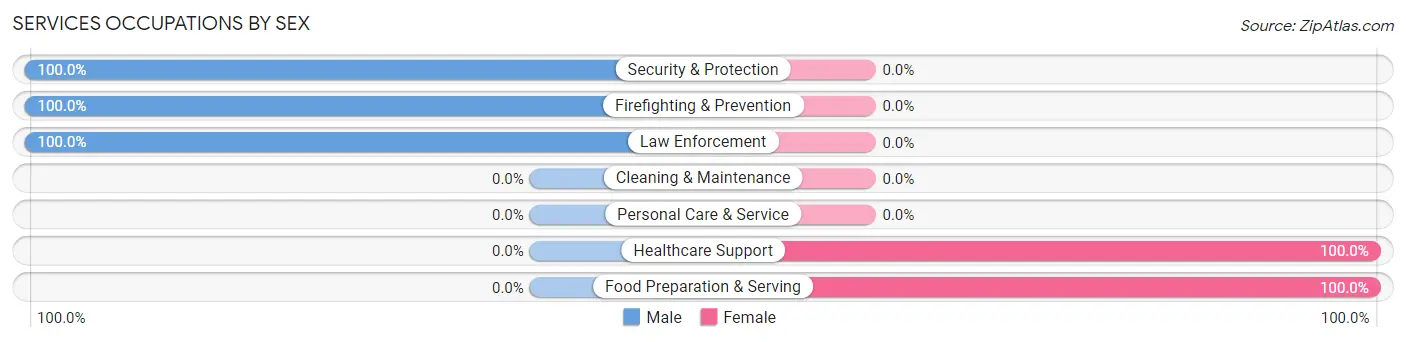
| Occupation | Male | Female |
| Healthcare Support | 0 (0.0%) | 13 (100.0%) |
| Security & Protection | 69 (100.0%) | 0 (0.0%) |
| Firefighting & Prevention | 25 (100.0%) | 0 (0.0%) |
| Law Enforcement | 44 (100.0%) | 0 (0.0%) |
| Food Preparation & Serving | 0 (0.0%) | 24 (100.0%) |
| Cleaning & Maintenance | 0 (0.0%) | 0 (0.0%) |
| Personal Care & Service | 0 (0.0%) | 0 (0.0%) |
| Total (Category) | 69 (65.1%) | 37 (34.9%) |
| Total (Overall) | 163 (47.1%) | 183 (52.9%) |
Sales and Office Occupations
The most common Sales and Office occupations in El Tumbao are Sales & Related (39 | 11.3%), and Office & Administration (38 | 11.0%).

Sales and Office Occupations by Sex

| Occupation | Male | Female |
| Sales & Related | 17 (43.6%) | 22 (56.4%) |
| Office & Administration | 0 (0.0%) | 38 (100.0%) |
| Total (Category) | 17 (22.1%) | 60 (77.9%) |
| Total (Overall) | 163 (47.1%) | 183 (52.9%) |
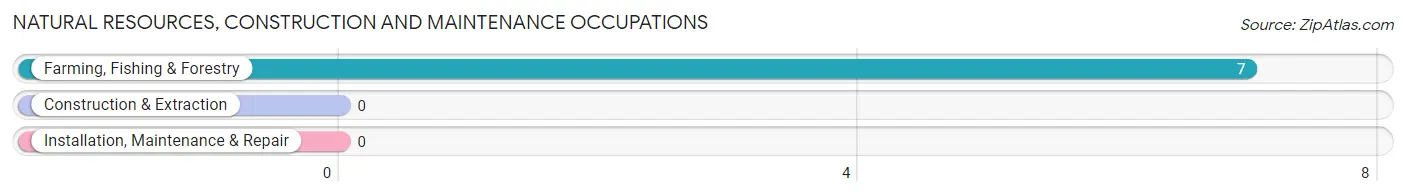
Natural Resources, Construction and Maintenance Occupations
The most common Natural Resources, Construction and Maintenance occupations in El Tumbao are , and Farming, Fishing & Forestry (7 | 2.0%).
Natural Resources, Construction and Maintenance Occupations by Sex
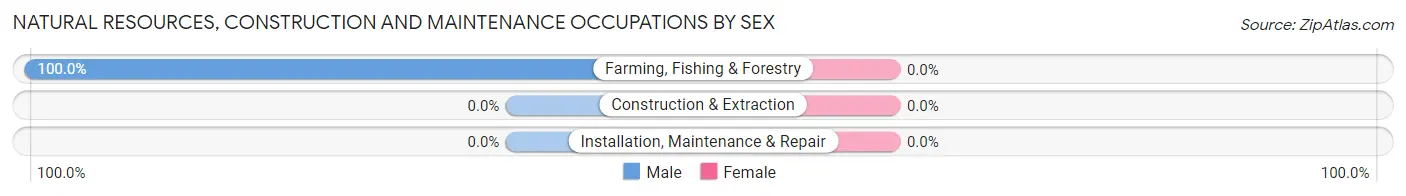
| Occupation | Male | Female |
| Farming, Fishing & Forestry | 7 (100.0%) | 0 (0.0%) |
| Construction & Extraction | 0 (0.0%) | 0 (0.0%) |
| Installation, Maintenance & Repair | 0 (0.0%) | 0 (0.0%) |
| Total (Category) | 7 (100.0%) | 0 (0.0%) |
| Total (Overall) | 163 (47.1%) | 183 (52.9%) |
Production, Transportation and Moving Occupations
The most common Production, Transportation and Moving occupations in El Tumbao are Production (40 | 11.6%), Transportation (23 | 6.7%), and Material Moving (19 | 5.5%).
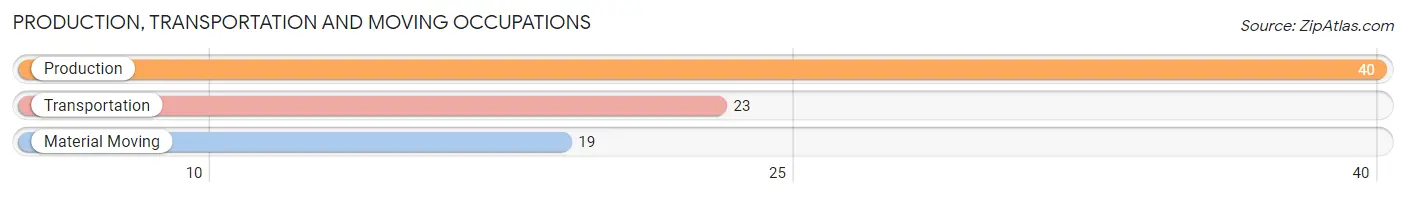
Production, Transportation and Moving Occupations by Sex
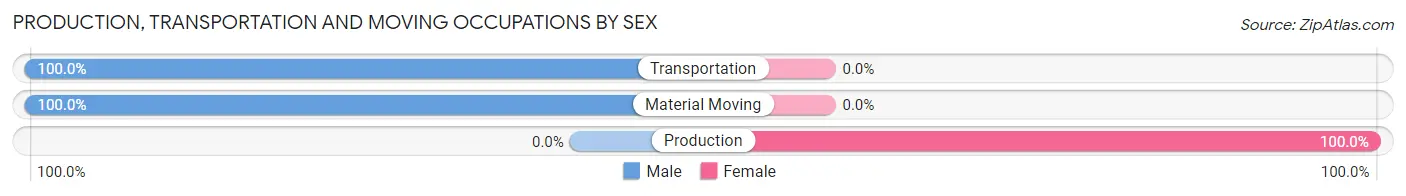
| Occupation | Male | Female |
| Production | 0 (0.0%) | 40 (100.0%) |
| Transportation | 23 (100.0%) | 0 (0.0%) |
| Material Moving | 19 (100.0%) | 0 (0.0%) |
| Total (Category) | 42 (51.2%) | 40 (48.8%) |
| Total (Overall) | 163 (47.1%) | 183 (52.9%) |
Employment Industries by Sex in El Tumbao
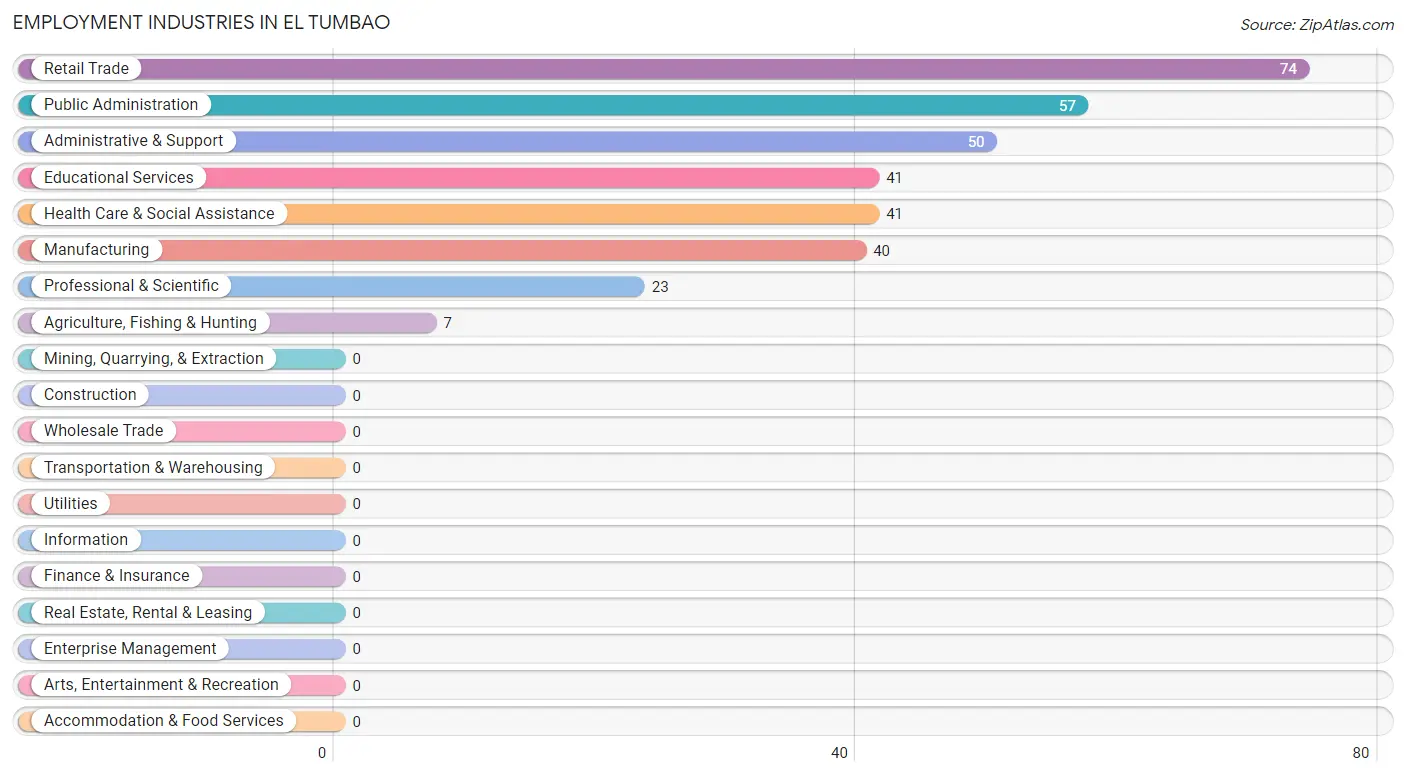
Employment Industries in El Tumbao
The major employment industries in El Tumbao include Retail Trade (74 | 21.4%), Public Administration (57 | 16.5%), Administrative & Support (50 | 14.4%), Educational Services (41 | 11.8%), and Health Care & Social Assistance (41 | 11.8%).
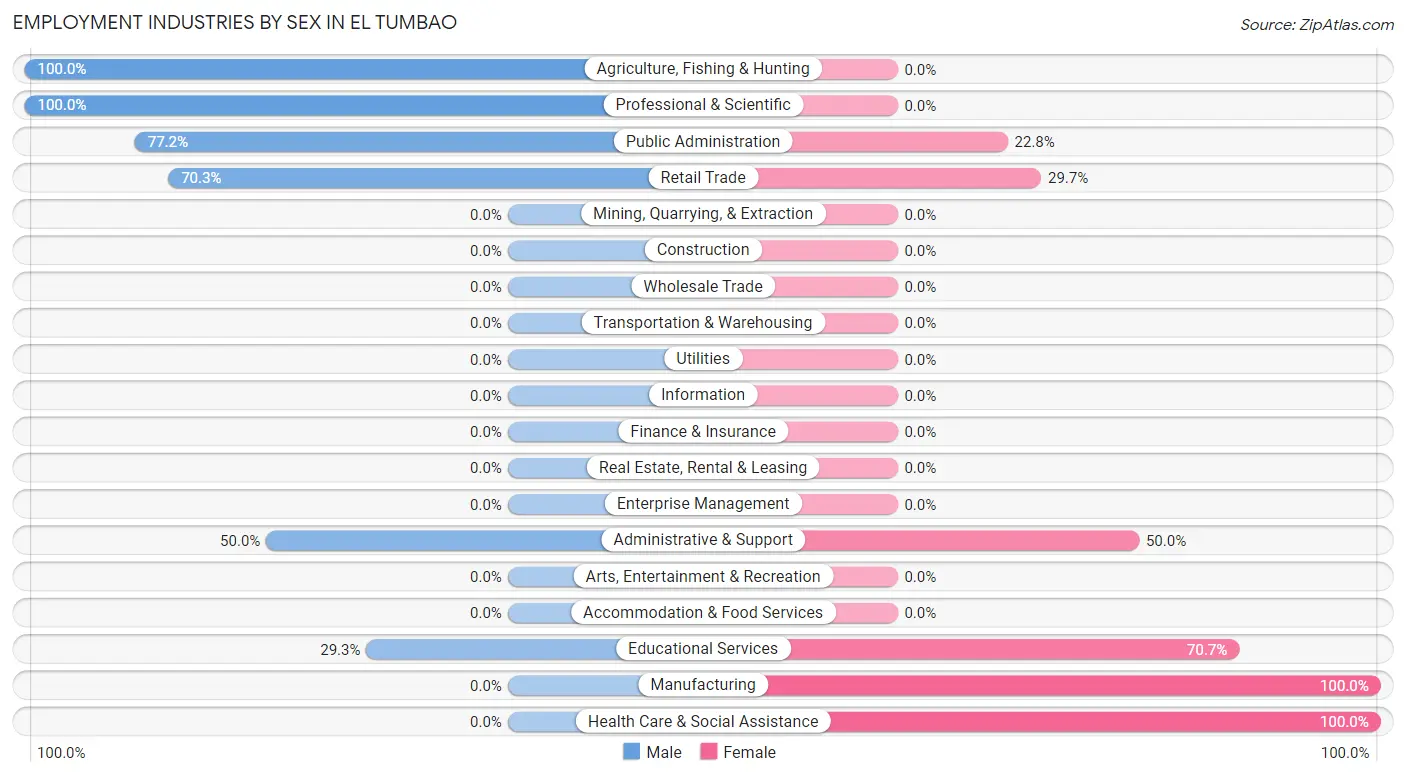
Employment Industries by Sex in El Tumbao
The El Tumbao industries that see more men than women are Agriculture, Fishing & Hunting (100.0%), Professional & Scientific (100.0%), and Public Administration (77.2%), whereas the industries that tend to have a higher number of women are Manufacturing (100.0%), Health Care & Social Assistance (100.0%), and Educational Services (70.7%).
| Industry | Male | Female |
| Agriculture, Fishing & Hunting | 7 (100.0%) | 0 (0.0%) |
| Mining, Quarrying, & Extraction | 0 (0.0%) | 0 (0.0%) |
| Construction | 0 (0.0%) | 0 (0.0%) |
| Manufacturing | 0 (0.0%) | 40 (100.0%) |
| Wholesale Trade | 0 (0.0%) | 0 (0.0%) |
| Retail Trade | 52 (70.3%) | 22 (29.7%) |
| Transportation & Warehousing | 0 (0.0%) | 0 (0.0%) |
| Utilities | 0 (0.0%) | 0 (0.0%) |
| Information | 0 (0.0%) | 0 (0.0%) |
| Finance & Insurance | 0 (0.0%) | 0 (0.0%) |
| Real Estate, Rental & Leasing | 0 (0.0%) | 0 (0.0%) |
| Professional & Scientific | 23 (100.0%) | 0 (0.0%) |
| Enterprise Management | 0 (0.0%) | 0 (0.0%) |
| Administrative & Support | 25 (50.0%) | 25 (50.0%) |
| Educational Services | 12 (29.3%) | 29 (70.7%) |
| Health Care & Social Assistance | 0 (0.0%) | 41 (100.0%) |
| Arts, Entertainment & Recreation | 0 (0.0%) | 0 (0.0%) |
| Accommodation & Food Services | 0 (0.0%) | 0 (0.0%) |
| Public Administration | 44 (77.2%) | 13 (22.8%) |
| Total | 163 (47.1%) | 183 (52.9%) |
Education in El Tumbao
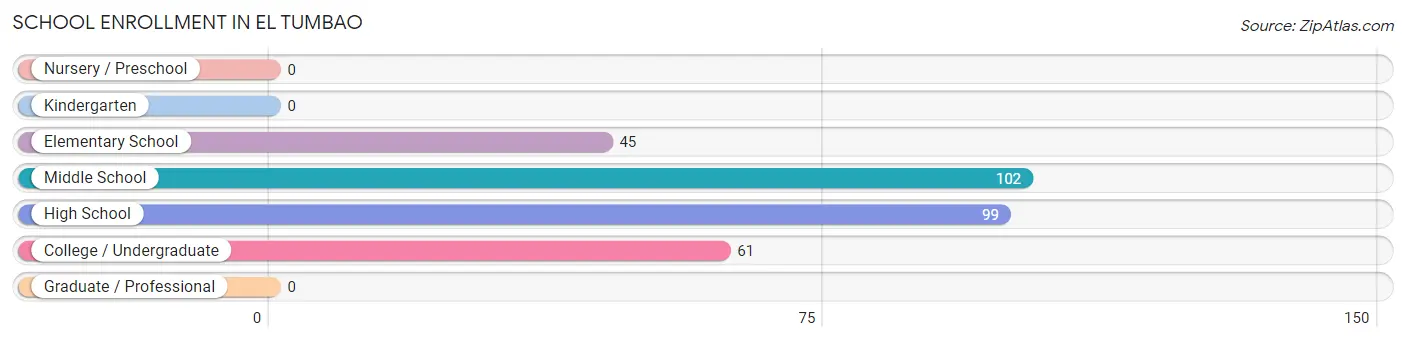
School Enrollment in El Tumbao
The most common levels of schooling among the 307 students in El Tumbao are middle school (102 | 33.2%), high school (99 | 32.3%), and college / undergraduate (61 | 19.9%).
| School Level | # Students | % Students |
| Nursery / Preschool | 0 | 0.0% |
| Kindergarten | 0 | 0.0% |
| Elementary School | 45 | 14.7% |
| Middle School | 102 | 33.2% |
| High School | 99 | 32.3% |
| College / Undergraduate | 61 | 19.9% |
| Graduate / Professional | 0 | 0.0% |
| Total | 307 | 100.0% |
School Enrollment by Age by Funding Source in El Tumbao
Out of a total of 307 students who are enrolled in schools in El Tumbao, 45 (14.7%) attend a private institution, while the remaining 262 (85.3%) are enrolled in public schools. The age group of 5 to 9 year old has the highest likelihood of being enrolled in private schools, with 10 (100.0% in the age bracket) enrolled. Conversely, the age group of 15 to 17 year olds has the lowest likelihood of being enrolled in a private school, with 62 (100.0% in the age bracket) attending a public institution.
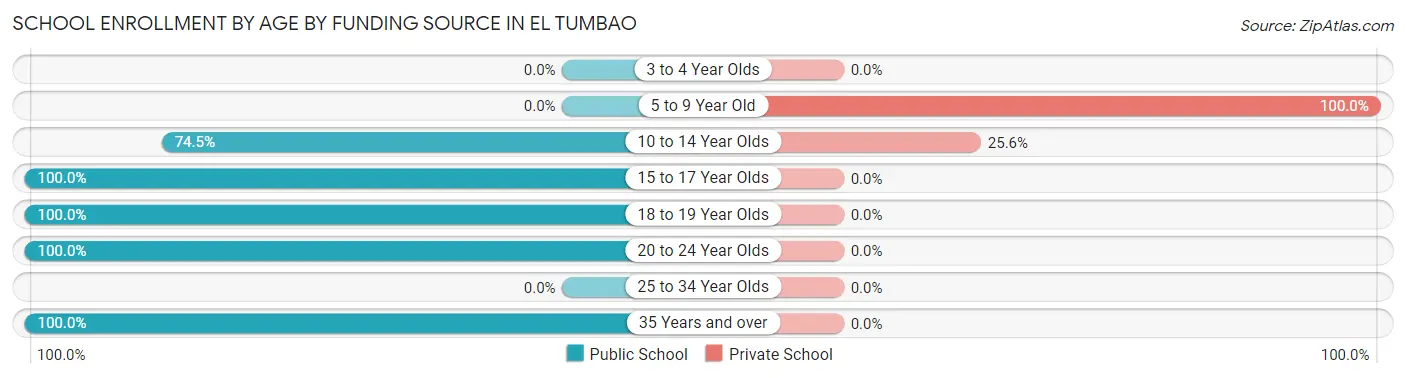
| Age Bracket | Public School | Private School |
| 3 to 4 Year Olds | 0 (0.0%) | 0 (0.0%) |
| 5 to 9 Year Old | 0 (0.0%) | 10 (100.0%) |
| 10 to 14 Year Olds | 102 (74.5%) | 35 (25.6%) |
| 15 to 17 Year Olds | 62 (100.0%) | 0 (0.0%) |
| 18 to 19 Year Olds | 37 (100.0%) | 0 (0.0%) |
| 20 to 24 Year Olds | 53 (100.0%) | 0 (0.0%) |
| 25 to 34 Year Olds | 0 (0.0%) | 0 (0.0%) |
| 35 Years and over | 8 (100.0%) | 0 (0.0%) |
| Total | 262 (85.3%) | 45 (14.7%) |
Educational Attainment by Field of Study in El Tumbao
Education (51 | 33.6%), business (39 | 25.7%), arts & humanities (25 | 16.5%), communications (21 | 13.8%), and visual & performing arts (16 | 10.5%) are the most common fields of study among 152 individuals in El Tumbao who have obtained a bachelor's degree or higher.
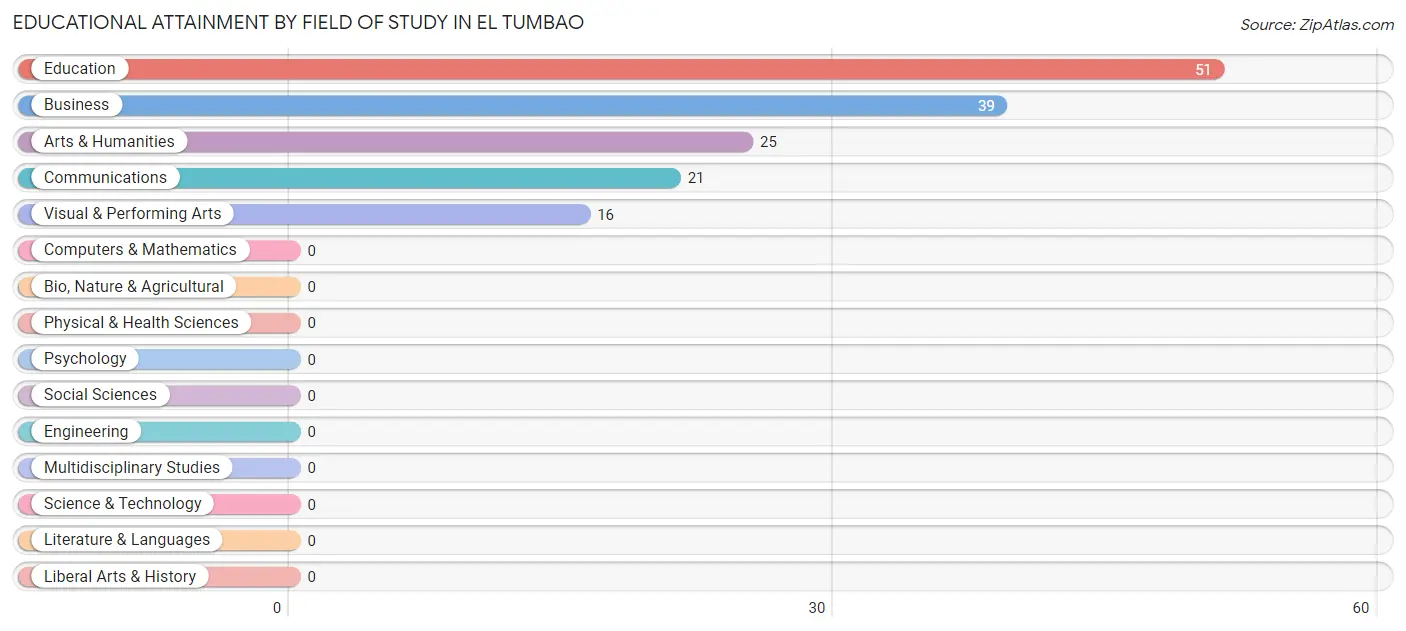
| Field of Study | # Graduates | % Graduates |
| Computers & Mathematics | 0 | 0.0% |
| Bio, Nature & Agricultural | 0 | 0.0% |
| Physical & Health Sciences | 0 | 0.0% |
| Psychology | 0 | 0.0% |
| Social Sciences | 0 | 0.0% |
| Engineering | 0 | 0.0% |
| Multidisciplinary Studies | 0 | 0.0% |
| Science & Technology | 0 | 0.0% |
| Business | 39 | 25.7% |
| Education | 51 | 33.6% |
| Literature & Languages | 0 | 0.0% |
| Liberal Arts & History | 0 | 0.0% |
| Visual & Performing Arts | 16 | 10.5% |
| Communications | 21 | 13.8% |
| Arts & Humanities | 25 | 16.5% |
| Total | 152 | 100.0% |
Transportation & Commute in El Tumbao
Vehicle Availability by Sex in El Tumbao
The most prevalent vehicle ownership categories in El Tumbao are males with 2 vehicles (124, accounting for 76.1%) and females with 2 vehicles (146, making up 72.9%).
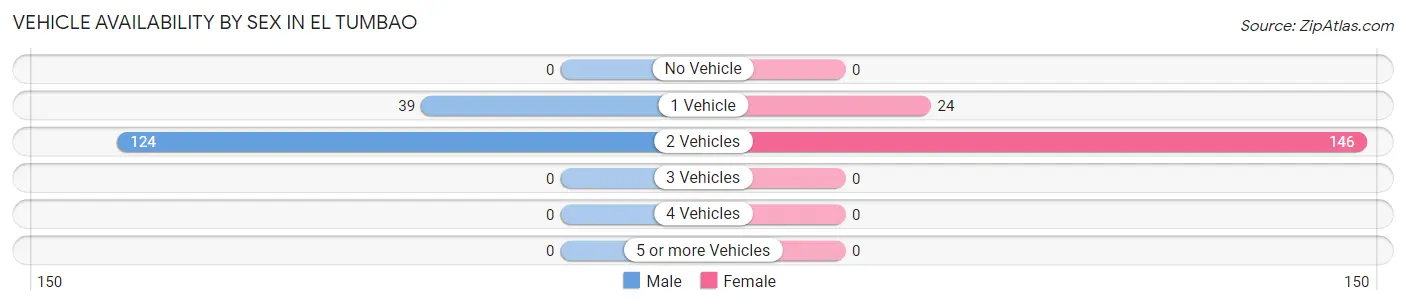
| Vehicles Available | Male | Female |
| No Vehicle | 0 (0.0%) | 0 (0.0%) |
| 1 Vehicle | 39 (23.9%) | 24 (14.1%) |
| 2 Vehicles | 124 (76.1%) | 146 (85.9%) |
| 3 Vehicles | 0 (0.0%) | 0 (0.0%) |
| 4 Vehicles | 0 (0.0%) | 0 (0.0%) |
| 5 or more Vehicles | 0 (0.0%) | 0 (0.0%) |
| Total | 163 (100.0%) | 170 (100.0%) |
Commute Time in El Tumbao
The most frequently occuring commute durations in El Tumbao are 10 to 14 minutes (134 commuters, 40.2%), 15 to 19 minutes (82 commuters, 24.6%), and 30 to 34 minutes (51 commuters, 15.3%).
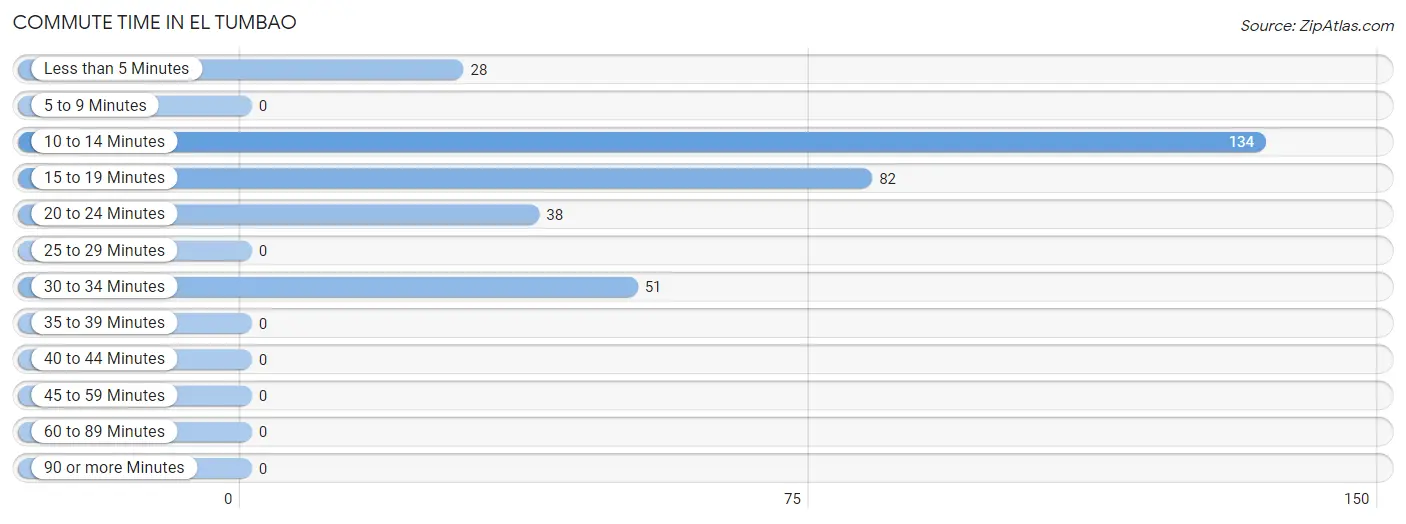
| Commute Time | # Commuters | % Commuters |
| Less than 5 Minutes | 28 | 8.4% |
| 5 to 9 Minutes | 0 | 0.0% |
| 10 to 14 Minutes | 134 | 40.2% |
| 15 to 19 Minutes | 82 | 24.6% |
| 20 to 24 Minutes | 38 | 11.4% |
| 25 to 29 Minutes | 0 | 0.0% |
| 30 to 34 Minutes | 51 | 15.3% |
| 35 to 39 Minutes | 0 | 0.0% |
| 40 to 44 Minutes | 0 | 0.0% |
| 45 to 59 Minutes | 0 | 0.0% |
| 60 to 89 Minutes | 0 | 0.0% |
| 90 or more Minutes | 0 | 0.0% |
Commute Time by Sex in El Tumbao
The most common commute times in El Tumbao are 15 to 19 minutes (48 commuters, 29.4%) for males and 10 to 14 minutes (87 commuters, 51.2%) for females.
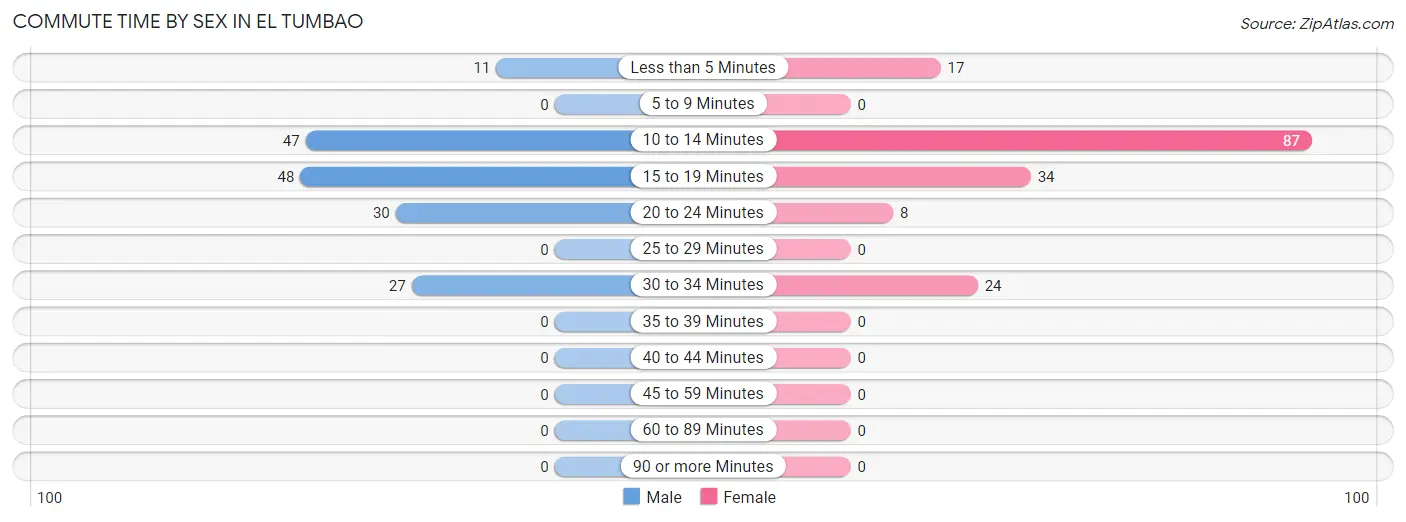
| Commute Time | Male | Female |
| Less than 5 Minutes | 11 (6.8%) | 17 (10.0%) |
| 5 to 9 Minutes | 0 (0.0%) | 0 (0.0%) |
| 10 to 14 Minutes | 47 (28.8%) | 87 (51.2%) |
| 15 to 19 Minutes | 48 (29.4%) | 34 (20.0%) |
| 20 to 24 Minutes | 30 (18.4%) | 8 (4.7%) |
| 25 to 29 Minutes | 0 (0.0%) | 0 (0.0%) |
| 30 to 34 Minutes | 27 (16.6%) | 24 (14.1%) |
| 35 to 39 Minutes | 0 (0.0%) | 0 (0.0%) |
| 40 to 44 Minutes | 0 (0.0%) | 0 (0.0%) |
| 45 to 59 Minutes | 0 (0.0%) | 0 (0.0%) |
| 60 to 89 Minutes | 0 (0.0%) | 0 (0.0%) |
| 90 or more Minutes | 0 (0.0%) | 0 (0.0%) |
Time of Departure to Work by Sex in El Tumbao
The most frequent times of departure to work in El Tumbao are 7:30 AM to 7:59 AM (37, 22.7%) for males and 6:30 AM to 6:59 AM (63, 37.1%) for females.
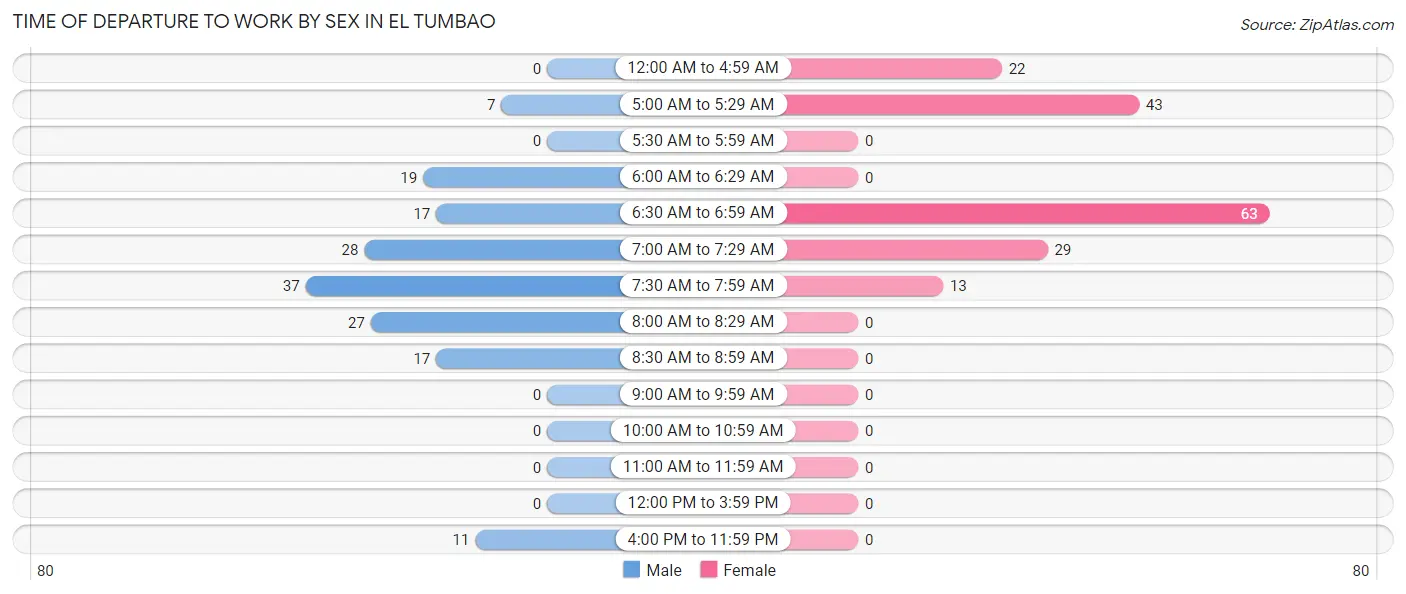
| Time of Departure | Male | Female |
| 12:00 AM to 4:59 AM | 0 (0.0%) | 22 (12.9%) |
| 5:00 AM to 5:29 AM | 7 (4.3%) | 43 (25.3%) |
| 5:30 AM to 5:59 AM | 0 (0.0%) | 0 (0.0%) |
| 6:00 AM to 6:29 AM | 19 (11.7%) | 0 (0.0%) |
| 6:30 AM to 6:59 AM | 17 (10.4%) | 63 (37.1%) |
| 7:00 AM to 7:29 AM | 28 (17.2%) | 29 (17.1%) |
| 7:30 AM to 7:59 AM | 37 (22.7%) | 13 (7.6%) |
| 8:00 AM to 8:29 AM | 27 (16.6%) | 0 (0.0%) |
| 8:30 AM to 8:59 AM | 17 (10.4%) | 0 (0.0%) |
| 9:00 AM to 9:59 AM | 0 (0.0%) | 0 (0.0%) |
| 10:00 AM to 10:59 AM | 0 (0.0%) | 0 (0.0%) |
| 11:00 AM to 11:59 AM | 0 (0.0%) | 0 (0.0%) |
| 12:00 PM to 3:59 PM | 0 (0.0%) | 0 (0.0%) |
| 4:00 PM to 11:59 PM | 11 (6.8%) | 0 (0.0%) |
| Total | 163 (100.0%) | 170 (100.0%) |
Housing Occupancy in El Tumbao
Occupancy by Ownership in El Tumbao
Of the total 541 dwellings in El Tumbao, owner-occupied units account for 388 (71.7%), while renter-occupied units make up 153 (28.3%).
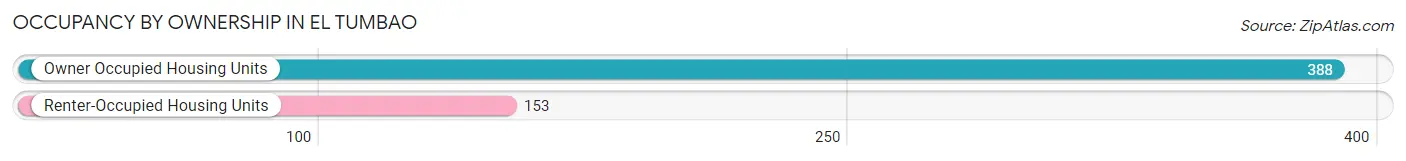
| Occupancy | # Housing Units | % Housing Units |
| Owner Occupied Housing Units | 388 | 71.7% |
| Renter-Occupied Housing Units | 153 | 28.3% |
| Total Occupied Housing Units | 541 | 100.0% |
Occupancy by Household Size in El Tumbao
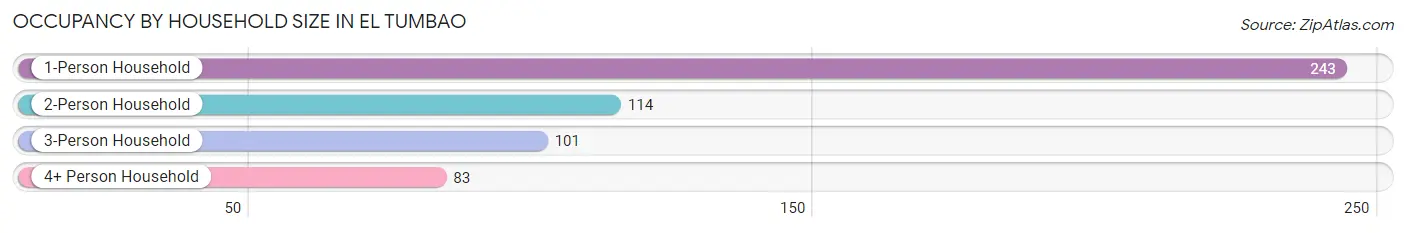
| Household Size | # Housing Units | % Housing Units |
| 1-Person Household | 243 | 44.9% |
| 2-Person Household | 114 | 21.1% |
| 3-Person Household | 101 | 18.7% |
| 4+ Person Household | 83 | 15.3% |
| Total Housing Units | 541 | 100.0% |
Occupancy by Ownership by Household Size in El Tumbao
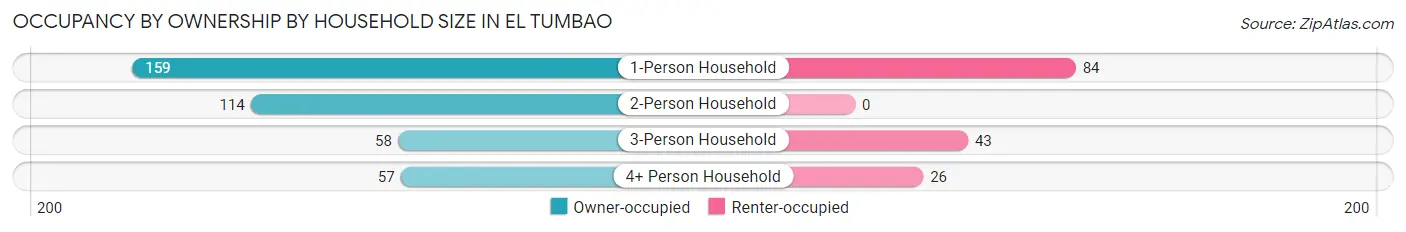
| Household Size | Owner-occupied | Renter-occupied |
| 1-Person Household | 159 (65.4%) | 84 (34.6%) |
| 2-Person Household | 114 (100.0%) | 0 (0.0%) |
| 3-Person Household | 58 (57.4%) | 43 (42.6%) |
| 4+ Person Household | 57 (68.7%) | 26 (31.3%) |
| Total Housing Units | 388 (71.7%) | 153 (28.3%) |
Occupancy by Educational Attainment in El Tumbao
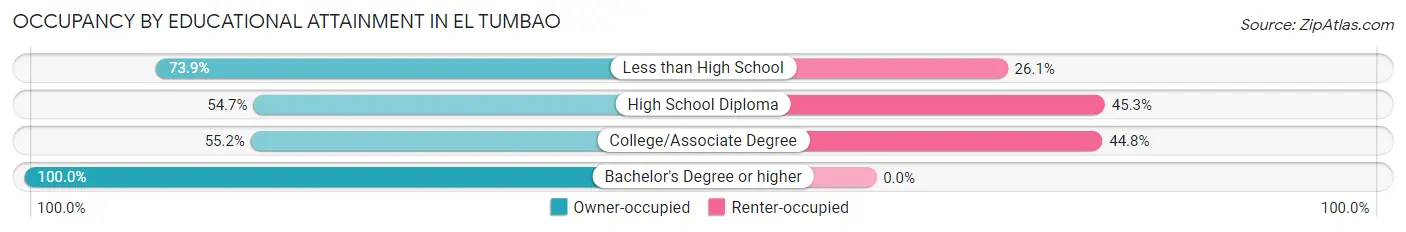
| Household Size | Owner-occupied | Renter-occupied |
| Less than High School | 190 (73.9%) | 67 (26.1%) |
| High School Diploma | 88 (54.7%) | 73 (45.3%) |
| College/Associate Degree | 16 (55.2%) | 13 (44.8%) |
| Bachelor's Degree or higher | 94 (100.0%) | 0 (0.0%) |
Occupancy by Age of Householder in El Tumbao
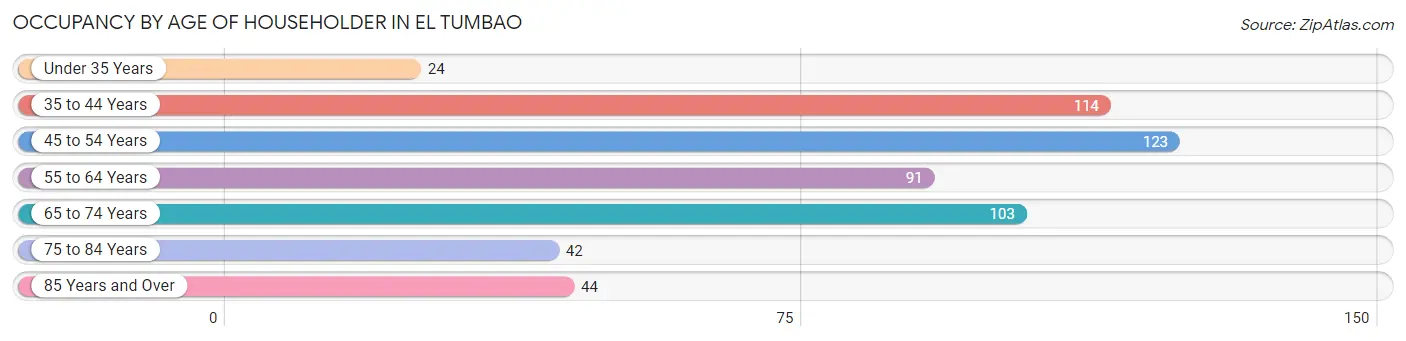
| Age Bracket | # Households | % Households |
| Under 35 Years | 24 | 4.4% |
| 35 to 44 Years | 114 | 21.1% |
| 45 to 54 Years | 123 | 22.7% |
| 55 to 64 Years | 91 | 16.8% |
| 65 to 74 Years | 103 | 19.0% |
| 75 to 84 Years | 42 | 7.8% |
| 85 Years and Over | 44 | 8.1% |
| Total | 541 | 100.0% |
Housing Finances in El Tumbao
Median Income by Occupancy in El Tumbao
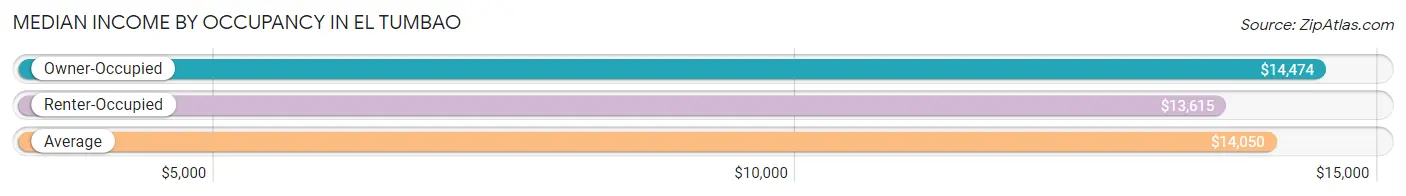
| Occupancy Type | # Households | Median Income |
| Owner-Occupied | 388 (71.7%) | $14,474 |
| Renter-Occupied | 153 (28.3%) | $13,615 |
| Average | 541 (100.0%) | $14,050 |
Occupancy by Householder Income Bracket in El Tumbao
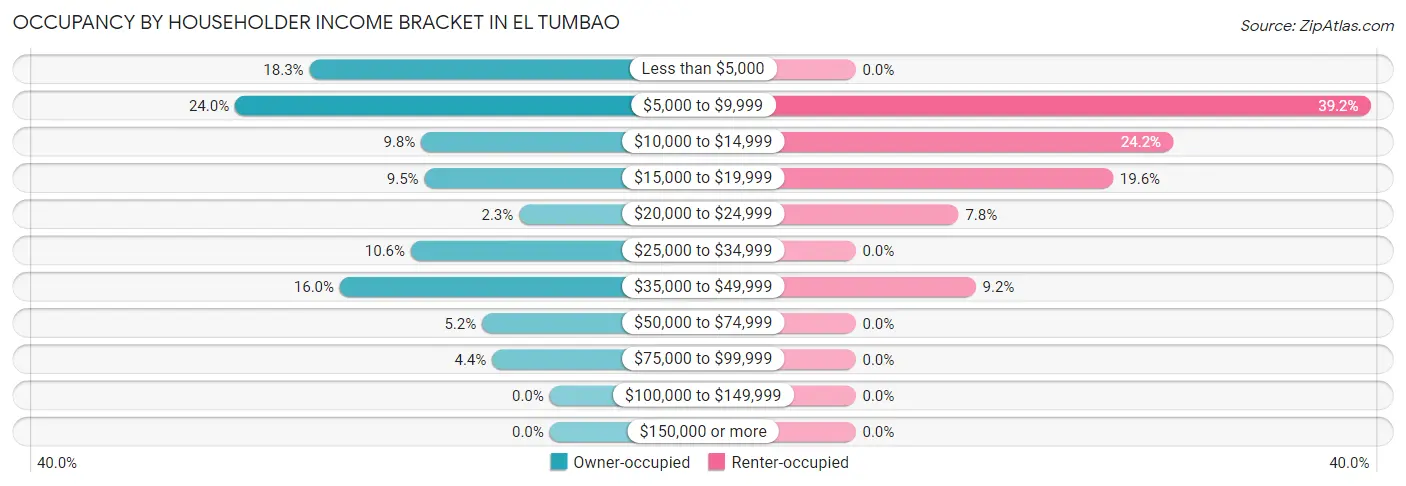
| Income Bracket | Owner-occupied | Renter-occupied |
| Less than $5,000 | 71 (18.3%) | 0 (0.0%) |
| $5,000 to $9,999 | 93 (24.0%) | 60 (39.2%) |
| $10,000 to $14,999 | 38 (9.8%) | 37 (24.2%) |
| $15,000 to $19,999 | 37 (9.5%) | 30 (19.6%) |
| $20,000 to $24,999 | 9 (2.3%) | 12 (7.8%) |
| $25,000 to $34,999 | 41 (10.6%) | 0 (0.0%) |
| $35,000 to $49,999 | 62 (16.0%) | 14 (9.1%) |
| $50,000 to $74,999 | 20 (5.1%) | 0 (0.0%) |
| $75,000 to $99,999 | 17 (4.4%) | 0 (0.0%) |
| $100,000 to $149,999 | 0 (0.0%) | 0 (0.0%) |
| $150,000 or more | 0 (0.0%) | 0 (0.0%) |
| Total | 388 (100.0%) | 153 (100.0%) |
Monthly Housing Cost Tiers in El Tumbao
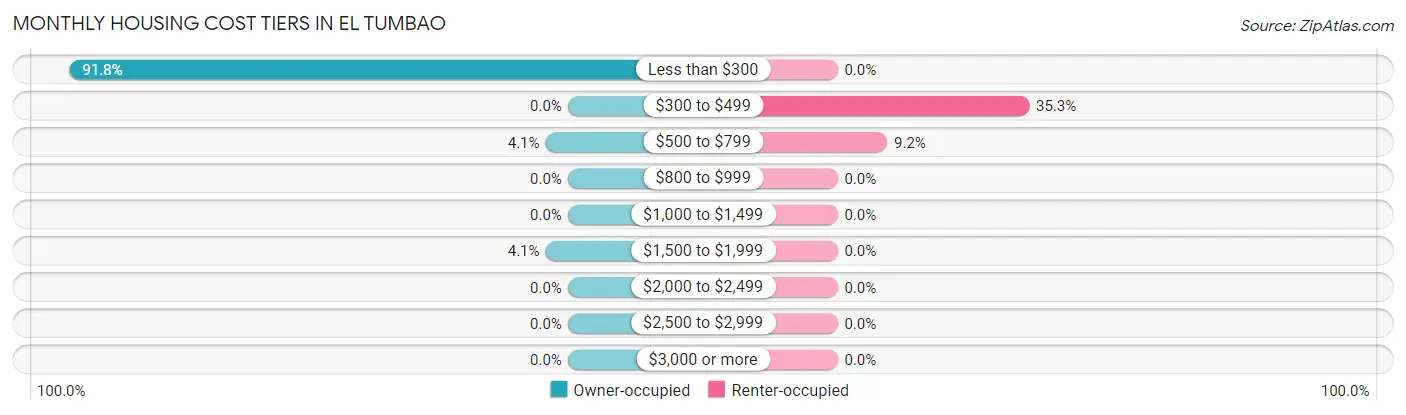
| Monthly Cost | Owner-occupied | Renter-occupied |
| Less than $300 | 356 (91.7%) | 0 (0.0%) |
| $300 to $499 | 0 (0.0%) | 54 (35.3%) |
| $500 to $799 | 16 (4.1%) | 14 (9.1%) |
| $800 to $999 | 0 (0.0%) | 0 (0.0%) |
| $1,000 to $1,499 | 0 (0.0%) | 0 (0.0%) |
| $1,500 to $1,999 | 16 (4.1%) | 0 (0.0%) |
| $2,000 to $2,499 | 0 (0.0%) | 0 (0.0%) |
| $2,500 to $2,999 | 0 (0.0%) | 0 (0.0%) |
| $3,000 or more | 0 (0.0%) | 0 (0.0%) |
| Total | 388 (100.0%) | 153 (100.0%) |
Physical Housing Characteristics in El Tumbao
Housing Structures in El Tumbao
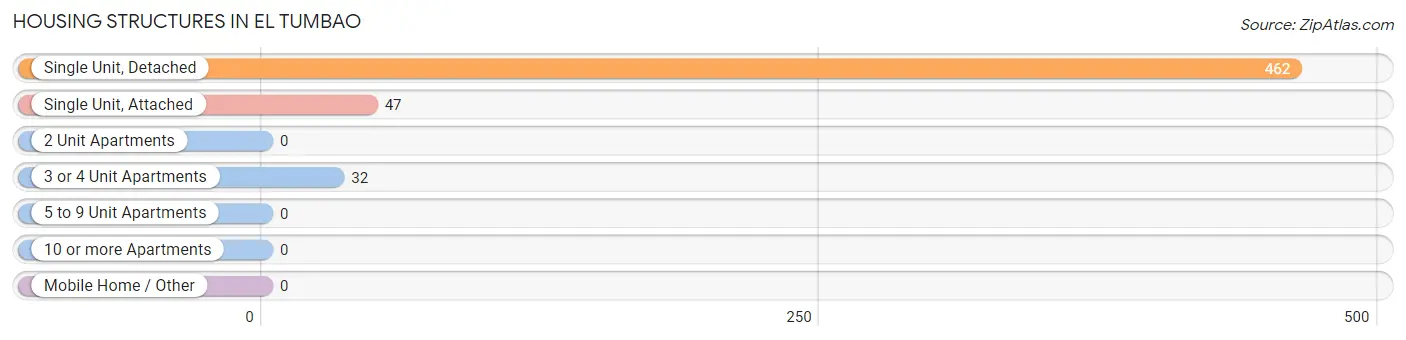
| Structure Type | # Housing Units | % Housing Units |
| Single Unit, Detached | 462 | 85.4% |
| Single Unit, Attached | 47 | 8.7% |
| 2 Unit Apartments | 0 | 0.0% |
| 3 or 4 Unit Apartments | 32 | 5.9% |
| 5 to 9 Unit Apartments | 0 | 0.0% |
| 10 or more Apartments | 0 | 0.0% |
| Mobile Home / Other | 0 | 0.0% |
| Total | 541 | 100.0% |
Housing Structures by Occupancy in El Tumbao
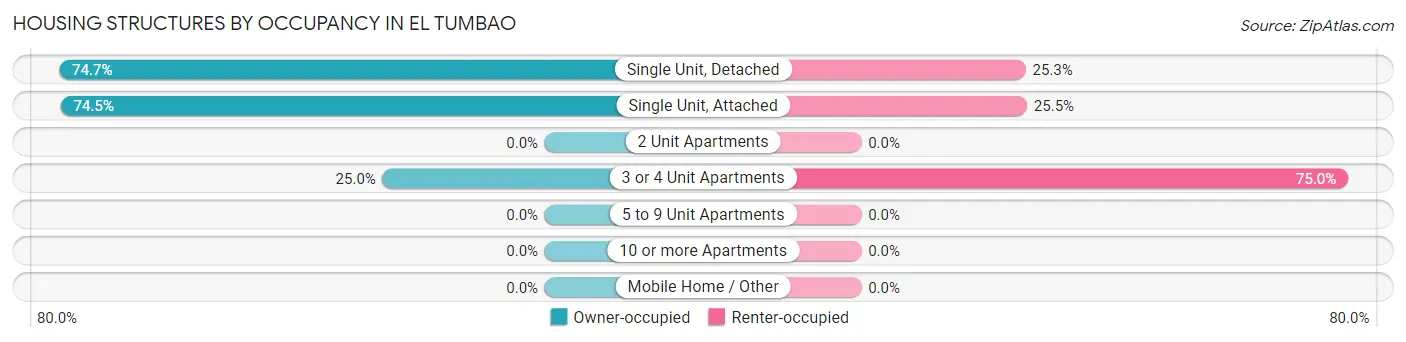
| Structure Type | Owner-occupied | Renter-occupied |
| Single Unit, Detached | 345 (74.7%) | 117 (25.3%) |
| Single Unit, Attached | 35 (74.5%) | 12 (25.5%) |
| 2 Unit Apartments | 0 (0.0%) | 0 (0.0%) |
| 3 or 4 Unit Apartments | 8 (25.0%) | 24 (75.0%) |
| 5 to 9 Unit Apartments | 0 (0.0%) | 0 (0.0%) |
| 10 or more Apartments | 0 (0.0%) | 0 (0.0%) |
| Mobile Home / Other | 0 (0.0%) | 0 (0.0%) |
| Total | 388 (71.7%) | 153 (28.3%) |
Housing Structures by Number of Rooms in El Tumbao
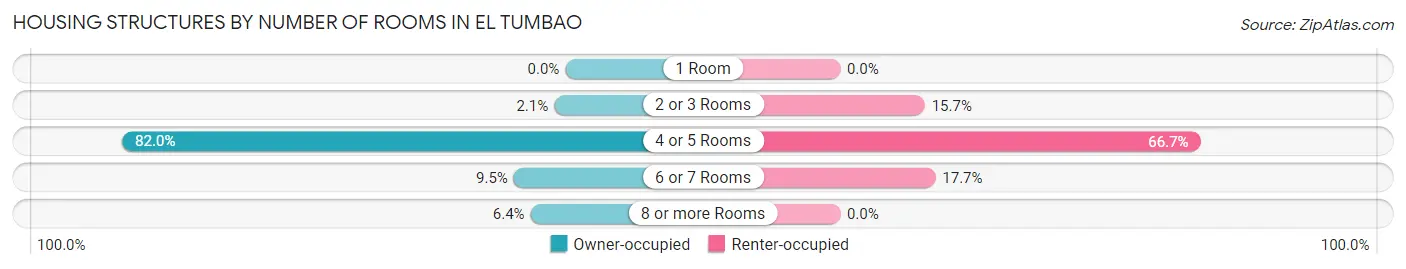
| Number of Rooms | Owner-occupied | Renter-occupied |
| 1 Room | 0 (0.0%) | 0 (0.0%) |
| 2 or 3 Rooms | 8 (2.1%) | 24 (15.7%) |
| 4 or 5 Rooms | 318 (82.0%) | 102 (66.7%) |
| 6 or 7 Rooms | 37 (9.5%) | 27 (17.6%) |
| 8 or more Rooms | 25 (6.4%) | 0 (0.0%) |
| Total | 388 (100.0%) | 153 (100.0%) |
Housing Structure by Heating Type in El Tumbao
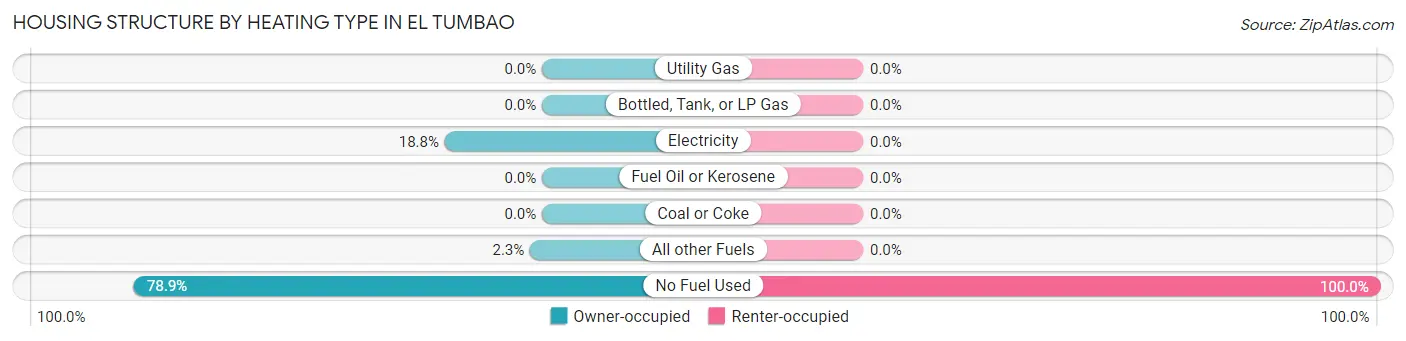
| Heating Type | Owner-occupied | Renter-occupied |
| Utility Gas | 0 (0.0%) | 0 (0.0%) |
| Bottled, Tank, or LP Gas | 0 (0.0%) | 0 (0.0%) |
| Electricity | 73 (18.8%) | 0 (0.0%) |
| Fuel Oil or Kerosene | 0 (0.0%) | 0 (0.0%) |
| Coal or Coke | 0 (0.0%) | 0 (0.0%) |
| All other Fuels | 9 (2.3%) | 0 (0.0%) |
| No Fuel Used | 306 (78.9%) | 153 (100.0%) |
| Total | 388 (100.0%) | 153 (100.0%) |
Household Vehicle Usage in El Tumbao
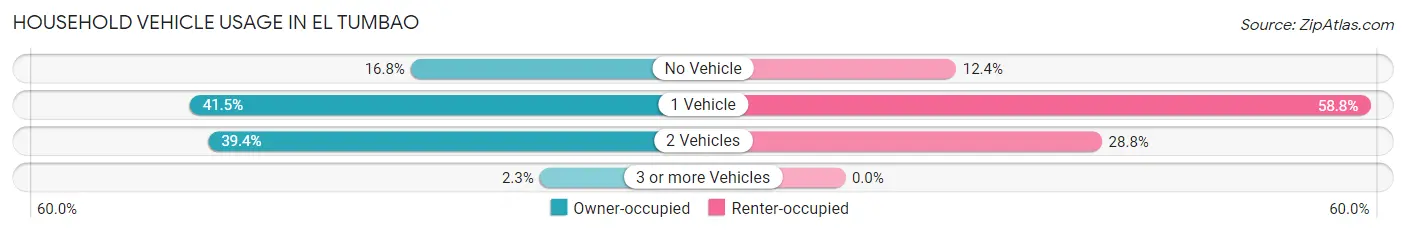
| Vehicles per Household | Owner-occupied | Renter-occupied |
| No Vehicle | 65 (16.8%) | 19 (12.4%) |
| 1 Vehicle | 161 (41.5%) | 90 (58.8%) |
| 2 Vehicles | 153 (39.4%) | 44 (28.8%) |
| 3 or more Vehicles | 9 (2.3%) | 0 (0.0%) |
| Total | 388 (100.0%) | 153 (100.0%) |
Real Estate & Mortgages in El Tumbao
Real Estate and Mortgage Overview in El Tumbao
| Characteristic | Without Mortgage | With Mortgage |
| Housing Units | 364 | 24 |
| Median Property Value | $77,400 | $0 |
| Median Household Income | $13,684 | $0 |
| Monthly Housing Costs | $135 | $0 |
| Real Estate Taxes | - | - |
Property Value by Mortgage Status in El Tumbao
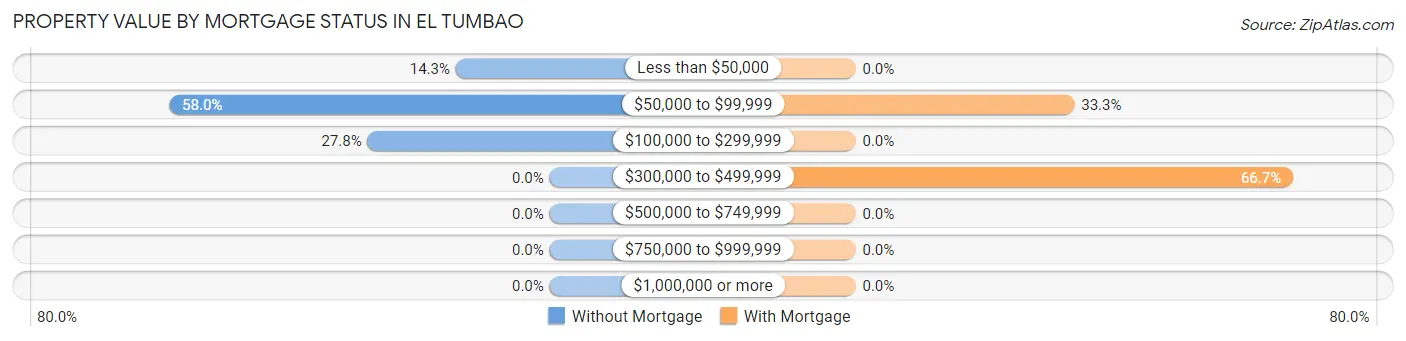
| Property Value | Without Mortgage | With Mortgage |
| Less than $50,000 | 52 (14.3%) | 0 (0.0%) |
| $50,000 to $99,999 | 211 (58.0%) | 8 (33.3%) |
| $100,000 to $299,999 | 101 (27.8%) | 0 (0.0%) |
| $300,000 to $499,999 | 0 (0.0%) | 16 (66.7%) |
| $500,000 to $749,999 | 0 (0.0%) | 0 (0.0%) |
| $750,000 to $999,999 | 0 (0.0%) | 0 (0.0%) |
| $1,000,000 or more | 0 (0.0%) | 0 (0.0%) |
| Total | 364 (100.0%) | 24 (100.0%) |
Household Income by Mortgage Status in El Tumbao
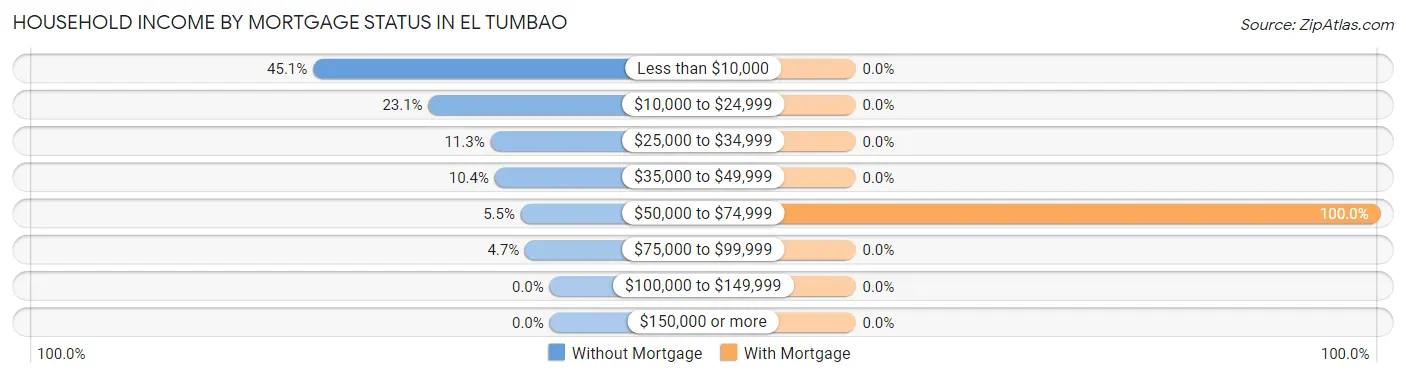
| Household Income | Without Mortgage | With Mortgage |
| Less than $10,000 | 164 (45.1%) | 0 (0.0%) |
| $10,000 to $24,999 | 84 (23.1%) | 0 (0.0%) |
| $25,000 to $34,999 | 41 (11.3%) | 0 (0.0%) |
| $35,000 to $49,999 | 38 (10.4%) | 0 (0.0%) |
| $50,000 to $74,999 | 20 (5.5%) | 24 (100.0%) |
| $75,000 to $99,999 | 17 (4.7%) | 0 (0.0%) |
| $100,000 to $149,999 | 0 (0.0%) | 0 (0.0%) |
| $150,000 or more | 0 (0.0%) | 0 (0.0%) |
| Total | 364 (100.0%) | 24 (100.0%) |
Property Value to Household Income Ratio in El Tumbao
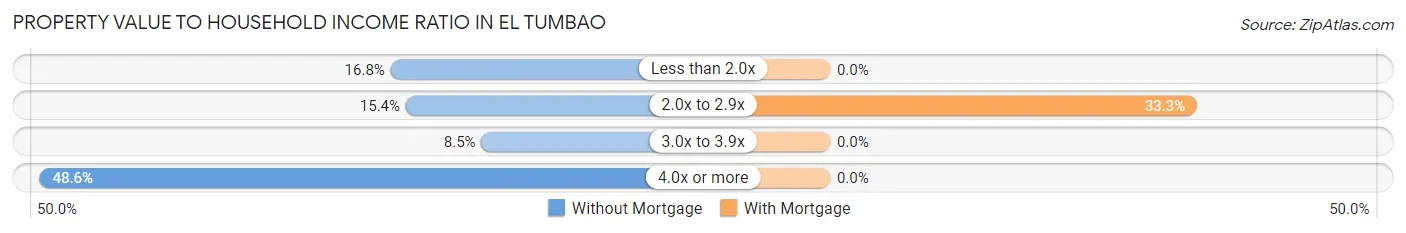
| Value-to-Income Ratio | Without Mortgage | With Mortgage |
| Less than 2.0x | 61 (16.8%) | 0 (0.0%) |
| 2.0x to 2.9x | 56 (15.4%) | 8 (33.3%) |
| 3.0x to 3.9x | 31 (8.5%) | 0 (0.0%) |
| 4.0x or more | 177 (48.6%) | 0 (0.0%) |
| Total | 364 (100.0%) | 24 (100.0%) |
Real Estate Taxes by Mortgage Status in El Tumbao
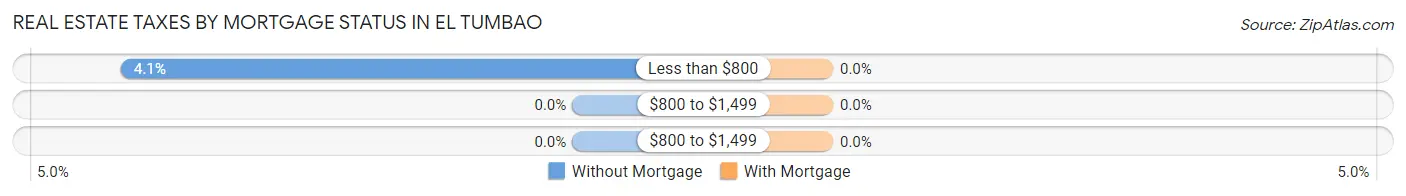
| Property Taxes | Without Mortgage | With Mortgage |
| Less than $800 | 15 (4.1%) | 0 (0.0%) |
| $800 to $1,499 | 0 (0.0%) | 0 (0.0%) |
| $800 to $1,499 | 0 (0.0%) | 0 (0.0%) |
| Total | 364 (100.0%) | 24 (100.0%) |
Health & Disability in El Tumbao
Health Insurance Coverage by Age in El Tumbao
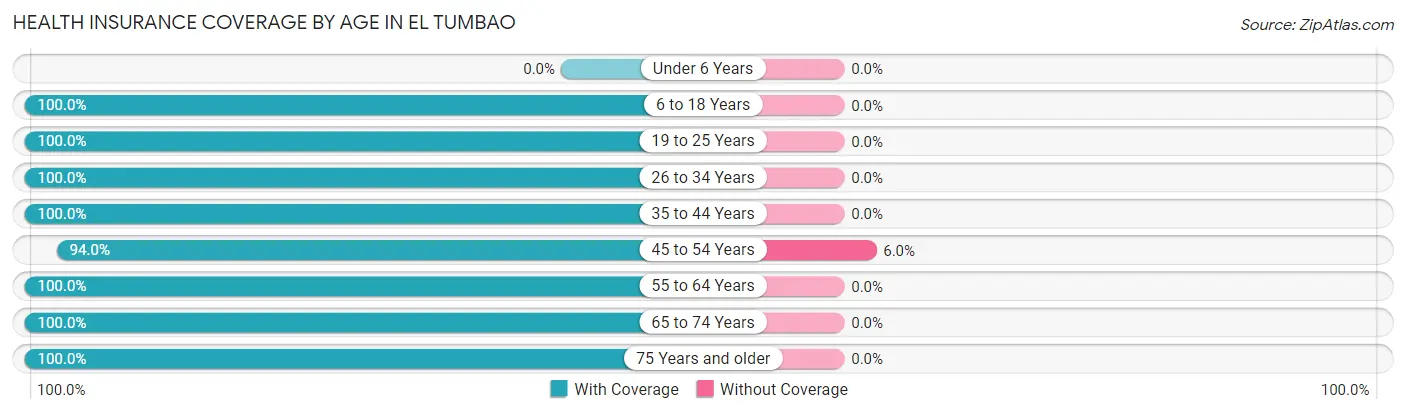
| Age Bracket | With Coverage | Without Coverage |
| Under 6 Years | 0 (0.0%) | 0 (0.0%) |
| 6 to 18 Years | 262 (100.0%) | 0 (0.0%) |
| 19 to 25 Years | 135 (100.0%) | 0 (0.0%) |
| 26 to 34 Years | 81 (100.0%) | 0 (0.0%) |
| 35 to 44 Years | 135 (100.0%) | 0 (0.0%) |
| 45 to 54 Years | 221 (94.0%) | 14 (6.0%) |
| 55 to 64 Years | 158 (100.0%) | 0 (0.0%) |
| 65 to 74 Years | 150 (100.0%) | 0 (0.0%) |
| 75 Years and older | 117 (100.0%) | 0 (0.0%) |
| Total | 1,259 (98.9%) | 14 (1.1%) |
Health Insurance Coverage by Citizenship Status in El Tumbao

| Citizenship Status | With Coverage | Without Coverage |
| Native Born | 0 (0.0%) | 0 (0.0%) |
| Foreign Born, Citizen | 262 (100.0%) | 0 (0.0%) |
| Foreign Born, not a Citizen | 135 (100.0%) | 0 (0.0%) |
Health Insurance Coverage by Household Income in El Tumbao
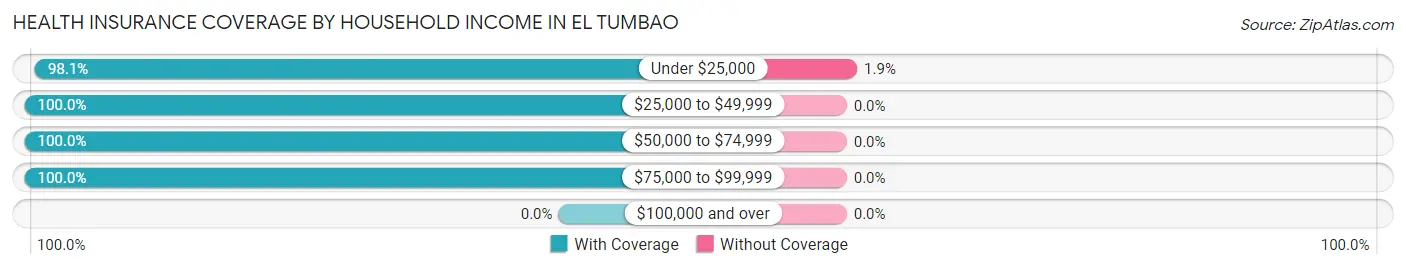
| Household Income | With Coverage | Without Coverage |
| Under $25,000 | 707 (98.1%) | 14 (1.9%) |
| $25,000 to $49,999 | 439 (100.0%) | 0 (0.0%) |
| $50,000 to $74,999 | 33 (100.0%) | 0 (0.0%) |
| $75,000 to $99,999 | 80 (100.0%) | 0 (0.0%) |
| $100,000 and over | 0 (0.0%) | 0 (0.0%) |
Public vs Private Health Insurance Coverage by Age in El Tumbao
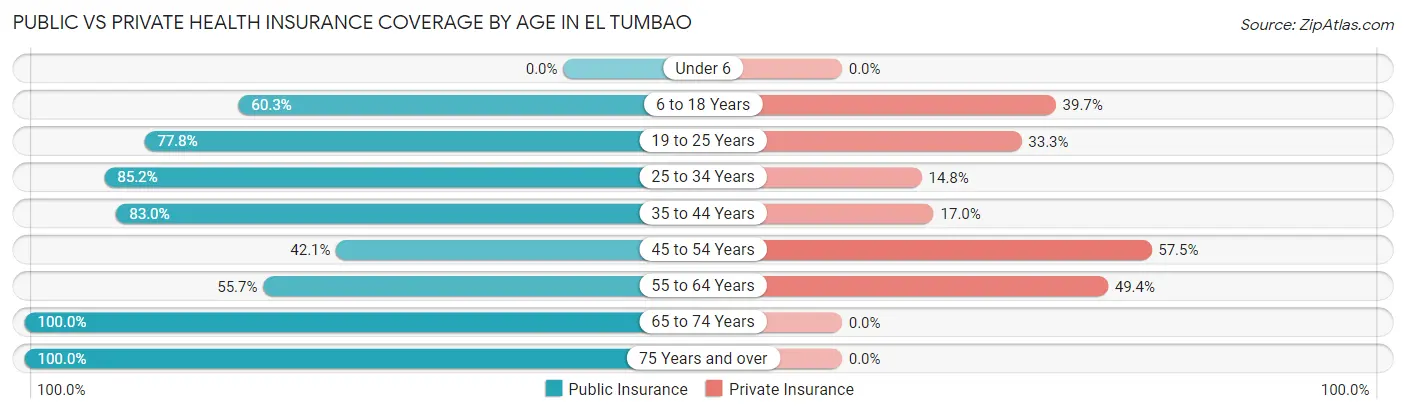
| Age Bracket | Public Insurance | Private Insurance |
| Under 6 | 0 (0.0%) | 0 (0.0%) |
| 6 to 18 Years | 158 (60.3%) | 104 (39.7%) |
| 19 to 25 Years | 105 (77.8%) | 45 (33.3%) |
| 25 to 34 Years | 69 (85.2%) | 12 (14.8%) |
| 35 to 44 Years | 112 (83.0%) | 23 (17.0%) |
| 45 to 54 Years | 99 (42.1%) | 135 (57.5%) |
| 55 to 64 Years | 88 (55.7%) | 78 (49.4%) |
| 65 to 74 Years | 150 (100.0%) | 0 (0.0%) |
| 75 Years and over | 117 (100.0%) | 0 (0.0%) |
| Total | 898 (70.5%) | 397 (31.2%) |
Disability Status by Sex by Age in El Tumbao
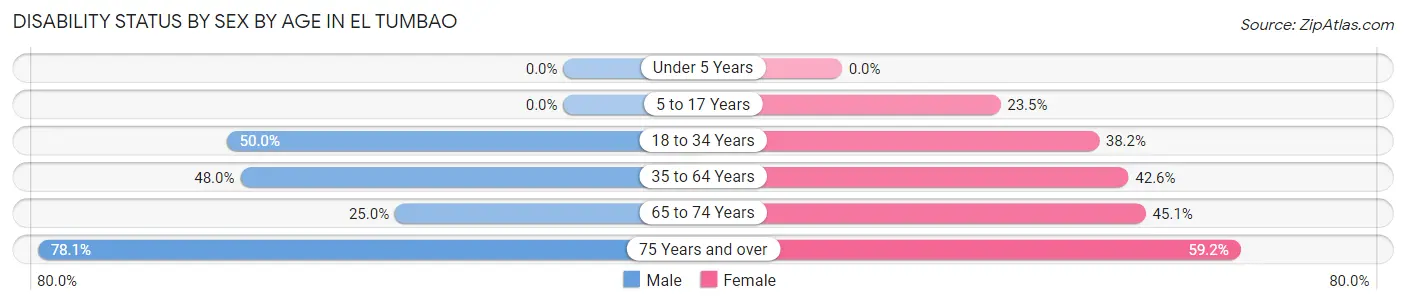
| Age Bracket | Male | Female |
| Under 5 Years | 0 (0.0%) | 0 (0.0%) |
| 5 to 17 Years | 0 (0.0%) | 16 (23.5%) |
| 18 to 34 Years | 31 (50.0%) | 79 (38.2%) |
| 35 to 64 Years | 118 (48.0%) | 120 (42.5%) |
| 65 to 74 Years | 17 (25.0%) | 37 (45.1%) |
| 75 Years and over | 32 (78.0%) | 45 (59.2%) |
Disability Class by Sex by Age in El Tumbao
Disability Class: Hearing Difficulty
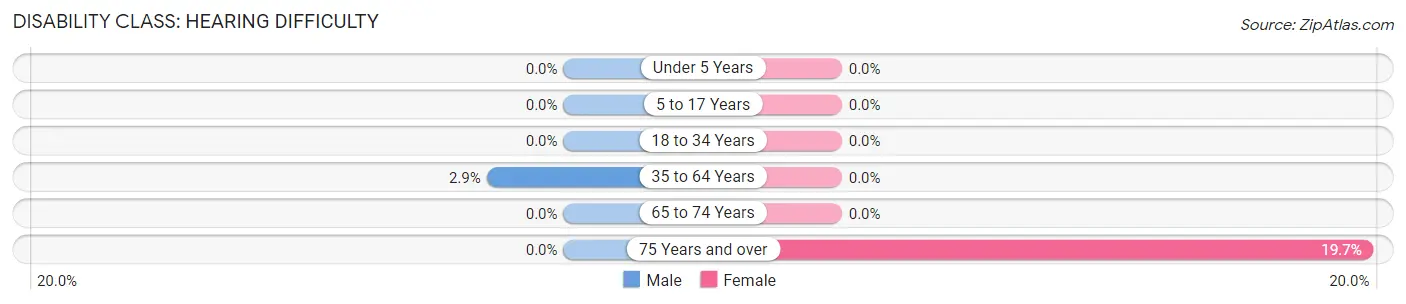
| Age Bracket | Male | Female |
| Under 5 Years | 0 (0.0%) | 0 (0.0%) |
| 5 to 17 Years | 0 (0.0%) | 0 (0.0%) |
| 18 to 34 Years | 0 (0.0%) | 0 (0.0%) |
| 35 to 64 Years | 7 (2.9%) | 0 (0.0%) |
| 65 to 74 Years | 0 (0.0%) | 0 (0.0%) |
| 75 Years and over | 0 (0.0%) | 15 (19.7%) |
Disability Class: Vision Difficulty
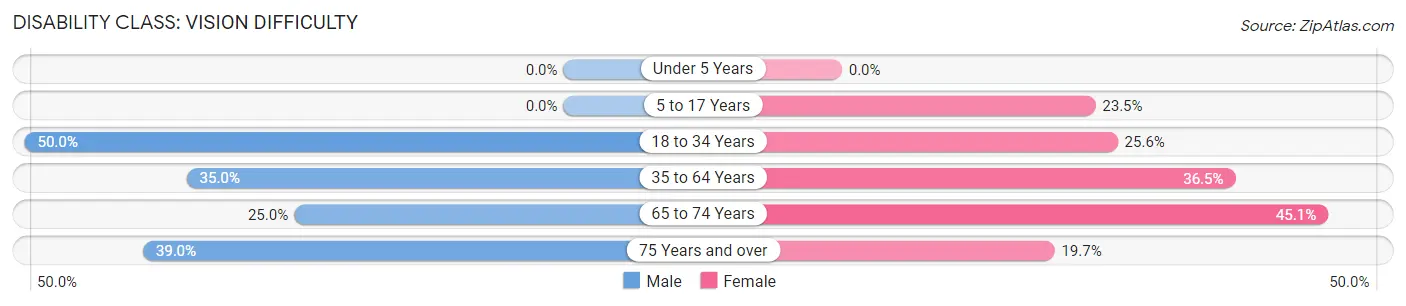
| Age Bracket | Male | Female |
| Under 5 Years | 0 (0.0%) | 0 (0.0%) |
| 5 to 17 Years | 0 (0.0%) | 16 (23.5%) |
| 18 to 34 Years | 31 (50.0%) | 53 (25.6%) |
| 35 to 64 Years | 86 (35.0%) | 103 (36.5%) |
| 65 to 74 Years | 17 (25.0%) | 37 (45.1%) |
| 75 Years and over | 16 (39.0%) | 15 (19.7%) |
Disability Class: Cognitive Difficulty
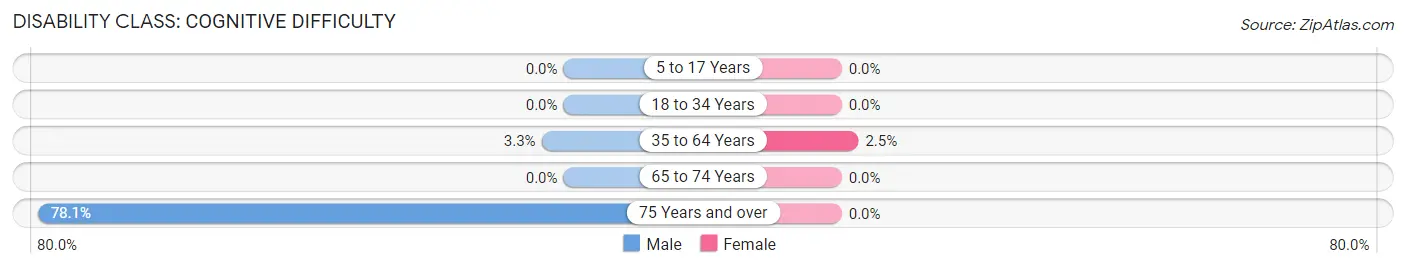
| Age Bracket | Male | Female |
| 5 to 17 Years | 0 (0.0%) | 0 (0.0%) |
| 18 to 34 Years | 0 (0.0%) | 0 (0.0%) |
| 35 to 64 Years | 8 (3.3%) | 7 (2.5%) |
| 65 to 74 Years | 0 (0.0%) | 0 (0.0%) |
| 75 Years and over | 32 (78.0%) | 0 (0.0%) |
Disability Class: Ambulatory Difficulty
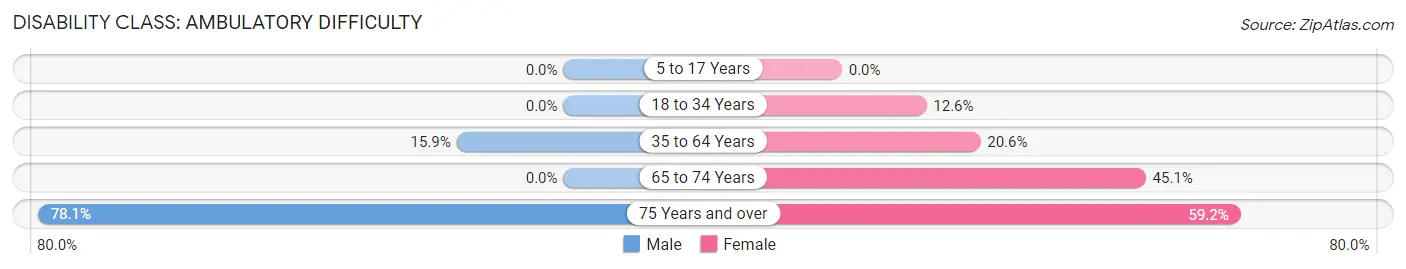
| Age Bracket | Male | Female |
| 5 to 17 Years | 0 (0.0%) | 0 (0.0%) |
| 18 to 34 Years | 0 (0.0%) | 26 (12.6%) |
| 35 to 64 Years | 39 (15.9%) | 58 (20.6%) |
| 65 to 74 Years | 0 (0.0%) | 37 (45.1%) |
| 75 Years and over | 32 (78.0%) | 45 (59.2%) |
Disability Class: Self-Care Difficulty
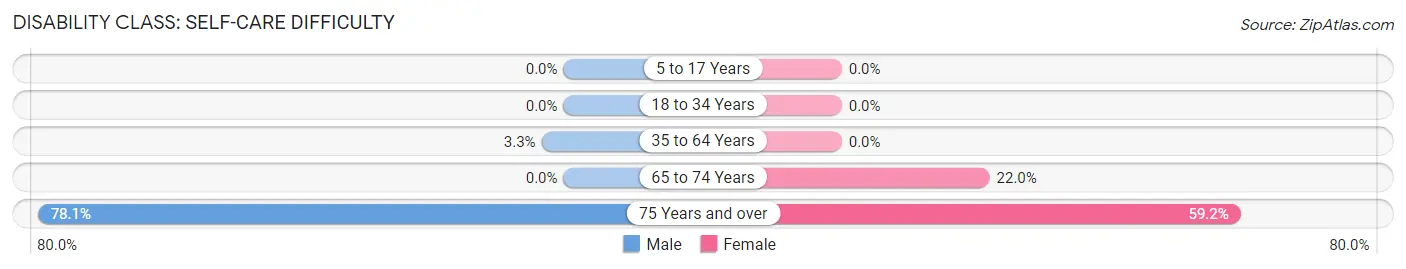
| Age Bracket | Male | Female |
| 5 to 17 Years | 0 (0.0%) | 0 (0.0%) |
| 18 to 34 Years | 0 (0.0%) | 0 (0.0%) |
| 35 to 64 Years | 8 (3.3%) | 0 (0.0%) |
| 65 to 74 Years | 0 (0.0%) | 18 (22.0%) |
| 75 Years and over | 32 (78.0%) | 45 (59.2%) |
Technology Access in El Tumbao
Computing Device Access in El Tumbao
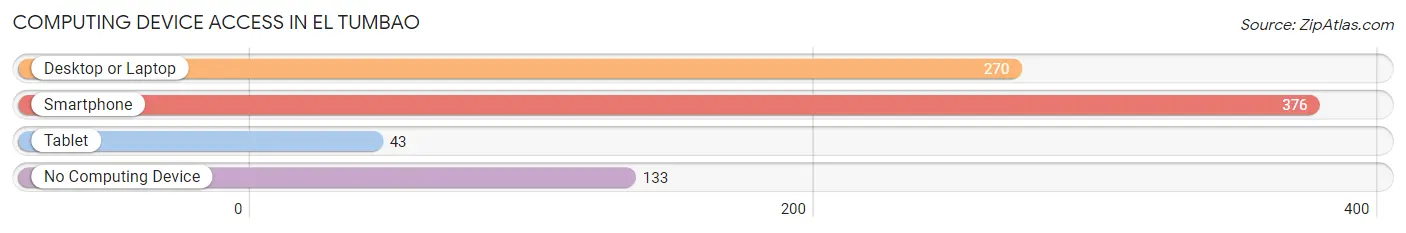
| Device Type | # Households | % Households |
| Desktop or Laptop | 270 | 49.9% |
| Smartphone | 376 | 69.5% |
| Tablet | 43 | 8.0% |
| No Computing Device | 133 | 24.6% |
| Total | 541 | 100.0% |
Internet Access in El Tumbao
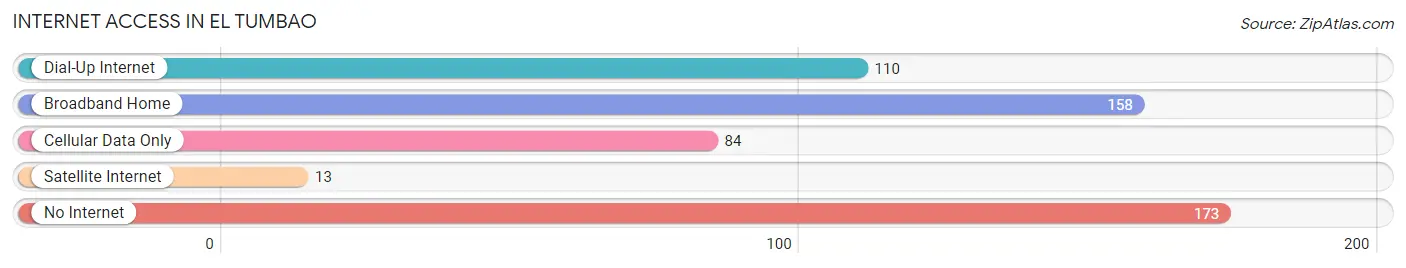
| Internet Type | # Households | % Households |
| Dial-Up Internet | 110 | 20.3% |
| Broadband Home | 158 | 29.2% |
| Cellular Data Only | 84 | 15.5% |
| Satellite Internet | 13 | 2.4% |
| No Internet | 173 | 32.0% |
| Total | 541 | 100.0% |
El Tumbao Summary
El Tumbao is a small municipality located in the northern region of Puerto Rico. It is part of the San Juan-Caguas-Guaynabo Metropolitan Statistical Area. The municipality is bordered by the municipalities of Toa Alta, Toa Baja, Bayamón, and Cataño. El Tumbao has a population of approximately 8,000 people and covers an area of 4.2 square miles.
Geography
El Tumbao is located in the northern region of Puerto Rico, in the San Juan-Caguas-Guaynabo Metropolitan Statistical Area. It is bordered by the municipalities of Toa Alta, Toa Baja, Bayamón, and Cataño. The municipality is located in the northern part of the island, and is situated between the municipalities of Toa Alta and Toa Baja. The terrain is mostly flat, with some hills in the northern part of the municipality. The highest point in El Tumbao is Cerro El Tumbao, which is located in the northern part of the municipality and has an elevation of 1,000 feet.
The climate in El Tumbao is tropical, with temperatures ranging from the mid-70s to the mid-80s Fahrenheit. The average annual precipitation is approximately 50 inches.
Economy
The economy of El Tumbao is largely based on agriculture and tourism. The municipality is home to several farms, which produce a variety of fruits and vegetables, including bananas, plantains, oranges, and avocados. The municipality also has several small businesses, including restaurants, bars, and shops.
Tourism is an important part of the economy of El Tumbao. The municipality is home to several beaches, including Playa El Tumbao, Playa La Piedra, and Playa El Faro. These beaches attract visitors from all over Puerto Rico and the Caribbean. The municipality also has several parks, including Parque El Tumbao and Parque La Piedra.
Demographics
As of the 2010 census, El Tumbao had a population of 8,000 people. The population is predominantly of Puerto Rican descent, with a small percentage of people of other ethnic backgrounds. The median age in El Tumbao is 33 years old, and the median household income is $20,000.
Education
El Tumbao is served by the Puerto Rico Department of Education. The municipality has several public schools, including Escuela Primaria El Tumbao, Escuela Secundaria El Tumbao, and Escuela Superior El Tumbao. The municipality also has several private schools, including Colegio San Juan Bautista and Colegio San Antonio.
Conclusion
El Tumbao is a small municipality located in the northern region of Puerto Rico. It is part of the San Juan-Caguas-Guaynabo Metropolitan Statistical Area and is bordered by the municipalities of Toa Alta, Toa Baja, Bayamón, and Cataño. The municipality has a population of approximately 8,000 people and covers an area of 4.2 square miles. The economy of El Tumbao is largely based on agriculture and tourism, and the population is predominantly of Puerto Rican descent. The municipality is served by the Puerto Rico Department of Education and has several public and private schools.
Common Questions
What is Per Capita Income in El Tumbao?
Per Capita income in El Tumbao is $8,638.
What is the Median Family Income in El Tumbao?
Median Family Income in El Tumbao is $16,691.
What is the Median Household income in El Tumbao?
Median Household Income in El Tumbao is $14,050.
What is Income or Wage Gap in El Tumbao?
Income or Wage Gap in El Tumbao is 7.7%.
Women in El Tumbao earn 92.3 cents for every dollar earned by a man.
What is Inequality or Gini Index in El Tumbao?
Inequality or Gini Index in El Tumbao is 0.46.
What is the Total Population of El Tumbao?
Total Population of El Tumbao is 1,291.
What is the Total Male Population of El Tumbao?
Total Male Population of El Tumbao is 567.
What is the Total Female Population of El Tumbao?
Total Female Population of El Tumbao is 724.
What is the Ratio of Males per 100 Females in El Tumbao?
There are 78.31 Males per 100 Females in El Tumbao.
What is the Ratio of Females per 100 Males in El Tumbao?
There are 127.69 Females per 100 Males in El Tumbao.
What is the Median Population Age in El Tumbao?
Median Population Age in El Tumbao is 46.0 Years.
What is the Average Family Size in El Tumbao
Average Family Size in El Tumbao is 3.2 People.
What is the Average Household Size in El Tumbao
Average Household Size in El Tumbao is 2.4 People.
How Large is the Labor Force in El Tumbao?
There are 425 People in the Labor Forcein in El Tumbao.
What is the Percentage of People in the Labor Force in El Tumbao?
38.1% of People are in the Labor Force in El Tumbao.
What is the Unemployment Rate in El Tumbao?
Unemployment Rate in El Tumbao is 18.6%.