Palmer, PR Map & Demographics
Palmer Map
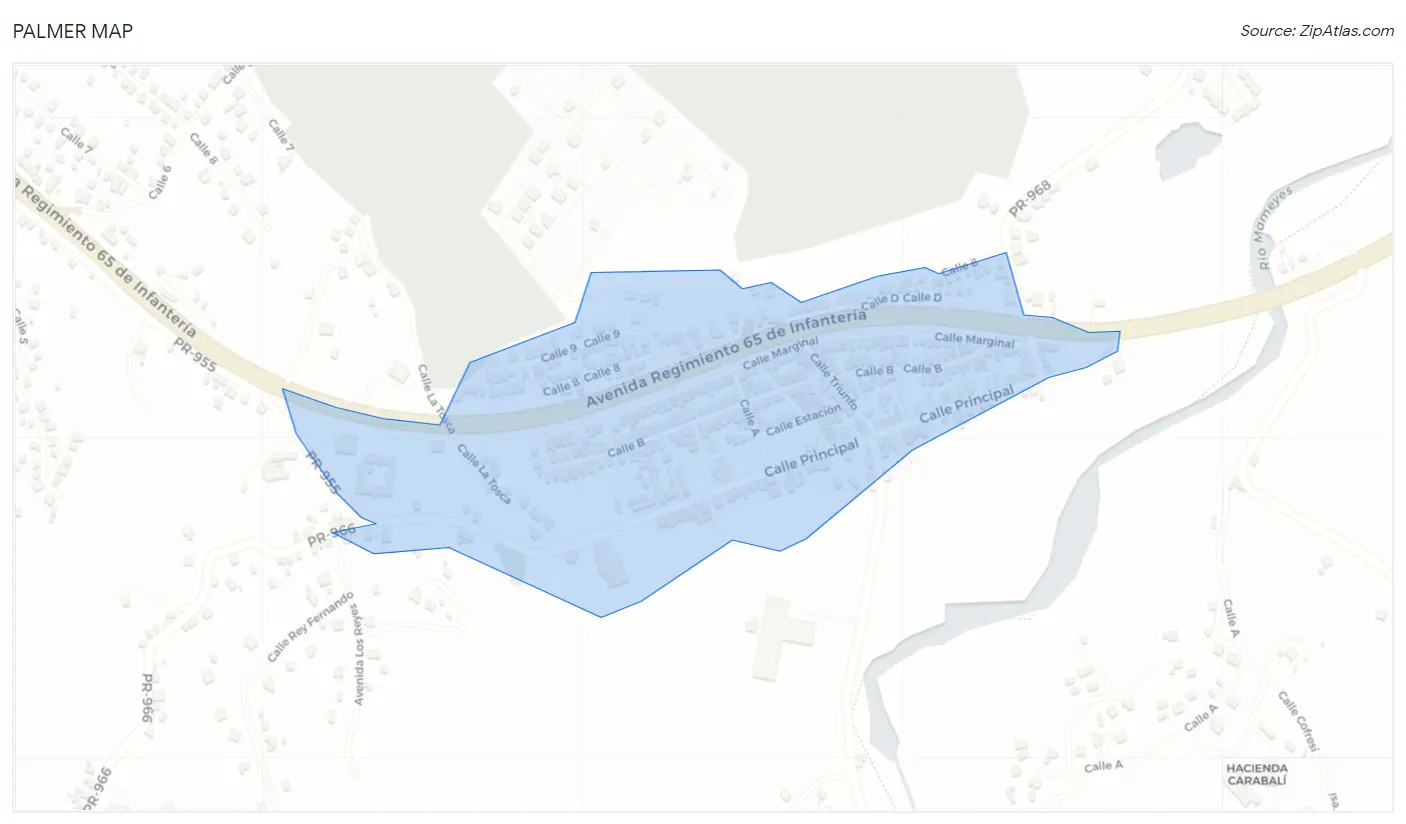
Palmer Overview
$11,111
PER CAPITA INCOME
0.52
INEQUALITY / GINI INDEX
1,475
TOTAL POPULATION
545
MALE POPULATION
930
FEMALE POPULATION
58.60
MALES / 100 FEMALES
170.64
FEMALES / 100 MALES
44.4
MEDIAN AGE
4.3
AVG FAMILY SIZE
3.8
AVG HOUSEHOLD SIZE
766
LABOR FORCE [ PEOPLE ]
60.0%
PERCENT IN LABOR FORCE
25.5%
UNEMPLOYMENT RATE
Income in Palmer
Income Overview in Palmer
| Characteristic | Number | Measure |
| Per Capita Income | 1,475 | $11,111 |
| Median Family Income | 315 | $0 |
| Mean Family Income | 315 | $32,489 |
| Median Household Income | 386 | $0 |
| Mean Household Income | 386 | $29,404 |
| Income Deficit | 315 | $0 |
| Wage / Income Gap (%) | 1,475 | 0.00% |
| Wage / Income Gap ($) | 1,475 | 100.00¢ per $1 |
| Gini / Inequality Index | 1,475 | 0.52 |
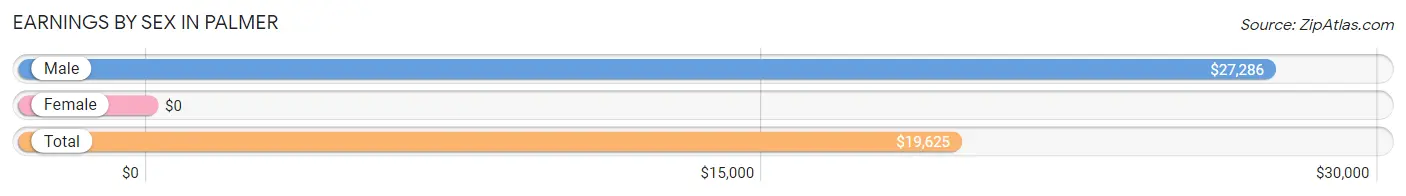
Earnings by Sex in Palmer
| Sex | Number | Average Earnings |
| Male | 303 (47.8%) | $27,286 |
| Female | 331 (52.2%) | $0 |
| Total | 634 (100.0%) | $19,625 |
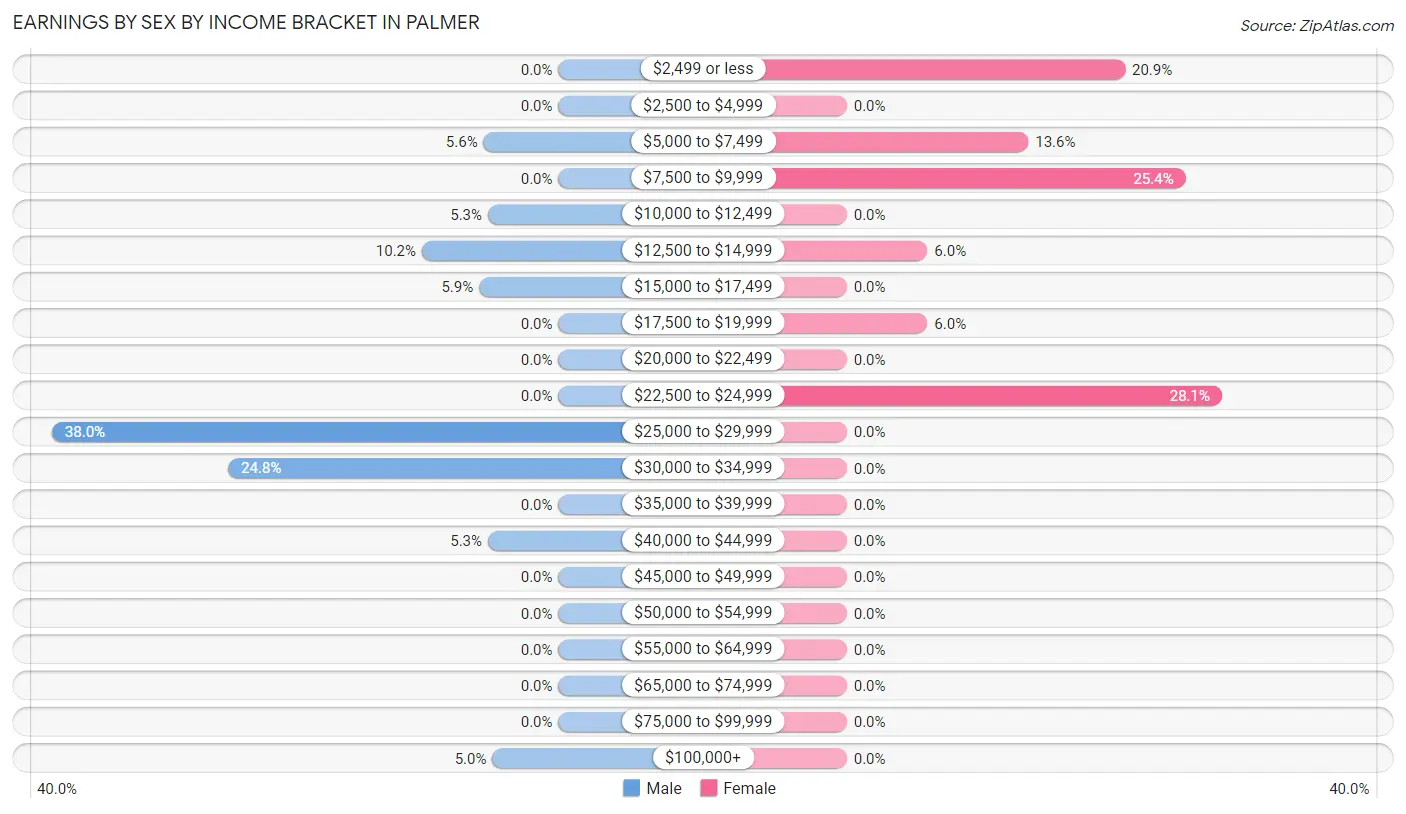
Earnings by Sex by Income Bracket in Palmer
The most common earnings brackets in Palmer are $25,000 to $29,999 for men (115 | 38.0%) and $22,500 to $24,999 for women (93 | 28.1%).
| Income | Male | Female |
| $2,499 or less | 0 (0.0%) | 69 (20.8%) |
| $2,500 to $4,999 | 0 (0.0%) | 0 (0.0%) |
| $5,000 to $7,499 | 17 (5.6%) | 45 (13.6%) |
| $7,500 to $9,999 | 0 (0.0%) | 84 (25.4%) |
| $10,000 to $12,499 | 16 (5.3%) | 0 (0.0%) |
| $12,500 to $14,999 | 31 (10.2%) | 20 (6.0%) |
| $15,000 to $17,499 | 18 (5.9%) | 0 (0.0%) |
| $17,500 to $19,999 | 0 (0.0%) | 20 (6.0%) |
| $20,000 to $22,499 | 0 (0.0%) | 0 (0.0%) |
| $22,500 to $24,999 | 0 (0.0%) | 93 (28.1%) |
| $25,000 to $29,999 | 115 (38.0%) | 0 (0.0%) |
| $30,000 to $34,999 | 75 (24.7%) | 0 (0.0%) |
| $35,000 to $39,999 | 0 (0.0%) | 0 (0.0%) |
| $40,000 to $44,999 | 16 (5.3%) | 0 (0.0%) |
| $45,000 to $49,999 | 0 (0.0%) | 0 (0.0%) |
| $50,000 to $54,999 | 0 (0.0%) | 0 (0.0%) |
| $55,000 to $64,999 | 0 (0.0%) | 0 (0.0%) |
| $65,000 to $74,999 | 0 (0.0%) | 0 (0.0%) |
| $75,000 to $99,999 | 0 (0.0%) | 0 (0.0%) |
| $100,000+ | 15 (5.0%) | 0 (0.0%) |
| Total | 303 (100.0%) | 331 (100.0%) |
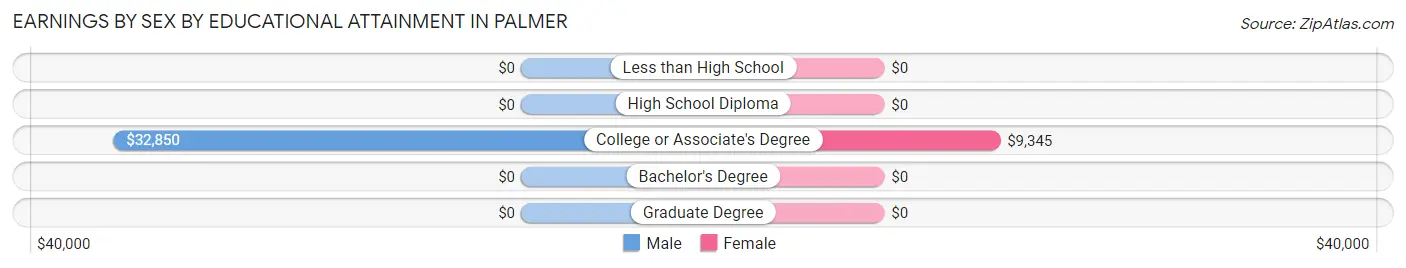
Earnings by Sex by Educational Attainment in Palmer
| Educational Attainment | Male Income | Female Income |
| Less than High School | - | - |
| High School Diploma | - | - |
| College or Associate's Degree | $32,850 | $9,345 |
| Bachelor's Degree | - | - |
| Graduate Degree | - | - |
| Total | $27,286 | $0 |
Family Income in Palmer
Family Income Brackets in Palmer
According to the Palmer family income data, there are 77 families falling into the less than $10,000 income range, which is the most common income bracket and makes up 24.4% of all families.
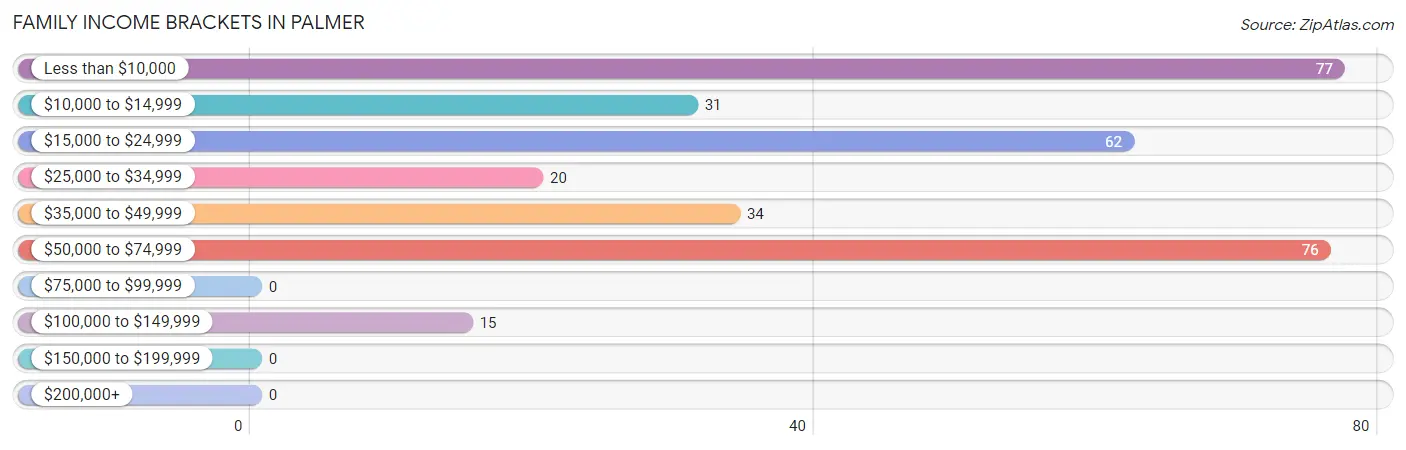
| Income Bracket | # Families | % Families |
| Less than $10,000 | 77 | 24.4% |
| $10,000 to $14,999 | 31 | 9.8% |
| $15,000 to $24,999 | 62 | 19.7% |
| $25,000 to $34,999 | 20 | 6.3% |
| $35,000 to $49,999 | 34 | 10.8% |
| $50,000 to $74,999 | 76 | 24.1% |
| $75,000 to $99,999 | 0 | 0.0% |
| $100,000 to $149,999 | 15 | 4.8% |
| $150,000 to $199,999 | 0 | 0.0% |
| $200,000+ | 0 | 0.0% |
Family Income by Famaliy Size in Palmer
3-person families (177 | 56.2%) account for the highest median family income in Palmer with $41,581 per family, while 3-person families (177 | 56.2%) have the highest median income of $13,860 per family member.
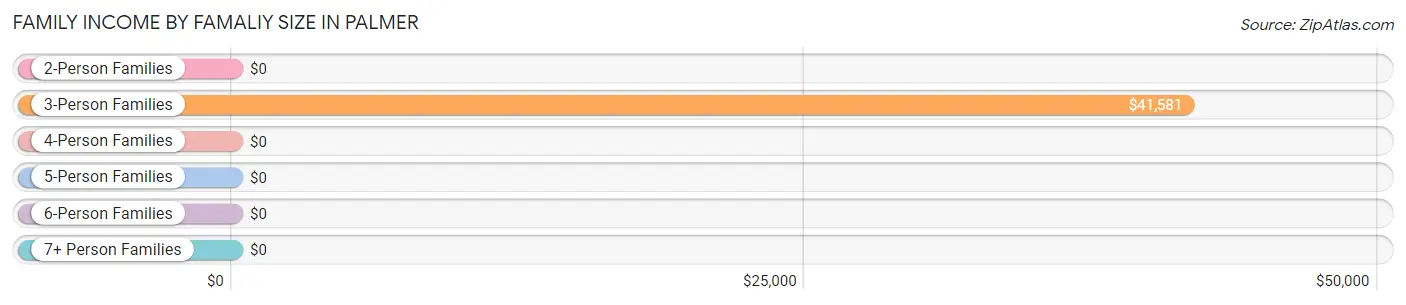
| Income Bracket | # Families | Median Income |
| 2-Person Families | 91 (28.9%) | $0 |
| 3-Person Families | 177 (56.2%) | $41,581 |
| 4-Person Families | 32 (10.2%) | $0 |
| 5-Person Families | 0 (0.0%) | $0 |
| 6-Person Families | 15 (4.8%) | $0 |
| 7+ Person Families | 0 (0.0%) | $0 |
| Total | 315 (100.0%) | $0 |
Family Income by Number of Earners in Palmer
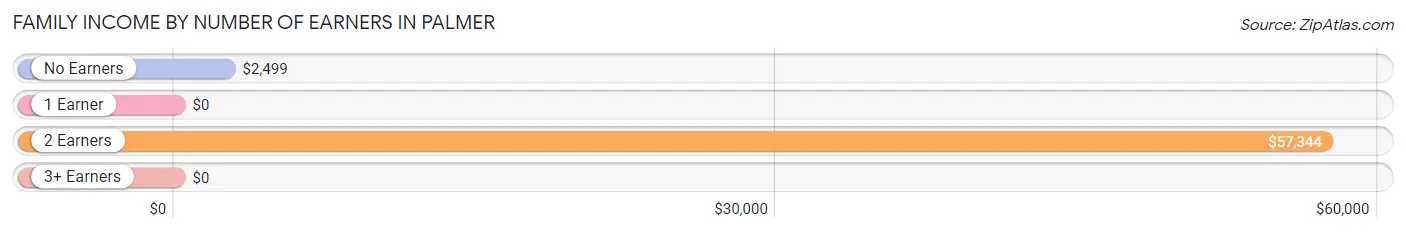
| Number of Earners | # Families | Median Income |
| No Earners | 86 (27.3%) | $2,499 |
| 1 Earner | 153 (48.6%) | $0 |
| 2 Earners | 76 (24.1%) | $57,344 |
| 3+ Earners | 0 (0.0%) | $0 |
| Total | 315 (100.0%) | $0 |
Household Income in Palmer
Household Income Brackets in Palmer
With 97 households falling in the category, the less than $10,000 income range is the most frequent in Palmer, accounting for 25.1% of all households.
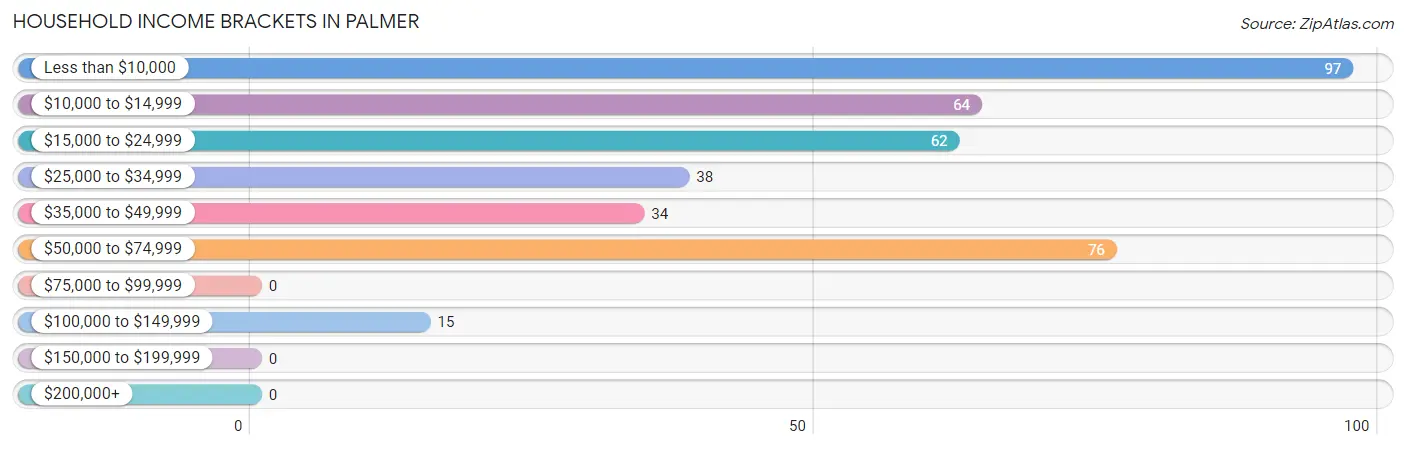
| Income Bracket | # Households | % Households |
| Less than $10,000 | 97 | 25.1% |
| $10,000 to $14,999 | 64 | 16.6% |
| $15,000 to $24,999 | 62 | 16.1% |
| $25,000 to $34,999 | 38 | 9.8% |
| $35,000 to $49,999 | 34 | 8.8% |
| $50,000 to $74,999 | 76 | 19.7% |
| $75,000 to $99,999 | 0 | 0.0% |
| $100,000 to $149,999 | 15 | 3.9% |
| $150,000 to $199,999 | 0 | 0.0% |
| $200,000+ | 0 | 0.0% |
Household Income by Householder Age in Palmer
The median household income in Palmer is $0, with the highest median household income of $34,375 found in the 65+ years age bracket for the primary householder. A total of 228 households (59.1%) fall into this category.
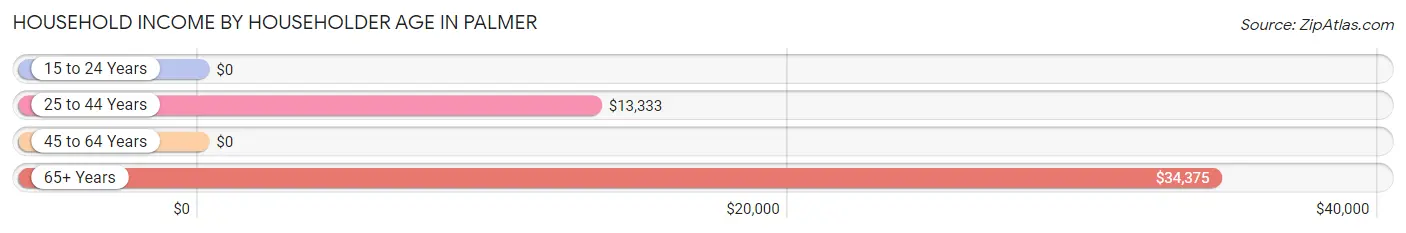
| Income Bracket | # Households | Median Income |
| 15 to 24 Years | 0 (0.0%) | $0 |
| 25 to 44 Years | 96 (24.9%) | $13,333 |
| 45 to 64 Years | 62 (16.1%) | $0 |
| 65+ Years | 228 (59.1%) | $34,375 |
| Total | 386 (100.0%) | $0 |
Poverty in Palmer
Income Below Poverty by Sex and Age in Palmer
With 31.7% poverty level for males and 55.2% for females among the residents of Palmer, 16 and 17 year old males and under 5 year old females are the most vulnerable to poverty, with 83 males (100.0%) and 21 females (100.0%) in their respective age groups living below the poverty level.
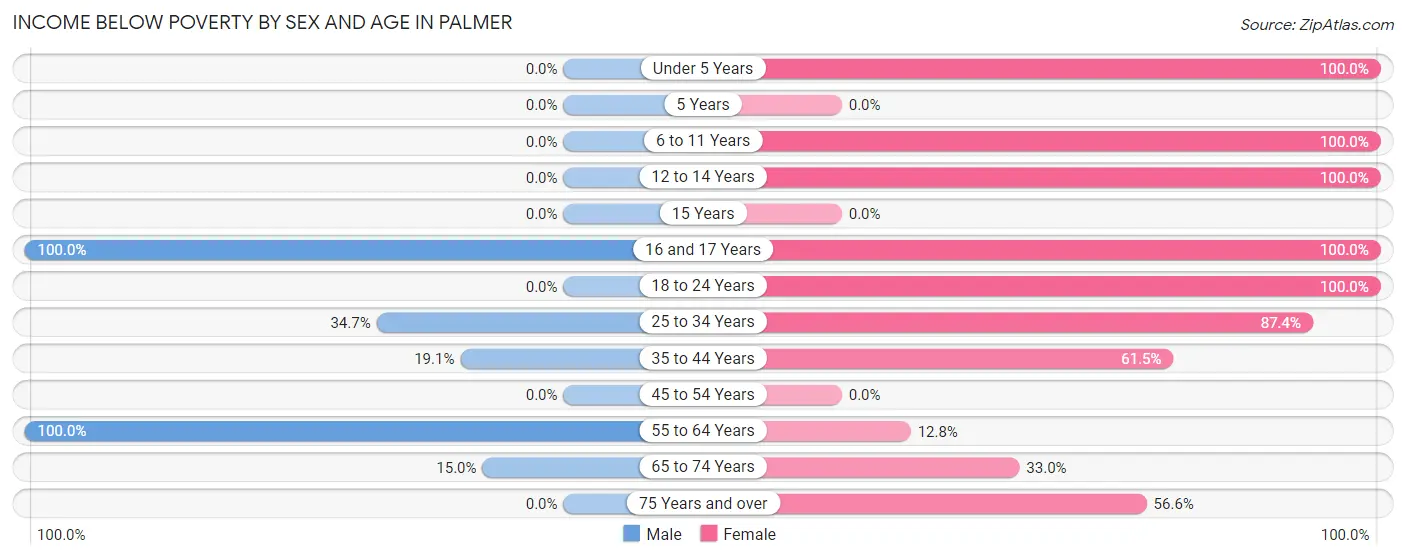
| Age Bracket | Male | Female |
| Under 5 Years | 0 (0.0%) | 21 (100.0%) |
| 5 Years | 0 (0.0%) | 0 (0.0%) |
| 6 to 11 Years | 0 (0.0%) | 36 (100.0%) |
| 12 to 14 Years | 0 (0.0%) | 73 (100.0%) |
| 15 Years | 0 (0.0%) | 0 (0.0%) |
| 16 and 17 Years | 83 (100.0%) | 40 (100.0%) |
| 18 to 24 Years | 0 (0.0%) | 41 (100.0%) |
| 25 to 34 Years | 17 (34.7%) | 139 (87.4%) |
| 35 to 44 Years | 31 (19.1%) | 32 (61.5%) |
| 45 to 54 Years | 0 (0.0%) | 0 (0.0%) |
| 55 to 64 Years | 16 (100.0%) | 28 (12.8%) |
| 65 to 74 Years | 26 (15.0%) | 30 (33.0%) |
| 75 Years and over | 0 (0.0%) | 73 (56.6%) |
| Total | 173 (31.7%) | 513 (55.2%) |
Income Above Poverty by Sex and Age in Palmer
According to the poverty statistics in Palmer, males aged under 5 years and females aged 15 years are the age groups that are most secure financially, with 100.0% of males and 100.0% of females in these age groups living above the poverty line.
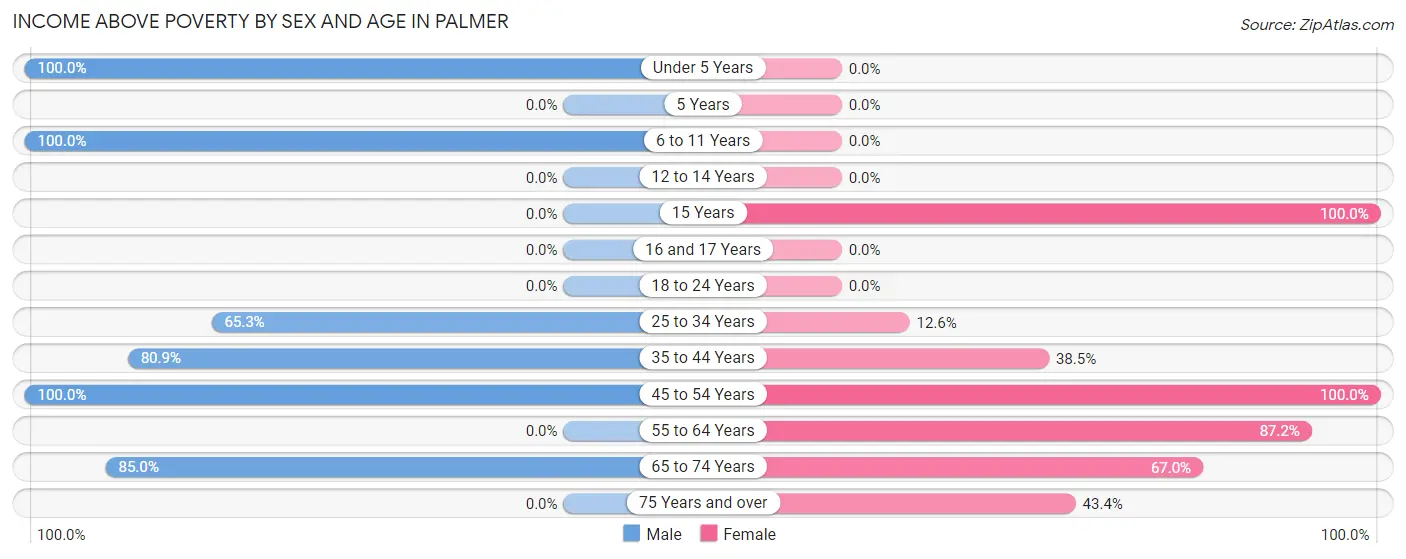
| Age Bracket | Male | Female |
| Under 5 Years | 21 (100.0%) | 0 (0.0%) |
| 5 Years | 0 (0.0%) | 0 (0.0%) |
| 6 to 11 Years | 23 (100.0%) | 0 (0.0%) |
| 12 to 14 Years | 0 (0.0%) | 0 (0.0%) |
| 15 Years | 0 (0.0%) | 25 (100.0%) |
| 16 and 17 Years | 0 (0.0%) | 0 (0.0%) |
| 18 to 24 Years | 0 (0.0%) | 0 (0.0%) |
| 25 to 34 Years | 32 (65.3%) | 20 (12.6%) |
| 35 to 44 Years | 131 (80.9%) | 20 (38.5%) |
| 45 to 54 Years | 18 (100.0%) | 44 (100.0%) |
| 55 to 64 Years | 0 (0.0%) | 191 (87.2%) |
| 65 to 74 Years | 147 (85.0%) | 61 (67.0%) |
| 75 Years and over | 0 (0.0%) | 56 (43.4%) |
| Total | 372 (68.3%) | 417 (44.8%) |
Income Below Poverty Among Married-Couple Families in Palmer
The poverty statistics for married-couple families in Palmer show that 22.8% or 26 of the total 114 families live below the poverty line. Families with no children have the highest poverty rate of 31.3%, comprising of 26 families. On the other hand, families with 1 or 2 children have the lowest poverty rate of 0.0%, which includes 0 families.
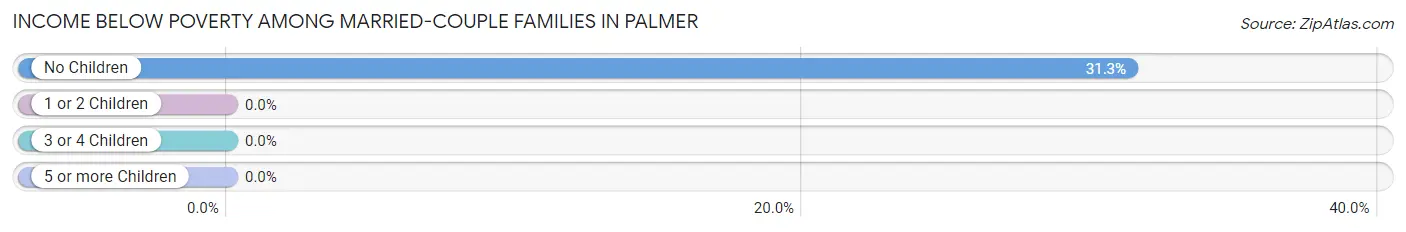
| Children | Above Poverty | Below Poverty |
| No Children | 57 (68.7%) | 26 (31.3%) |
| 1 or 2 Children | 31 (100.0%) | 0 (0.0%) |
| 3 or 4 Children | 0 (0.0%) | 0 (0.0%) |
| 5 or more Children | 0 (0.0%) | 0 (0.0%) |
| Total | 88 (77.2%) | 26 (22.8%) |
Income Below Poverty Among Single-Parent Households in Palmer
According to the poverty data in Palmer, 100.0% or 48 single-father households and 62.7% or 96 single-mother households are living below the poverty line. Among single-father households, those with 1 or 2 children have the highest poverty rate, with 48 households (100.0%) experiencing poverty. Likewise, among single-mother households, those with 1 or 2 children have the highest poverty rate, with 36 households (100.0%) falling below the poverty line.
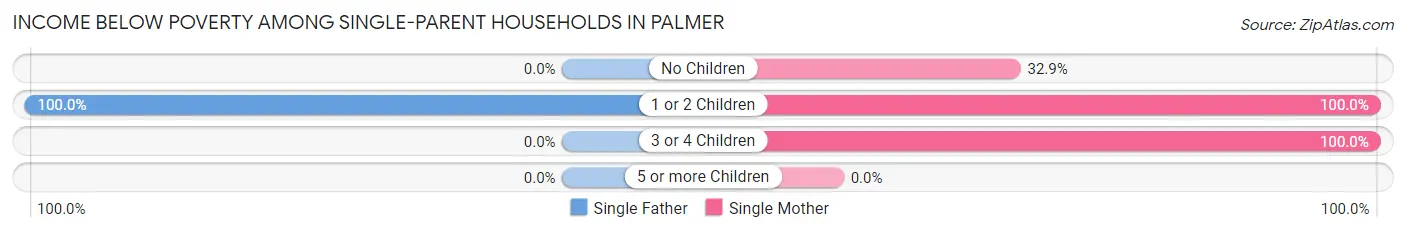
| Children | Single Father | Single Mother |
| No Children | 0 (0.0%) | 28 (32.9%) |
| 1 or 2 Children | 48 (100.0%) | 36 (100.0%) |
| 3 or 4 Children | 0 (0.0%) | 32 (100.0%) |
| 5 or more Children | 0 (0.0%) | 0 (0.0%) |
| Total | 48 (100.0%) | 96 (62.7%) |
Income Below Poverty Among Married-Couple vs Single-Parent Households in Palmer
The poverty data for Palmer shows that 26 of the married-couple family households (22.8%) and 144 of the single-parent households (71.6%) are living below the poverty level. Within the married-couple family households, those with no children have the highest poverty rate, with 26 households (31.3%) falling below the poverty line. Among the single-parent households, those with 1 or 2 children have the highest poverty rate, with 84 household (100.0%) living below poverty.
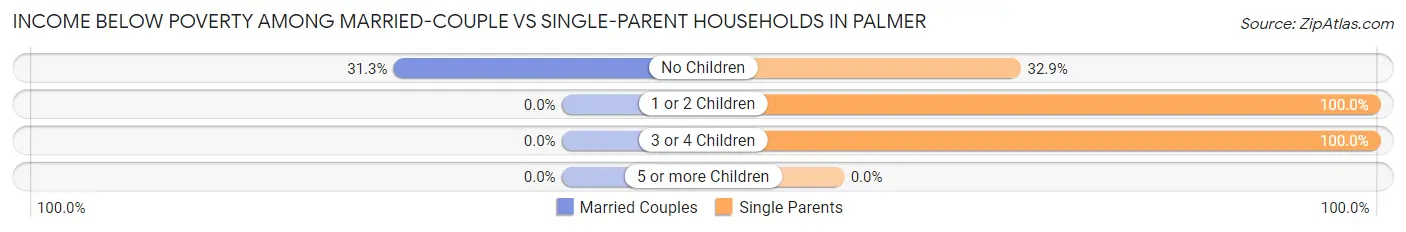
| Children | Married-Couple Families | Single-Parent Households |
| No Children | 26 (31.3%) | 28 (32.9%) |
| 1 or 2 Children | 0 (0.0%) | 84 (100.0%) |
| 3 or 4 Children | 0 (0.0%) | 32 (100.0%) |
| 5 or more Children | 0 (0.0%) | 0 (0.0%) |
| Total | 26 (22.8%) | 144 (71.6%) |
Race in Palmer
The most populous races in Palmer are Hispanic or Latino (1,475 | 100.0%), Some other Race (575 | 39.0%), and White / Caucasian (442 | 30.0%).
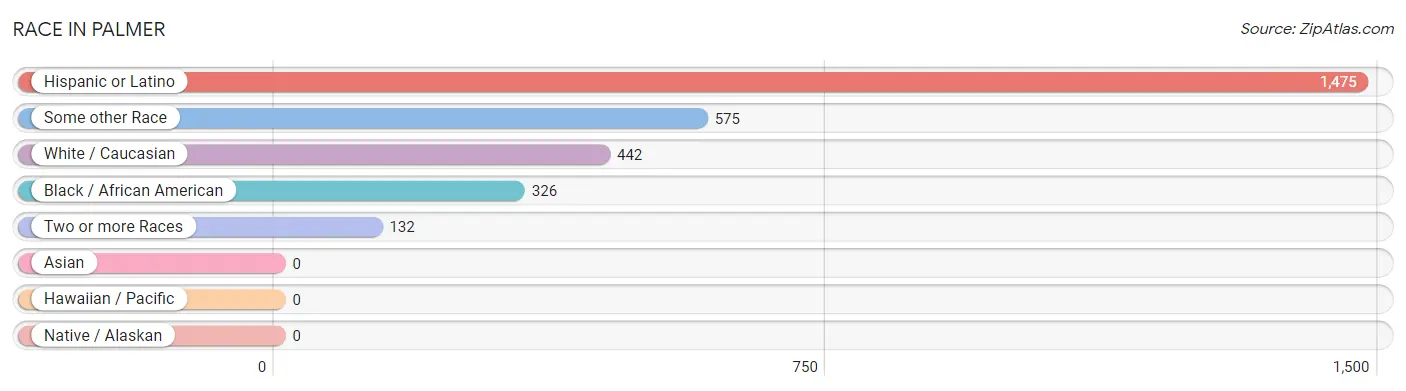
| Race | # Population | % Population |
| Asian | 0 | 0.0% |
| Black / African American | 326 | 22.1% |
| Hawaiian / Pacific | 0 | 0.0% |
| Hispanic or Latino | 1,475 | 100.0% |
| Native / Alaskan | 0 | 0.0% |
| White / Caucasian | 442 | 30.0% |
| Two or more Races | 132 | 8.9% |
| Some other Race | 575 | 39.0% |
| Total | 1,475 | 100.0% |
Ancestry in Palmer
The most populous ancestries reported in Palmer are Puerto Rican (1,439 | 97.6%), Dominican (20 | 1.4%), Central American (16 | 1.1%), and Salvadoran (16 | 1.1%), together accounting for 101.1% of all Palmer residents.
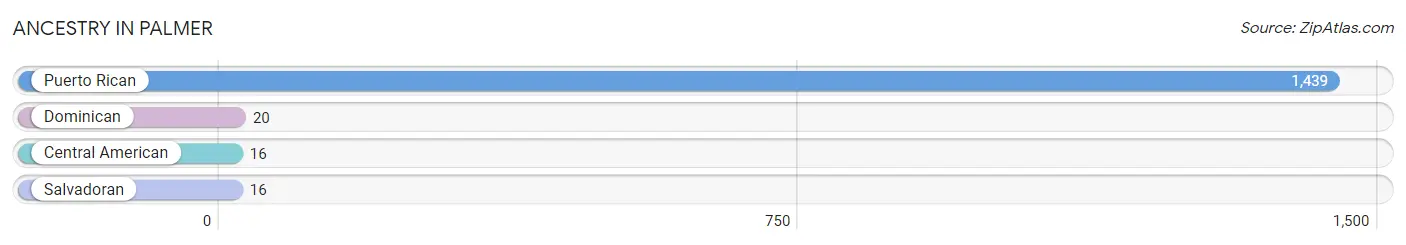
| Ancestry | # Population | % Population |
| Central American | 16 | 1.1% |
| Dominican | 20 | 1.4% |
| Puerto Rican | 1,439 | 97.6% |
| Salvadoran | 16 | 1.1% | View All 4 Rows |
Immigrants in Palmer

| Immigration Origin | # Population | % Population | View All 0 Rows |
Sex and Age in Palmer
Sex and Age in Palmer
The most populous age groups in Palmer are 65 to 69 Years (158 | 29.0%) for men and 55 to 59 Years (121 | 13.0%) for women.
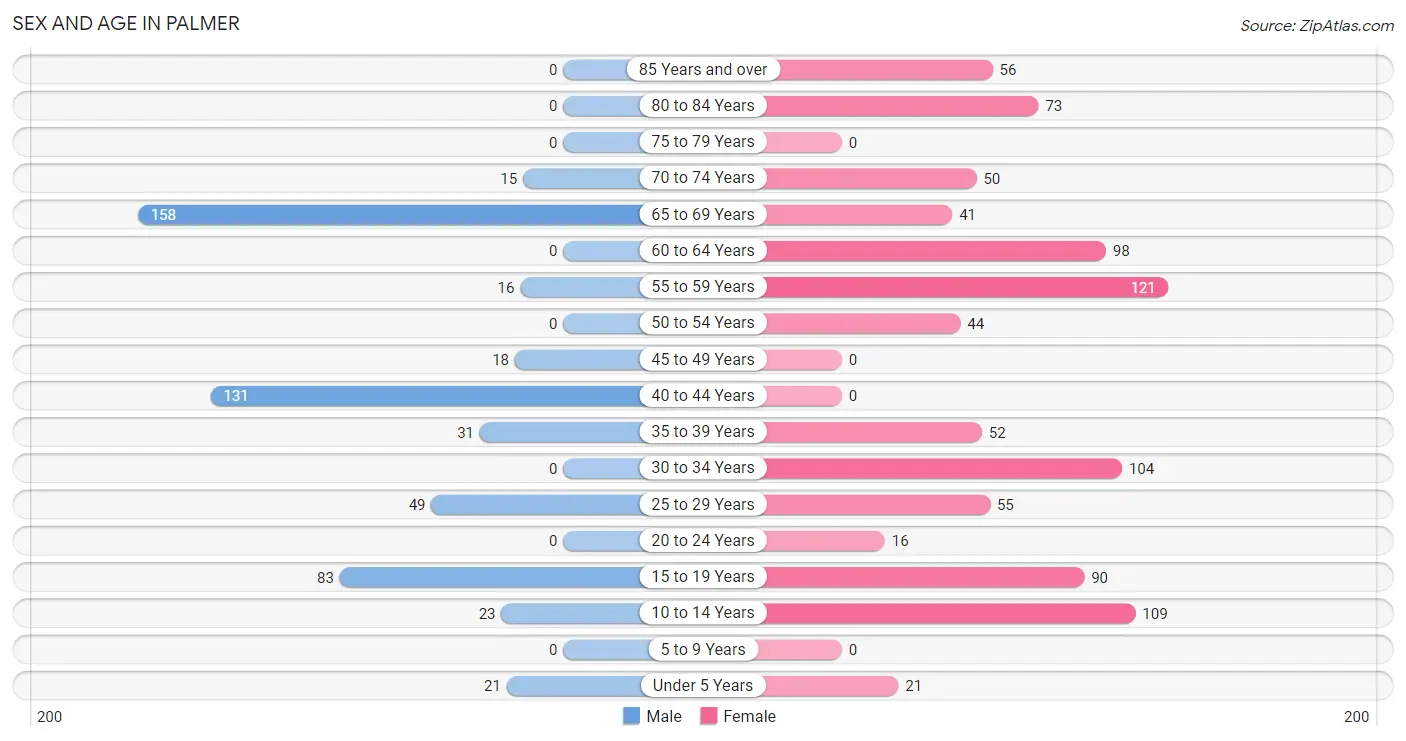
| Age Bracket | Male | Female |
| Under 5 Years | 21 (3.8%) | 21 (2.3%) |
| 5 to 9 Years | 0 (0.0%) | 0 (0.0%) |
| 10 to 14 Years | 23 (4.2%) | 109 (11.7%) |
| 15 to 19 Years | 83 (15.2%) | 90 (9.7%) |
| 20 to 24 Years | 0 (0.0%) | 16 (1.7%) |
| 25 to 29 Years | 49 (9.0%) | 55 (5.9%) |
| 30 to 34 Years | 0 (0.0%) | 104 (11.2%) |
| 35 to 39 Years | 31 (5.7%) | 52 (5.6%) |
| 40 to 44 Years | 131 (24.0%) | 0 (0.0%) |
| 45 to 49 Years | 18 (3.3%) | 0 (0.0%) |
| 50 to 54 Years | 0 (0.0%) | 44 (4.7%) |
| 55 to 59 Years | 16 (2.9%) | 121 (13.0%) |
| 60 to 64 Years | 0 (0.0%) | 98 (10.5%) |
| 65 to 69 Years | 158 (29.0%) | 41 (4.4%) |
| 70 to 74 Years | 15 (2.8%) | 50 (5.4%) |
| 75 to 79 Years | 0 (0.0%) | 0 (0.0%) |
| 80 to 84 Years | 0 (0.0%) | 73 (7.9%) |
| 85 Years and over | 0 (0.0%) | 56 (6.0%) |
| Total | 545 (100.0%) | 930 (100.0%) |
Families and Households in Palmer
Median Family Size in Palmer
The median family size in Palmer is 4.26 persons per family, with married-couple families (114 | 36.2%) accounting for the largest median family size of 4.76 persons per family. On the other hand, single male/father families (48 | 15.2%) represent the smallest median family size with 3.31 persons per family.
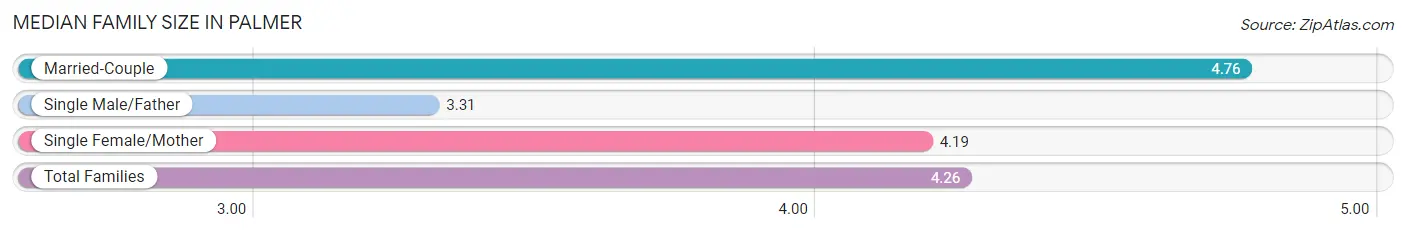
| Family Type | # Families | Family Size |
| Married-Couple | 114 (36.2%) | 4.76 |
| Single Male/Father | 48 (15.2%) | 3.31 |
| Single Female/Mother | 153 (48.6%) | 4.19 |
| Total Families | 315 (100.0%) | 4.26 |
Median Household Size in Palmer
The median household size in Palmer is 3.82 persons per household, with married-couple households (114 | 29.5%) accounting for the largest median household size of 4.98 persons per household. non-family households (71 | 18.4%) represent the smallest median household size with 1.28 persons per household.
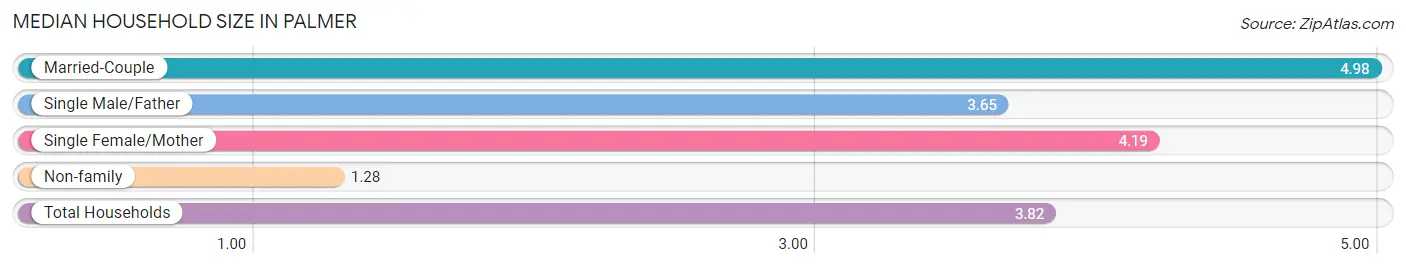
| Household Type | # Households | Household Size |
| Married-Couple | 114 (29.5%) | 4.98 |
| Single Male/Father | 48 (12.4%) | 3.65 |
| Single Female/Mother | 153 (39.6%) | 4.19 |
| Non-family | 71 (18.4%) | 1.28 |
| Total Households | 386 (100.0%) | 3.82 |
Household Size by Marriage Status in Palmer
Out of a total of 386 households in Palmer, 315 (81.6%) are family households, while 71 (18.4%) are nonfamily households. The most numerous type of family households are 3-person households, comprising 171, and the most common type of nonfamily households are 1-person households, comprising 53.
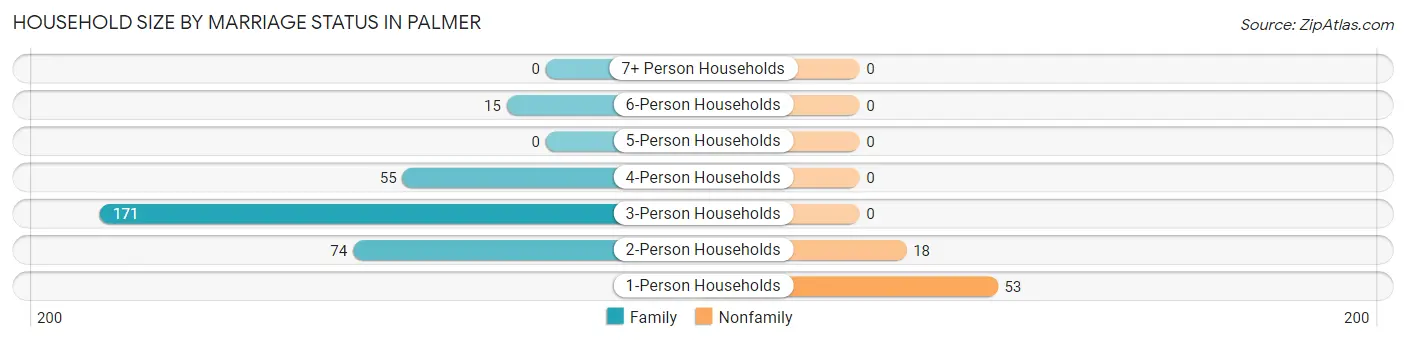
| Household Size | Family Households | Nonfamily Households |
| 1-Person Households | - | 53 (13.7%) |
| 2-Person Households | 74 (19.2%) | 18 (4.7%) |
| 3-Person Households | 171 (44.3%) | 0 (0.0%) |
| 4-Person Households | 55 (14.2%) | 0 (0.0%) |
| 5-Person Households | 0 (0.0%) | 0 (0.0%) |
| 6-Person Households | 15 (3.9%) | 0 (0.0%) |
| 7+ Person Households | 0 (0.0%) | 0 (0.0%) |
| Total | 315 (81.6%) | 71 (18.4%) |
Female Fertility in Palmer
Fertility by Age in Palmer

| Age Bracket | Women with Births | Births / 1,000 Women |
| 15 to 19 years | 0 (0.0%) | 0.0 |
| 20 to 34 years | 0 (0.0%) | 0.0 |
| 35 to 50 years | 0 (0.0%) | 0.0 |
| Total | 0 (0.0%) | 0.0 |
Fertility by Age by Marriage Status in Palmer
| Age Bracket | Married | Unmarried |
| 15 to 19 years | 0 (0.0%) | 0 (0.0%) |
| 20 to 34 years | 0 (0.0%) | 0 (0.0%) |
| 35 to 50 years | 0 (0.0%) | 0 (0.0%) |
| Total | 0 (0.0%) | 0 (0.0%) |
Fertility by Education in Palmer
| Educational Attainment | Women with Births | Births / 1,000 Women |
| Less than High School | 0 (0.0%) | 0.0 |
| High School Diploma | 0 (0.0%) | 0.0 |
| College or Associate's Degree | 0 (0.0%) | 0.0 |
| Bachelor's Degree | 0 (0.0%) | 0.0 |
| Graduate Degree | 0 (0.0%) | 0.0 |
| Total | 0 (0.0%) | 0.0 |
Fertility by Education by Marriage Status in Palmer
| Educational Attainment | Married | Unmarried |
| Less than High School | 0 (0.0%) | 0 (0.0%) |
| High School Diploma | 0 (0.0%) | 0 (0.0%) |
| College or Associate's Degree | 0 (0.0%) | 0 (0.0%) |
| Bachelor's Degree | 0 (0.0%) | 0 (0.0%) |
| Graduate Degree | 0 (0.0%) | 0 (0.0%) |
| Total | 0 (0.0%) | 0 (0.0%) |
Employment Characteristics in Palmer
Employment by Class of Employer in Palmer
Among the 486 employed individuals in Palmer, private company employees (265 | 54.5%), self-employed (not incorporated) (189 | 38.9%), and not-for-profit organizations (16 | 3.3%) make up the most common classes of employment.
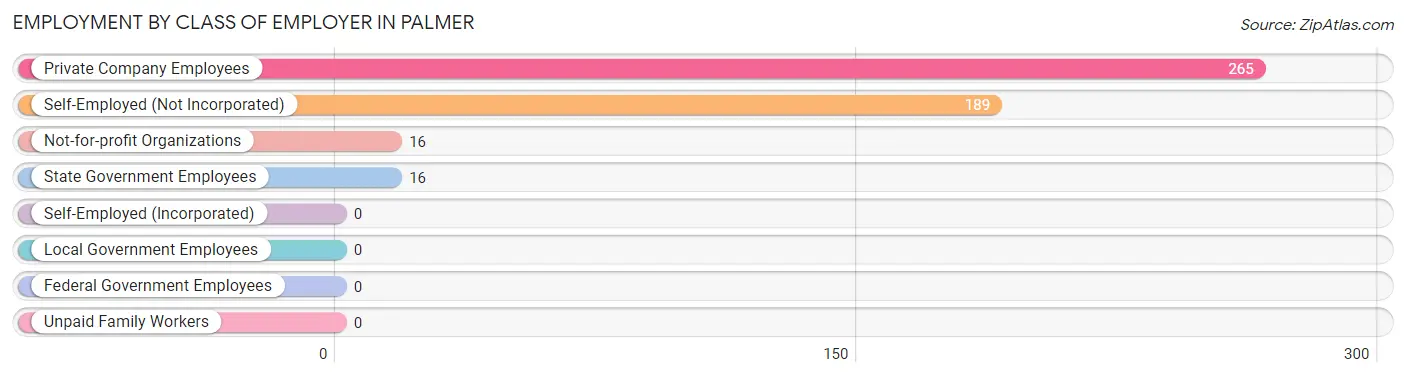
| Employer Class | # Employees | % Employees |
| Private Company Employees | 265 | 54.5% |
| Self-Employed (Incorporated) | 0 | 0.0% |
| Self-Employed (Not Incorporated) | 189 | 38.9% |
| Not-for-profit Organizations | 16 | 3.3% |
| Local Government Employees | 0 | 0.0% |
| State Government Employees | 16 | 3.3% |
| Federal Government Employees | 0 | 0.0% |
| Unpaid Family Workers | 0 | 0.0% |
| Total | 486 | 100.0% |
Employment Status by Age in Palmer
According to the labor force statistics for Palmer, out of the total population over 16 years of age (1,276), 60.0% or 766 individuals are in the labor force, with 25.5% or 195 of them unemployed. The age group with the highest labor force participation rate is 20 to 24 years, with 100.0% or 16 individuals in the labor force. Within the labor force, the 20 to 24 years age range has the highest percentage of unemployed individuals, with 100.0% or 16 of them being unemployed.
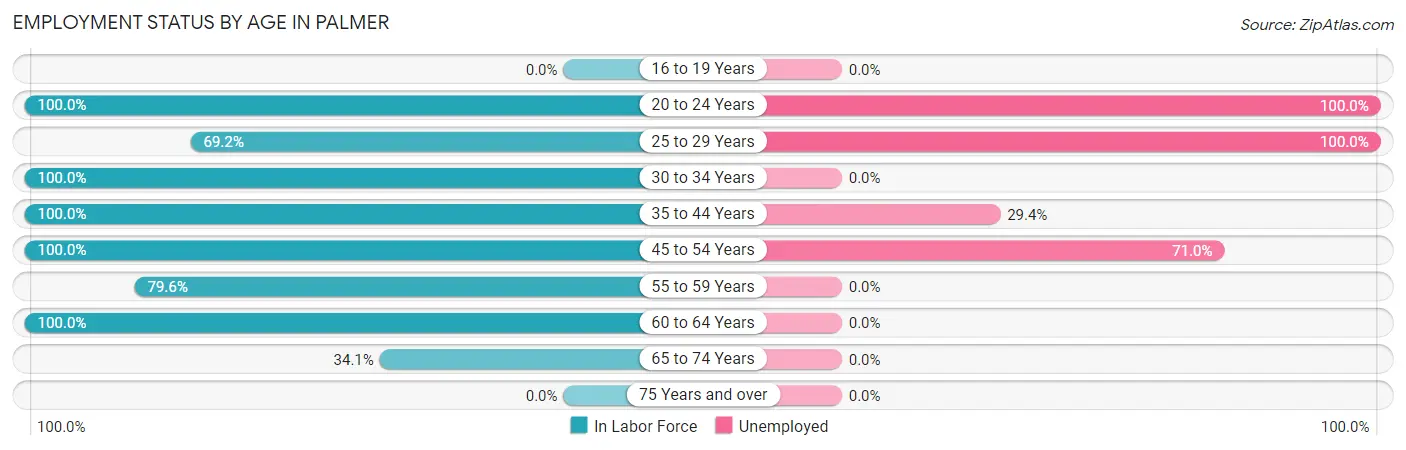
| Age Bracket | In Labor Force | Unemployed |
| 16 to 19 Years | 0 (0.0%) | 0 (0.0%) |
| 20 to 24 Years | 16 (100.0%) | 16 (100.0%) |
| 25 to 29 Years | 72 (69.2%) | 72 (100.0%) |
| 30 to 34 Years | 104 (100.0%) | 0 (0.0%) |
| 35 to 44 Years | 214 (100.0%) | 63 (29.4%) |
| 45 to 54 Years | 62 (100.0%) | 44 (71.0%) |
| 55 to 59 Years | 109 (79.6%) | 0 (0.0%) |
| 60 to 64 Years | 98 (100.0%) | 0 (0.0%) |
| 65 to 74 Years | 90 (34.1%) | 0 (0.0%) |
| 75 Years and over | 0 (0.0%) | 0 (0.0%) |
| Total | 766 (60.0%) | 195 (25.5%) |
Employment Status by Educational Attainment in Palmer
According to labor force statistics for Palmer, 91.7% of individuals (659) out of the total population between 25 and 64 years of age (719) are in the labor force, with 27.2% or 179 of them being unemployed. The group with the highest labor force participation rate are those with the educational attainment of less than high school, with 100.0% or 32 individuals in the labor force. Within the labor force, individuals with less than high school education have the highest percentage of unemployment, with 100.0% or 32 of them being unemployed.
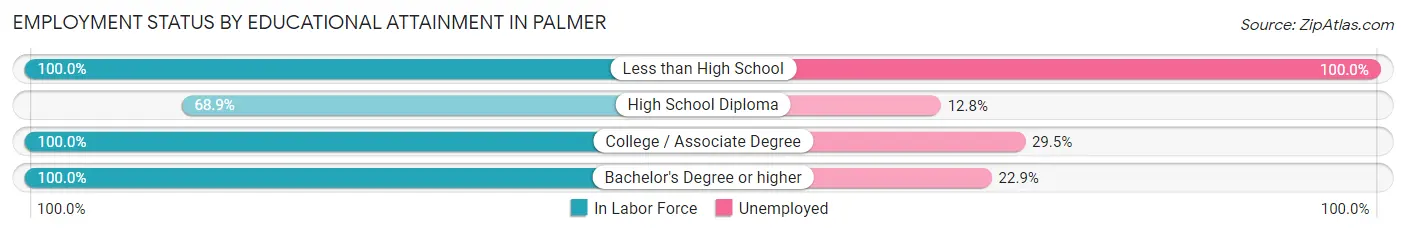
| Educational Attainment | In Labor Force | Unemployed |
| Less than High School | 32 (100.0%) | 32 (100.0%) |
| High School Diploma | 133 (68.9%) | 25 (12.8%) |
| College / Associate Degree | 254 (100.0%) | 75 (29.5%) |
| Bachelor's Degree or higher | 240 (100.0%) | 55 (22.9%) |
| Total | 659 (91.7%) | 196 (27.2%) |
Employment Occupations by Sex in Palmer
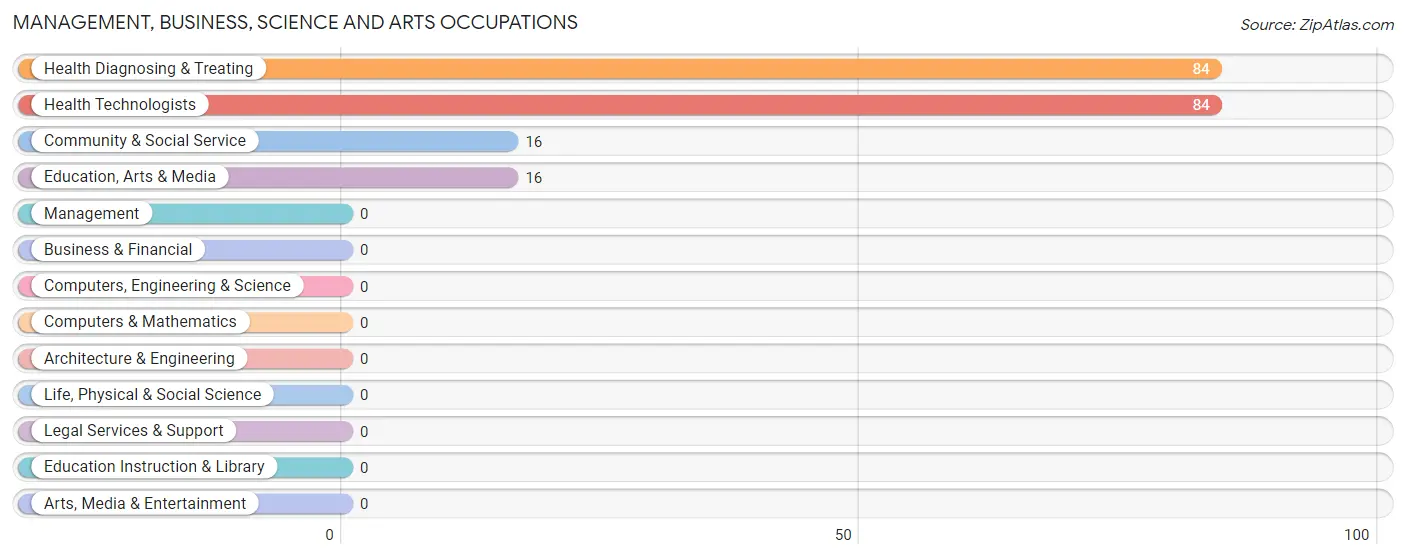
Management, Business, Science and Arts Occupations
The most common Management, Business, Science and Arts occupations in Palmer are Health Diagnosing & Treating (84 | 14.7%), Health Technologists (84 | 14.7%), Community & Social Service (16 | 2.8%), and Education, Arts & Media (16 | 2.8%).
Management, Business, Science and Arts Occupations by Sex
Within the Management, Business, Science and Arts occupations in Palmer, the most male-oriented occupations are Community & Social Service (100.0%), and Education, Arts & Media (100.0%), while the most female-oriented occupations are Health Diagnosing & Treating (100.0%), and Health Technologists (100.0%).
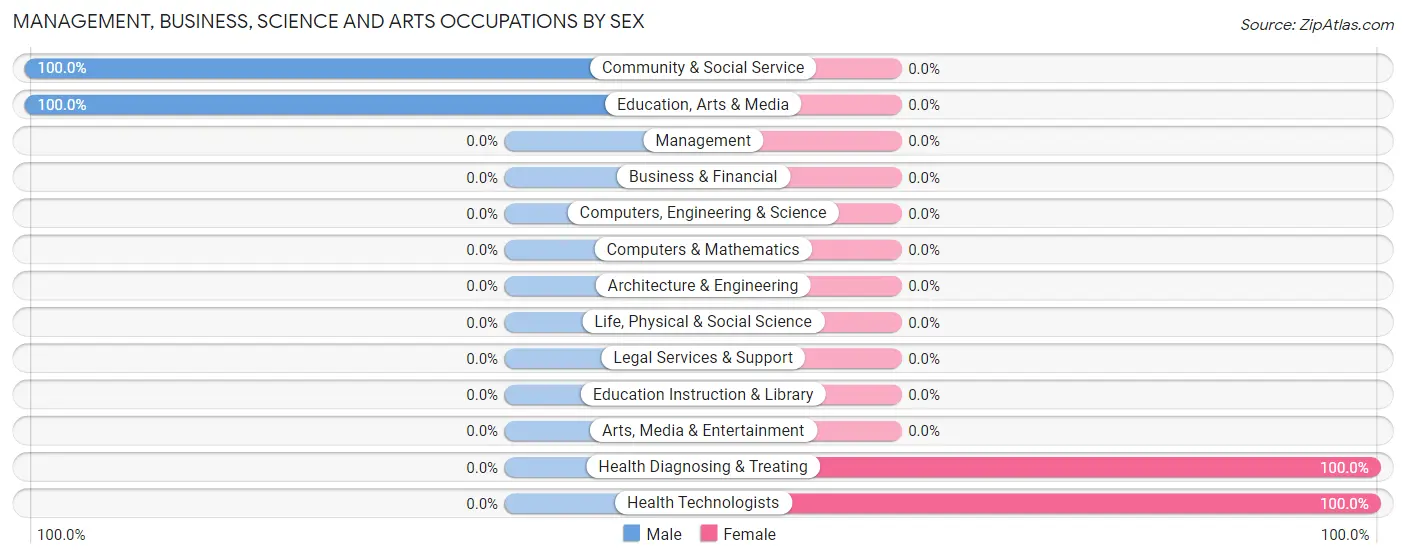
| Occupation | Male | Female |
| Management | 0 (0.0%) | 0 (0.0%) |
| Business & Financial | 0 (0.0%) | 0 (0.0%) |
| Computers, Engineering & Science | 0 (0.0%) | 0 (0.0%) |
| Computers & Mathematics | 0 (0.0%) | 0 (0.0%) |
| Architecture & Engineering | 0 (0.0%) | 0 (0.0%) |
| Life, Physical & Social Science | 0 (0.0%) | 0 (0.0%) |
| Community & Social Service | 16 (100.0%) | 0 (0.0%) |
| Education, Arts & Media | 16 (100.0%) | 0 (0.0%) |
| Legal Services & Support | 0 (0.0%) | 0 (0.0%) |
| Education Instruction & Library | 0 (0.0%) | 0 (0.0%) |
| Arts, Media & Entertainment | 0 (0.0%) | 0 (0.0%) |
| Health Diagnosing & Treating | 0 (0.0%) | 84 (100.0%) |
| Health Technologists | 0 (0.0%) | 84 (100.0%) |
| Total (Category) | 16 (16.0%) | 84 (84.0%) |
| Total (Overall) | 255 (44.7%) | 315 (55.3%) |
Services Occupations
The most common Services occupations in Palmer are Cleaning & Maintenance (98 | 17.2%), Security & Protection (18 | 3.2%), and Firefighting & Prevention (18 | 3.2%).
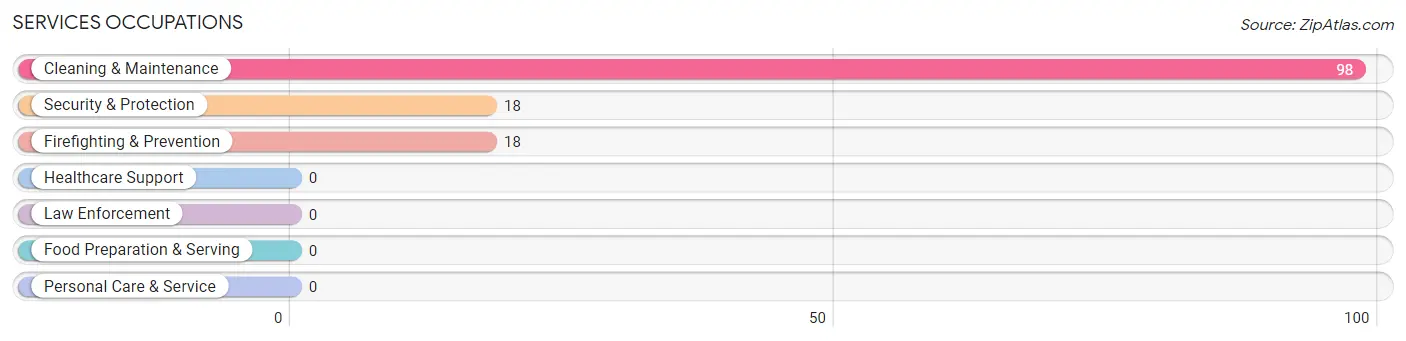
Services Occupations by Sex
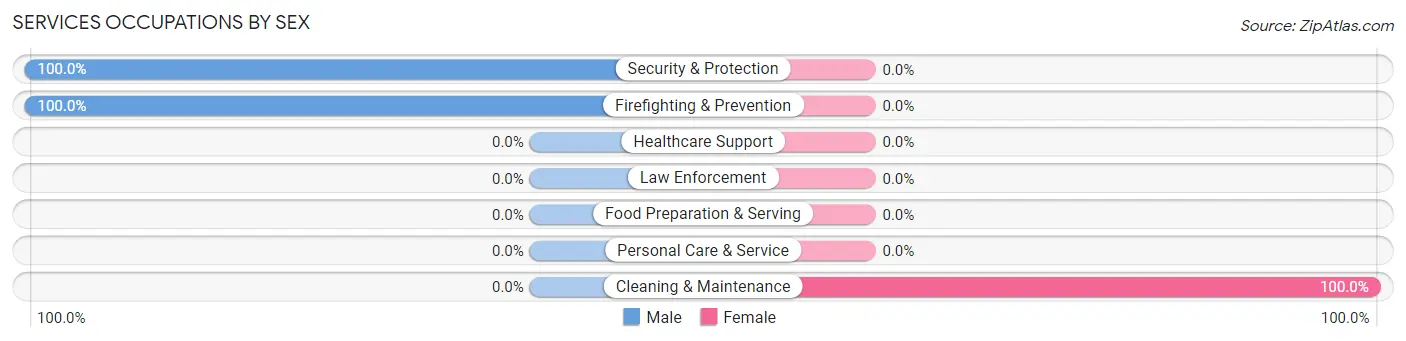
| Occupation | Male | Female |
| Healthcare Support | 0 (0.0%) | 0 (0.0%) |
| Security & Protection | 18 (100.0%) | 0 (0.0%) |
| Firefighting & Prevention | 18 (100.0%) | 0 (0.0%) |
| Law Enforcement | 0 (0.0%) | 0 (0.0%) |
| Food Preparation & Serving | 0 (0.0%) | 0 (0.0%) |
| Cleaning & Maintenance | 0 (0.0%) | 98 (100.0%) |
| Personal Care & Service | 0 (0.0%) | 0 (0.0%) |
| Total (Category) | 18 (15.5%) | 98 (84.5%) |
| Total (Overall) | 255 (44.7%) | 315 (55.3%) |
Sales and Office Occupations
The most common Sales and Office occupations in Palmer are Office & Administration (208 | 36.5%), and Sales & Related (76 | 13.3%).
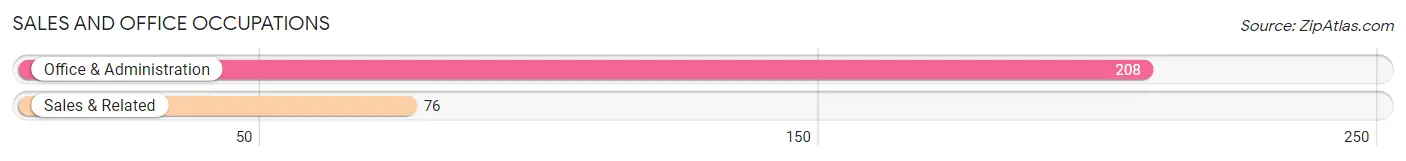
Sales and Office Occupations by Sex
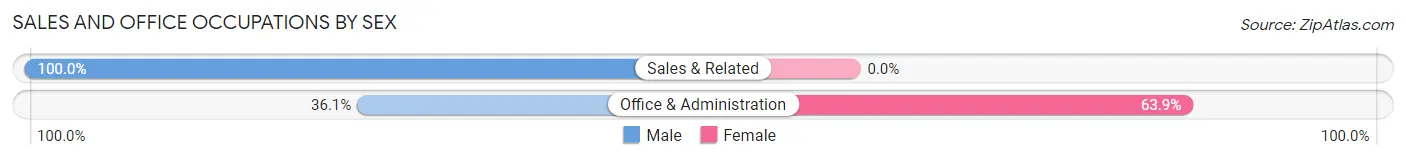
| Occupation | Male | Female |
| Sales & Related | 76 (100.0%) | 0 (0.0%) |
| Office & Administration | 75 (36.1%) | 133 (63.9%) |
| Total (Category) | 151 (53.2%) | 133 (46.8%) |
| Total (Overall) | 255 (44.7%) | 315 (55.3%) |
Natural Resources, Construction and Maintenance Occupations
The most common Natural Resources, Construction and Maintenance occupations in Palmer are , and Construction & Extraction (15 | 2.6%).
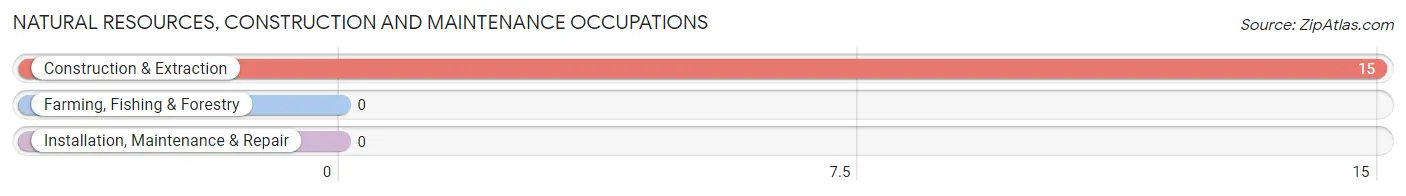
Natural Resources, Construction and Maintenance Occupations by Sex
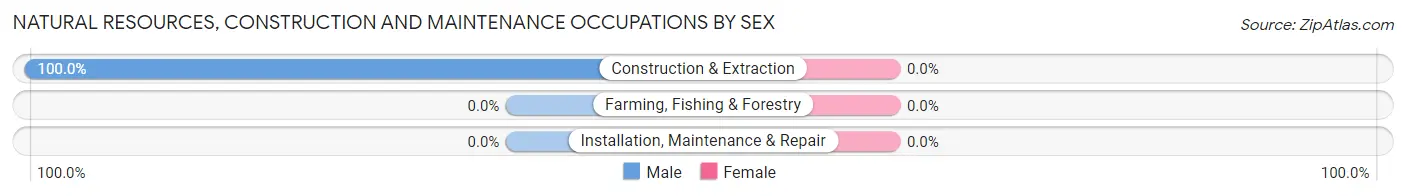
| Occupation | Male | Female |
| Farming, Fishing & Forestry | 0 (0.0%) | 0 (0.0%) |
| Construction & Extraction | 15 (100.0%) | 0 (0.0%) |
| Installation, Maintenance & Repair | 0 (0.0%) | 0 (0.0%) |
| Total (Category) | 15 (100.0%) | 0 (0.0%) |
| Total (Overall) | 255 (44.7%) | 315 (55.3%) |
Production, Transportation and Moving Occupations
The most common Production, Transportation and Moving occupations in Palmer are Material Moving (39 | 6.8%), and Transportation (16 | 2.8%).
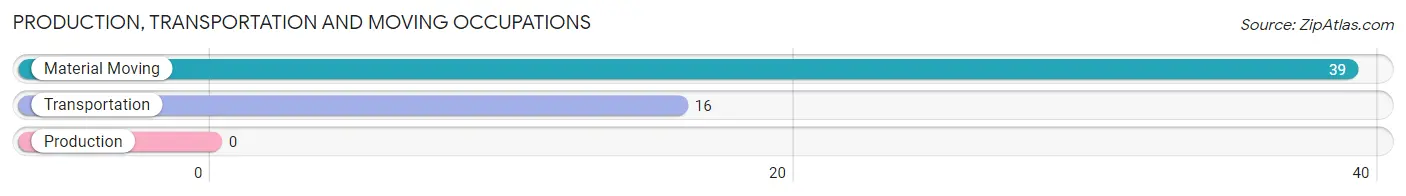
Production, Transportation and Moving Occupations by Sex
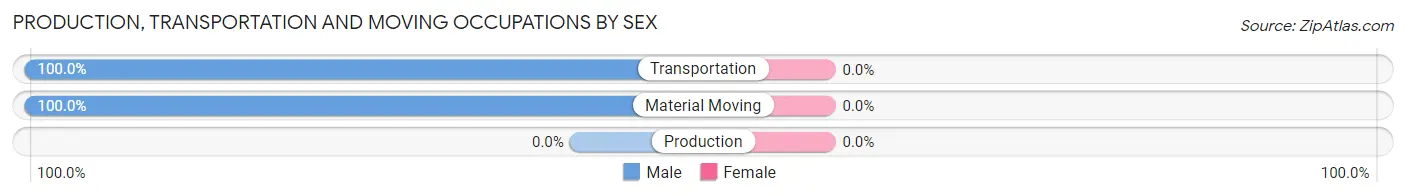
| Occupation | Male | Female |
| Production | 0 (0.0%) | 0 (0.0%) |
| Transportation | 16 (100.0%) | 0 (0.0%) |
| Material Moving | 39 (100.0%) | 0 (0.0%) |
| Total (Category) | 55 (100.0%) | 0 (0.0%) |
| Total (Overall) | 255 (44.7%) | 315 (55.3%) |
Employment Industries by Sex in Palmer
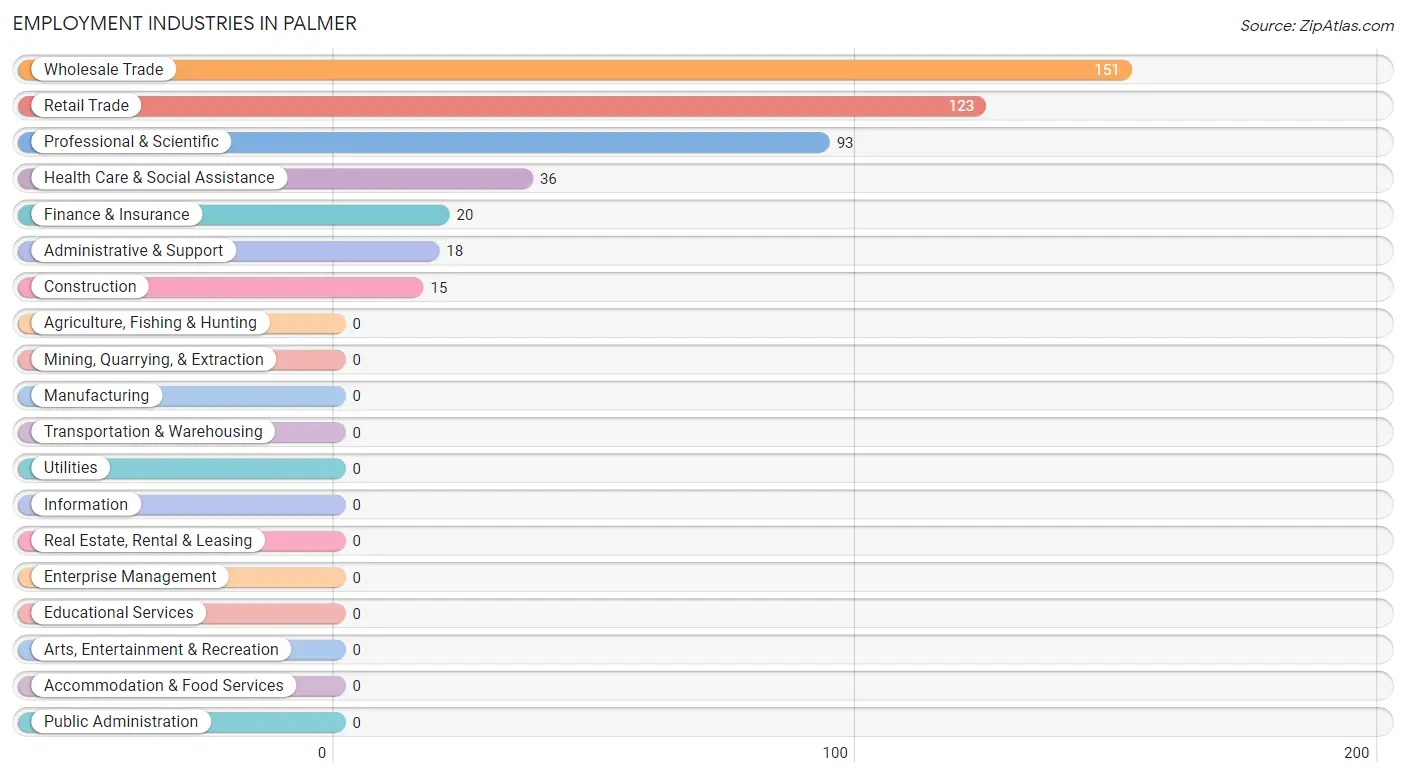
Employment Industries in Palmer
The major employment industries in Palmer include Wholesale Trade (151 | 26.5%), Retail Trade (123 | 21.6%), Professional & Scientific (93 | 16.3%), Health Care & Social Assistance (36 | 6.3%), and Finance & Insurance (20 | 3.5%).
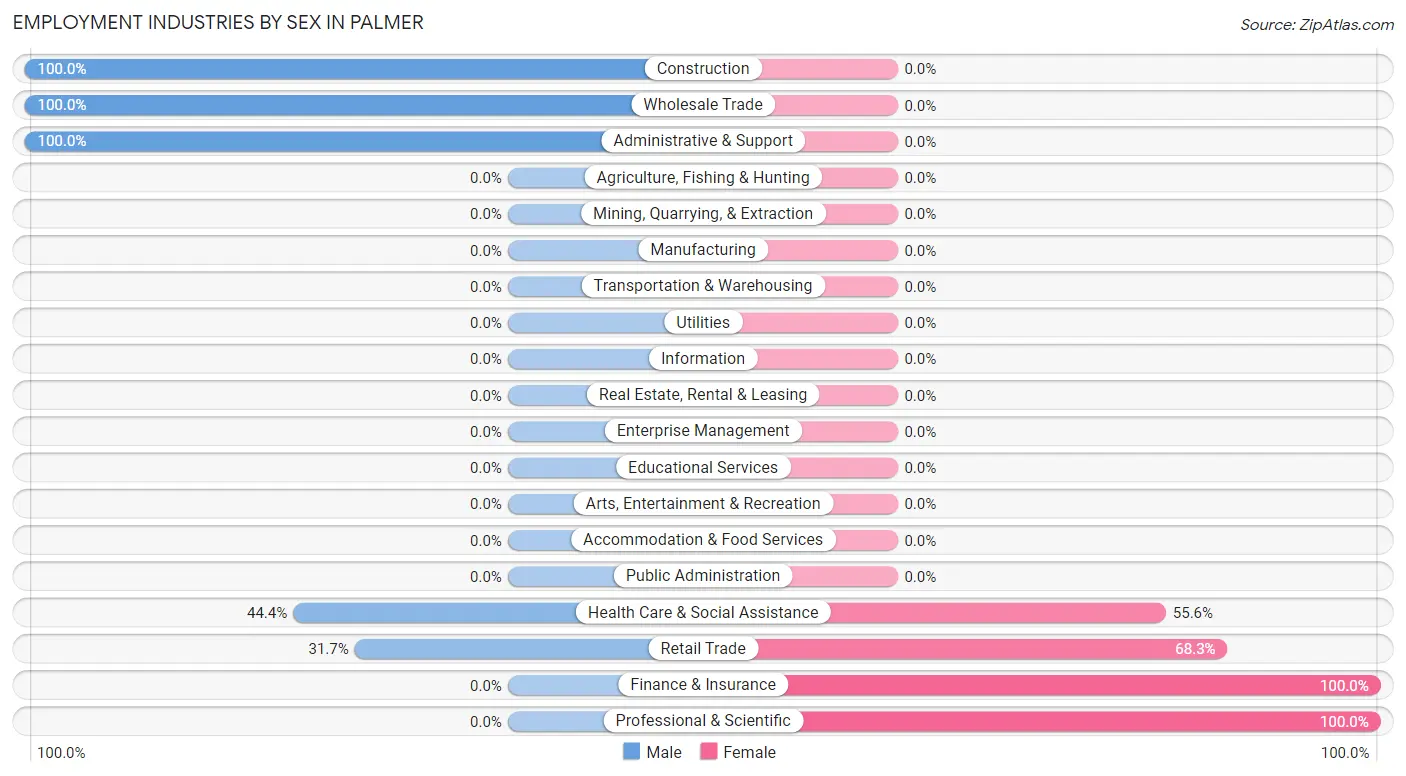
Employment Industries by Sex in Palmer
The Palmer industries that see more men than women are Construction (100.0%), Wholesale Trade (100.0%), and Administrative & Support (100.0%), whereas the industries that tend to have a higher number of women are Finance & Insurance (100.0%), Professional & Scientific (100.0%), and Retail Trade (68.3%).
| Industry | Male | Female |
| Agriculture, Fishing & Hunting | 0 (0.0%) | 0 (0.0%) |
| Mining, Quarrying, & Extraction | 0 (0.0%) | 0 (0.0%) |
| Construction | 15 (100.0%) | 0 (0.0%) |
| Manufacturing | 0 (0.0%) | 0 (0.0%) |
| Wholesale Trade | 151 (100.0%) | 0 (0.0%) |
| Retail Trade | 39 (31.7%) | 84 (68.3%) |
| Transportation & Warehousing | 0 (0.0%) | 0 (0.0%) |
| Utilities | 0 (0.0%) | 0 (0.0%) |
| Information | 0 (0.0%) | 0 (0.0%) |
| Finance & Insurance | 0 (0.0%) | 20 (100.0%) |
| Real Estate, Rental & Leasing | 0 (0.0%) | 0 (0.0%) |
| Professional & Scientific | 0 (0.0%) | 93 (100.0%) |
| Enterprise Management | 0 (0.0%) | 0 (0.0%) |
| Administrative & Support | 18 (100.0%) | 0 (0.0%) |
| Educational Services | 0 (0.0%) | 0 (0.0%) |
| Health Care & Social Assistance | 16 (44.4%) | 20 (55.6%) |
| Arts, Entertainment & Recreation | 0 (0.0%) | 0 (0.0%) |
| Accommodation & Food Services | 0 (0.0%) | 0 (0.0%) |
| Public Administration | 0 (0.0%) | 0 (0.0%) |
| Total | 255 (44.7%) | 315 (55.3%) |
Education in Palmer
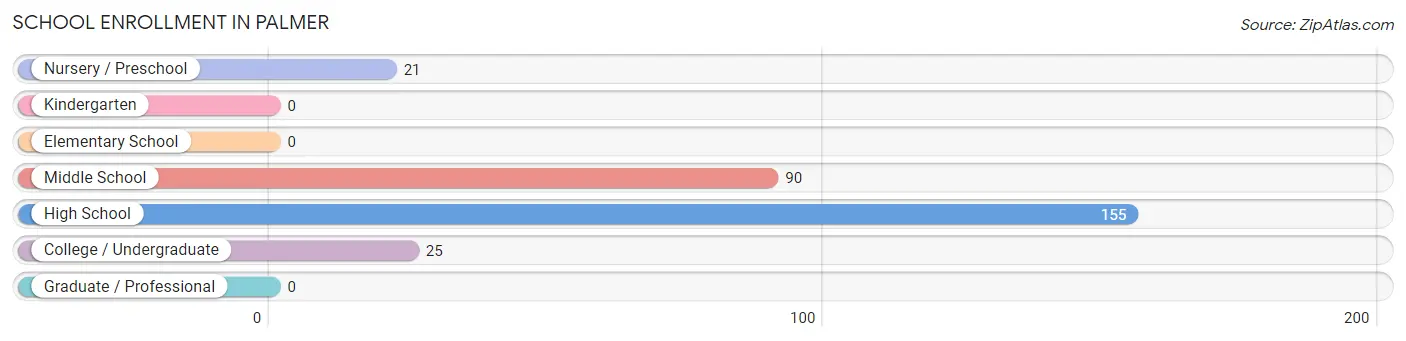
School Enrollment in Palmer
The most common levels of schooling among the 291 students in Palmer are high school (155 | 53.3%), middle school (90 | 30.9%), and college / undergraduate (25 | 8.6%).
| School Level | # Students | % Students |
| Nursery / Preschool | 21 | 7.2% |
| Kindergarten | 0 | 0.0% |
| Elementary School | 0 | 0.0% |
| Middle School | 90 | 30.9% |
| High School | 155 | 53.3% |
| College / Undergraduate | 25 | 8.6% |
| Graduate / Professional | 0 | 0.0% |
| Total | 291 | 100.0% |
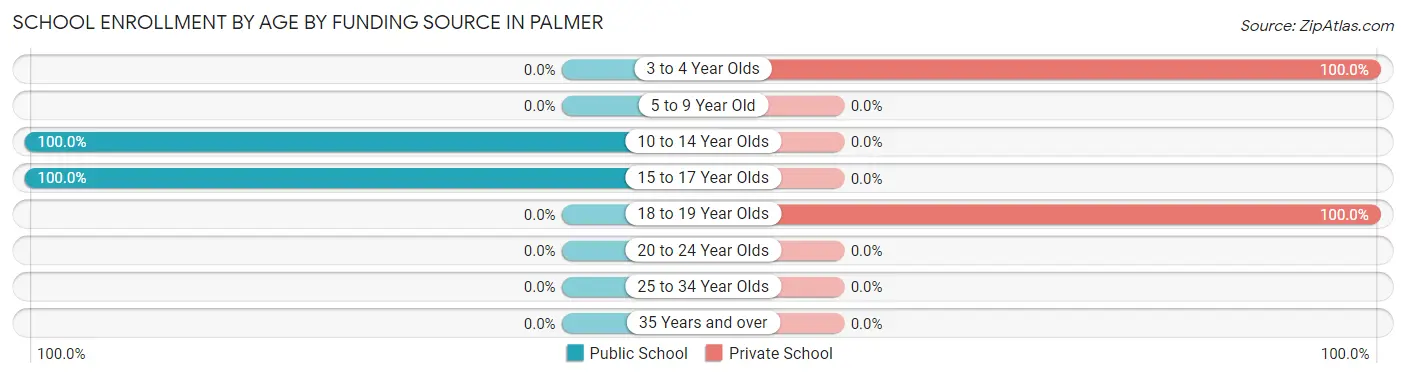
School Enrollment by Age by Funding Source in Palmer
Out of a total of 291 students who are enrolled in schools in Palmer, 46 (15.8%) attend a private institution, while the remaining 245 (84.2%) are enrolled in public schools. The age group of 3 to 4 year olds has the highest likelihood of being enrolled in private schools, with 21 (100.0% in the age bracket) enrolled. Conversely, the age group of 10 to 14 year olds has the lowest likelihood of being enrolled in a private school, with 132 (100.0% in the age bracket) attending a public institution.
| Age Bracket | Public School | Private School |
| 3 to 4 Year Olds | 0 (0.0%) | 21 (100.0%) |
| 5 to 9 Year Old | 0 (0.0%) | 0 (0.0%) |
| 10 to 14 Year Olds | 132 (100.0%) | 0 (0.0%) |
| 15 to 17 Year Olds | 113 (100.0%) | 0 (0.0%) |
| 18 to 19 Year Olds | 0 (0.0%) | 25 (100.0%) |
| 20 to 24 Year Olds | 0 (0.0%) | 0 (0.0%) |
| 25 to 34 Year Olds | 0 (0.0%) | 0 (0.0%) |
| 35 Years and over | 0 (0.0%) | 0 (0.0%) |
| Total | 245 (84.2%) | 46 (15.8%) |
Educational Attainment by Field of Study in Palmer
Business (224 | 75.4%), liberal arts & history (39 | 13.1%), and education (34 | 11.5%) are the most common fields of study among 297 individuals in Palmer who have obtained a bachelor's degree or higher.
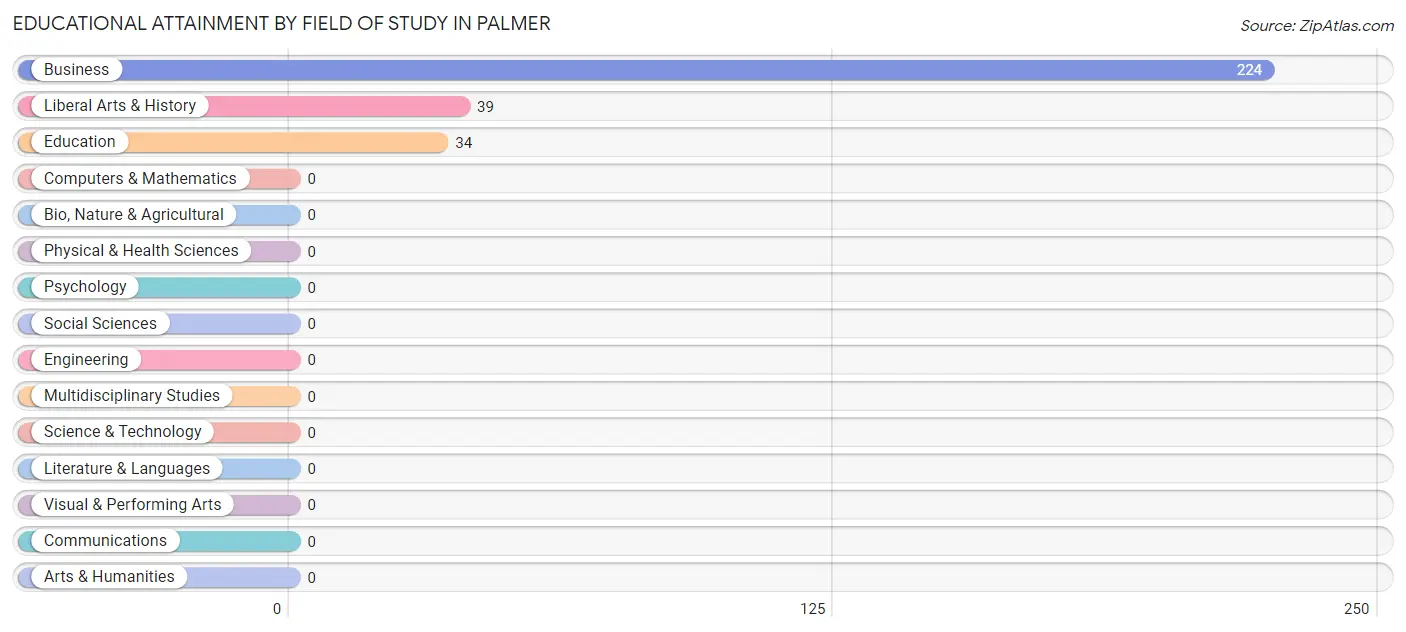
| Field of Study | # Graduates | % Graduates |
| Computers & Mathematics | 0 | 0.0% |
| Bio, Nature & Agricultural | 0 | 0.0% |
| Physical & Health Sciences | 0 | 0.0% |
| Psychology | 0 | 0.0% |
| Social Sciences | 0 | 0.0% |
| Engineering | 0 | 0.0% |
| Multidisciplinary Studies | 0 | 0.0% |
| Science & Technology | 0 | 0.0% |
| Business | 224 | 75.4% |
| Education | 34 | 11.5% |
| Literature & Languages | 0 | 0.0% |
| Liberal Arts & History | 39 | 13.1% |
| Visual & Performing Arts | 0 | 0.0% |
| Communications | 0 | 0.0% |
| Arts & Humanities | 0 | 0.0% |
| Total | 297 | 100.0% |
Transportation & Commute in Palmer
Vehicle Availability by Sex in Palmer
The most prevalent vehicle ownership categories in Palmer are males with 1 vehicle (107, accounting for 42.0%) and females with 1 vehicle (0, making up 46.3%).
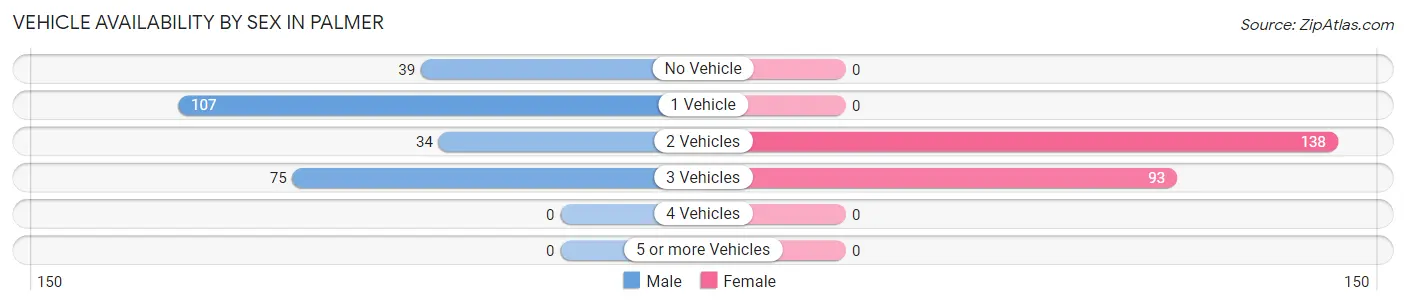
| Vehicles Available | Male | Female |
| No Vehicle | 39 (15.3%) | 0 (0.0%) |
| 1 Vehicle | 107 (42.0%) | 0 (0.0%) |
| 2 Vehicles | 34 (13.3%) | 138 (59.7%) |
| 3 Vehicles | 75 (29.4%) | 93 (40.3%) |
| 4 Vehicles | 0 (0.0%) | 0 (0.0%) |
| 5 or more Vehicles | 0 (0.0%) | 0 (0.0%) |
| Total | 255 (100.0%) | 231 (100.0%) |
Commute Time in Palmer
The most frequently occuring commute durations in Palmer are 60 to 89 minutes (148 commuters, 31.5%), 45 to 59 minutes (109 commuters, 23.2%), and 5 to 9 minutes (98 commuters, 20.8%).
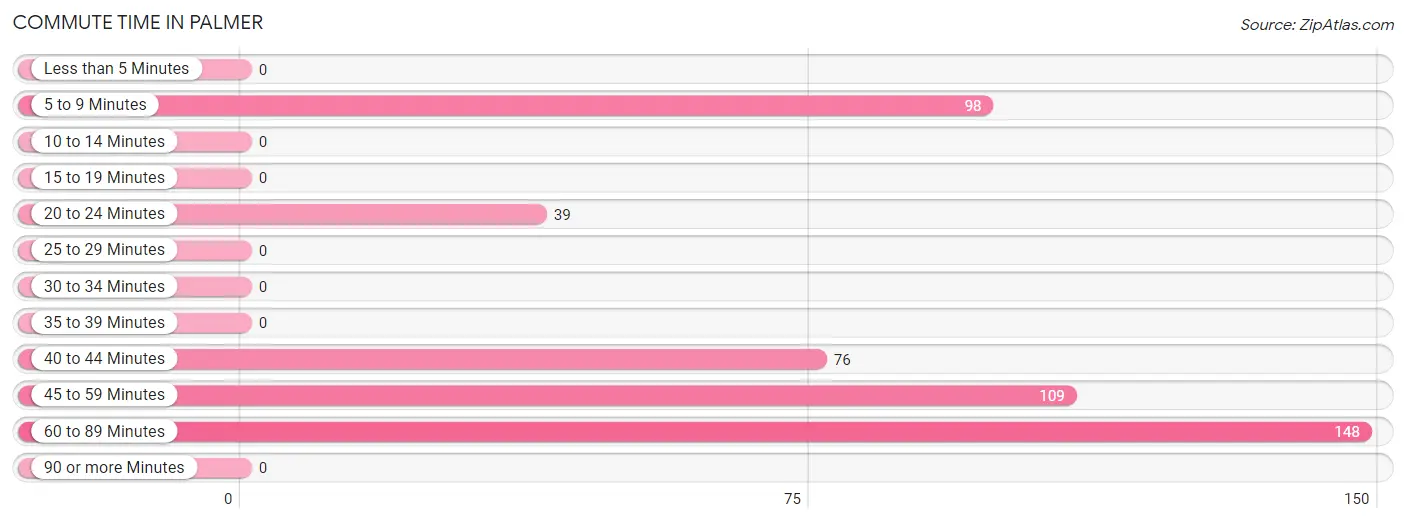
| Commute Time | # Commuters | % Commuters |
| Less than 5 Minutes | 0 | 0.0% |
| 5 to 9 Minutes | 98 | 20.8% |
| 10 to 14 Minutes | 0 | 0.0% |
| 15 to 19 Minutes | 0 | 0.0% |
| 20 to 24 Minutes | 39 | 8.3% |
| 25 to 29 Minutes | 0 | 0.0% |
| 30 to 34 Minutes | 0 | 0.0% |
| 35 to 39 Minutes | 0 | 0.0% |
| 40 to 44 Minutes | 76 | 16.2% |
| 45 to 59 Minutes | 109 | 23.2% |
| 60 to 89 Minutes | 148 | 31.5% |
| 90 or more Minutes | 0 | 0.0% |
Commute Time by Sex in Palmer
The most common commute times in Palmer are 60 to 89 minutes (108 commuters, 45.2%) for males and 5 to 9 minutes (98 commuters, 42.4%) for females.
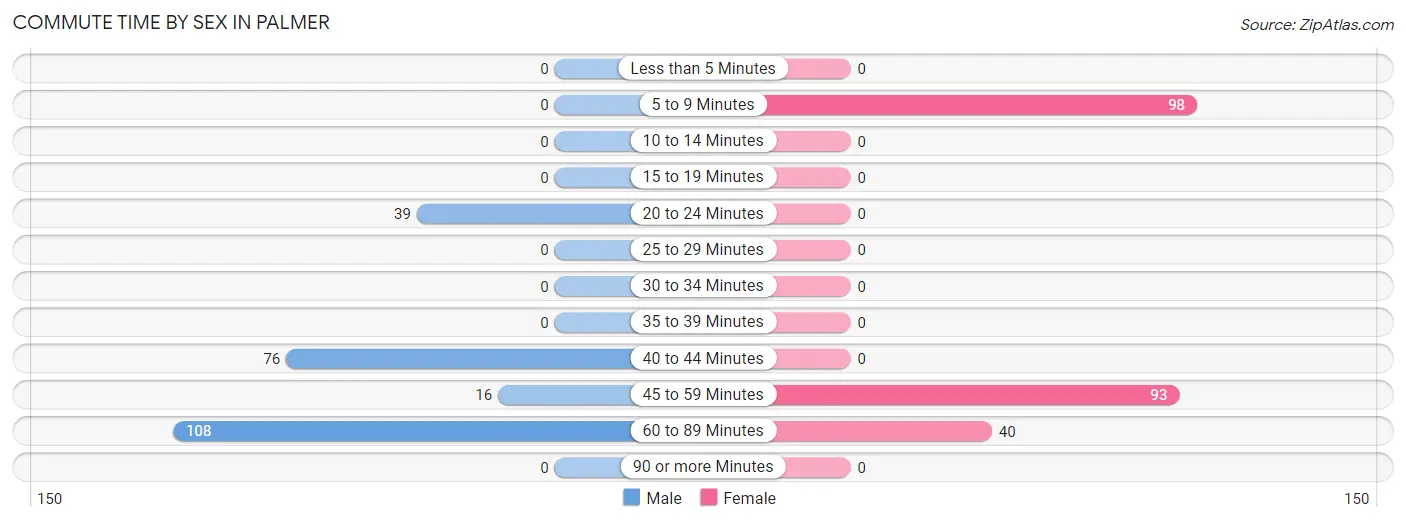
| Commute Time | Male | Female |
| Less than 5 Minutes | 0 (0.0%) | 0 (0.0%) |
| 5 to 9 Minutes | 0 (0.0%) | 98 (42.4%) |
| 10 to 14 Minutes | 0 (0.0%) | 0 (0.0%) |
| 15 to 19 Minutes | 0 (0.0%) | 0 (0.0%) |
| 20 to 24 Minutes | 39 (16.3%) | 0 (0.0%) |
| 25 to 29 Minutes | 0 (0.0%) | 0 (0.0%) |
| 30 to 34 Minutes | 0 (0.0%) | 0 (0.0%) |
| 35 to 39 Minutes | 0 (0.0%) | 0 (0.0%) |
| 40 to 44 Minutes | 76 (31.8%) | 0 (0.0%) |
| 45 to 59 Minutes | 16 (6.7%) | 93 (40.3%) |
| 60 to 89 Minutes | 108 (45.2%) | 40 (17.3%) |
| 90 or more Minutes | 0 (0.0%) | 0 (0.0%) |
Time of Departure to Work by Sex in Palmer
The most frequent times of departure to work in Palmer are 10:00 AM to 10:59 AM (76, 31.8%) for males and 7:30 AM to 7:59 AM (113, 48.9%) for females.
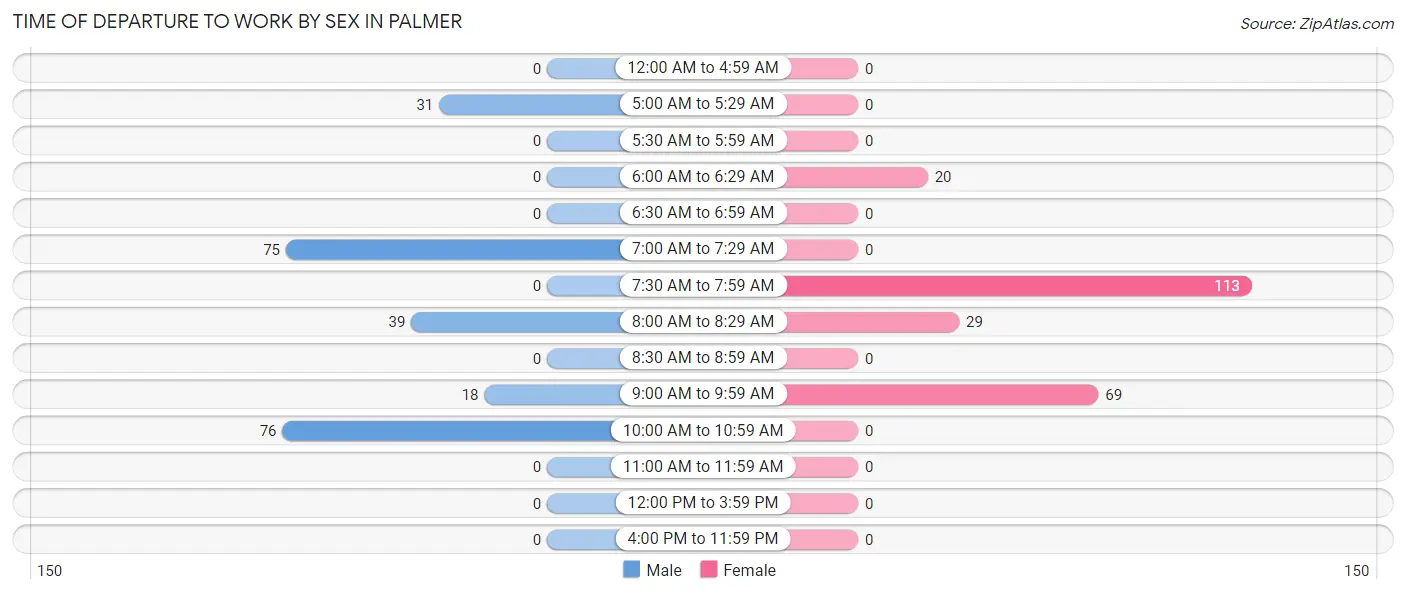
| Time of Departure | Male | Female |
| 12:00 AM to 4:59 AM | 0 (0.0%) | 0 (0.0%) |
| 5:00 AM to 5:29 AM | 31 (13.0%) | 0 (0.0%) |
| 5:30 AM to 5:59 AM | 0 (0.0%) | 0 (0.0%) |
| 6:00 AM to 6:29 AM | 0 (0.0%) | 20 (8.7%) |
| 6:30 AM to 6:59 AM | 0 (0.0%) | 0 (0.0%) |
| 7:00 AM to 7:29 AM | 75 (31.4%) | 0 (0.0%) |
| 7:30 AM to 7:59 AM | 0 (0.0%) | 113 (48.9%) |
| 8:00 AM to 8:29 AM | 39 (16.3%) | 29 (12.6%) |
| 8:30 AM to 8:59 AM | 0 (0.0%) | 0 (0.0%) |
| 9:00 AM to 9:59 AM | 18 (7.5%) | 69 (29.9%) |
| 10:00 AM to 10:59 AM | 76 (31.8%) | 0 (0.0%) |
| 11:00 AM to 11:59 AM | 0 (0.0%) | 0 (0.0%) |
| 12:00 PM to 3:59 PM | 0 (0.0%) | 0 (0.0%) |
| 4:00 PM to 11:59 PM | 0 (0.0%) | 0 (0.0%) |
| Total | 239 (100.0%) | 231 (100.0%) |
Housing Occupancy in Palmer
Occupancy by Ownership in Palmer
Of the total 386 dwellings in Palmer, owner-occupied units account for 226 (58.6%), while renter-occupied units make up 160 (41.4%).
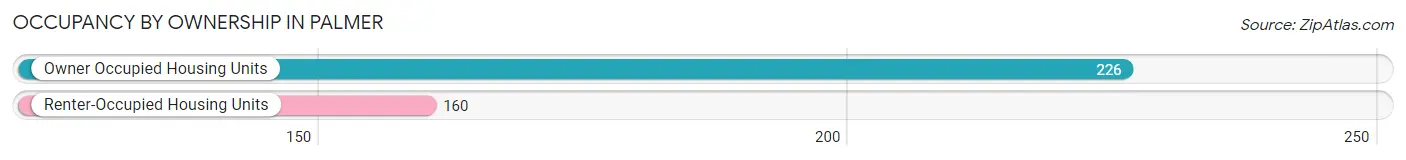
| Occupancy | # Housing Units | % Housing Units |
| Owner Occupied Housing Units | 226 | 58.6% |
| Renter-Occupied Housing Units | 160 | 41.4% |
| Total Occupied Housing Units | 386 | 100.0% |
Occupancy by Household Size in Palmer
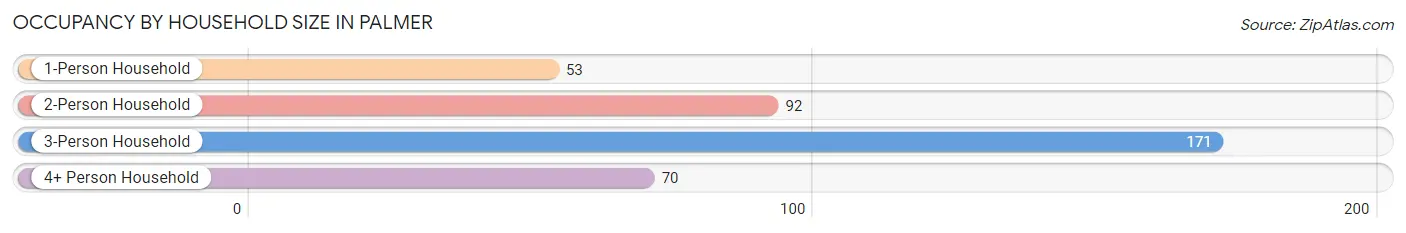
| Household Size | # Housing Units | % Housing Units |
| 1-Person Household | 53 | 13.7% |
| 2-Person Household | 92 | 23.8% |
| 3-Person Household | 171 | 44.3% |
| 4+ Person Household | 70 | 18.1% |
| Total Housing Units | 386 | 100.0% |
Occupancy by Ownership by Household Size in Palmer
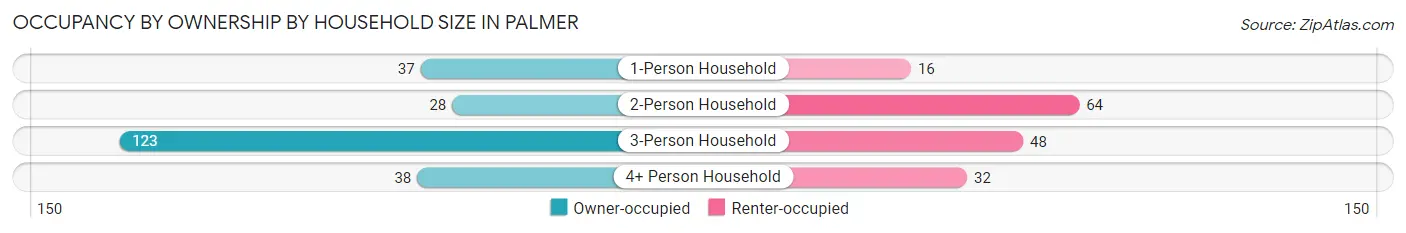
| Household Size | Owner-occupied | Renter-occupied |
| 1-Person Household | 37 (69.8%) | 16 (30.2%) |
| 2-Person Household | 28 (30.4%) | 64 (69.6%) |
| 3-Person Household | 123 (71.9%) | 48 (28.1%) |
| 4+ Person Household | 38 (54.3%) | 32 (45.7%) |
| Total Housing Units | 226 (58.6%) | 160 (41.4%) |
Occupancy by Educational Attainment in Palmer
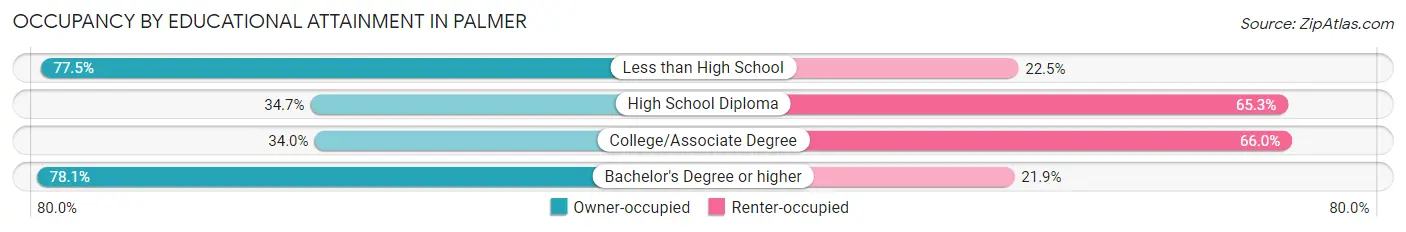
| Household Size | Owner-occupied | Renter-occupied |
| Less than High School | 110 (77.5%) | 32 (22.5%) |
| High School Diploma | 43 (34.7%) | 81 (65.3%) |
| College/Associate Degree | 16 (34.0%) | 31 (66.0%) |
| Bachelor's Degree or higher | 57 (78.1%) | 16 (21.9%) |
Occupancy by Age of Householder in Palmer
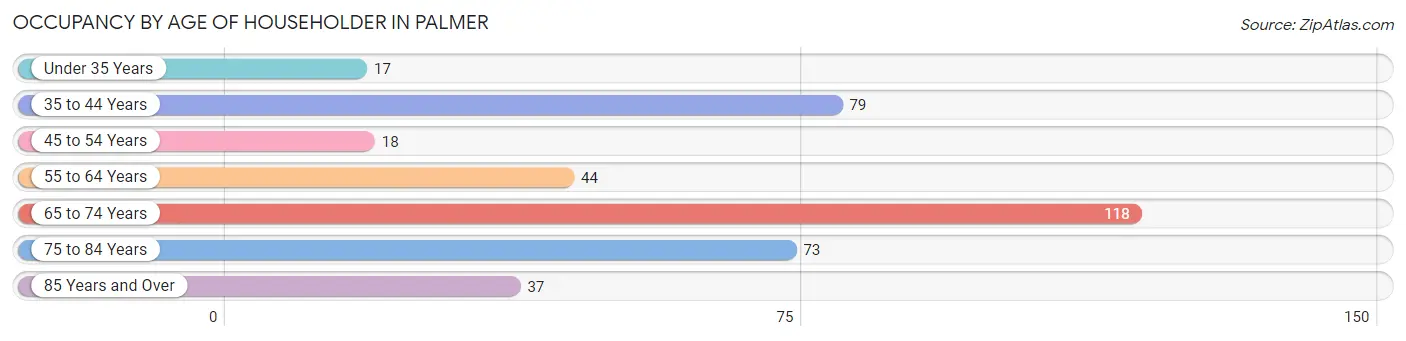
| Age Bracket | # Households | % Households |
| Under 35 Years | 17 | 4.4% |
| 35 to 44 Years | 79 | 20.5% |
| 45 to 54 Years | 18 | 4.7% |
| 55 to 64 Years | 44 | 11.4% |
| 65 to 74 Years | 118 | 30.6% |
| 75 to 84 Years | 73 | 18.9% |
| 85 Years and Over | 37 | 9.6% |
| Total | 386 | 100.0% |
Housing Finances in Palmer
Median Income by Occupancy in Palmer
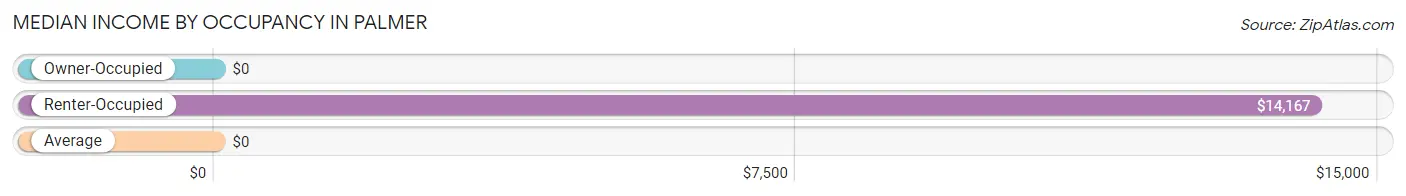
| Occupancy Type | # Households | Median Income |
| Owner-Occupied | 226 (58.6%) | $0 |
| Renter-Occupied | 160 (41.4%) | $14,167 |
| Average | 386 (100.0%) | $0 |
Occupancy by Householder Income Bracket in Palmer
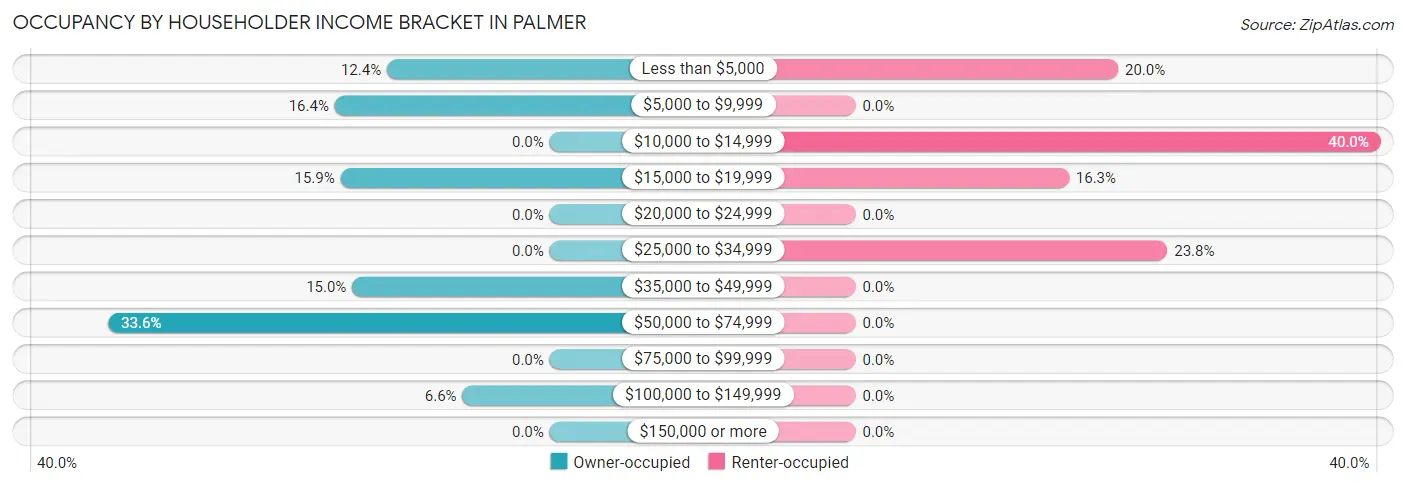
| Income Bracket | Owner-occupied | Renter-occupied |
| Less than $5,000 | 28 (12.4%) | 32 (20.0%) |
| $5,000 to $9,999 | 37 (16.4%) | 0 (0.0%) |
| $10,000 to $14,999 | 0 (0.0%) | 64 (40.0%) |
| $15,000 to $19,999 | 36 (15.9%) | 26 (16.3%) |
| $20,000 to $24,999 | 0 (0.0%) | 0 (0.0%) |
| $25,000 to $34,999 | 0 (0.0%) | 38 (23.7%) |
| $35,000 to $49,999 | 34 (15.0%) | 0 (0.0%) |
| $50,000 to $74,999 | 76 (33.6%) | 0 (0.0%) |
| $75,000 to $99,999 | 0 (0.0%) | 0 (0.0%) |
| $100,000 to $149,999 | 15 (6.6%) | 0 (0.0%) |
| $150,000 or more | 0 (0.0%) | 0 (0.0%) |
| Total | 226 (100.0%) | 160 (100.0%) |
Monthly Housing Cost Tiers in Palmer
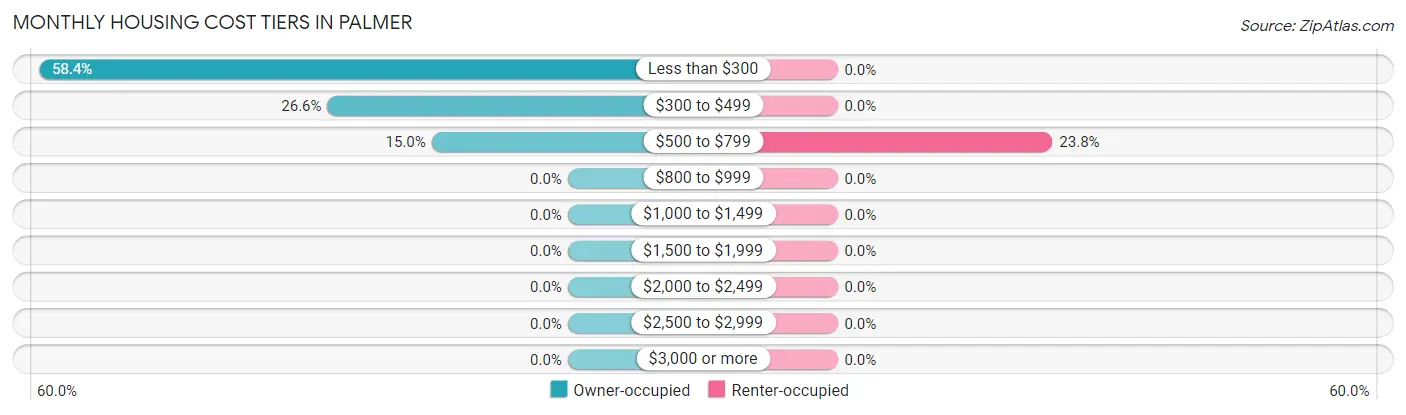
| Monthly Cost | Owner-occupied | Renter-occupied |
| Less than $300 | 132 (58.4%) | 0 (0.0%) |
| $300 to $499 | 60 (26.6%) | 0 (0.0%) |
| $500 to $799 | 34 (15.0%) | 38 (23.7%) |
| $800 to $999 | 0 (0.0%) | 0 (0.0%) |
| $1,000 to $1,499 | 0 (0.0%) | 0 (0.0%) |
| $1,500 to $1,999 | 0 (0.0%) | 0 (0.0%) |
| $2,000 to $2,499 | 0 (0.0%) | 0 (0.0%) |
| $2,500 to $2,999 | 0 (0.0%) | 0 (0.0%) |
| $3,000 or more | 0 (0.0%) | 0 (0.0%) |
| Total | 226 (100.0%) | 160 (100.0%) |
Physical Housing Characteristics in Palmer
Housing Structures in Palmer
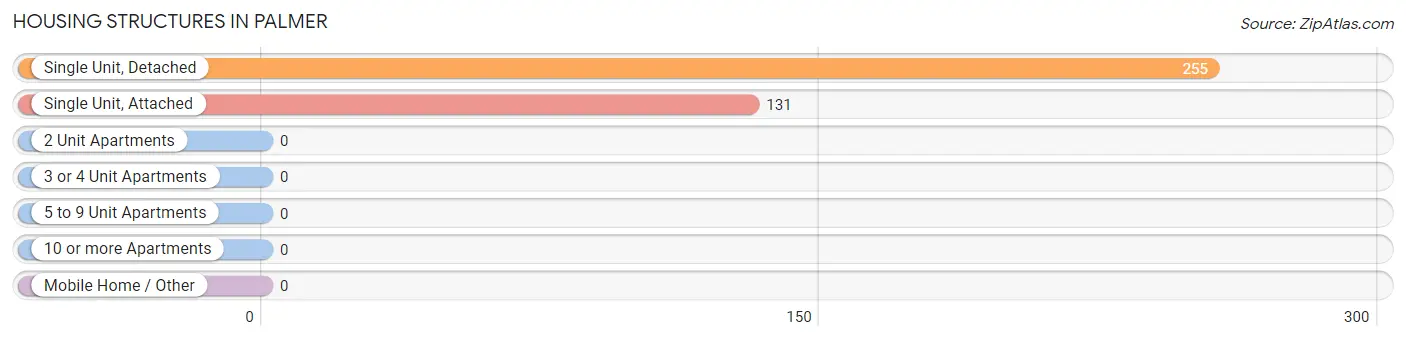
| Structure Type | # Housing Units | % Housing Units |
| Single Unit, Detached | 255 | 66.1% |
| Single Unit, Attached | 131 | 33.9% |
| 2 Unit Apartments | 0 | 0.0% |
| 3 or 4 Unit Apartments | 0 | 0.0% |
| 5 to 9 Unit Apartments | 0 | 0.0% |
| 10 or more Apartments | 0 | 0.0% |
| Mobile Home / Other | 0 | 0.0% |
| Total | 386 | 100.0% |
Housing Structures by Occupancy in Palmer
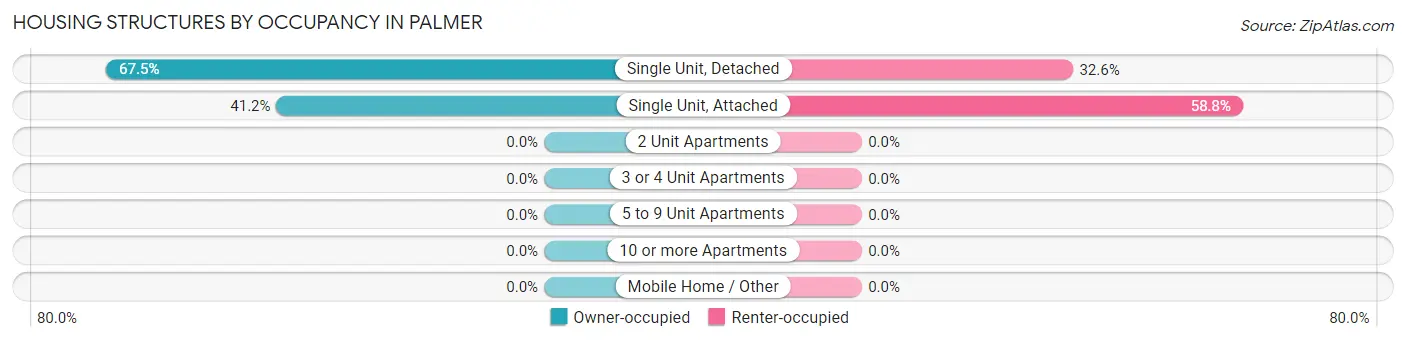
| Structure Type | Owner-occupied | Renter-occupied |
| Single Unit, Detached | 172 (67.4%) | 83 (32.6%) |
| Single Unit, Attached | 54 (41.2%) | 77 (58.8%) |
| 2 Unit Apartments | 0 (0.0%) | 0 (0.0%) |
| 3 or 4 Unit Apartments | 0 (0.0%) | 0 (0.0%) |
| 5 to 9 Unit Apartments | 0 (0.0%) | 0 (0.0%) |
| 10 or more Apartments | 0 (0.0%) | 0 (0.0%) |
| Mobile Home / Other | 0 (0.0%) | 0 (0.0%) |
| Total | 226 (58.6%) | 160 (41.4%) |
Housing Structures by Number of Rooms in Palmer
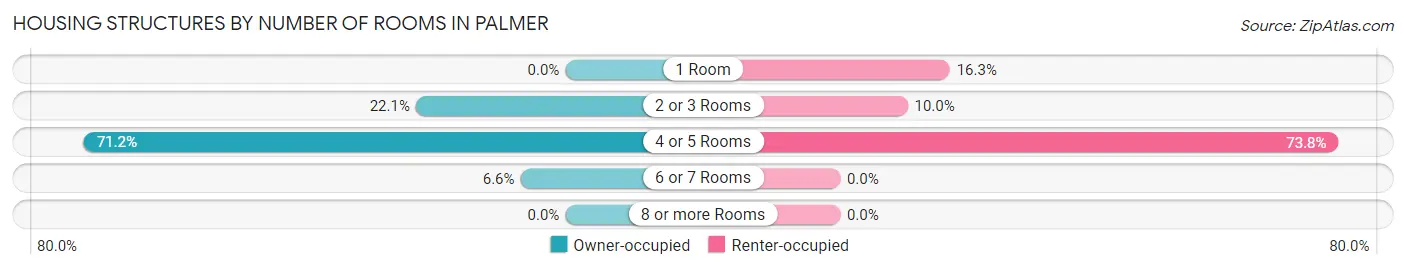
| Number of Rooms | Owner-occupied | Renter-occupied |
| 1 Room | 0 (0.0%) | 26 (16.3%) |
| 2 or 3 Rooms | 50 (22.1%) | 16 (10.0%) |
| 4 or 5 Rooms | 161 (71.2%) | 118 (73.8%) |
| 6 or 7 Rooms | 15 (6.6%) | 0 (0.0%) |
| 8 or more Rooms | 0 (0.0%) | 0 (0.0%) |
| Total | 226 (100.0%) | 160 (100.0%) |
Housing Structure by Heating Type in Palmer
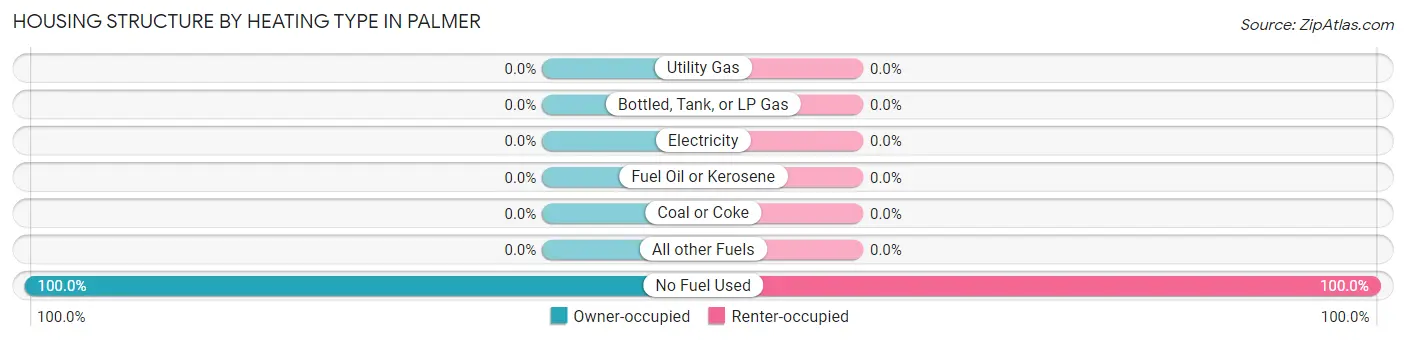
| Heating Type | Owner-occupied | Renter-occupied |
| Utility Gas | 0 (0.0%) | 0 (0.0%) |
| Bottled, Tank, or LP Gas | 0 (0.0%) | 0 (0.0%) |
| Electricity | 0 (0.0%) | 0 (0.0%) |
| Fuel Oil or Kerosene | 0 (0.0%) | 0 (0.0%) |
| Coal or Coke | 0 (0.0%) | 0 (0.0%) |
| All other Fuels | 0 (0.0%) | 0 (0.0%) |
| No Fuel Used | 226 (100.0%) | 160 (100.0%) |
| Total | 226 (100.0%) | 160 (100.0%) |
Household Vehicle Usage in Palmer
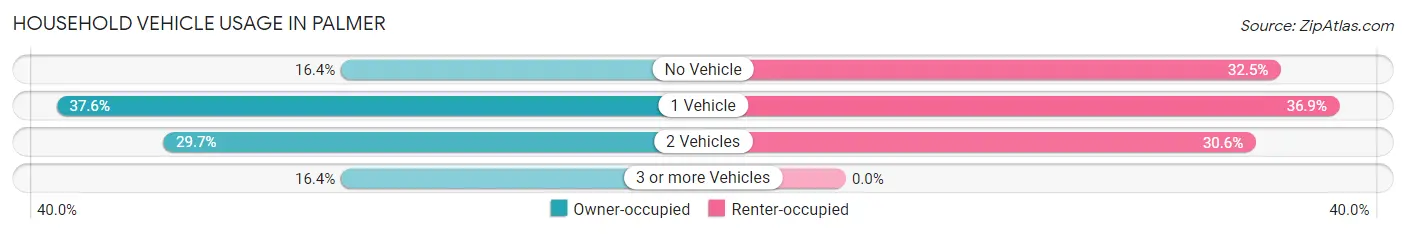
| Vehicles per Household | Owner-occupied | Renter-occupied |
| No Vehicle | 37 (16.4%) | 52 (32.5%) |
| 1 Vehicle | 85 (37.6%) | 59 (36.9%) |
| 2 Vehicles | 67 (29.6%) | 49 (30.6%) |
| 3 or more Vehicles | 37 (16.4%) | 0 (0.0%) |
| Total | 226 (100.0%) | 160 (100.0%) |
Real Estate & Mortgages in Palmer
Real Estate and Mortgage Overview in Palmer
| Characteristic | Without Mortgage | With Mortgage |
| Housing Units | 226 | 0 |
| Median Property Value | $112,500 | $0 |
| Median Household Income | - | - |
| Monthly Housing Costs | $278 | $0 |
| Real Estate Taxes | - | - |
Property Value by Mortgage Status in Palmer
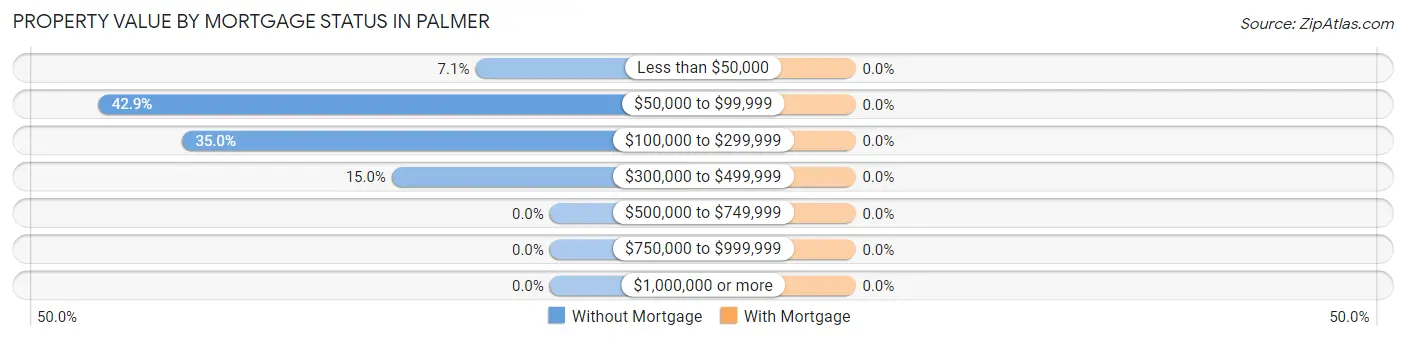
| Property Value | Without Mortgage | With Mortgage |
| Less than $50,000 | 16 (7.1%) | 0 (0.0%) |
| $50,000 to $99,999 | 97 (42.9%) | 0 (0.0%) |
| $100,000 to $299,999 | 79 (35.0%) | 0 (0.0%) |
| $300,000 to $499,999 | 34 (15.0%) | 0 (0.0%) |
| $500,000 to $749,999 | 0 (0.0%) | 0 (0.0%) |
| $750,000 to $999,999 | 0 (0.0%) | 0 (0.0%) |
| $1,000,000 or more | 0 (0.0%) | 0 (0.0%) |
| Total | 226 (100.0%) | 0 (0.0%) |
Household Income by Mortgage Status in Palmer
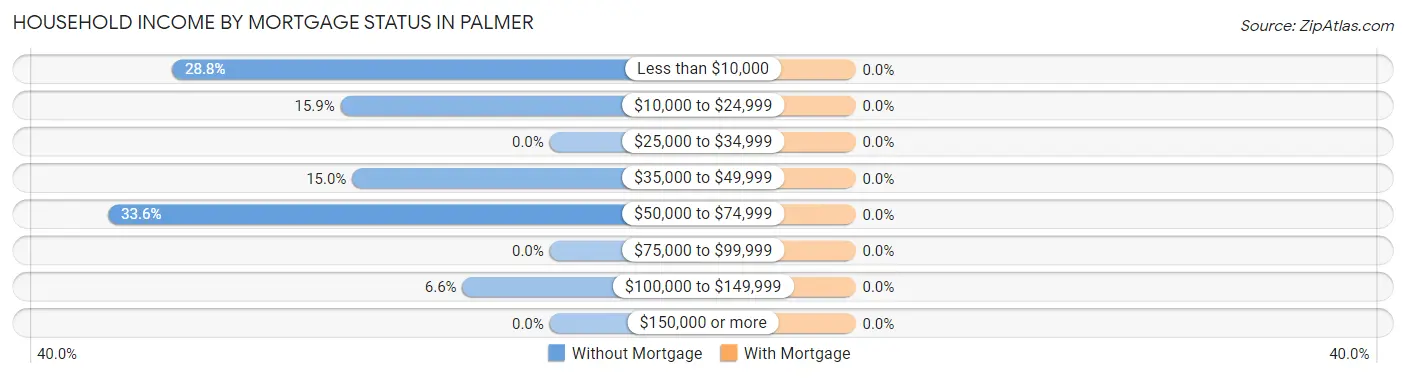
| Household Income | Without Mortgage | With Mortgage |
| Less than $10,000 | 65 (28.8%) | 0 (0.0%) |
| $10,000 to $24,999 | 36 (15.9%) | 0 (0.0%) |
| $25,000 to $34,999 | 0 (0.0%) | 0 (0.0%) |
| $35,000 to $49,999 | 34 (15.0%) | 0 (0.0%) |
| $50,000 to $74,999 | 76 (33.6%) | 0 (0.0%) |
| $75,000 to $99,999 | 0 (0.0%) | 0 (0.0%) |
| $100,000 to $149,999 | 15 (6.6%) | 0 (0.0%) |
| $150,000 or more | 0 (0.0%) | 0 (0.0%) |
| Total | 226 (100.0%) | 0 (0.0%) |
Property Value to Household Income Ratio in Palmer
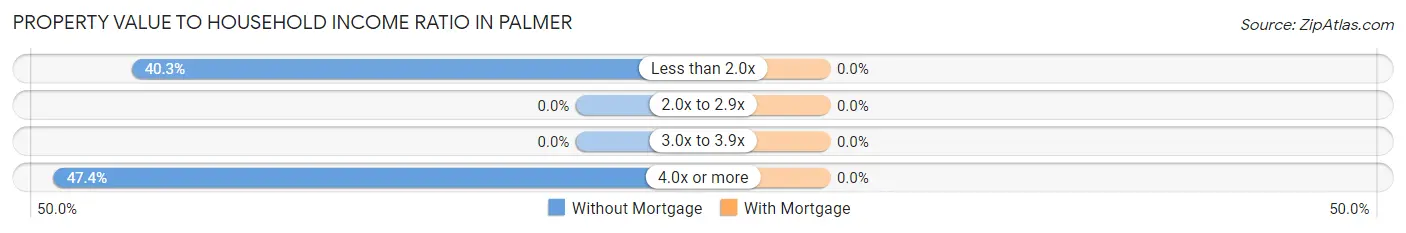
| Value-to-Income Ratio | Without Mortgage | With Mortgage |
| Less than 2.0x | 91 (40.3%) | 0 (0.0%) |
| 2.0x to 2.9x | 0 (0.0%) | 0 (0.0%) |
| 3.0x to 3.9x | 0 (0.0%) | 0 (0.0%) |
| 4.0x or more | 107 (47.3%) | 0 (0.0%) |
| Total | 226 (100.0%) | 0 (0.0%) |
Real Estate Taxes by Mortgage Status in Palmer
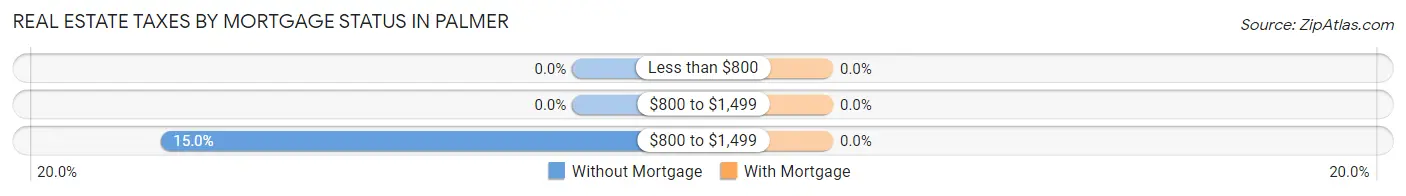
| Property Taxes | Without Mortgage | With Mortgage |
| Less than $800 | 0 (0.0%) | 0 (0.0%) |
| $800 to $1,499 | 0 (0.0%) | 0 (0.0%) |
| $800 to $1,499 | 34 (15.0%) | 0 (0.0%) |
| Total | 226 (100.0%) | 0 (0.0%) |
Health & Disability in Palmer
Health Insurance Coverage by Age in Palmer
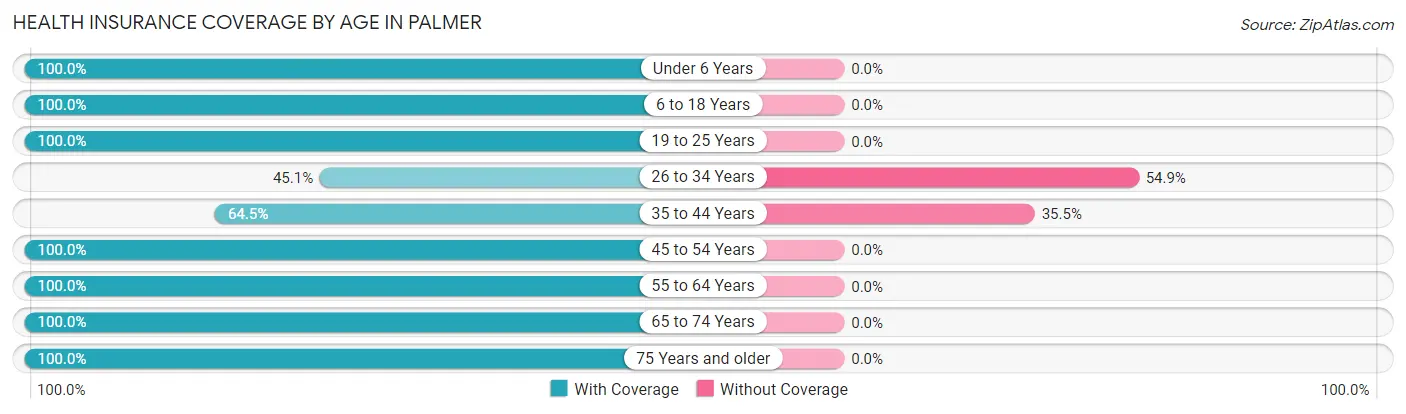
| Age Bracket | With Coverage | Without Coverage |
| Under 6 Years | 42 (100.0%) | 0 (0.0%) |
| 6 to 18 Years | 305 (100.0%) | 0 (0.0%) |
| 19 to 25 Years | 71 (100.0%) | 0 (0.0%) |
| 26 to 34 Years | 69 (45.1%) | 84 (54.9%) |
| 35 to 44 Years | 138 (64.5%) | 76 (35.5%) |
| 45 to 54 Years | 62 (100.0%) | 0 (0.0%) |
| 55 to 64 Years | 235 (100.0%) | 0 (0.0%) |
| 65 to 74 Years | 264 (100.0%) | 0 (0.0%) |
| 75 Years and older | 129 (100.0%) | 0 (0.0%) |
| Total | 1,315 (89.1%) | 160 (10.8%) |
Health Insurance Coverage by Citizenship Status in Palmer
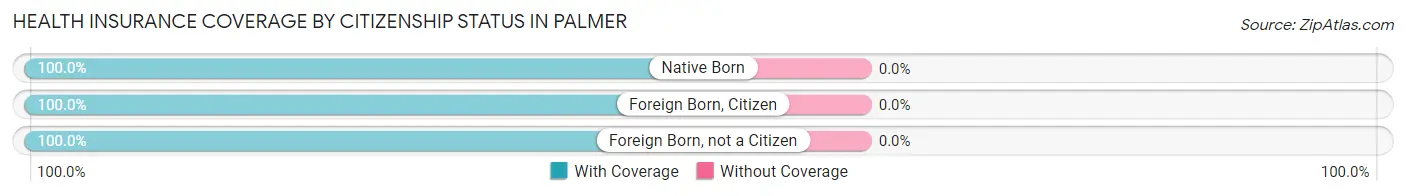
| Citizenship Status | With Coverage | Without Coverage |
| Native Born | 42 (100.0%) | 0 (0.0%) |
| Foreign Born, Citizen | 305 (100.0%) | 0 (0.0%) |
| Foreign Born, not a Citizen | 71 (100.0%) | 0 (0.0%) |
Health Insurance Coverage by Household Income in Palmer
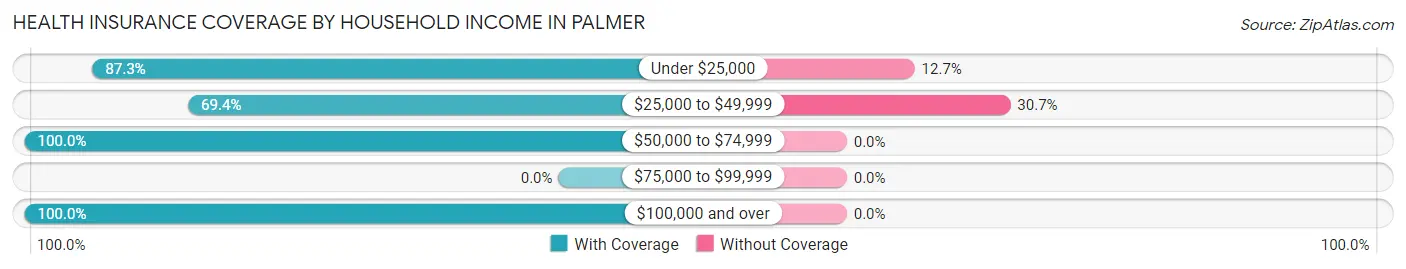
| Household Income | With Coverage | Without Coverage |
| Under $25,000 | 577 (87.3%) | 84 (12.7%) |
| $25,000 to $49,999 | 172 (69.4%) | 76 (30.6%) |
| $50,000 to $74,999 | 408 (100.0%) | 0 (0.0%) |
| $75,000 to $99,999 | 0 (0.0%) | 0 (0.0%) |
| $100,000 and over | 158 (100.0%) | 0 (0.0%) |
Public vs Private Health Insurance Coverage by Age in Palmer
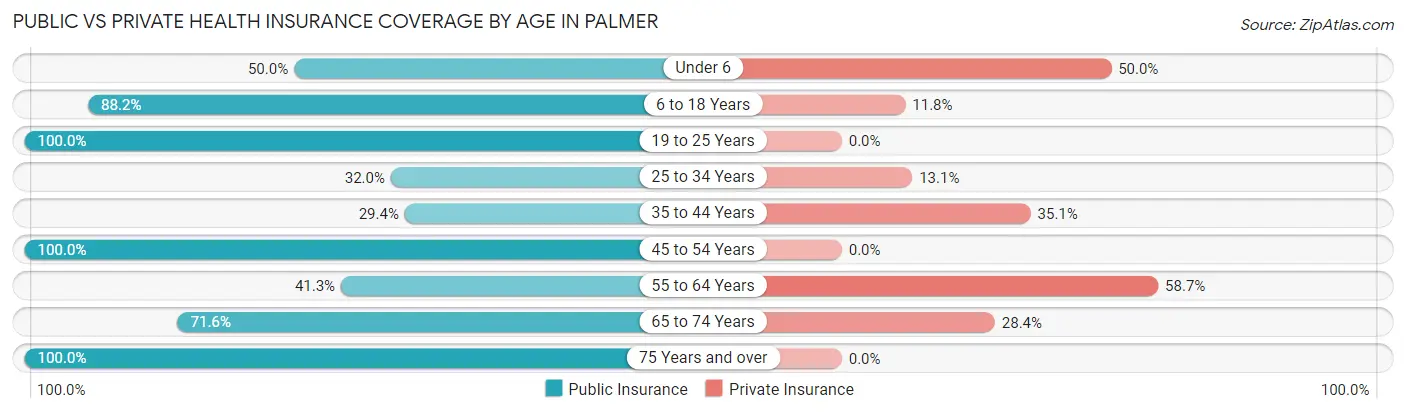
| Age Bracket | Public Insurance | Private Insurance |
| Under 6 | 21 (50.0%) | 21 (50.0%) |
| 6 to 18 Years | 269 (88.2%) | 36 (11.8%) |
| 19 to 25 Years | 71 (100.0%) | 0 (0.0%) |
| 25 to 34 Years | 49 (32.0%) | 20 (13.1%) |
| 35 to 44 Years | 63 (29.4%) | 75 (35.0%) |
| 45 to 54 Years | 62 (100.0%) | 0 (0.0%) |
| 55 to 64 Years | 97 (41.3%) | 138 (58.7%) |
| 65 to 74 Years | 189 (71.6%) | 75 (28.4%) |
| 75 Years and over | 129 (100.0%) | 0 (0.0%) |
| Total | 950 (64.4%) | 365 (24.7%) |
Disability Status by Sex by Age in Palmer
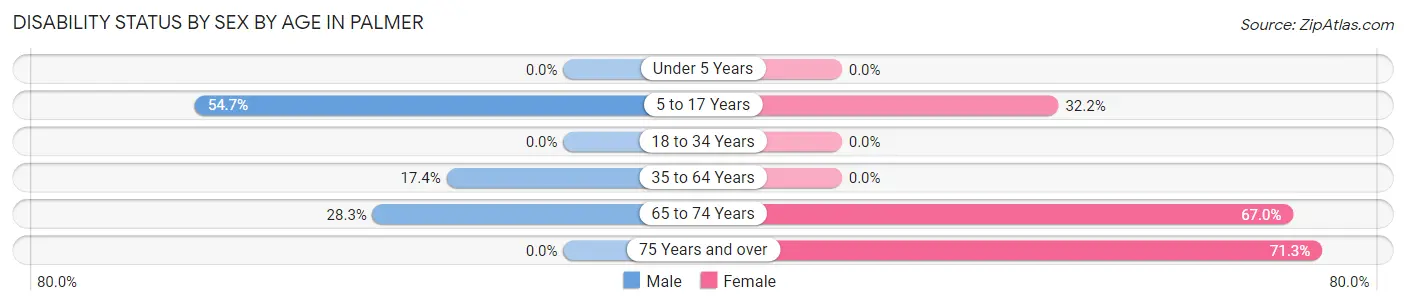
| Age Bracket | Male | Female |
| Under 5 Years | 0 (0.0%) | 0 (0.0%) |
| 5 to 17 Years | 58 (54.7%) | 56 (32.2%) |
| 18 to 34 Years | 0 (0.0%) | 0 (0.0%) |
| 35 to 64 Years | 34 (17.3%) | 0 (0.0%) |
| 65 to 74 Years | 49 (28.3%) | 61 (67.0%) |
| 75 Years and over | 0 (0.0%) | 92 (71.3%) |
Disability Class by Sex by Age in Palmer
Disability Class: Hearing Difficulty
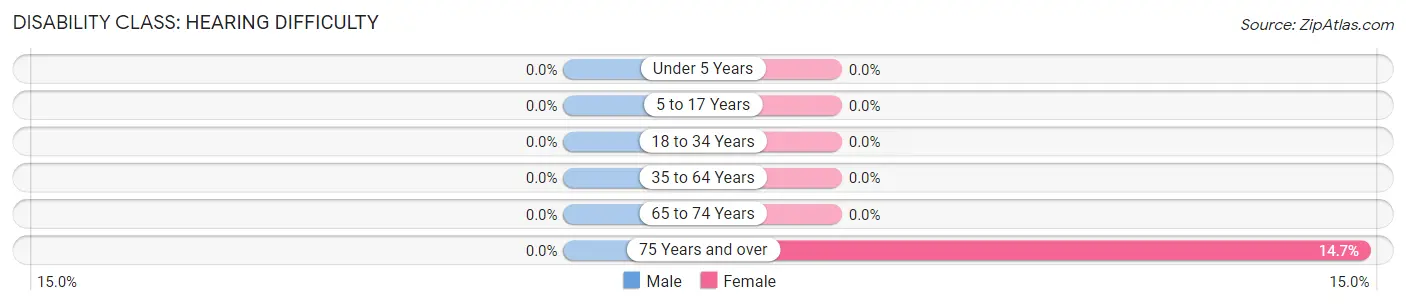
| Age Bracket | Male | Female |
| Under 5 Years | 0 (0.0%) | 0 (0.0%) |
| 5 to 17 Years | 0 (0.0%) | 0 (0.0%) |
| 18 to 34 Years | 0 (0.0%) | 0 (0.0%) |
| 35 to 64 Years | 0 (0.0%) | 0 (0.0%) |
| 65 to 74 Years | 0 (0.0%) | 0 (0.0%) |
| 75 Years and over | 0 (0.0%) | 19 (14.7%) |
Disability Class: Vision Difficulty
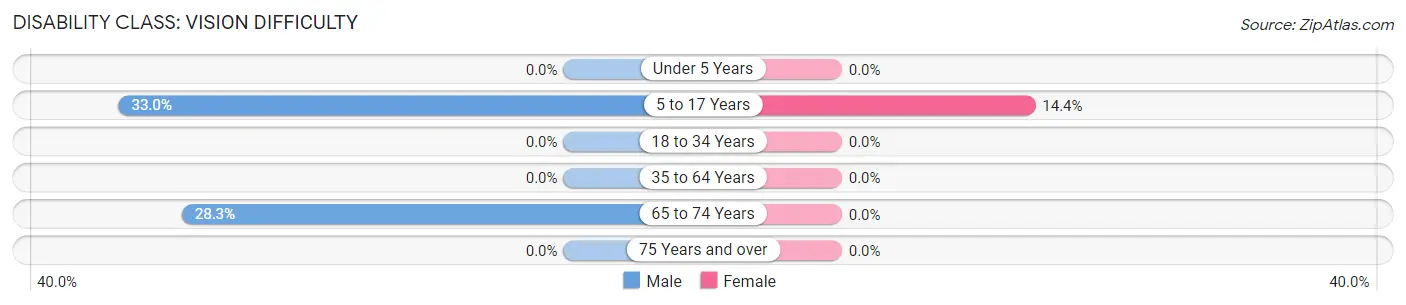
| Age Bracket | Male | Female |
| Under 5 Years | 0 (0.0%) | 0 (0.0%) |
| 5 to 17 Years | 35 (33.0%) | 25 (14.4%) |
| 18 to 34 Years | 0 (0.0%) | 0 (0.0%) |
| 35 to 64 Years | 0 (0.0%) | 0 (0.0%) |
| 65 to 74 Years | 49 (28.3%) | 0 (0.0%) |
| 75 Years and over | 0 (0.0%) | 0 (0.0%) |
Disability Class: Cognitive Difficulty
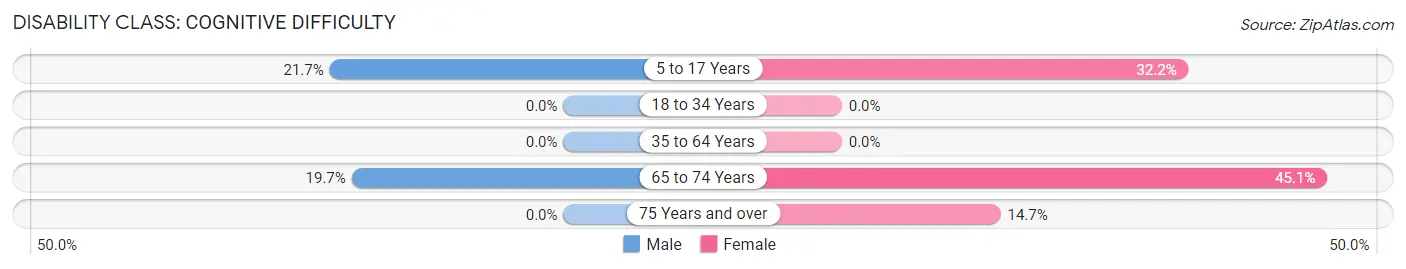
| Age Bracket | Male | Female |
| 5 to 17 Years | 23 (21.7%) | 56 (32.2%) |
| 18 to 34 Years | 0 (0.0%) | 0 (0.0%) |
| 35 to 64 Years | 0 (0.0%) | 0 (0.0%) |
| 65 to 74 Years | 34 (19.7%) | 41 (45.1%) |
| 75 Years and over | 0 (0.0%) | 19 (14.7%) |
Disability Class: Ambulatory Difficulty
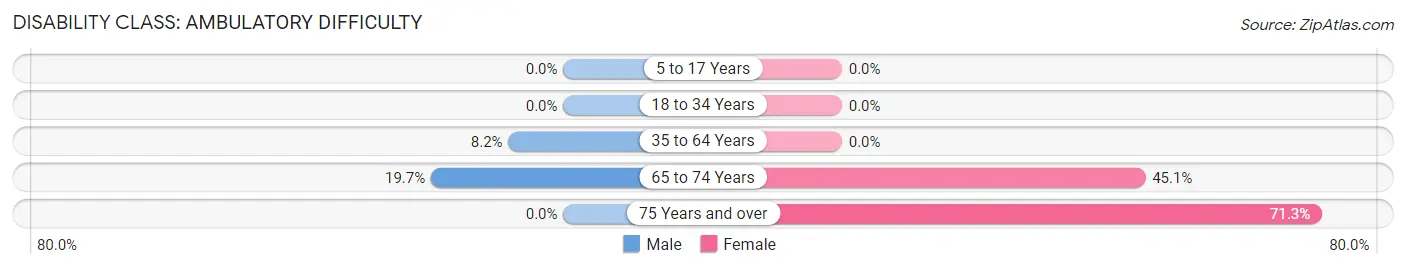
| Age Bracket | Male | Female |
| 5 to 17 Years | 0 (0.0%) | 0 (0.0%) |
| 18 to 34 Years | 0 (0.0%) | 0 (0.0%) |
| 35 to 64 Years | 16 (8.2%) | 0 (0.0%) |
| 65 to 74 Years | 34 (19.7%) | 41 (45.1%) |
| 75 Years and over | 0 (0.0%) | 92 (71.3%) |
Disability Class: Self-Care Difficulty
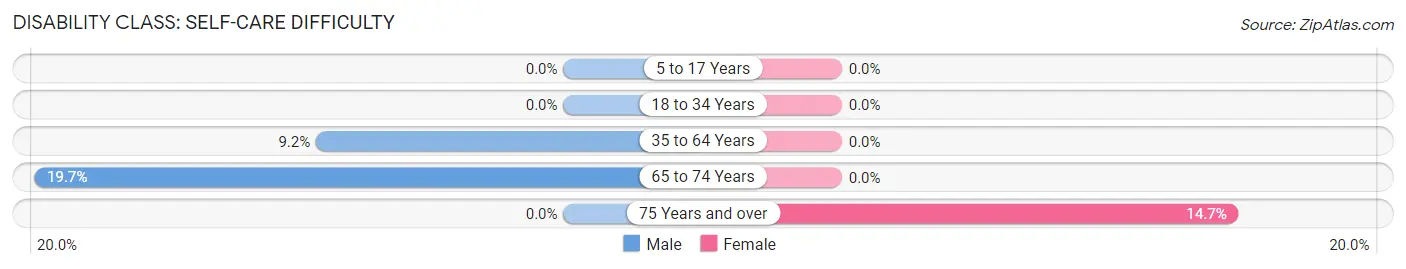
| Age Bracket | Male | Female |
| 5 to 17 Years | 0 (0.0%) | 0 (0.0%) |
| 18 to 34 Years | 0 (0.0%) | 0 (0.0%) |
| 35 to 64 Years | 18 (9.2%) | 0 (0.0%) |
| 65 to 74 Years | 34 (19.7%) | 0 (0.0%) |
| 75 Years and over | 0 (0.0%) | 19 (14.7%) |
Technology Access in Palmer
Computing Device Access in Palmer
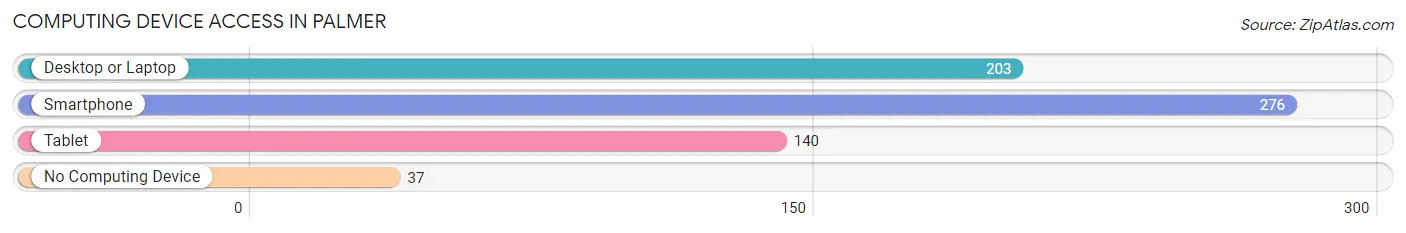
| Device Type | # Households | % Households |
| Desktop or Laptop | 203 | 52.6% |
| Smartphone | 276 | 71.5% |
| Tablet | 140 | 36.3% |
| No Computing Device | 37 | 9.6% |
| Total | 386 | 100.0% |
Internet Access in Palmer
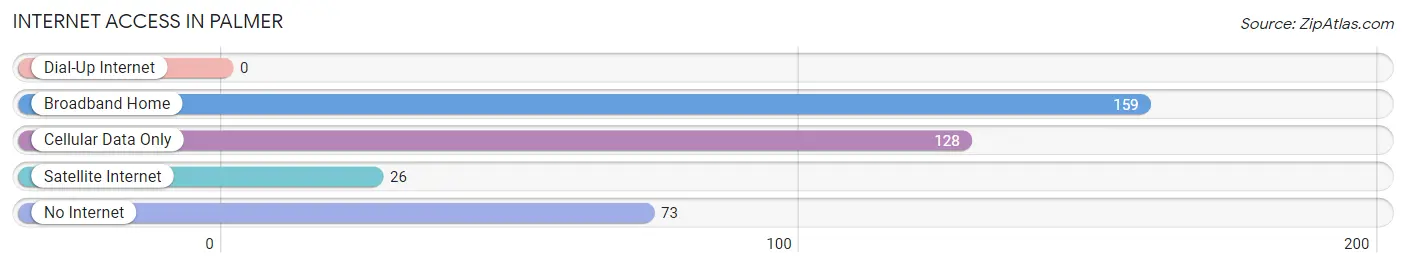
| Internet Type | # Households | % Households |
| Dial-Up Internet | 0 | 0.0% |
| Broadband Home | 159 | 41.2% |
| Cellular Data Only | 128 | 33.2% |
| Satellite Internet | 26 | 6.7% |
| No Internet | 73 | 18.9% |
| Total | 386 | 100.0% |
Palmer Summary
Palmer is a town located in the state of Massachusetts in the United States of America. It is located in Hampden County and is part of the Springfield, Massachusetts Metropolitan Statistical Area. The town has a population of 12,140 as of the 2010 census.
History
The area that is now Palmer was originally inhabited by the Nipmuc tribe. The town was first settled in 1716 and was officially incorporated in 1775. The town was named after Chief Justice of the Province of Massachusetts Bay, Chief Justice Palmer.
The town was an agricultural community for much of its history. In the 19th century, the town was known for its production of woolen goods. The town also had a number of mills, including a paper mill, a grist mill, and a saw mill.
In the late 19th century, the town began to experience industrial growth. The town was home to a number of factories, including a cotton mill, a shoe factory, and a paper mill. The town also had a number of tanneries.
Geography
Palmer is located in Hampden County in the state of Massachusetts. The town is located in the Pioneer Valley region of the state. The town is bordered by the towns of Ware, Monson, Wilbraham, and Brimfield.
The town has a total area of 24.2 square miles, of which 24.1 square miles is land and 0.1 square miles is water. The town is located in the Connecticut River Valley and is drained by the Quaboag River.
Economy
The economy of Palmer is largely based on manufacturing and services. The town is home to a number of factories, including a paper mill, a shoe factory, and a cotton mill. The town also has a number of retail stores and restaurants.
The town is also home to a number of businesses, including a number of medical and dental offices, a number of banks, and a number of insurance companies. The town is also home to a number of educational institutions, including a community college and a number of private schools.
Demographics
As of the 2010 census, the town had a population of 12,140. The racial makeup of the town was 94.3% White, 1.7% African American, 0.3% Native American, 1.2% Asian, 0.1% Pacific Islander, 1.2% from other races, and 1.4% from two or more races. Hispanic or Latino of any race were 3.2% of the population.
The median income for a household in the town was $50,945 and the median income for a family was $60,945. The per capita income for the town was $24,945. About 6.3% of families and 8.2% of the population were below the poverty line, including 10.2% of those under age 18 and 6.2% of those age 65 or over.
Common Questions
What is Per Capita Income in Palmer?
Per Capita income in Palmer is $11,111.
What is Inequality or Gini Index in Palmer?
Inequality or Gini Index in Palmer is 0.52.
What is the Total Population of Palmer?
Total Population of Palmer is 1,475.
What is the Total Male Population of Palmer?
Total Male Population of Palmer is 545.
What is the Total Female Population of Palmer?
Total Female Population of Palmer is 930.
What is the Ratio of Males per 100 Females in Palmer?
There are 58.60 Males per 100 Females in Palmer.
What is the Ratio of Females per 100 Males in Palmer?
There are 170.64 Females per 100 Males in Palmer.
What is the Median Population Age in Palmer?
Median Population Age in Palmer is 44.4 Years.
What is the Average Family Size in Palmer
Average Family Size in Palmer is 4.3 People.
What is the Average Household Size in Palmer
Average Household Size in Palmer is 3.8 People.
How Large is the Labor Force in Palmer?
There are 766 People in the Labor Forcein in Palmer.
What is the Percentage of People in the Labor Force in Palmer?
60.0% of People are in the Labor Force in Palmer.
What is the Unemployment Rate in Palmer?
Unemployment Rate in Palmer is 25.5%.