Mora, PR Map & Demographics
Mora Map
Mora Overview
$11,740
PER CAPITA INCOME
$17,143
AVG FAMILY INCOME
$18,145
AVG HOUSEHOLD INCOME
0.55
INEQUALITY / GINI INDEX
1,337
TOTAL POPULATION
827
MALE POPULATION
510
FEMALE POPULATION
162.16
MALES / 100 FEMALES
61.67
FEMALES / 100 MALES
49.4
MEDIAN AGE
3.3
AVG FAMILY SIZE
2.6
AVG HOUSEHOLD SIZE
334
LABOR FORCE [ PEOPLE ]
27.7%
PERCENT IN LABOR FORCE
9.3%
UNEMPLOYMENT RATE
Income in Mora
Income Overview in Mora
Per Capita Income in Mora is $11,740, while median incomes of families and households are $17,143 and $18,145 respectively.
| Characteristic | Number | Measure |
| Per Capita Income | 1,337 | $11,740 |
| Median Family Income | 330 | $17,143 |
| Mean Family Income | 330 | $18,332 |
| Median Household Income | 492 | $18,145 |
| Mean Household Income | 492 | $25,993 |
| Income Deficit | 330 | $0 |
| Wage / Income Gap (%) | 1,337 | 0.00% |
| Wage / Income Gap ($) | 1,337 | 100.00¢ per $1 |
| Gini / Inequality Index | 1,337 | 0.55 |
Earnings by Sex in Mora
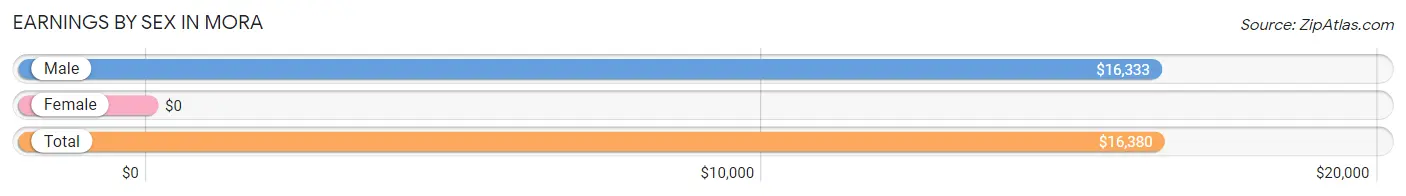
| Sex | Number | Average Earnings |
| Male | 211 (69.6%) | $16,333 |
| Female | 92 (30.4%) | $0 |
| Total | 303 (100.0%) | $16,380 |
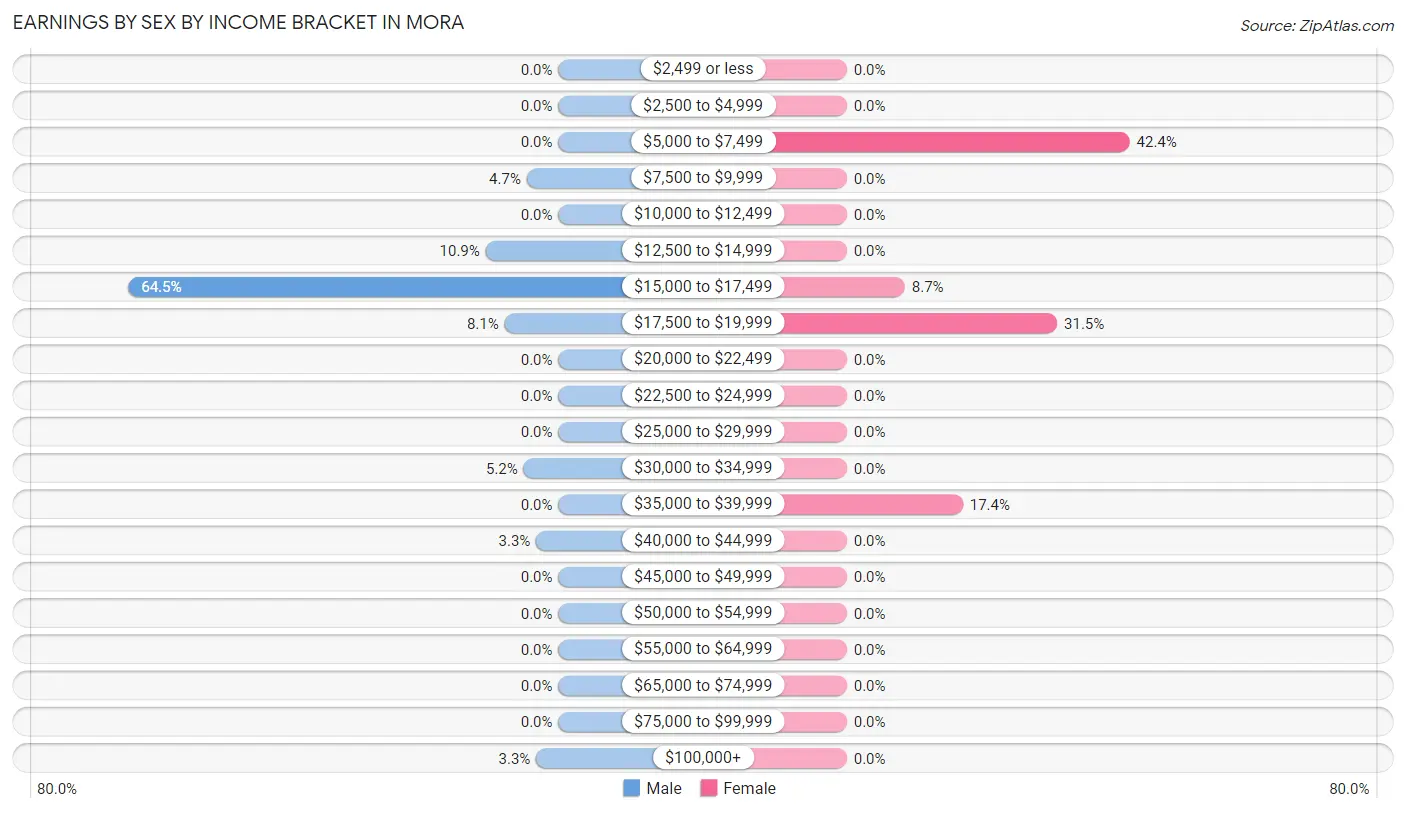
Earnings by Sex by Income Bracket in Mora
The most common earnings brackets in Mora are $15,000 to $17,499 for men (136 | 64.4%) and $5,000 to $7,499 for women (39 | 42.4%).
| Income | Male | Female |
| $2,499 or less | 0 (0.0%) | 0 (0.0%) |
| $2,500 to $4,999 | 0 (0.0%) | 0 (0.0%) |
| $5,000 to $7,499 | 0 (0.0%) | 39 (42.4%) |
| $7,500 to $9,999 | 10 (4.7%) | 0 (0.0%) |
| $10,000 to $12,499 | 0 (0.0%) | 0 (0.0%) |
| $12,500 to $14,999 | 23 (10.9%) | 0 (0.0%) |
| $15,000 to $17,499 | 136 (64.4%) | 8 (8.7%) |
| $17,500 to $19,999 | 17 (8.1%) | 29 (31.5%) |
| $20,000 to $22,499 | 0 (0.0%) | 0 (0.0%) |
| $22,500 to $24,999 | 0 (0.0%) | 0 (0.0%) |
| $25,000 to $29,999 | 0 (0.0%) | 0 (0.0%) |
| $30,000 to $34,999 | 11 (5.2%) | 0 (0.0%) |
| $35,000 to $39,999 | 0 (0.0%) | 16 (17.4%) |
| $40,000 to $44,999 | 7 (3.3%) | 0 (0.0%) |
| $45,000 to $49,999 | 0 (0.0%) | 0 (0.0%) |
| $50,000 to $54,999 | 0 (0.0%) | 0 (0.0%) |
| $55,000 to $64,999 | 0 (0.0%) | 0 (0.0%) |
| $65,000 to $74,999 | 0 (0.0%) | 0 (0.0%) |
| $75,000 to $99,999 | 0 (0.0%) | 0 (0.0%) |
| $100,000+ | 7 (3.3%) | 0 (0.0%) |
| Total | 211 (100.0%) | 92 (100.0%) |
Earnings by Sex by Educational Attainment in Mora
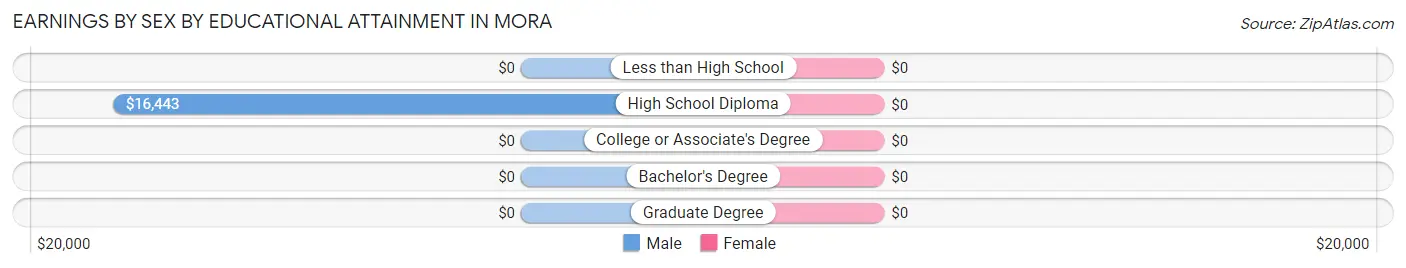
| Educational Attainment | Male Income | Female Income |
| Less than High School | - | - |
| High School Diploma | $16,443 | $0 |
| College or Associate's Degree | - | - |
| Bachelor's Degree | - | - |
| Graduate Degree | - | - |
| Total | $16,333 | $18,448 |
Family Income in Mora
Family Income Brackets in Mora
According to the Mora family income data, there are 90 families falling into the $15,000 to $24,999 income range, which is the most common income bracket and makes up 27.3% of all families.
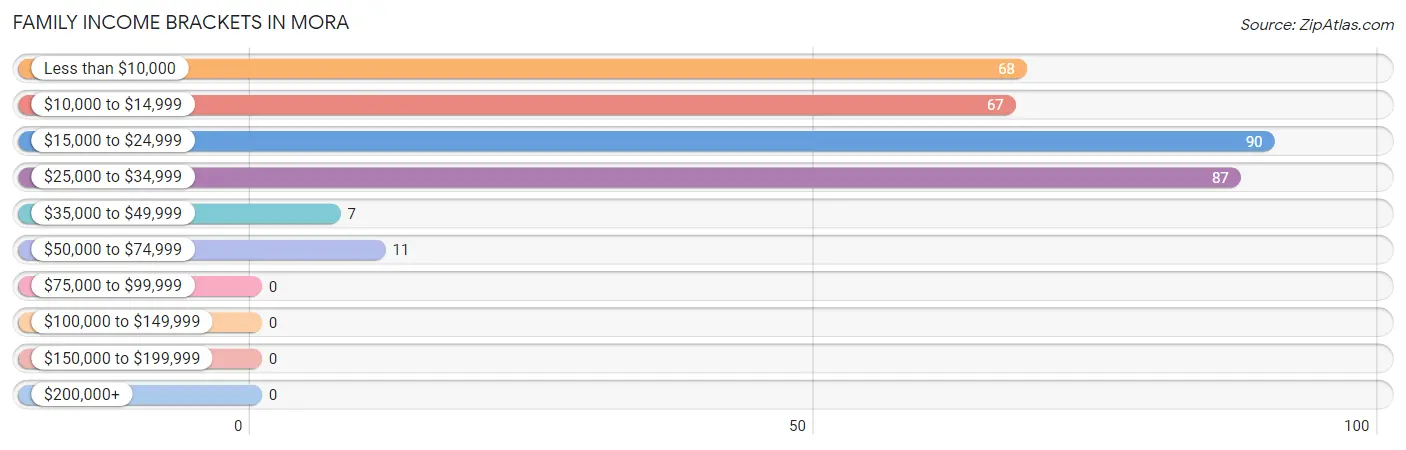
| Income Bracket | # Families | % Families |
| Less than $10,000 | 68 | 20.6% |
| $10,000 to $14,999 | 67 | 20.3% |
| $15,000 to $24,999 | 90 | 27.3% |
| $25,000 to $34,999 | 87 | 26.4% |
| $35,000 to $49,999 | 7 | 2.1% |
| $50,000 to $74,999 | 11 | 3.3% |
| $75,000 to $99,999 | 0 | 0.0% |
| $100,000 to $149,999 | 0 | 0.0% |
| $150,000 to $199,999 | 0 | 0.0% |
| $200,000+ | 0 | 0.0% |
Family Income by Famaliy Size in Mora
2-person families (212 | 64.2%) account for the highest median family income in Mora with $17,429 per family, while 2-person families (212 | 64.2%) have the highest median income of $8,714 per family member.
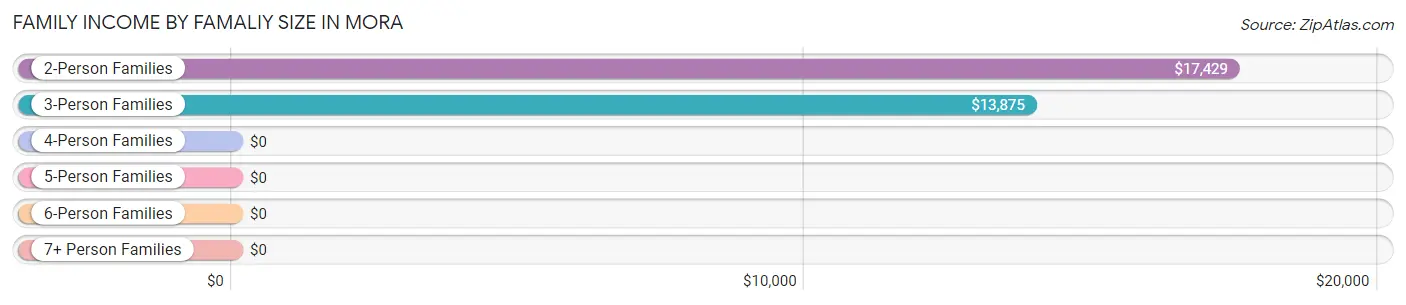
| Income Bracket | # Families | Median Income |
| 2-Person Families | 212 (64.2%) | $17,429 |
| 3-Person Families | 83 (25.2%) | $13,875 |
| 4-Person Families | 18 (5.4%) | $0 |
| 5-Person Families | 17 (5.1%) | $0 |
| 6-Person Families | 0 (0.0%) | $0 |
| 7+ Person Families | 0 (0.0%) | $0 |
| Total | 330 (100.0%) | $17,143 |
Family Income by Number of Earners in Mora
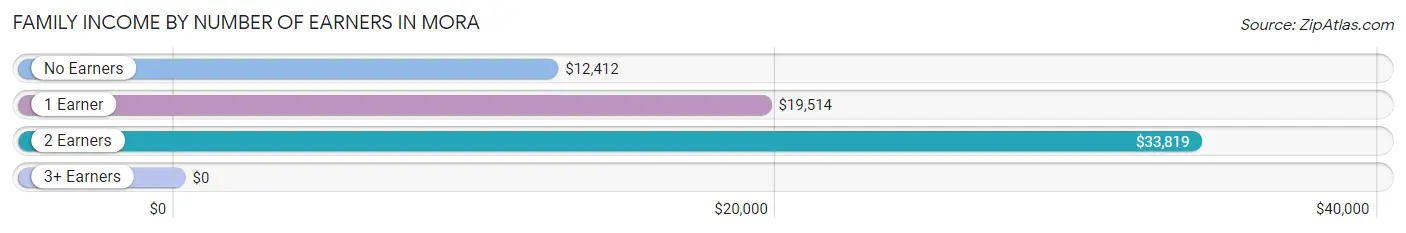
| Number of Earners | # Families | Median Income |
| No Earners | 246 (74.6%) | $12,412 |
| 1 Earner | 45 (13.6%) | $19,514 |
| 2 Earners | 39 (11.8%) | $33,819 |
| 3+ Earners | 0 (0.0%) | $0 |
| Total | 330 (100.0%) | $17,143 |
Household Income in Mora
Household Income Brackets in Mora
With 121 households falling in the category, the less than $10,000 income range is the most frequent in Mora, accounting for 24.6% of all households.
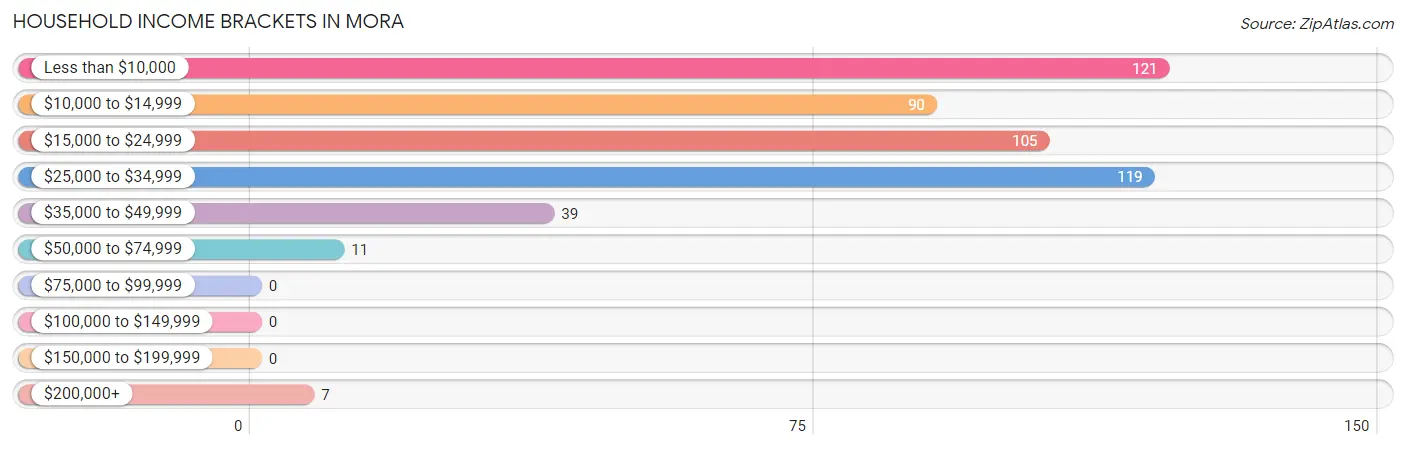
| Income Bracket | # Households | % Households |
| Less than $10,000 | 121 | 24.6% |
| $10,000 to $14,999 | 90 | 18.3% |
| $15,000 to $24,999 | 105 | 21.3% |
| $25,000 to $34,999 | 119 | 24.2% |
| $35,000 to $49,999 | 39 | 7.9% |
| $50,000 to $74,999 | 11 | 2.2% |
| $75,000 to $99,999 | 0 | 0.0% |
| $100,000 to $149,999 | 0 | 0.0% |
| $150,000 to $199,999 | 0 | 0.0% |
| $200,000+ | 7 | 1.4% |
Household Income by Householder Age in Mora
The median household income in Mora is $18,145, with the highest median household income of $20,880 found in the 45 to 64 years age bracket for the primary householder. A total of 239 households (48.6%) fall into this category. Meanwhile, the 15 to 24 years age bracket for the primary householder has the lowest median household income of $0, with 3 households (0.6%) in this group.
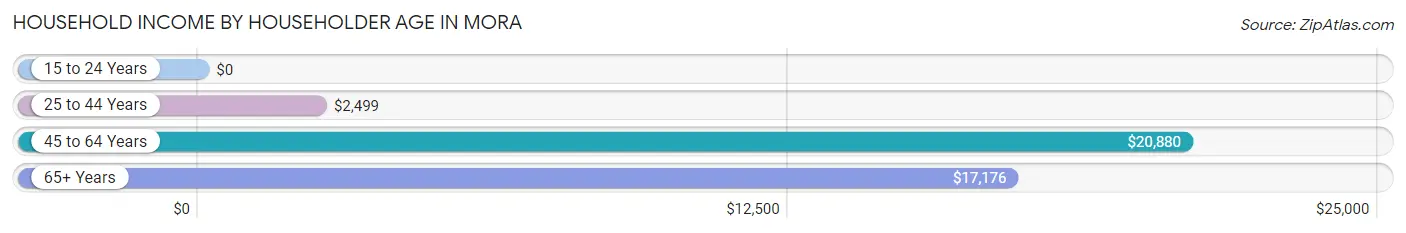
| Income Bracket | # Households | Median Income |
| 15 to 24 Years | 3 (0.6%) | $0 |
| 25 to 44 Years | 61 (12.4%) | $2,499 |
| 45 to 64 Years | 239 (48.6%) | $20,880 |
| 65+ Years | 189 (38.4%) | $17,176 |
| Total | 492 (100.0%) | $18,145 |
Poverty in Mora
Income Below Poverty by Sex and Age in Mora
With 58.7% poverty level for males and 58.1% for females among the residents of Mora, 6 to 11 year old males and under 5 year old females are the most vulnerable to poverty, with 17 males (100.0%) and 9 females (100.0%) in their respective age groups living below the poverty level.
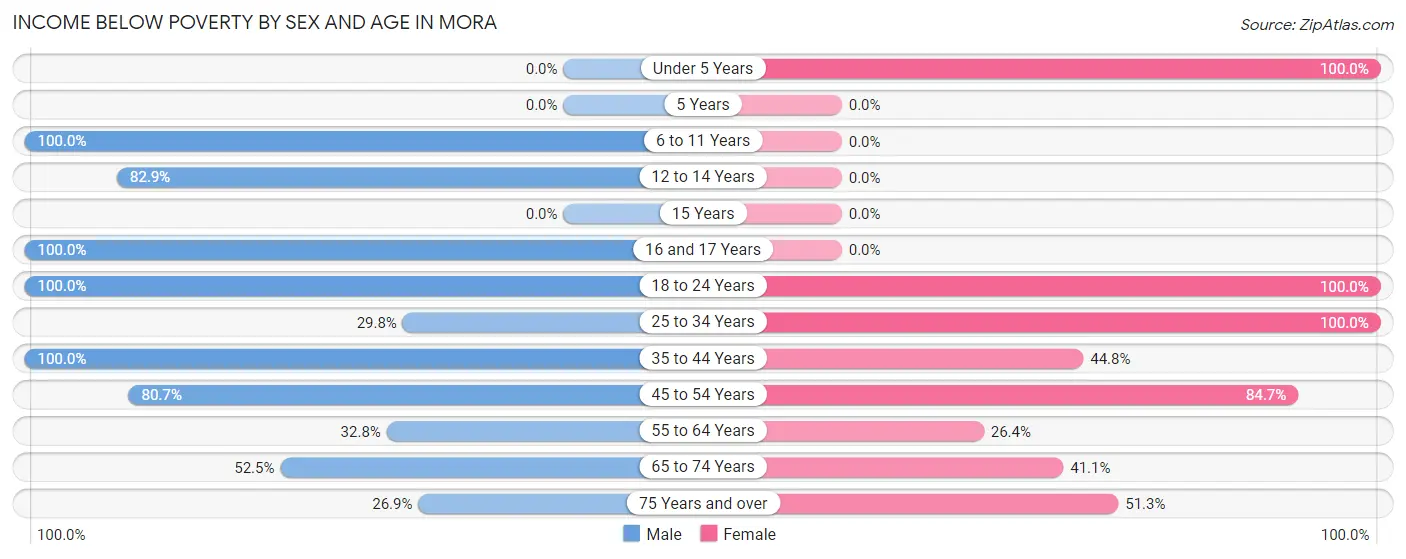
| Age Bracket | Male | Female |
| Under 5 Years | 0 (0.0%) | 9 (100.0%) |
| 5 Years | 0 (0.0%) | 0 (0.0%) |
| 6 to 11 Years | 17 (100.0%) | 0 (0.0%) |
| 12 to 14 Years | 87 (82.9%) | 0 (0.0%) |
| 15 Years | 0 (0.0%) | 0 (0.0%) |
| 16 and 17 Years | 19 (100.0%) | 0 (0.0%) |
| 18 to 24 Years | 112 (100.0%) | 24 (100.0%) |
| 25 to 34 Years | 65 (29.8%) | 53 (100.0%) |
| 35 to 44 Years | 40 (100.0%) | 13 (44.8%) |
| 45 to 54 Years | 46 (80.7%) | 83 (84.7%) |
| 55 to 64 Years | 41 (32.8%) | 29 (26.4%) |
| 65 to 74 Years | 31 (52.5%) | 44 (41.1%) |
| 75 Years and over | 14 (26.9%) | 39 (51.3%) |
| Total | 472 (58.7%) | 294 (58.1%) |
Income Above Poverty by Sex and Age in Mora
According to the poverty statistics in Mora, males aged 75 years and over and females aged 55 to 64 years are the age groups that are most secure financially, with 73.1% of males and 73.6% of females in these age groups living above the poverty line.
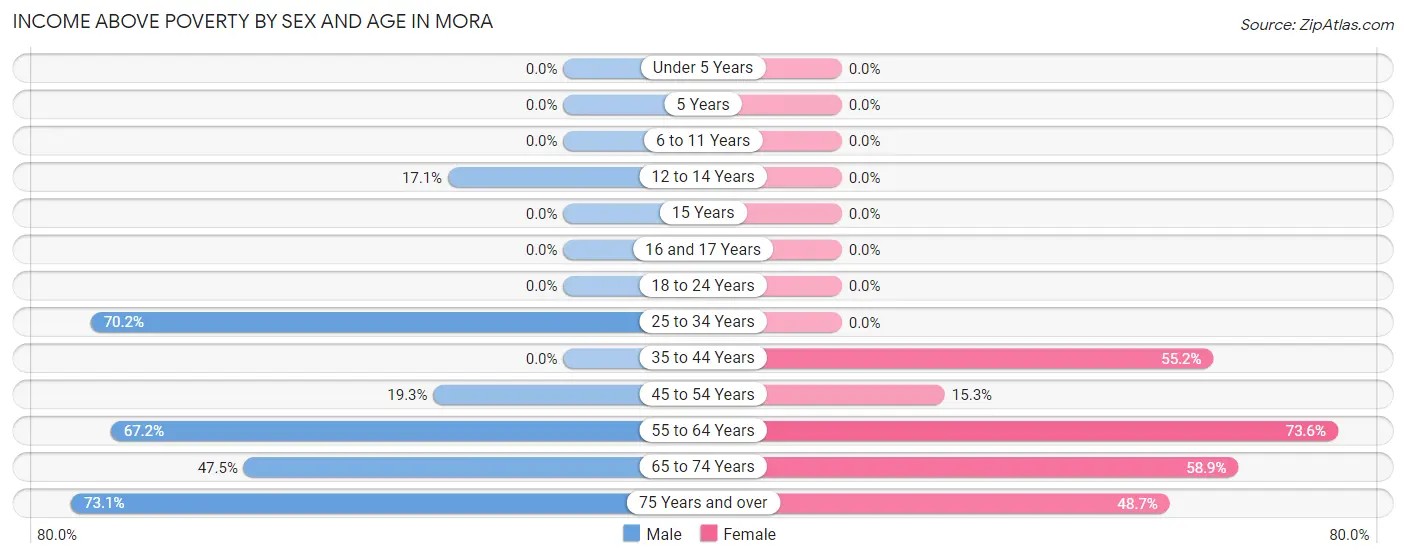
| Age Bracket | Male | Female |
| Under 5 Years | 0 (0.0%) | 0 (0.0%) |
| 5 Years | 0 (0.0%) | 0 (0.0%) |
| 6 to 11 Years | 0 (0.0%) | 0 (0.0%) |
| 12 to 14 Years | 18 (17.1%) | 0 (0.0%) |
| 15 Years | 0 (0.0%) | 0 (0.0%) |
| 16 and 17 Years | 0 (0.0%) | 0 (0.0%) |
| 18 to 24 Years | 0 (0.0%) | 0 (0.0%) |
| 25 to 34 Years | 153 (70.2%) | 0 (0.0%) |
| 35 to 44 Years | 0 (0.0%) | 16 (55.2%) |
| 45 to 54 Years | 11 (19.3%) | 15 (15.3%) |
| 55 to 64 Years | 84 (67.2%) | 81 (73.6%) |
| 65 to 74 Years | 28 (47.5%) | 63 (58.9%) |
| 75 Years and over | 38 (73.1%) | 37 (48.7%) |
| Total | 332 (41.3%) | 212 (41.9%) |
Income Below Poverty Among Married-Couple Families in Mora
The poverty statistics for married-couple families in Mora show that 51.5% or 102 of the total 198 families live below the poverty line. Families with 1 or 2 children have the highest poverty rate of 62.5%, comprising of 20 families. On the other hand, families with no children have the lowest poverty rate of 49.4%, which includes 82 families.
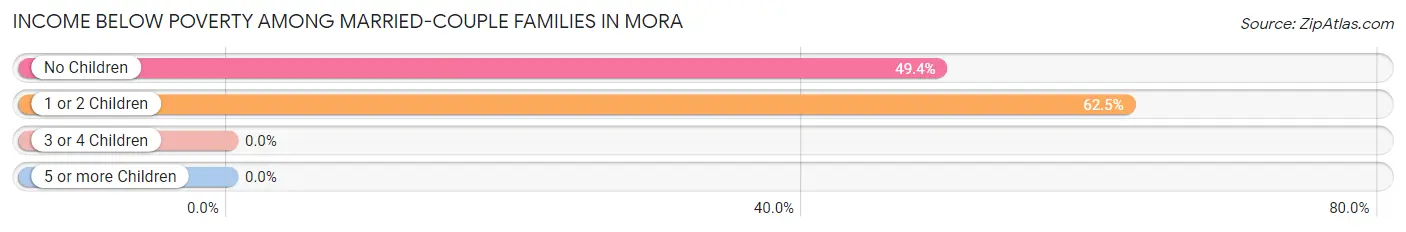
| Children | Above Poverty | Below Poverty |
| No Children | 84 (50.6%) | 82 (49.4%) |
| 1 or 2 Children | 12 (37.5%) | 20 (62.5%) |
| 3 or 4 Children | 0 (0.0%) | 0 (0.0%) |
| 5 or more Children | 0 (0.0%) | 0 (0.0%) |
| Total | 96 (48.5%) | 102 (51.5%) |
Income Below Poverty Among Single-Parent Households in Mora
According to the poverty data in Mora, 61.1% or 33 single-father households and 100.0% or 78 single-mother households are living below the poverty line. Among single-father households, those with 1 or 2 children have the highest poverty rate, with 17 households (100.0%) experiencing poverty. Likewise, among single-mother households, those with no children have the highest poverty rate, with 21 households (100.0%) falling below the poverty line.
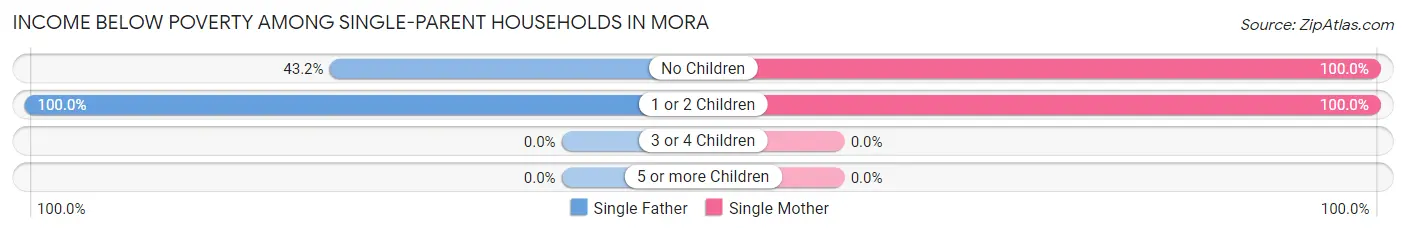
| Children | Single Father | Single Mother |
| No Children | 16 (43.2%) | 21 (100.0%) |
| 1 or 2 Children | 17 (100.0%) | 57 (100.0%) |
| 3 or 4 Children | 0 (0.0%) | 0 (0.0%) |
| 5 or more Children | 0 (0.0%) | 0 (0.0%) |
| Total | 33 (61.1%) | 78 (100.0%) |
Income Below Poverty Among Married-Couple vs Single-Parent Households in Mora
The poverty data for Mora shows that 102 of the married-couple family households (51.5%) and 111 of the single-parent households (84.1%) are living below the poverty level. Within the married-couple family households, those with 1 or 2 children have the highest poverty rate, with 20 households (62.5%) falling below the poverty line. Among the single-parent households, those with 1 or 2 children have the highest poverty rate, with 74 household (100.0%) living below poverty.
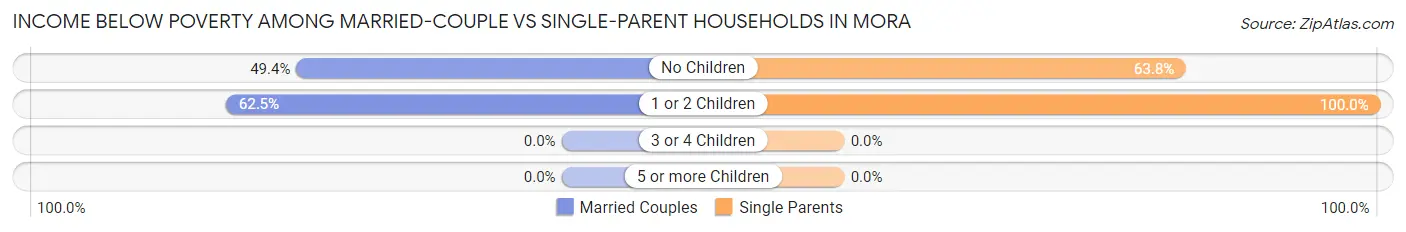
| Children | Married-Couple Families | Single-Parent Households |
| No Children | 82 (49.4%) | 37 (63.8%) |
| 1 or 2 Children | 20 (62.5%) | 74 (100.0%) |
| 3 or 4 Children | 0 (0.0%) | 0 (0.0%) |
| 5 or more Children | 0 (0.0%) | 0 (0.0%) |
| Total | 102 (51.5%) | 111 (84.1%) |
Race in Mora
The most populous races in Mora are Hispanic or Latino (1,328 | 99.3%), White / Caucasian (676 | 50.6%), and Some other Race (362 | 27.1%).
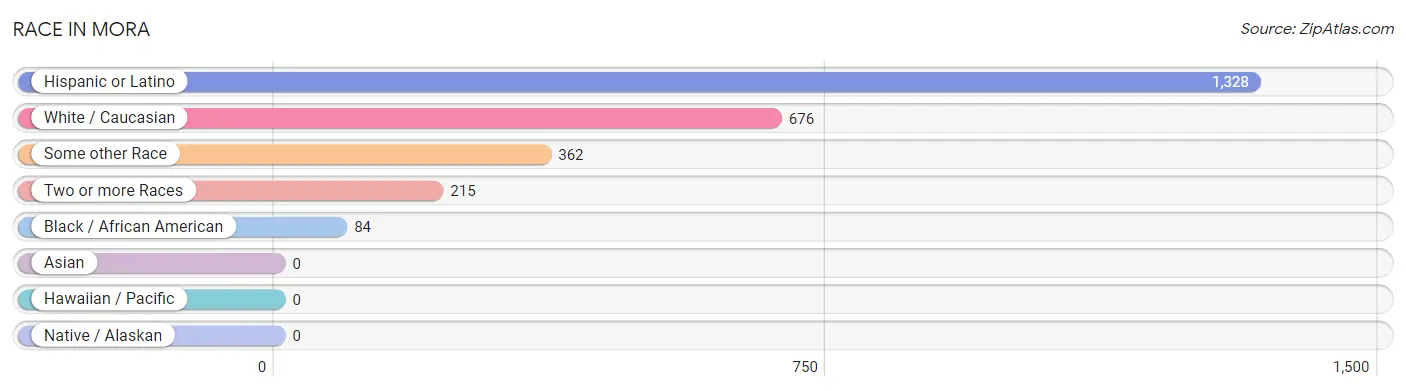
| Race | # Population | % Population |
| Asian | 0 | 0.0% |
| Black / African American | 84 | 6.3% |
| Hawaiian / Pacific | 0 | 0.0% |
| Hispanic or Latino | 1,328 | 99.3% |
| Native / Alaskan | 0 | 0.0% |
| White / Caucasian | 676 | 50.6% |
| Two or more Races | 215 | 16.1% |
| Some other Race | 362 | 27.1% |
| Total | 1,337 | 100.0% |
Ancestry in Mora
The most populous ancestries reported in Mora are Puerto Rican (1,328 | 99.3%), American (54 | 4.0%), French (11 | 0.8%), and German (9 | 0.7%), together accounting for 104.9% of all Mora residents.
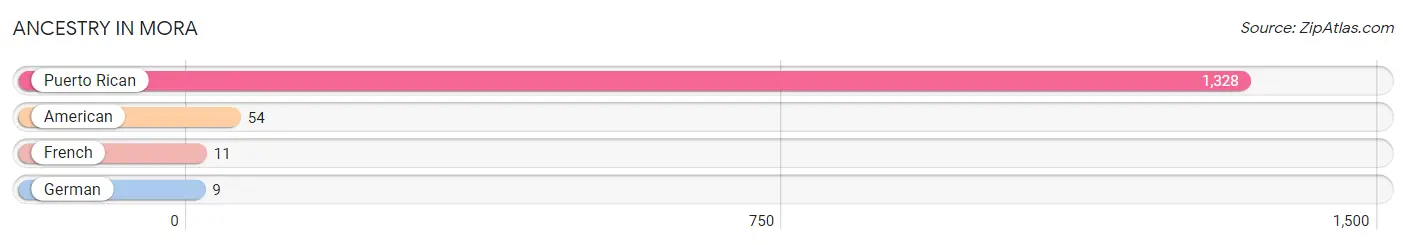
| Ancestry | # Population | % Population |
| American | 54 | 4.0% |
| French | 11 | 0.8% |
| German | 9 | 0.7% |
| Puerto Rican | 1,328 | 99.3% | View All 4 Rows |
Immigrants in Mora

| Immigration Origin | # Population | % Population | View All 0 Rows |
Sex and Age in Mora
Sex and Age in Mora
The most populous age groups in Mora are 30 to 34 Years (160 | 19.4%) for men and 65 to 69 Years (90 | 17.6%) for women.
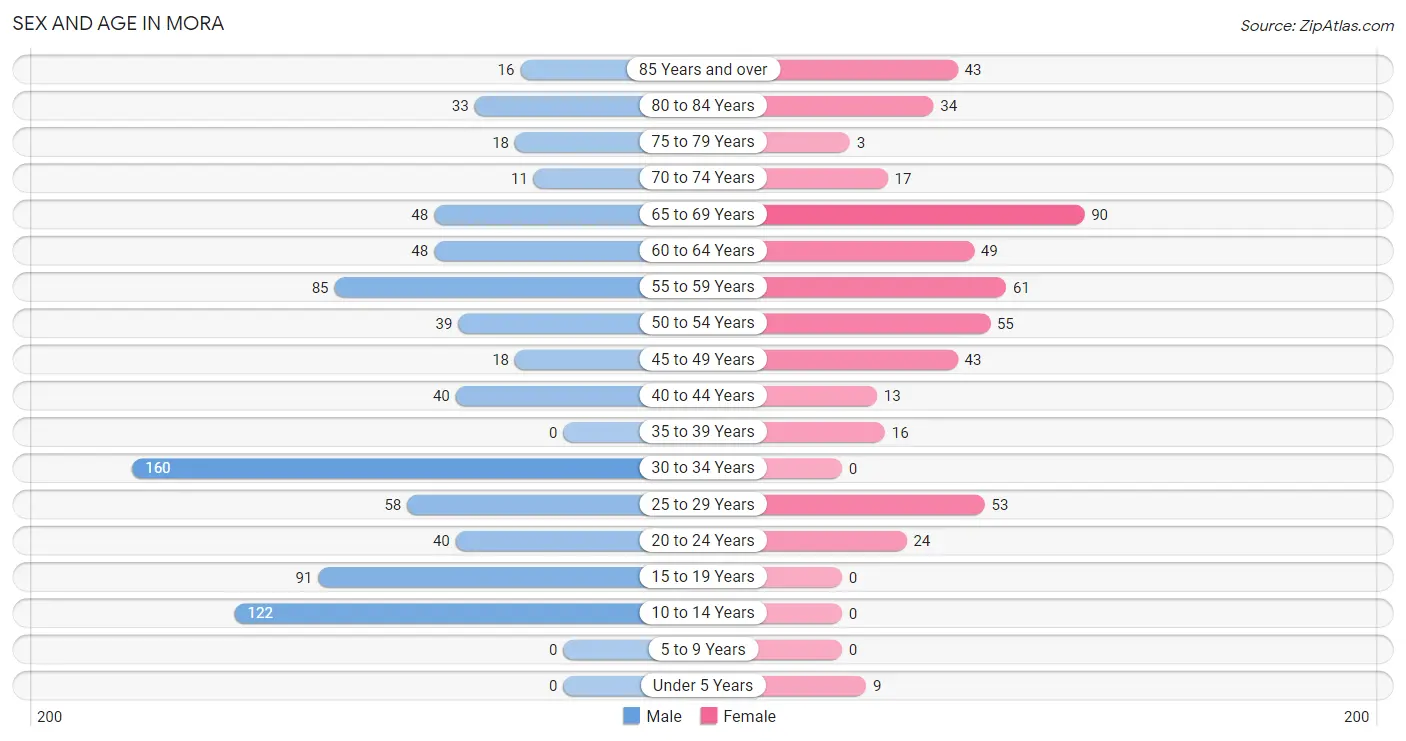
| Age Bracket | Male | Female |
| Under 5 Years | 0 (0.0%) | 9 (1.8%) |
| 5 to 9 Years | 0 (0.0%) | 0 (0.0%) |
| 10 to 14 Years | 122 (14.7%) | 0 (0.0%) |
| 15 to 19 Years | 91 (11.0%) | 0 (0.0%) |
| 20 to 24 Years | 40 (4.8%) | 24 (4.7%) |
| 25 to 29 Years | 58 (7.0%) | 53 (10.4%) |
| 30 to 34 Years | 160 (19.4%) | 0 (0.0%) |
| 35 to 39 Years | 0 (0.0%) | 16 (3.1%) |
| 40 to 44 Years | 40 (4.8%) | 13 (2.5%) |
| 45 to 49 Years | 18 (2.2%) | 43 (8.4%) |
| 50 to 54 Years | 39 (4.7%) | 55 (10.8%) |
| 55 to 59 Years | 85 (10.3%) | 61 (12.0%) |
| 60 to 64 Years | 48 (5.8%) | 49 (9.6%) |
| 65 to 69 Years | 48 (5.8%) | 90 (17.6%) |
| 70 to 74 Years | 11 (1.3%) | 17 (3.3%) |
| 75 to 79 Years | 18 (2.2%) | 3 (0.6%) |
| 80 to 84 Years | 33 (4.0%) | 34 (6.7%) |
| 85 Years and over | 16 (1.9%) | 43 (8.4%) |
| Total | 827 (100.0%) | 510 (100.0%) |
Families and Households in Mora
Median Family Size in Mora
The median family size in Mora is 3.27 persons per family, with single male/father families (54 | 16.4%) accounting for the largest median family size of 4.74 persons per family. On the other hand, single female/mother families (78 | 23.6%) represent the smallest median family size with 2.22 persons per family.
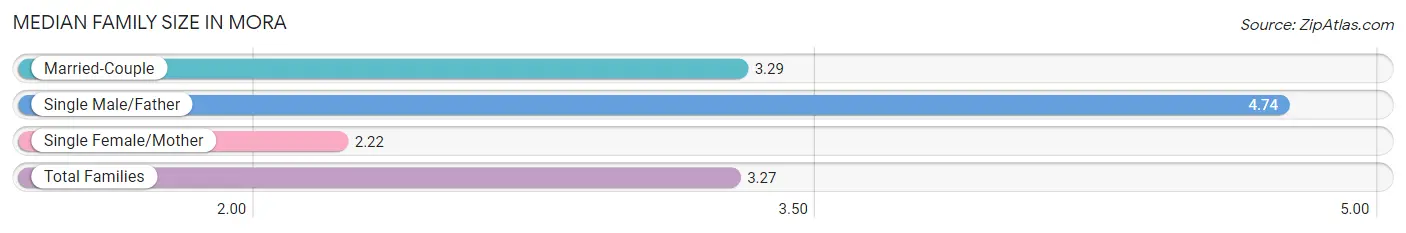
| Family Type | # Families | Family Size |
| Married-Couple | 198 (60.0%) | 3.29 |
| Single Male/Father | 54 (16.4%) | 4.74 |
| Single Female/Mother | 78 (23.6%) | 2.22 |
| Total Families | 330 (100.0%) | 3.27 |
Median Household Size in Mora
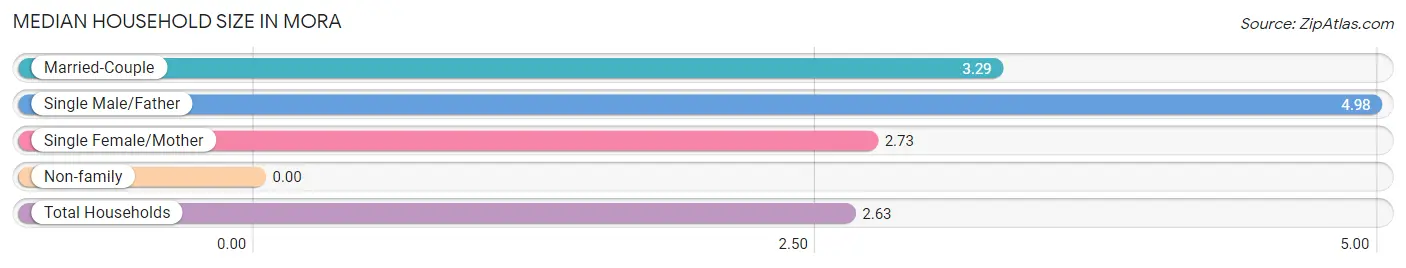
| Household Type | # Households | Household Size |
| Married-Couple | 198 (40.2%) | 3.29 |
| Single Male/Father | 54 (11.0%) | 4.98 |
| Single Female/Mother | 78 (15.9%) | 2.73 |
| Non-family | 162 (32.9%) | - |
| Total Households | 492 (100.0%) | 2.63 |
Household Size by Marriage Status in Mora
Out of a total of 492 households in Mora, 330 (67.1%) are family households, while 162 (32.9%) are nonfamily households. The most numerous type of family households are 2-person households, comprising 186, and the most common type of nonfamily households are 1-person households, comprising 162.
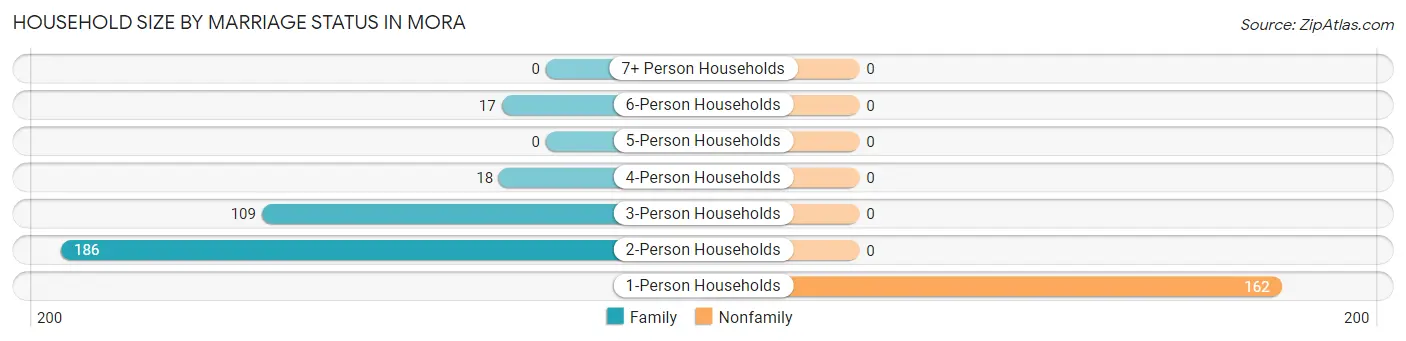
| Household Size | Family Households | Nonfamily Households |
| 1-Person Households | - | 162 (32.9%) |
| 2-Person Households | 186 (37.8%) | 0 (0.0%) |
| 3-Person Households | 109 (22.2%) | 0 (0.0%) |
| 4-Person Households | 18 (3.7%) | 0 (0.0%) |
| 5-Person Households | 0 (0.0%) | 0 (0.0%) |
| 6-Person Households | 17 (3.5%) | 0 (0.0%) |
| 7+ Person Households | 0 (0.0%) | 0 (0.0%) |
| Total | 330 (67.1%) | 162 (32.9%) |
Female Fertility in Mora
Fertility by Age in Mora
| Age Bracket | Women with Births | Births / 1,000 Women |
| 15 to 19 years | 0 (0.0%) | 0.0 |
| 20 to 34 years | 0 (0.0%) | 0.0 |
| 35 to 50 years | 0 (0.0%) | 0.0 |
| Total | 0 (0.0%) | 0.0 |
Fertility by Age by Marriage Status in Mora
| Age Bracket | Married | Unmarried |
| 15 to 19 years | 0 (0.0%) | 0 (0.0%) |
| 20 to 34 years | 0 (0.0%) | 0 (0.0%) |
| 35 to 50 years | 0 (0.0%) | 0 (0.0%) |
| Total | 0 (0.0%) | 0 (0.0%) |
Fertility by Education in Mora
| Educational Attainment | Women with Births | Births / 1,000 Women |
| Less than High School | 0 (0.0%) | 0.0 |
| High School Diploma | 0 (0.0%) | 0.0 |
| College or Associate's Degree | 0 (0.0%) | 0.0 |
| Bachelor's Degree | 0 (0.0%) | 0.0 |
| Graduate Degree | 0 (0.0%) | 0.0 |
| Total | 0 (0.0%) | 0.0 |
Fertility by Education by Marriage Status in Mora
| Educational Attainment | Married | Unmarried |
| Less than High School | 0 (0.0%) | 0 (0.0%) |
| High School Diploma | 0 (0.0%) | 0 (0.0%) |
| College or Associate's Degree | 0 (0.0%) | 0 (0.0%) |
| Bachelor's Degree | 0 (0.0%) | 0 (0.0%) |
| Graduate Degree | 0 (0.0%) | 0 (0.0%) |
| Total | 0 (0.0%) | 0 (0.0%) |
Employment Characteristics in Mora
Employment by Class of Employer in Mora
Among the 303 employed individuals in Mora, private company employees (281 | 92.7%), state government employees (15 | 5.0%), and self-employed (incorporated) (7 | 2.3%) make up the most common classes of employment.
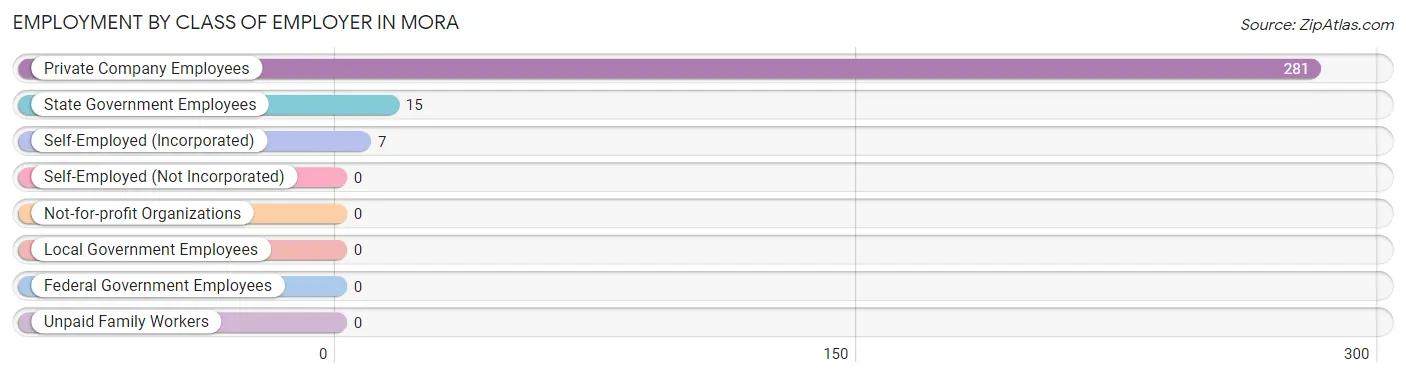
| Employer Class | # Employees | % Employees |
| Private Company Employees | 281 | 92.7% |
| Self-Employed (Incorporated) | 7 | 2.3% |
| Self-Employed (Not Incorporated) | 0 | 0.0% |
| Not-for-profit Organizations | 0 | 0.0% |
| Local Government Employees | 0 | 0.0% |
| State Government Employees | 15 | 5.0% |
| Federal Government Employees | 0 | 0.0% |
| Unpaid Family Workers | 0 | 0.0% |
| Total | 303 | 100.0% |
Employment Status by Age in Mora
According to the labor force statistics for Mora, out of the total population over 16 years of age (1,206), 27.7% or 334 individuals are in the labor force, with 9.3% or 31 of them unemployed. The age group with the highest labor force participation rate is 30 to 34 years, with 85.0% or 136 individuals in the labor force. Within the labor force, the 35 to 44 years age range has the highest percentage of unemployed individuals, with 30.4% or 17 of them being unemployed.
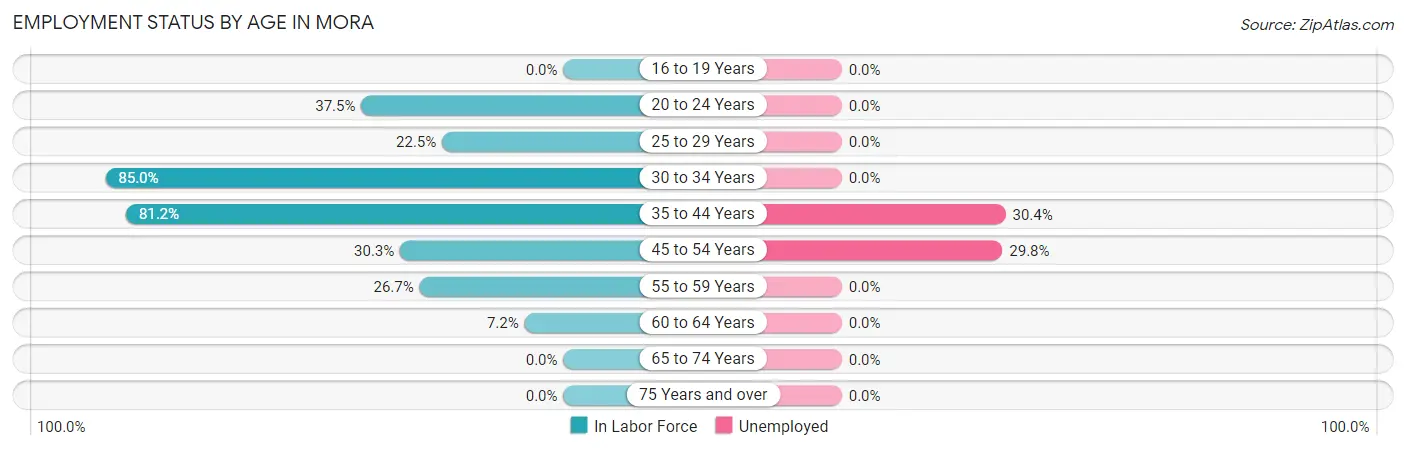
| Age Bracket | In Labor Force | Unemployed |
| 16 to 19 Years | 0 (0.0%) | 0 (0.0%) |
| 20 to 24 Years | 24 (37.5%) | 0 (0.0%) |
| 25 to 29 Years | 25 (22.5%) | 0 (0.0%) |
| 30 to 34 Years | 136 (85.0%) | 0 (0.0%) |
| 35 to 44 Years | 56 (81.2%) | 17 (30.4%) |
| 45 to 54 Years | 47 (30.3%) | 14 (29.8%) |
| 55 to 59 Years | 39 (26.7%) | 0 (0.0%) |
| 60 to 64 Years | 7 (7.2%) | 0 (0.0%) |
| 65 to 74 Years | 0 (0.0%) | 0 (0.0%) |
| 75 Years and over | 0 (0.0%) | 0 (0.0%) |
| Total | 334 (27.7%) | 31 (9.3%) |
Employment Status by Educational Attainment in Mora
According to labor force statistics for Mora, 42.0% of individuals (310) out of the total population between 25 and 64 years of age (738) are in the labor force, with 10.0% or 31 of them being unemployed. The group with the highest labor force participation rate are those with the educational attainment of high school diploma, with 55.1% or 228 individuals in the labor force. Within the labor force, individuals with bachelor's degree or higher education have the highest percentage of unemployment, with 29.2% or 14 of them being unemployed.
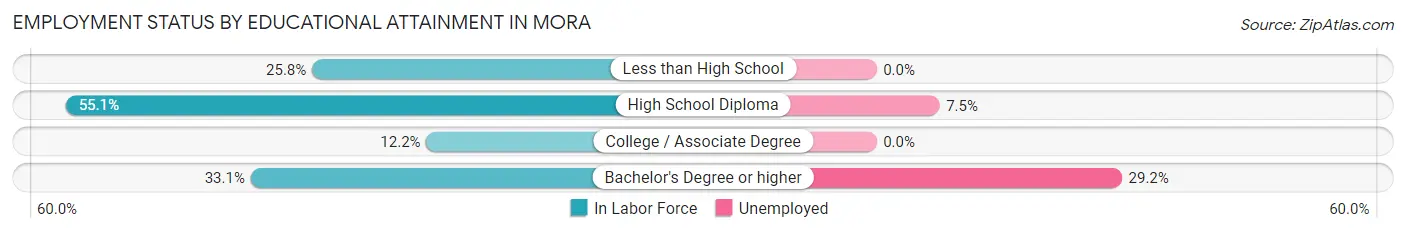
| Educational Attainment | In Labor Force | Unemployed |
| Less than High School | 23 (25.8%) | 0 (0.0%) |
| High School Diploma | 228 (55.1%) | 31 (7.5%) |
| College / Associate Degree | 11 (12.2%) | 0 (0.0%) |
| Bachelor's Degree or higher | 48 (33.1%) | 42 (29.2%) |
| Total | 310 (42.0%) | 74 (10.0%) |
Employment Occupations by Sex in Mora
Management, Business, Science and Arts Occupations
The most common Management, Business, Science and Arts occupations in Mora are Community & Social Service (7 | 2.3%), and Legal Services & Support (7 | 2.3%).
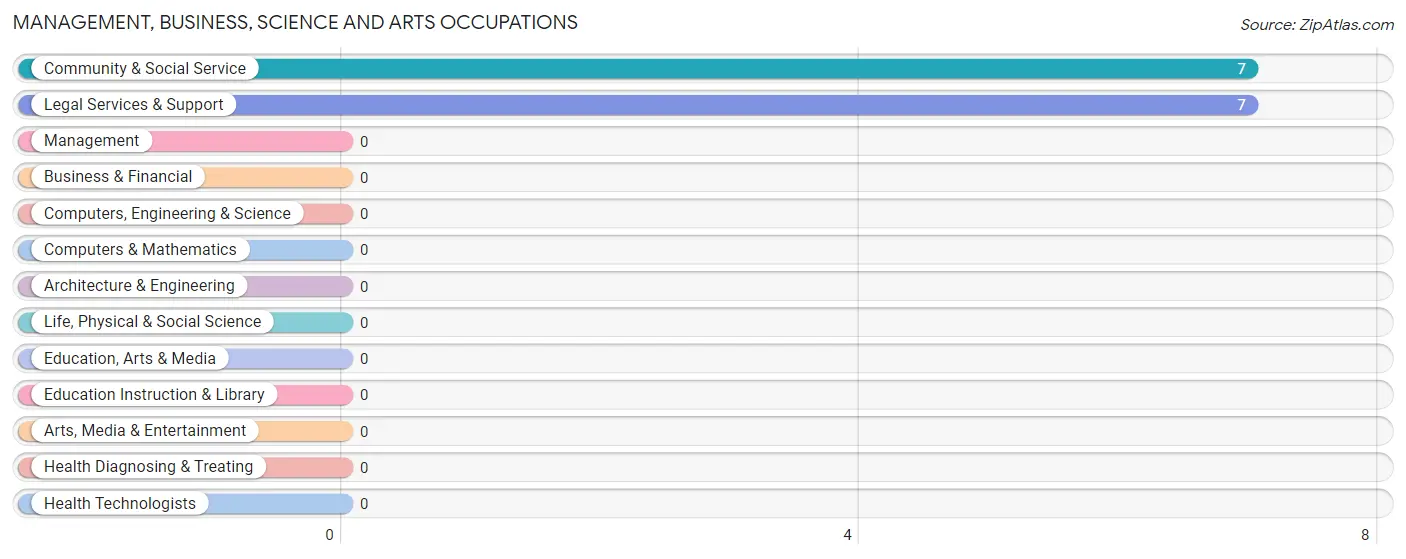
Management, Business, Science and Arts Occupations by Sex
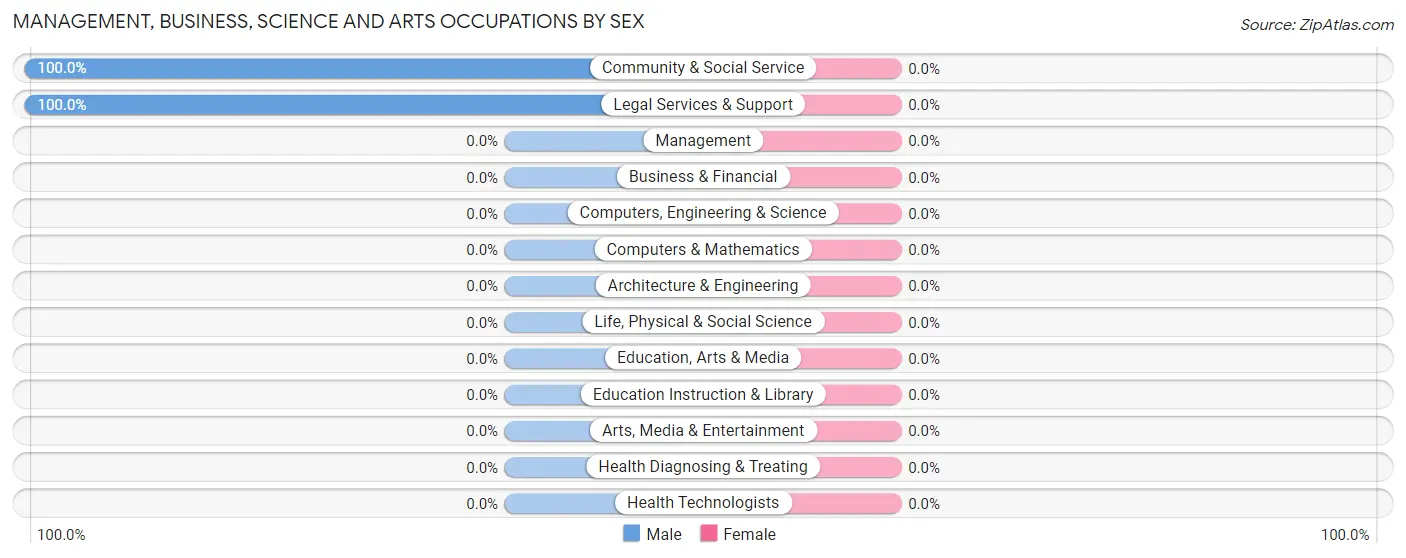
| Occupation | Male | Female |
| Management | 0 (0.0%) | 0 (0.0%) |
| Business & Financial | 0 (0.0%) | 0 (0.0%) |
| Computers, Engineering & Science | 0 (0.0%) | 0 (0.0%) |
| Computers & Mathematics | 0 (0.0%) | 0 (0.0%) |
| Architecture & Engineering | 0 (0.0%) | 0 (0.0%) |
| Life, Physical & Social Science | 0 (0.0%) | 0 (0.0%) |
| Community & Social Service | 7 (100.0%) | 0 (0.0%) |
| Education, Arts & Media | 0 (0.0%) | 0 (0.0%) |
| Legal Services & Support | 7 (100.0%) | 0 (0.0%) |
| Education Instruction & Library | 0 (0.0%) | 0 (0.0%) |
| Arts, Media & Entertainment | 0 (0.0%) | 0 (0.0%) |
| Health Diagnosing & Treating | 0 (0.0%) | 0 (0.0%) |
| Health Technologists | 0 (0.0%) | 0 (0.0%) |
| Total (Category) | 7 (100.0%) | 0 (0.0%) |
| Total (Overall) | 211 (69.6%) | 92 (30.4%) |
Services Occupations
The most common Services occupations in Mora are Security & Protection (15 | 5.0%), and Firefighting & Prevention (15 | 5.0%).
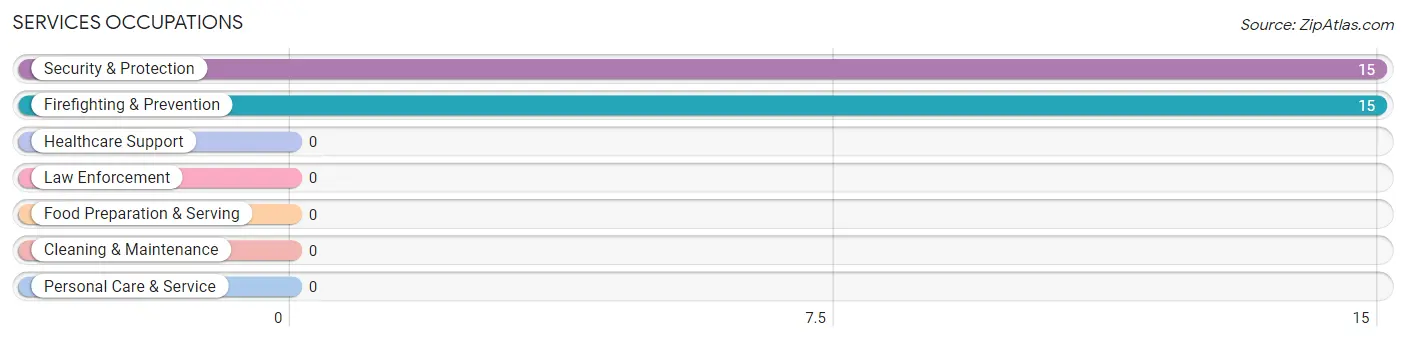
Services Occupations by Sex
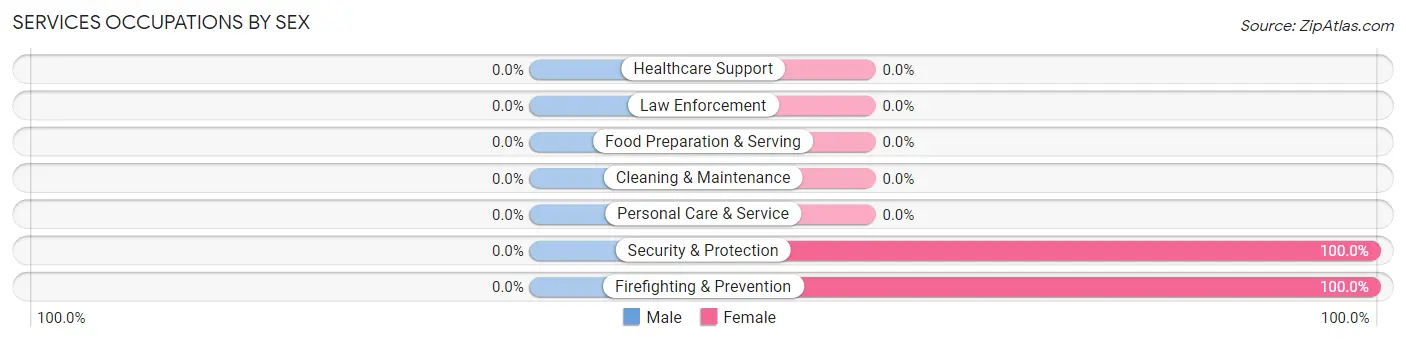
| Occupation | Male | Female |
| Healthcare Support | 0 (0.0%) | 0 (0.0%) |
| Security & Protection | 0 (0.0%) | 15 (100.0%) |
| Firefighting & Prevention | 0 (0.0%) | 15 (100.0%) |
| Law Enforcement | 0 (0.0%) | 0 (0.0%) |
| Food Preparation & Serving | 0 (0.0%) | 0 (0.0%) |
| Cleaning & Maintenance | 0 (0.0%) | 0 (0.0%) |
| Personal Care & Service | 0 (0.0%) | 0 (0.0%) |
| Total (Category) | 0 (0.0%) | 15 (100.0%) |
| Total (Overall) | 211 (69.6%) | 92 (30.4%) |
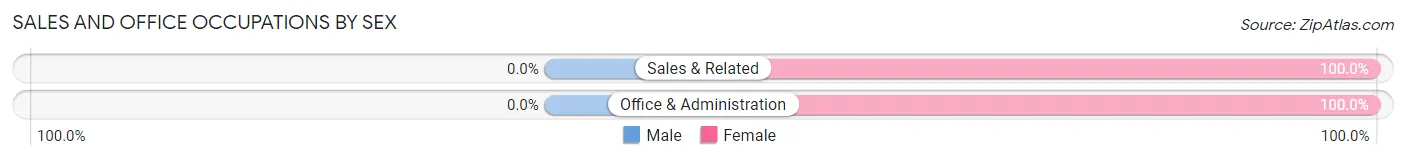
Sales and Office Occupations
The most common Sales and Office occupations in Mora are Sales & Related (24 | 7.9%), and Office & Administration (24 | 7.9%).
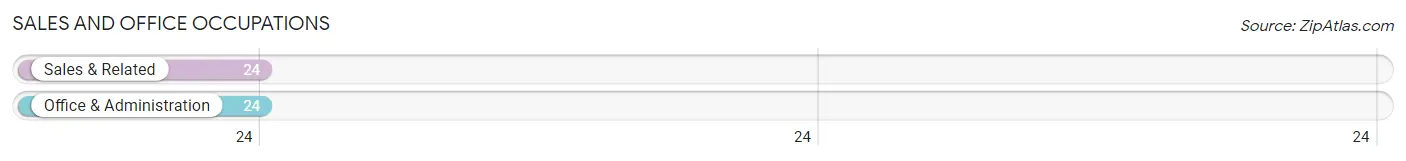
Sales and Office Occupations by Sex
| Occupation | Male | Female |
| Sales & Related | 0 (0.0%) | 24 (100.0%) |
| Office & Administration | 0 (0.0%) | 24 (100.0%) |
| Total (Category) | 0 (0.0%) | 48 (100.0%) |
| Total (Overall) | 211 (69.6%) | 92 (30.4%) |
Natural Resources, Construction and Maintenance Occupations
The most common Natural Resources, Construction and Maintenance occupations in Mora are Construction & Extraction (68 | 22.4%), and Installation, Maintenance & Repair (7 | 2.3%).
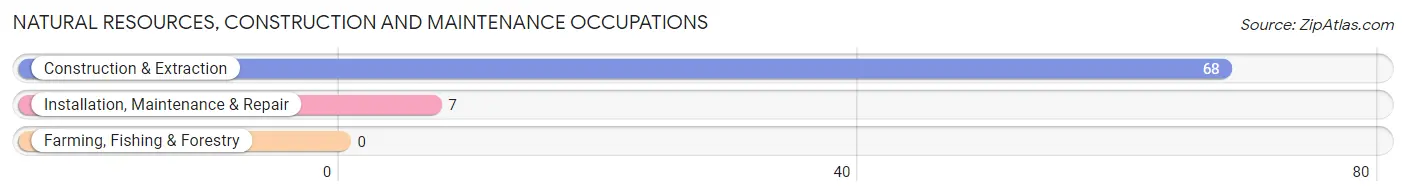
Natural Resources, Construction and Maintenance Occupations by Sex
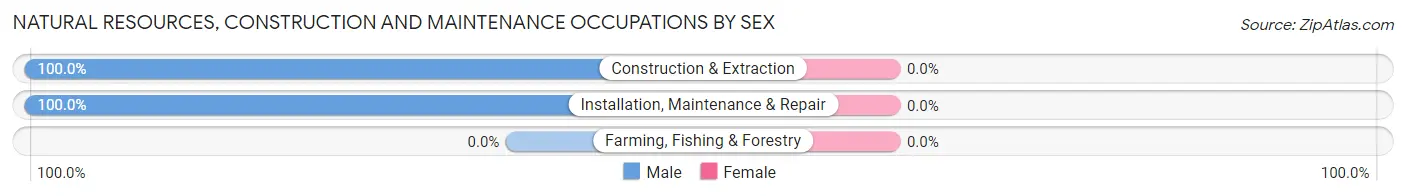
| Occupation | Male | Female |
| Farming, Fishing & Forestry | 0 (0.0%) | 0 (0.0%) |
| Construction & Extraction | 68 (100.0%) | 0 (0.0%) |
| Installation, Maintenance & Repair | 7 (100.0%) | 0 (0.0%) |
| Total (Category) | 75 (100.0%) | 0 (0.0%) |
| Total (Overall) | 211 (69.6%) | 92 (30.4%) |
Production, Transportation and Moving Occupations
The most common Production, Transportation and Moving occupations in Mora are Material Moving (108 | 35.6%), and Production (50 | 16.5%).
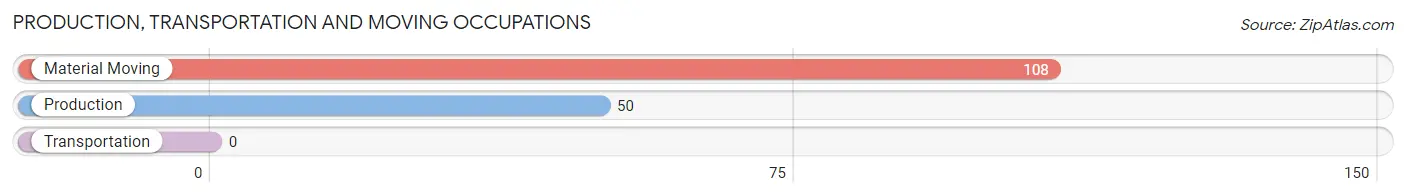
Production, Transportation and Moving Occupations by Sex
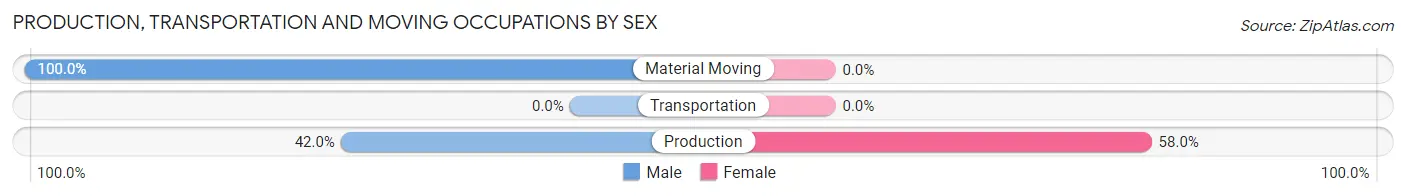
| Occupation | Male | Female |
| Production | 21 (42.0%) | 29 (58.0%) |
| Transportation | 0 (0.0%) | 0 (0.0%) |
| Material Moving | 108 (100.0%) | 0 (0.0%) |
| Total (Category) | 129 (81.7%) | 29 (18.3%) |
| Total (Overall) | 211 (69.6%) | 92 (30.4%) |
Employment Industries by Sex in Mora
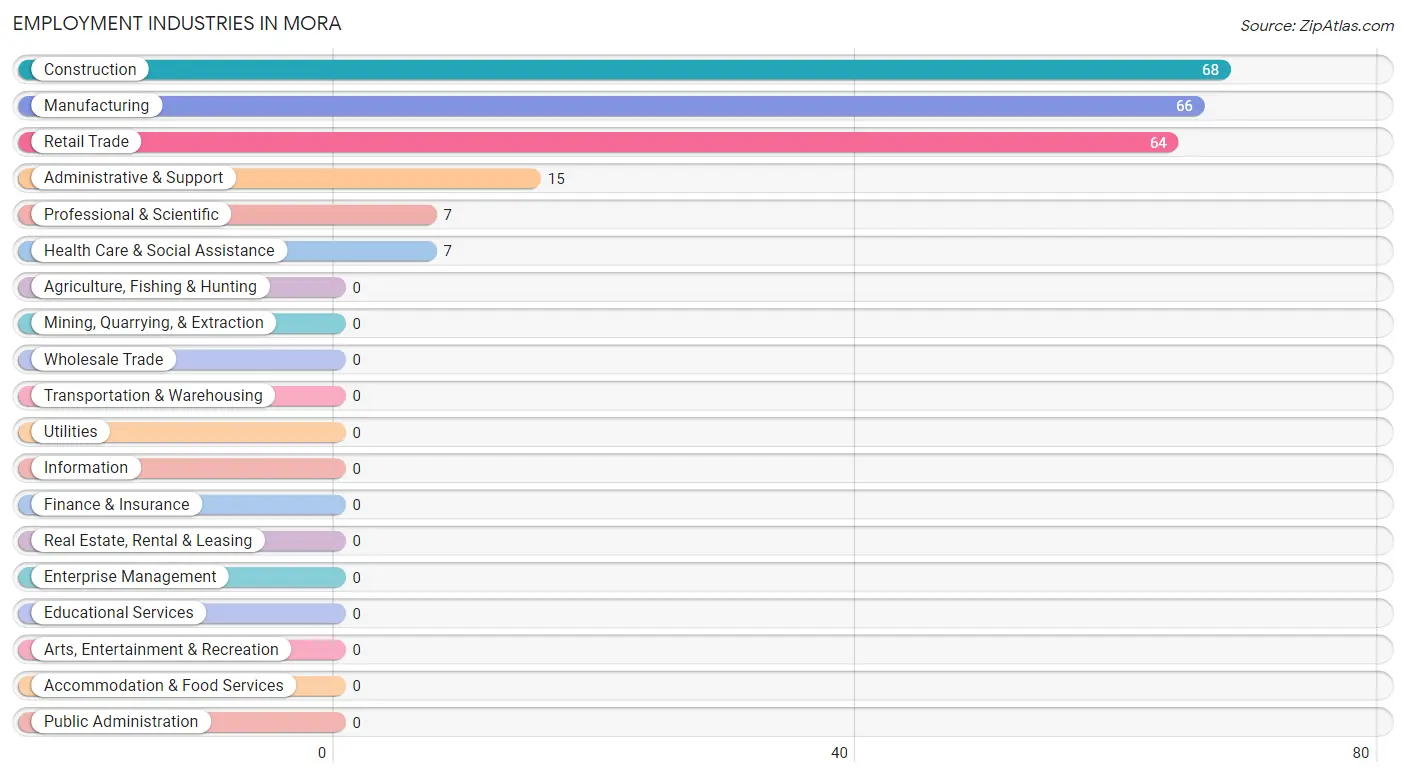
Employment Industries in Mora
The major employment industries in Mora include Construction (68 | 22.4%), Manufacturing (66 | 21.8%), Retail Trade (64 | 21.1%), Administrative & Support (15 | 5.0%), and Professional & Scientific (7 | 2.3%).
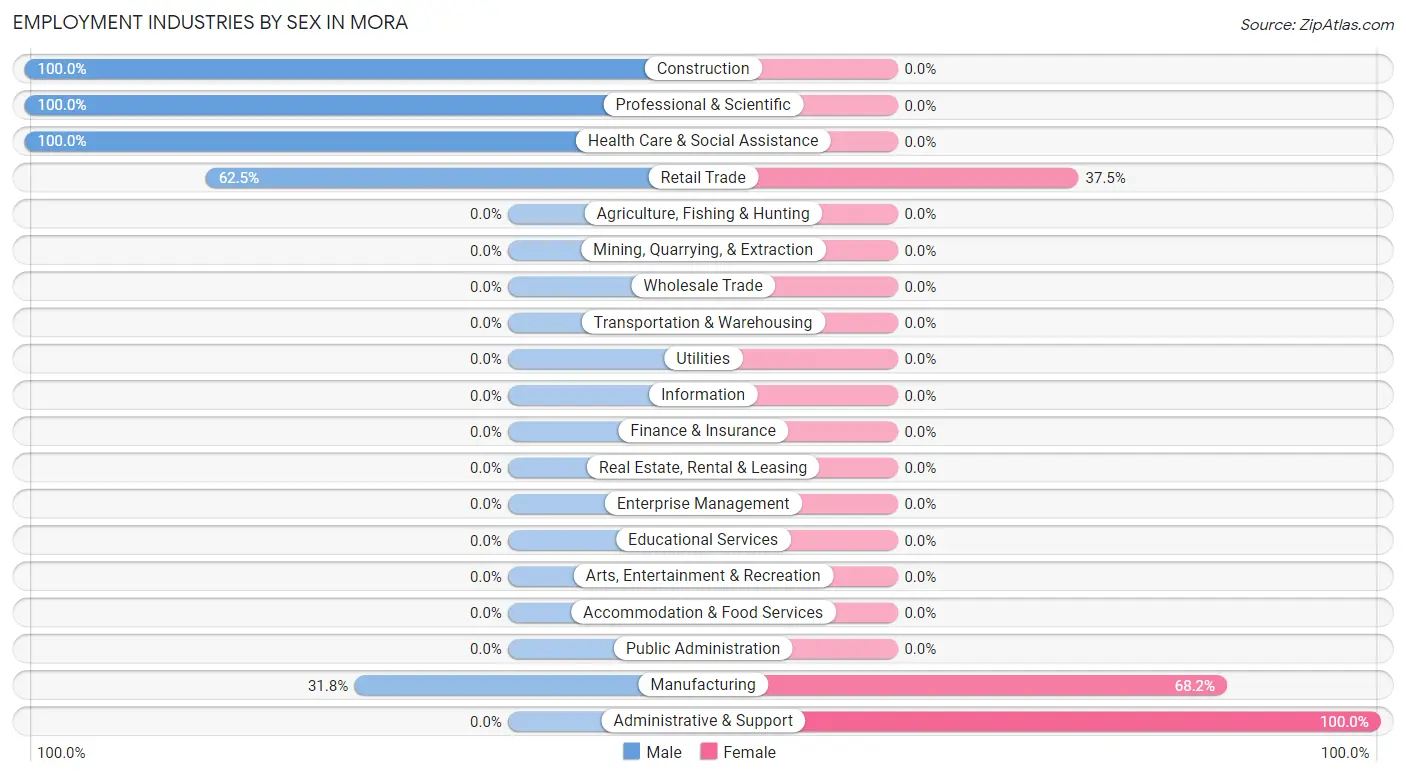
Employment Industries by Sex in Mora
The Mora industries that see more men than women are Construction (100.0%), Professional & Scientific (100.0%), and Health Care & Social Assistance (100.0%), whereas the industries that tend to have a higher number of women are Administrative & Support (100.0%), Manufacturing (68.2%), and Retail Trade (37.5%).
| Industry | Male | Female |
| Agriculture, Fishing & Hunting | 0 (0.0%) | 0 (0.0%) |
| Mining, Quarrying, & Extraction | 0 (0.0%) | 0 (0.0%) |
| Construction | 68 (100.0%) | 0 (0.0%) |
| Manufacturing | 21 (31.8%) | 45 (68.2%) |
| Wholesale Trade | 0 (0.0%) | 0 (0.0%) |
| Retail Trade | 40 (62.5%) | 24 (37.5%) |
| Transportation & Warehousing | 0 (0.0%) | 0 (0.0%) |
| Utilities | 0 (0.0%) | 0 (0.0%) |
| Information | 0 (0.0%) | 0 (0.0%) |
| Finance & Insurance | 0 (0.0%) | 0 (0.0%) |
| Real Estate, Rental & Leasing | 0 (0.0%) | 0 (0.0%) |
| Professional & Scientific | 7 (100.0%) | 0 (0.0%) |
| Enterprise Management | 0 (0.0%) | 0 (0.0%) |
| Administrative & Support | 0 (0.0%) | 15 (100.0%) |
| Educational Services | 0 (0.0%) | 0 (0.0%) |
| Health Care & Social Assistance | 7 (100.0%) | 0 (0.0%) |
| Arts, Entertainment & Recreation | 0 (0.0%) | 0 (0.0%) |
| Accommodation & Food Services | 0 (0.0%) | 0 (0.0%) |
| Public Administration | 0 (0.0%) | 0 (0.0%) |
| Total | 211 (69.6%) | 92 (30.4%) |
Education in Mora
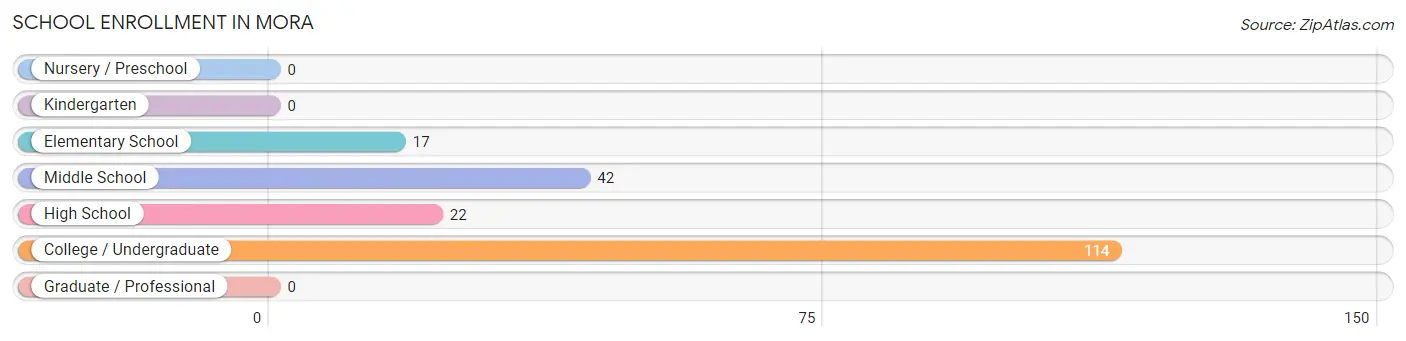
School Enrollment in Mora
The most common levels of schooling among the 195 students in Mora are college / undergraduate (114 | 58.5%), middle school (42 | 21.5%), and high school (22 | 11.3%).
| School Level | # Students | % Students |
| Nursery / Preschool | 0 | 0.0% |
| Kindergarten | 0 | 0.0% |
| Elementary School | 17 | 8.7% |
| Middle School | 42 | 21.5% |
| High School | 22 | 11.3% |
| College / Undergraduate | 114 | 58.5% |
| Graduate / Professional | 0 | 0.0% |
| Total | 195 | 100.0% |
School Enrollment by Age by Funding Source in Mora
Out of a total of 195 students who are enrolled in schools in Mora, 67 (34.4%) attend a private institution, while the remaining 128 (65.6%) are enrolled in public schools. The age group of 25 to 34 year olds has the highest likelihood of being enrolled in private schools, with 41 (100.0% in the age bracket) enrolled. Conversely, the age group of 10 to 14 year olds has the lowest likelihood of being enrolled in a private school, with 81 (100.0% in the age bracket) attending a public institution.
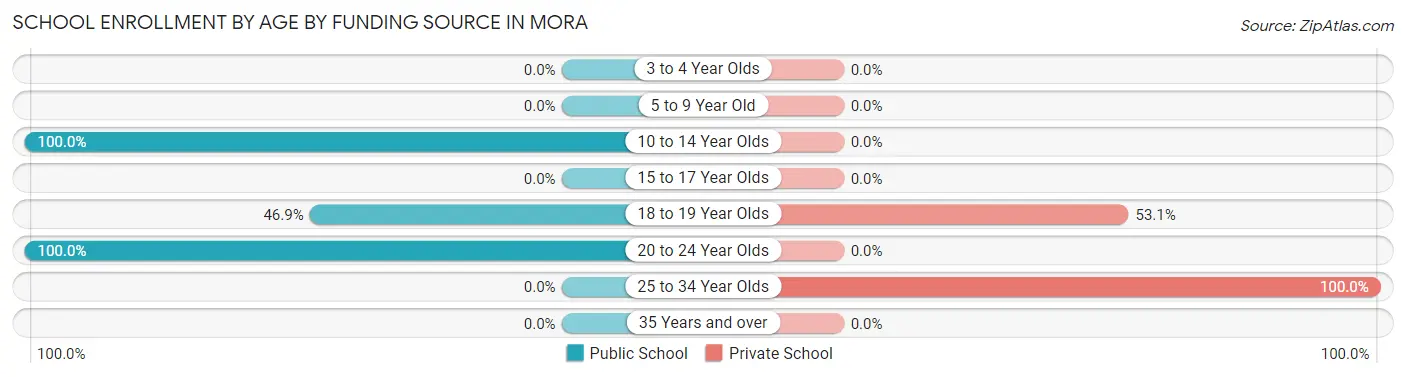
| Age Bracket | Public School | Private School |
| 3 to 4 Year Olds | 0 (0.0%) | 0 (0.0%) |
| 5 to 9 Year Old | 0 (0.0%) | 0 (0.0%) |
| 10 to 14 Year Olds | 81 (100.0%) | 0 (0.0%) |
| 15 to 17 Year Olds | 0 (0.0%) | 0 (0.0%) |
| 18 to 19 Year Olds | 23 (46.9%) | 26 (53.1%) |
| 20 to 24 Year Olds | 24 (100.0%) | 0 (0.0%) |
| 25 to 34 Year Olds | 0 (0.0%) | 41 (100.0%) |
| 35 Years and over | 0 (0.0%) | 0 (0.0%) |
| Total | 128 (65.6%) | 67 (34.4%) |
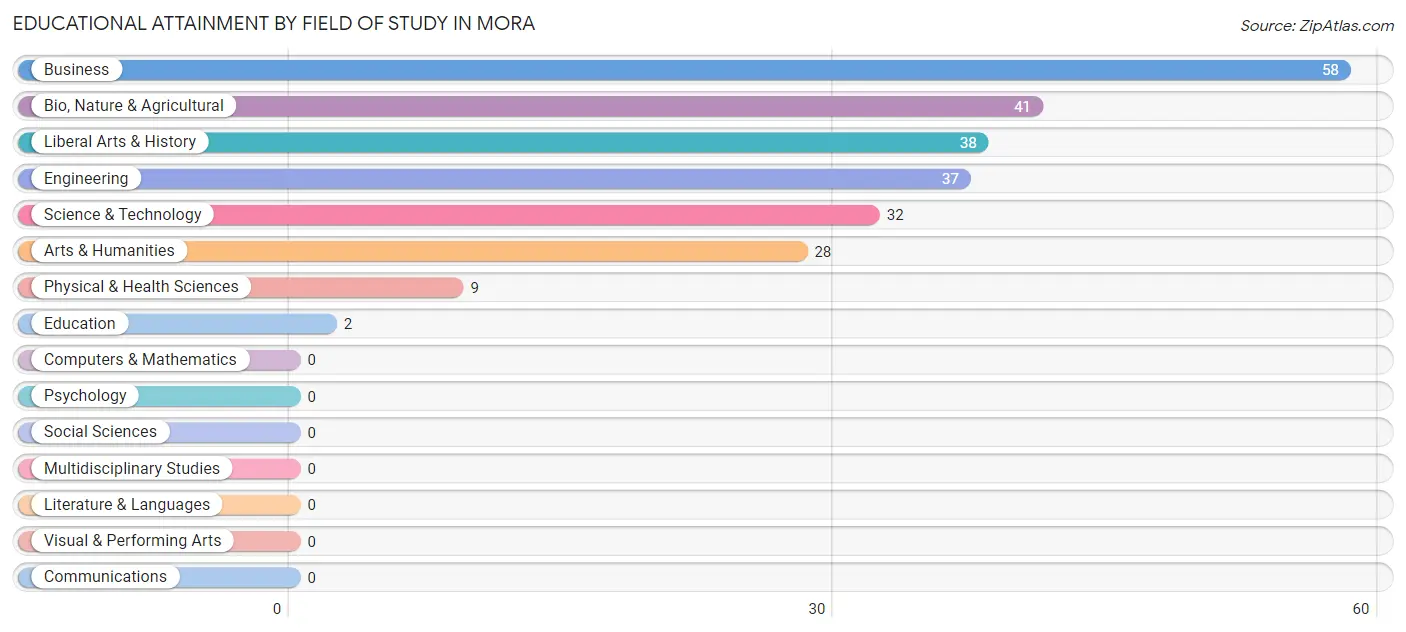
Educational Attainment by Field of Study in Mora
Business (58 | 23.7%), bio, nature & agricultural (41 | 16.7%), liberal arts & history (38 | 15.5%), engineering (37 | 15.1%), and science & technology (32 | 13.1%) are the most common fields of study among 245 individuals in Mora who have obtained a bachelor's degree or higher.
| Field of Study | # Graduates | % Graduates |
| Computers & Mathematics | 0 | 0.0% |
| Bio, Nature & Agricultural | 41 | 16.7% |
| Physical & Health Sciences | 9 | 3.7% |
| Psychology | 0 | 0.0% |
| Social Sciences | 0 | 0.0% |
| Engineering | 37 | 15.1% |
| Multidisciplinary Studies | 0 | 0.0% |
| Science & Technology | 32 | 13.1% |
| Business | 58 | 23.7% |
| Education | 2 | 0.8% |
| Literature & Languages | 0 | 0.0% |
| Liberal Arts & History | 38 | 15.5% |
| Visual & Performing Arts | 0 | 0.0% |
| Communications | 0 | 0.0% |
| Arts & Humanities | 28 | 11.4% |
| Total | 245 | 100.0% |
Transportation & Commute in Mora
Vehicle Availability by Sex in Mora
The most prevalent vehicle ownership categories in Mora are males with 4 vehicles (136, accounting for 64.4%) and females with 4 vehicles (0, making up 147.8%).
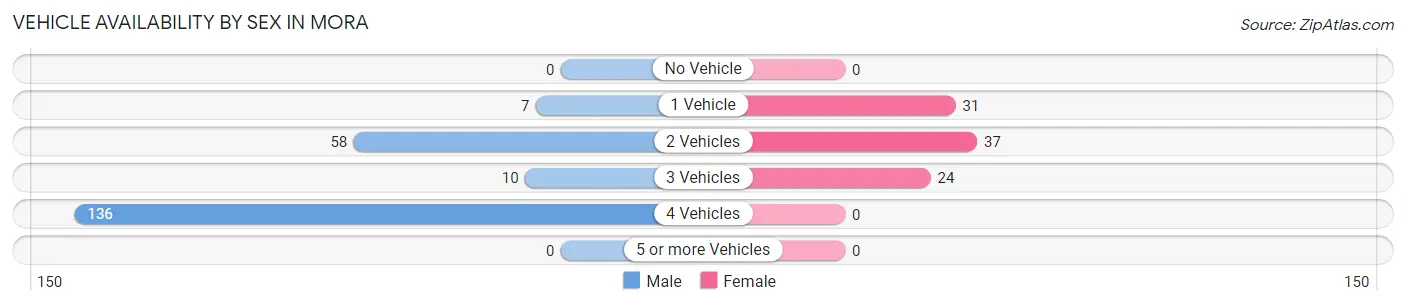
| Vehicles Available | Male | Female |
| No Vehicle | 0 (0.0%) | 0 (0.0%) |
| 1 Vehicle | 7 (3.3%) | 31 (33.7%) |
| 2 Vehicles | 58 (27.5%) | 37 (40.2%) |
| 3 Vehicles | 10 (4.7%) | 24 (26.1%) |
| 4 Vehicles | 136 (64.4%) | 0 (0.0%) |
| 5 or more Vehicles | 0 (0.0%) | 0 (0.0%) |
| Total | 211 (100.0%) | 92 (100.0%) |
Commute Time in Mora
The most frequently occuring commute durations in Mora are 20 to 24 minutes (119 commuters, 39.3%), 5 to 9 minutes (98 commuters, 32.3%), and 40 to 44 minutes (56 commuters, 18.5%).
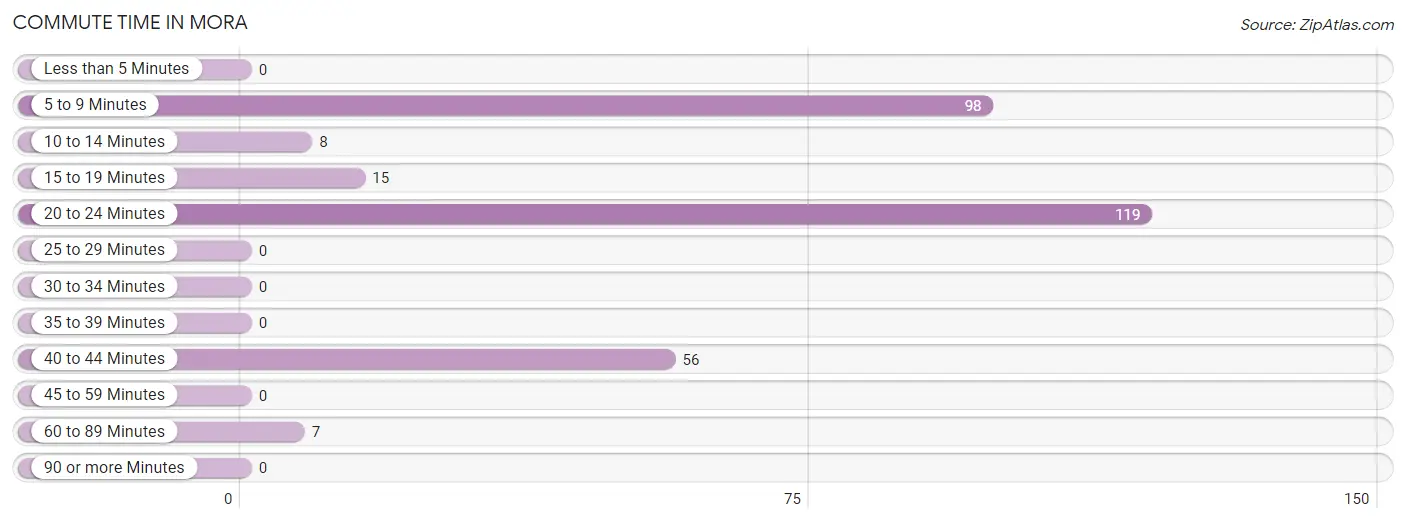
| Commute Time | # Commuters | % Commuters |
| Less than 5 Minutes | 0 | 0.0% |
| 5 to 9 Minutes | 98 | 32.3% |
| 10 to 14 Minutes | 8 | 2.6% |
| 15 to 19 Minutes | 15 | 5.0% |
| 20 to 24 Minutes | 119 | 39.3% |
| 25 to 29 Minutes | 0 | 0.0% |
| 30 to 34 Minutes | 0 | 0.0% |
| 35 to 39 Minutes | 0 | 0.0% |
| 40 to 44 Minutes | 56 | 18.5% |
| 45 to 59 Minutes | 0 | 0.0% |
| 60 to 89 Minutes | 7 | 2.3% |
| 90 or more Minutes | 0 | 0.0% |
Commute Time by Sex in Mora
The most common commute times in Mora are 5 to 9 minutes (98 commuters, 46.5%) for males and 40 to 44 minutes (35 commuters, 38.0%) for females.
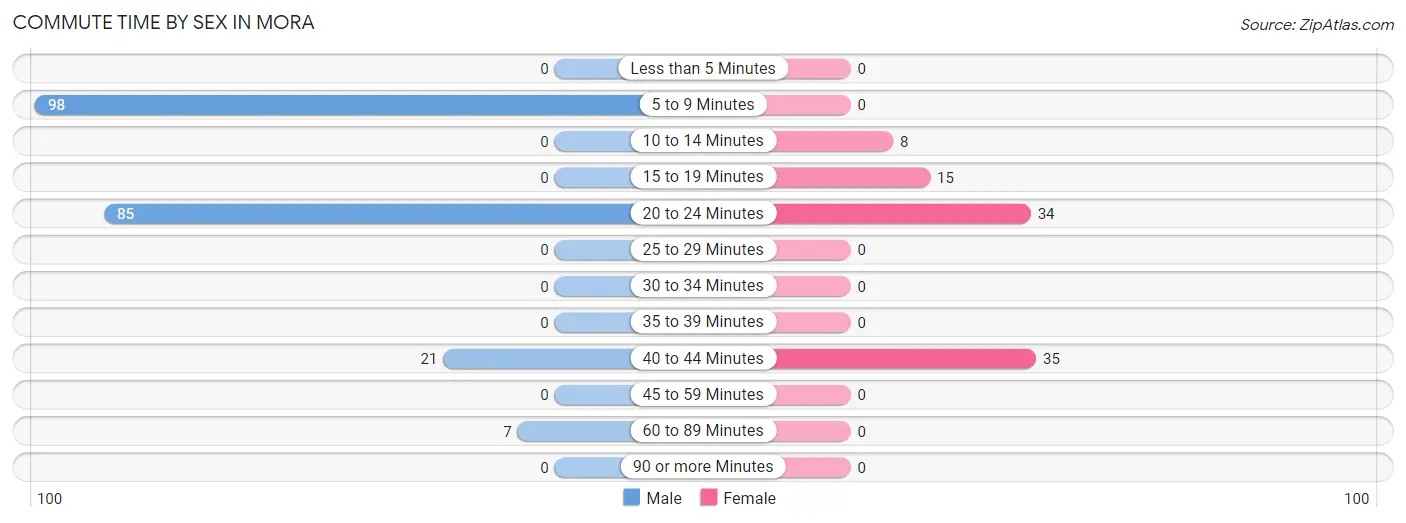
| Commute Time | Male | Female |
| Less than 5 Minutes | 0 (0.0%) | 0 (0.0%) |
| 5 to 9 Minutes | 98 (46.5%) | 0 (0.0%) |
| 10 to 14 Minutes | 0 (0.0%) | 8 (8.7%) |
| 15 to 19 Minutes | 0 (0.0%) | 15 (16.3%) |
| 20 to 24 Minutes | 85 (40.3%) | 34 (37.0%) |
| 25 to 29 Minutes | 0 (0.0%) | 0 (0.0%) |
| 30 to 34 Minutes | 0 (0.0%) | 0 (0.0%) |
| 35 to 39 Minutes | 0 (0.0%) | 0 (0.0%) |
| 40 to 44 Minutes | 21 (10.0%) | 35 (38.0%) |
| 45 to 59 Minutes | 0 (0.0%) | 0 (0.0%) |
| 60 to 89 Minutes | 7 (3.3%) | 0 (0.0%) |
| 90 or more Minutes | 0 (0.0%) | 0 (0.0%) |
Time of Departure to Work by Sex in Mora
The most frequent times of departure to work in Mora are 6:00 AM to 6:29 AM (85, 40.3%) for males and 12:00 AM to 4:59 AM (35, 38.0%) for females.
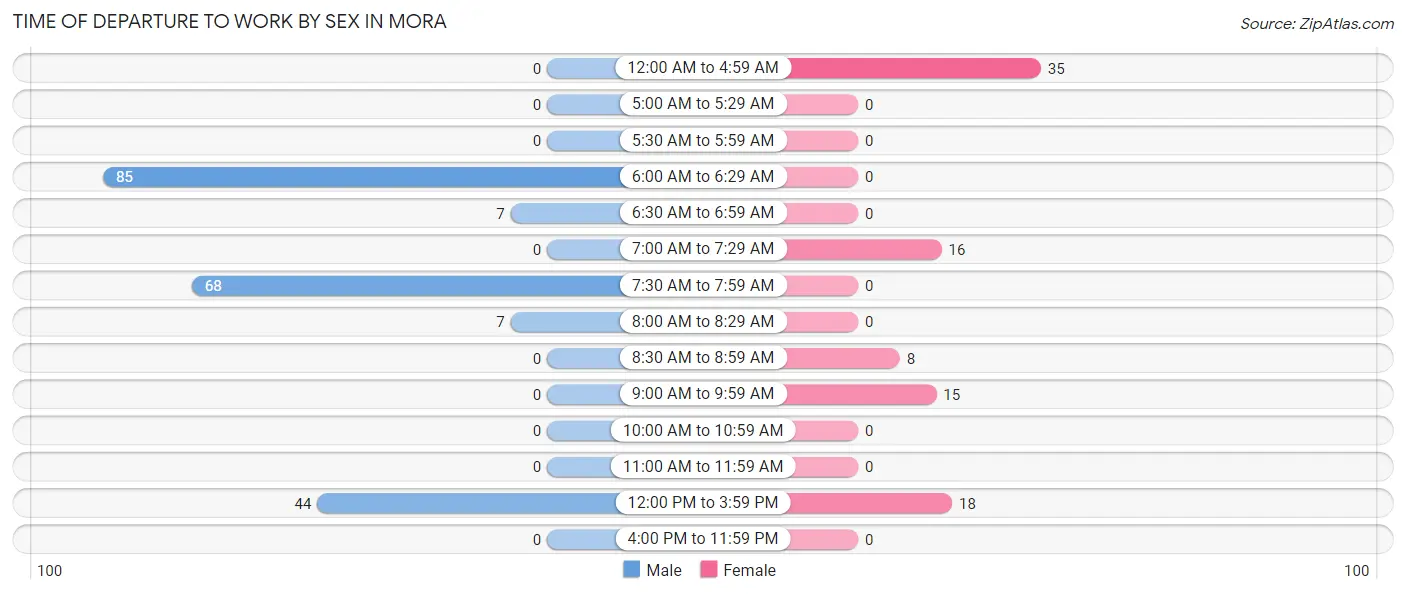
| Time of Departure | Male | Female |
| 12:00 AM to 4:59 AM | 0 (0.0%) | 35 (38.0%) |
| 5:00 AM to 5:29 AM | 0 (0.0%) | 0 (0.0%) |
| 5:30 AM to 5:59 AM | 0 (0.0%) | 0 (0.0%) |
| 6:00 AM to 6:29 AM | 85 (40.3%) | 0 (0.0%) |
| 6:30 AM to 6:59 AM | 7 (3.3%) | 0 (0.0%) |
| 7:00 AM to 7:29 AM | 0 (0.0%) | 16 (17.4%) |
| 7:30 AM to 7:59 AM | 68 (32.2%) | 0 (0.0%) |
| 8:00 AM to 8:29 AM | 7 (3.3%) | 0 (0.0%) |
| 8:30 AM to 8:59 AM | 0 (0.0%) | 8 (8.7%) |
| 9:00 AM to 9:59 AM | 0 (0.0%) | 15 (16.3%) |
| 10:00 AM to 10:59 AM | 0 (0.0%) | 0 (0.0%) |
| 11:00 AM to 11:59 AM | 0 (0.0%) | 0 (0.0%) |
| 12:00 PM to 3:59 PM | 44 (20.8%) | 18 (19.6%) |
| 4:00 PM to 11:59 PM | 0 (0.0%) | 0 (0.0%) |
| Total | 211 (100.0%) | 92 (100.0%) |
Housing Occupancy in Mora
Occupancy by Ownership in Mora
Of the total 492 dwellings in Mora, owner-occupied units account for 304 (61.8%), while renter-occupied units make up 188 (38.2%).
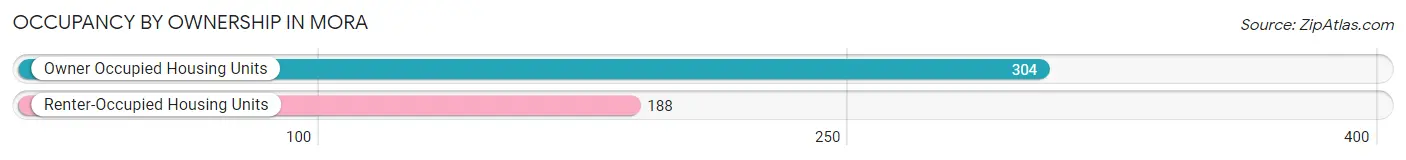
| Occupancy | # Housing Units | % Housing Units |
| Owner Occupied Housing Units | 304 | 61.8% |
| Renter-Occupied Housing Units | 188 | 38.2% |
| Total Occupied Housing Units | 492 | 100.0% |
Occupancy by Household Size in Mora
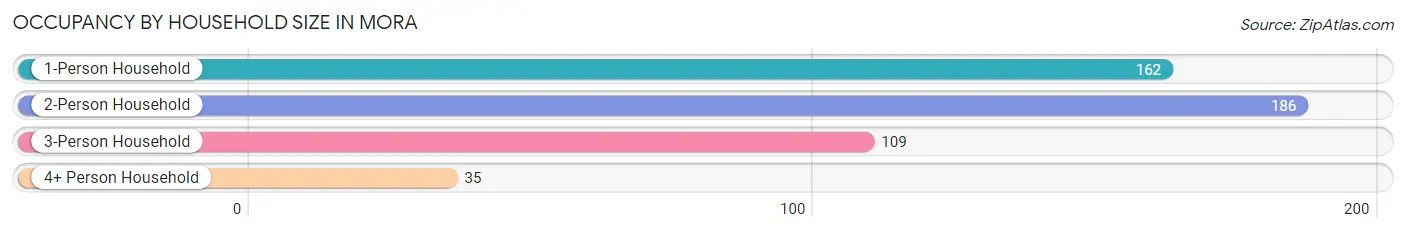
| Household Size | # Housing Units | % Housing Units |
| 1-Person Household | 162 | 32.9% |
| 2-Person Household | 186 | 37.8% |
| 3-Person Household | 109 | 22.2% |
| 4+ Person Household | 35 | 7.1% |
| Total Housing Units | 492 | 100.0% |
Occupancy by Ownership by Household Size in Mora
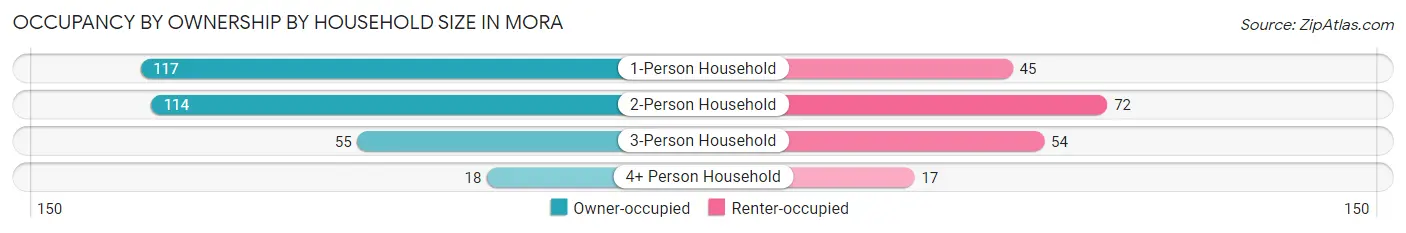
| Household Size | Owner-occupied | Renter-occupied |
| 1-Person Household | 117 (72.2%) | 45 (27.8%) |
| 2-Person Household | 114 (61.3%) | 72 (38.7%) |
| 3-Person Household | 55 (50.5%) | 54 (49.5%) |
| 4+ Person Household | 18 (51.4%) | 17 (48.6%) |
| Total Housing Units | 304 (61.8%) | 188 (38.2%) |
Occupancy by Educational Attainment in Mora
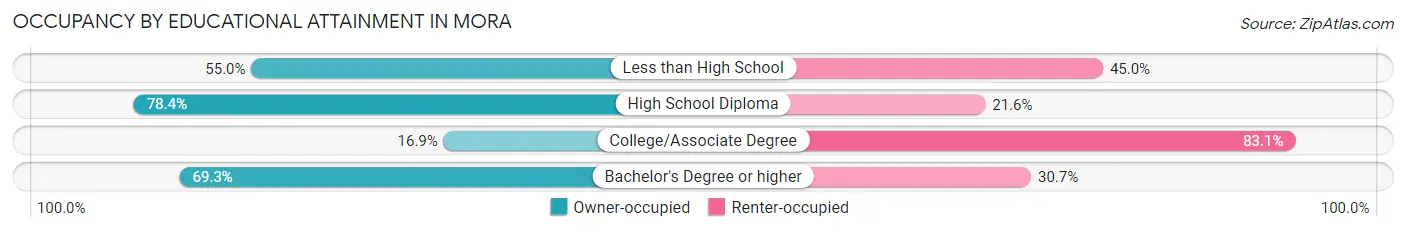
| Household Size | Owner-occupied | Renter-occupied |
| Less than High School | 71 (55.0%) | 58 (45.0%) |
| High School Diploma | 134 (78.4%) | 37 (21.6%) |
| College/Associate Degree | 11 (16.9%) | 54 (83.1%) |
| Bachelor's Degree or higher | 88 (69.3%) | 39 (30.7%) |
Occupancy by Age of Householder in Mora
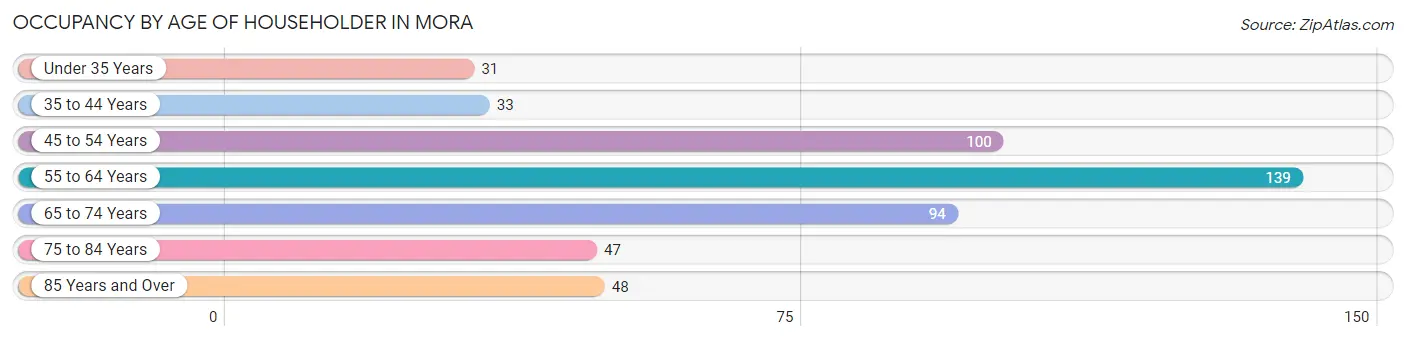
| Age Bracket | # Households | % Households |
| Under 35 Years | 31 | 6.3% |
| 35 to 44 Years | 33 | 6.7% |
| 45 to 54 Years | 100 | 20.3% |
| 55 to 64 Years | 139 | 28.2% |
| 65 to 74 Years | 94 | 19.1% |
| 75 to 84 Years | 47 | 9.6% |
| 85 Years and Over | 48 | 9.8% |
| Total | 492 | 100.0% |
Housing Finances in Mora
Median Income by Occupancy in Mora
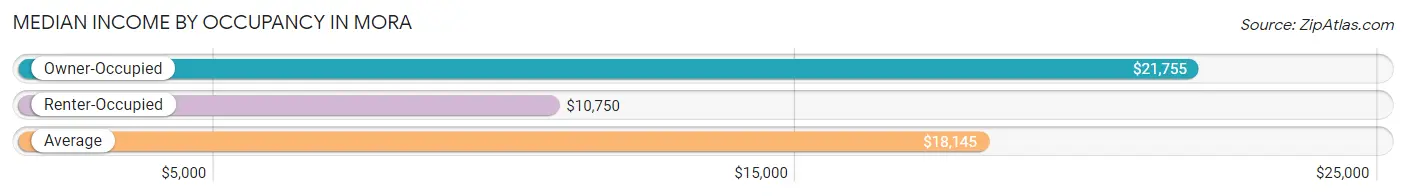
| Occupancy Type | # Households | Median Income |
| Owner-Occupied | 304 (61.8%) | $21,755 |
| Renter-Occupied | 188 (38.2%) | $10,750 |
| Average | 492 (100.0%) | $18,145 |
Occupancy by Householder Income Bracket in Mora
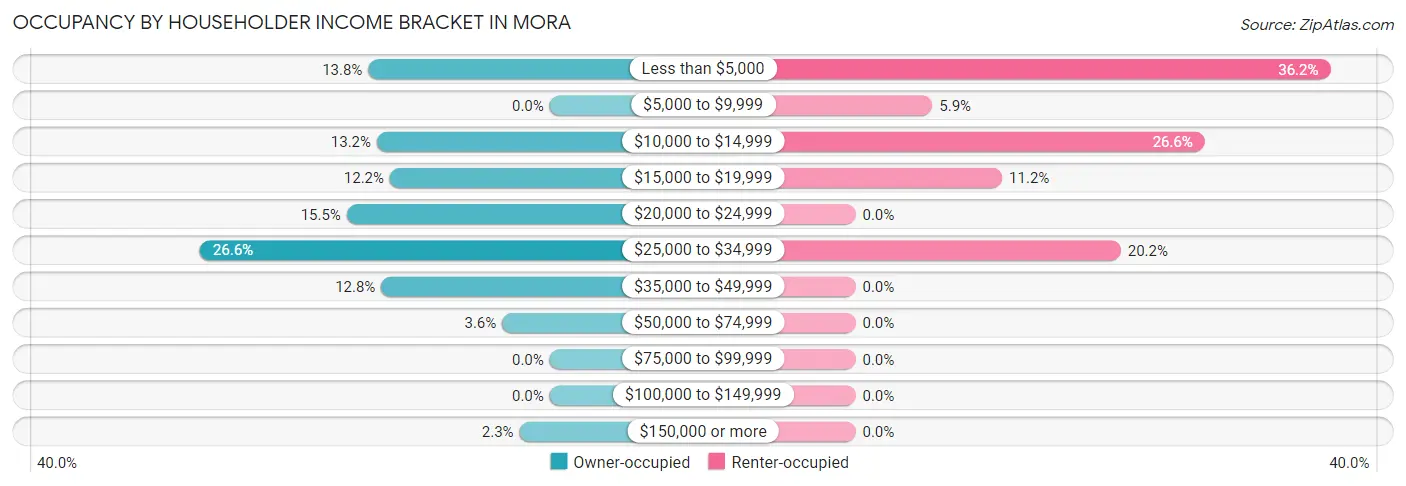
| Income Bracket | Owner-occupied | Renter-occupied |
| Less than $5,000 | 42 (13.8%) | 68 (36.2%) |
| $5,000 to $9,999 | 0 (0.0%) | 11 (5.9%) |
| $10,000 to $14,999 | 40 (13.2%) | 50 (26.6%) |
| $15,000 to $19,999 | 37 (12.2%) | 21 (11.2%) |
| $20,000 to $24,999 | 47 (15.5%) | 0 (0.0%) |
| $25,000 to $34,999 | 81 (26.6%) | 38 (20.2%) |
| $35,000 to $49,999 | 39 (12.8%) | 0 (0.0%) |
| $50,000 to $74,999 | 11 (3.6%) | 0 (0.0%) |
| $75,000 to $99,999 | 0 (0.0%) | 0 (0.0%) |
| $100,000 to $149,999 | 0 (0.0%) | 0 (0.0%) |
| $150,000 or more | 7 (2.3%) | 0 (0.0%) |
| Total | 304 (100.0%) | 188 (100.0%) |
Monthly Housing Cost Tiers in Mora
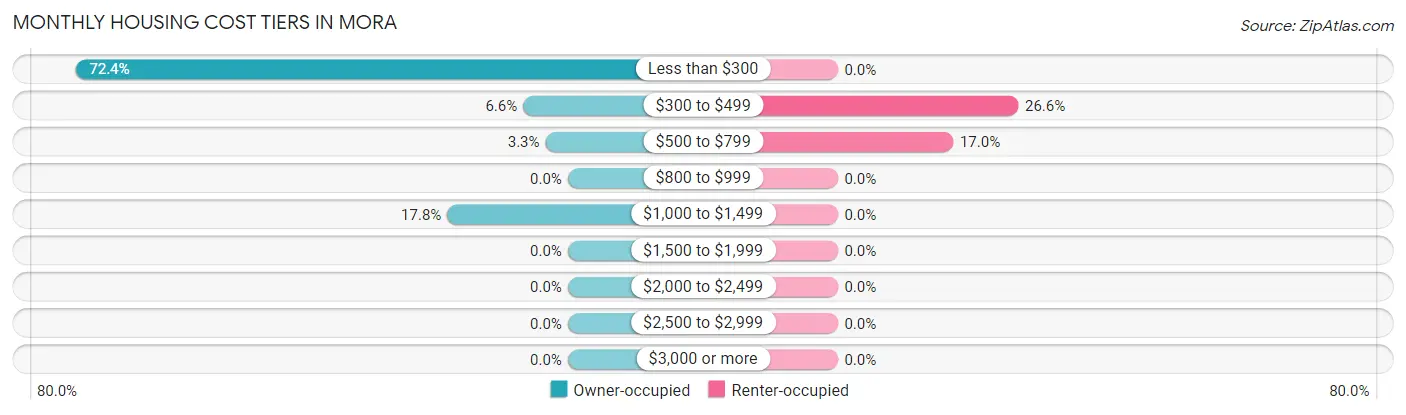
| Monthly Cost | Owner-occupied | Renter-occupied |
| Less than $300 | 220 (72.4%) | 0 (0.0%) |
| $300 to $499 | 20 (6.6%) | 50 (26.6%) |
| $500 to $799 | 10 (3.3%) | 32 (17.0%) |
| $800 to $999 | 0 (0.0%) | 0 (0.0%) |
| $1,000 to $1,499 | 54 (17.8%) | 0 (0.0%) |
| $1,500 to $1,999 | 0 (0.0%) | 0 (0.0%) |
| $2,000 to $2,499 | 0 (0.0%) | 0 (0.0%) |
| $2,500 to $2,999 | 0 (0.0%) | 0 (0.0%) |
| $3,000 or more | 0 (0.0%) | 0 (0.0%) |
| Total | 304 (100.0%) | 188 (100.0%) |
Physical Housing Characteristics in Mora
Housing Structures in Mora
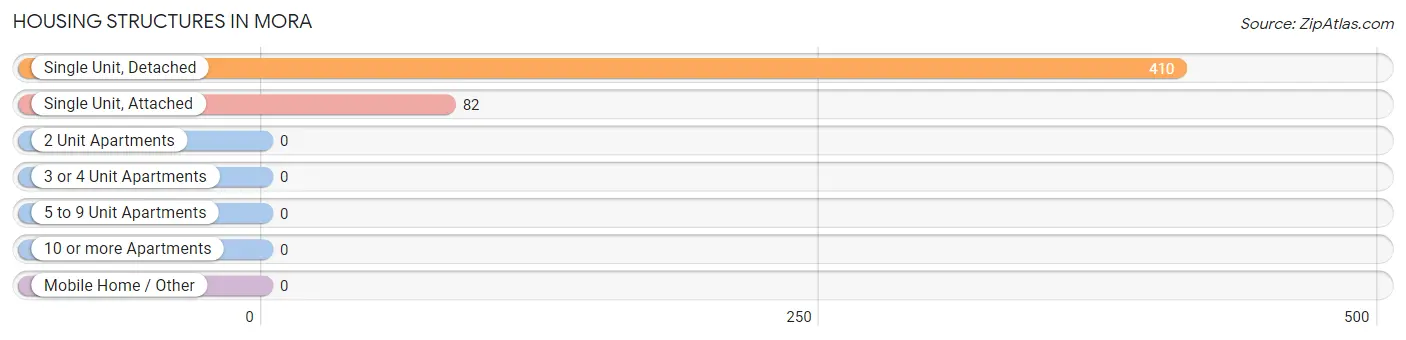
| Structure Type | # Housing Units | % Housing Units |
| Single Unit, Detached | 410 | 83.3% |
| Single Unit, Attached | 82 | 16.7% |
| 2 Unit Apartments | 0 | 0.0% |
| 3 or 4 Unit Apartments | 0 | 0.0% |
| 5 to 9 Unit Apartments | 0 | 0.0% |
| 10 or more Apartments | 0 | 0.0% |
| Mobile Home / Other | 0 | 0.0% |
| Total | 492 | 100.0% |
Housing Structures by Occupancy in Mora
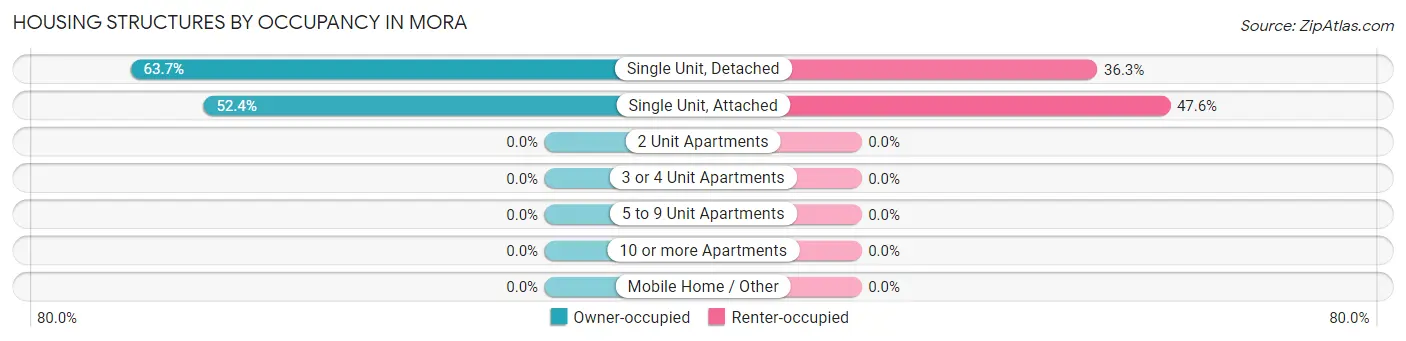
| Structure Type | Owner-occupied | Renter-occupied |
| Single Unit, Detached | 261 (63.7%) | 149 (36.3%) |
| Single Unit, Attached | 43 (52.4%) | 39 (47.6%) |
| 2 Unit Apartments | 0 (0.0%) | 0 (0.0%) |
| 3 or 4 Unit Apartments | 0 (0.0%) | 0 (0.0%) |
| 5 to 9 Unit Apartments | 0 (0.0%) | 0 (0.0%) |
| 10 or more Apartments | 0 (0.0%) | 0 (0.0%) |
| Mobile Home / Other | 0 (0.0%) | 0 (0.0%) |
| Total | 304 (61.8%) | 188 (38.2%) |
Housing Structures by Number of Rooms in Mora
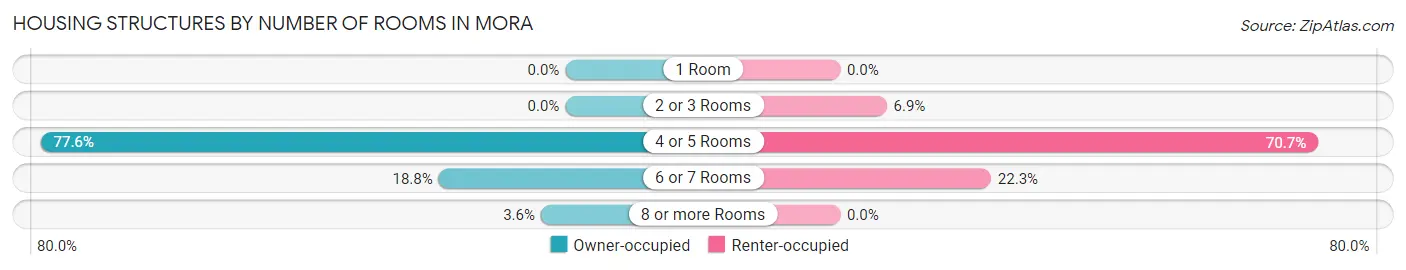
| Number of Rooms | Owner-occupied | Renter-occupied |
| 1 Room | 0 (0.0%) | 0 (0.0%) |
| 2 or 3 Rooms | 0 (0.0%) | 13 (6.9%) |
| 4 or 5 Rooms | 236 (77.6%) | 133 (70.7%) |
| 6 or 7 Rooms | 57 (18.8%) | 42 (22.3%) |
| 8 or more Rooms | 11 (3.6%) | 0 (0.0%) |
| Total | 304 (100.0%) | 188 (100.0%) |
Housing Structure by Heating Type in Mora
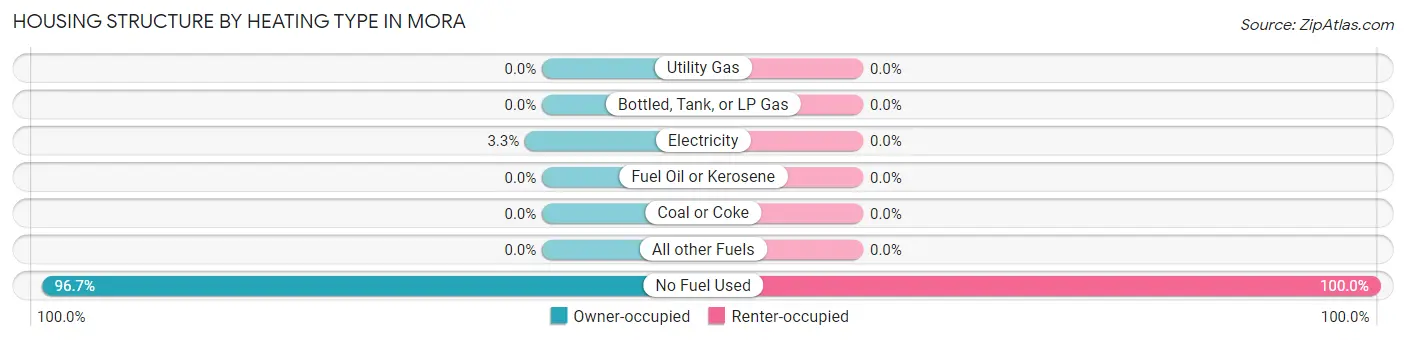
| Heating Type | Owner-occupied | Renter-occupied |
| Utility Gas | 0 (0.0%) | 0 (0.0%) |
| Bottled, Tank, or LP Gas | 0 (0.0%) | 0 (0.0%) |
| Electricity | 10 (3.3%) | 0 (0.0%) |
| Fuel Oil or Kerosene | 0 (0.0%) | 0 (0.0%) |
| Coal or Coke | 0 (0.0%) | 0 (0.0%) |
| All other Fuels | 0 (0.0%) | 0 (0.0%) |
| No Fuel Used | 294 (96.7%) | 188 (100.0%) |
| Total | 304 (100.0%) | 188 (100.0%) |
Household Vehicle Usage in Mora
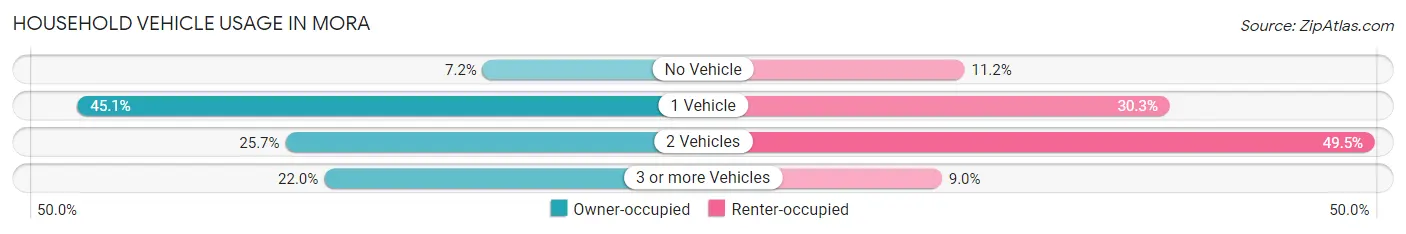
| Vehicles per Household | Owner-occupied | Renter-occupied |
| No Vehicle | 22 (7.2%) | 21 (11.2%) |
| 1 Vehicle | 137 (45.1%) | 57 (30.3%) |
| 2 Vehicles | 78 (25.7%) | 93 (49.5%) |
| 3 or more Vehicles | 67 (22.0%) | 17 (9.0%) |
| Total | 304 (100.0%) | 188 (100.0%) |
Real Estate & Mortgages in Mora
Real Estate and Mortgage Overview in Mora
| Characteristic | Without Mortgage | With Mortgage |
| Housing Units | 220 | 84 |
| Median Property Value | $119,200 | $165,000 |
| Median Household Income | $21,019 | $0 |
| Monthly Housing Costs | $134 | $0 |
| Real Estate Taxes | - | - |
Property Value by Mortgage Status in Mora
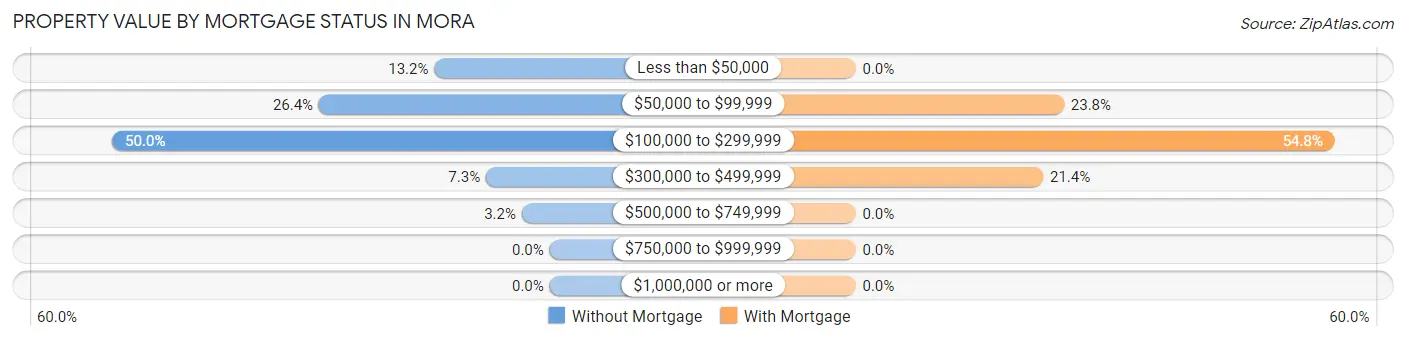
| Property Value | Without Mortgage | With Mortgage |
| Less than $50,000 | 29 (13.2%) | 0 (0.0%) |
| $50,000 to $99,999 | 58 (26.4%) | 20 (23.8%) |
| $100,000 to $299,999 | 110 (50.0%) | 46 (54.8%) |
| $300,000 to $499,999 | 16 (7.3%) | 18 (21.4%) |
| $500,000 to $749,999 | 7 (3.2%) | 0 (0.0%) |
| $750,000 to $999,999 | 0 (0.0%) | 0 (0.0%) |
| $1,000,000 or more | 0 (0.0%) | 0 (0.0%) |
| Total | 220 (100.0%) | 84 (100.0%) |
Household Income by Mortgage Status in Mora
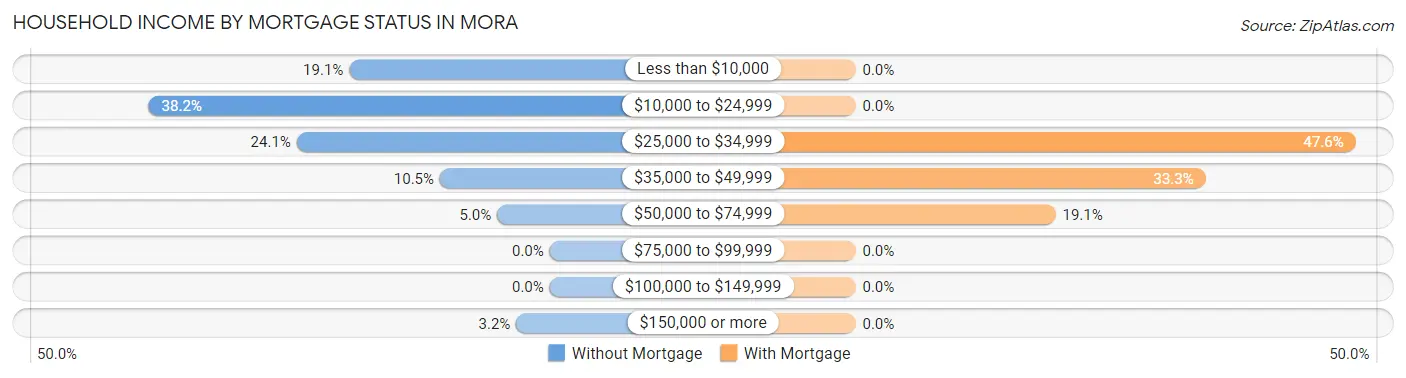
| Household Income | Without Mortgage | With Mortgage |
| Less than $10,000 | 42 (19.1%) | 0 (0.0%) |
| $10,000 to $24,999 | 84 (38.2%) | 0 (0.0%) |
| $25,000 to $34,999 | 53 (24.1%) | 40 (47.6%) |
| $35,000 to $49,999 | 23 (10.4%) | 28 (33.3%) |
| $50,000 to $74,999 | 11 (5.0%) | 16 (19.1%) |
| $75,000 to $99,999 | 0 (0.0%) | 0 (0.0%) |
| $100,000 to $149,999 | 0 (0.0%) | 0 (0.0%) |
| $150,000 or more | 7 (3.2%) | 0 (0.0%) |
| Total | 220 (100.0%) | 84 (100.0%) |
Property Value to Household Income Ratio in Mora
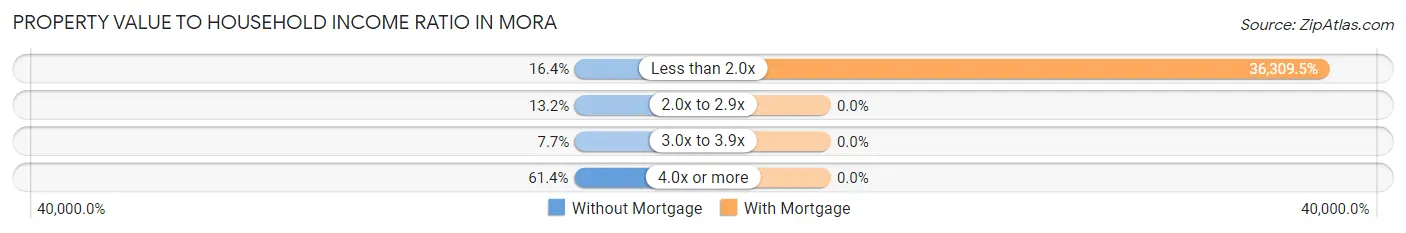
| Value-to-Income Ratio | Without Mortgage | With Mortgage |
| Less than 2.0x | 36 (16.4%) | 30,500 (36,309.5%) |
| 2.0x to 2.9x | 29 (13.2%) | 0 (0.0%) |
| 3.0x to 3.9x | 17 (7.7%) | 0 (0.0%) |
| 4.0x or more | 135 (61.4%) | 0 (0.0%) |
| Total | 220 (100.0%) | 84 (100.0%) |
Real Estate Taxes by Mortgage Status in Mora
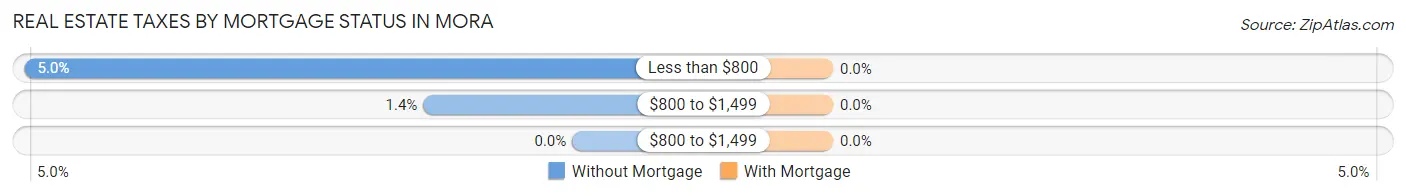
| Property Taxes | Without Mortgage | With Mortgage |
| Less than $800 | 11 (5.0%) | 0 (0.0%) |
| $800 to $1,499 | 3 (1.4%) | 0 (0.0%) |
| $800 to $1,499 | 0 (0.0%) | 0 (0.0%) |
| Total | 220 (100.0%) | 84 (100.0%) |
Health & Disability in Mora
Health Insurance Coverage by Age in Mora
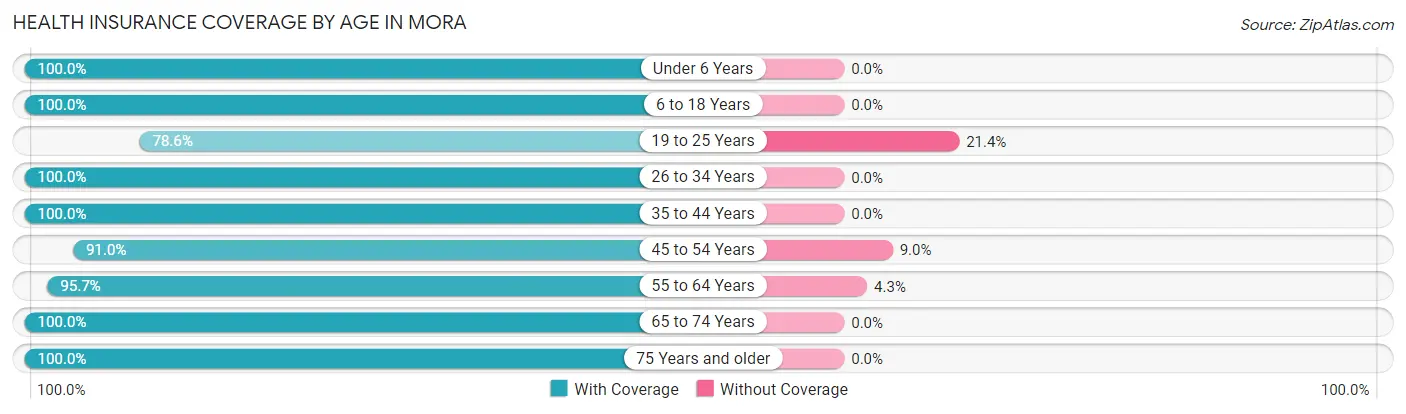
| Age Bracket | With Coverage | Without Coverage |
| Under 6 Years | 9 (100.0%) | 0 (0.0%) |
| 6 to 18 Years | 190 (100.0%) | 0 (0.0%) |
| 19 to 25 Years | 88 (78.6%) | 24 (21.4%) |
| 26 to 34 Years | 246 (100.0%) | 0 (0.0%) |
| 35 to 44 Years | 69 (100.0%) | 0 (0.0%) |
| 45 to 54 Years | 141 (91.0%) | 14 (9.0%) |
| 55 to 64 Years | 225 (95.7%) | 10 (4.3%) |
| 65 to 74 Years | 166 (100.0%) | 0 (0.0%) |
| 75 Years and older | 128 (100.0%) | 0 (0.0%) |
| Total | 1,262 (96.3%) | 48 (3.7%) |
Health Insurance Coverage by Citizenship Status in Mora
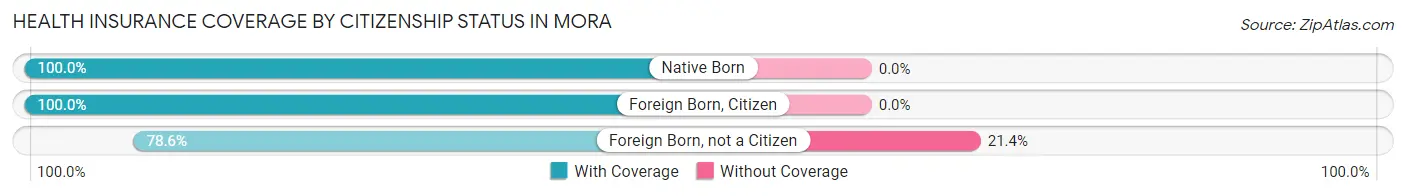
| Citizenship Status | With Coverage | Without Coverage |
| Native Born | 9 (100.0%) | 0 (0.0%) |
| Foreign Born, Citizen | 190 (100.0%) | 0 (0.0%) |
| Foreign Born, not a Citizen | 88 (78.6%) | 24 (21.4%) |
Health Insurance Coverage by Household Income in Mora
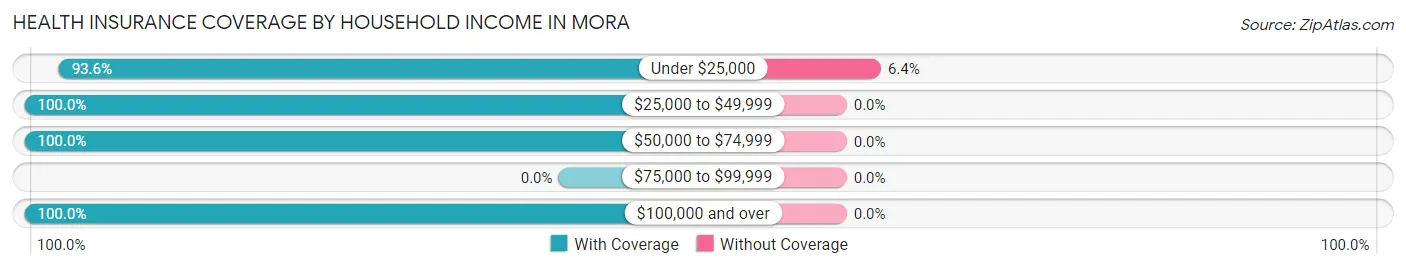
| Household Income | With Coverage | Without Coverage |
| Under $25,000 | 702 (93.6%) | 48 (6.4%) |
| $25,000 to $49,999 | 516 (100.0%) | 0 (0.0%) |
| $50,000 to $74,999 | 22 (100.0%) | 0 (0.0%) |
| $75,000 to $99,999 | 0 (0.0%) | 0 (0.0%) |
| $100,000 and over | 7 (100.0%) | 0 (0.0%) |
Public vs Private Health Insurance Coverage by Age in Mora
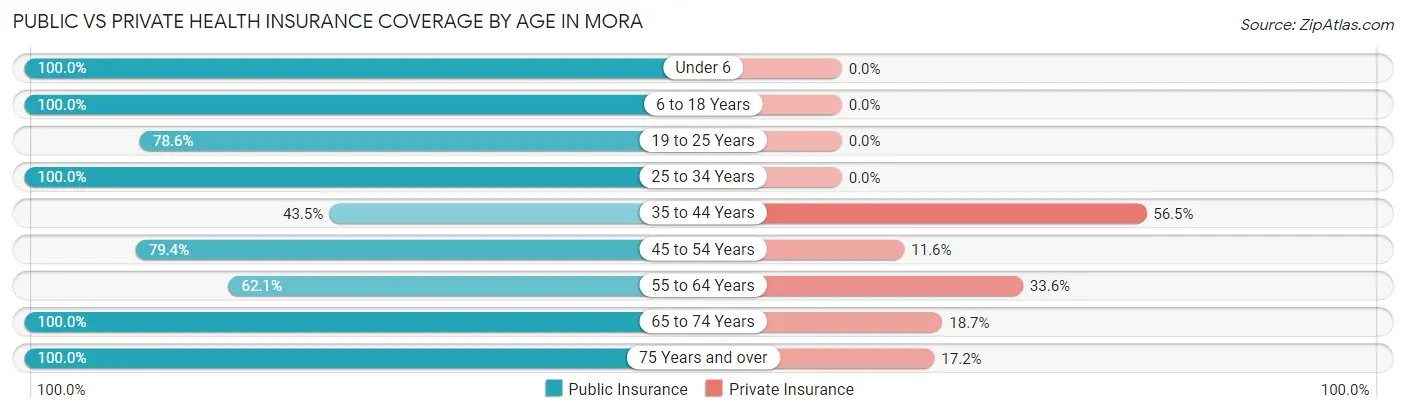
| Age Bracket | Public Insurance | Private Insurance |
| Under 6 | 9 (100.0%) | 0 (0.0%) |
| 6 to 18 Years | 190 (100.0%) | 0 (0.0%) |
| 19 to 25 Years | 88 (78.6%) | 0 (0.0%) |
| 25 to 34 Years | 246 (100.0%) | 0 (0.0%) |
| 35 to 44 Years | 30 (43.5%) | 39 (56.5%) |
| 45 to 54 Years | 123 (79.3%) | 18 (11.6%) |
| 55 to 64 Years | 146 (62.1%) | 79 (33.6%) |
| 65 to 74 Years | 166 (100.0%) | 31 (18.7%) |
| 75 Years and over | 128 (100.0%) | 22 (17.2%) |
| Total | 1,126 (86.0%) | 189 (14.4%) |
Disability Status by Sex by Age in Mora
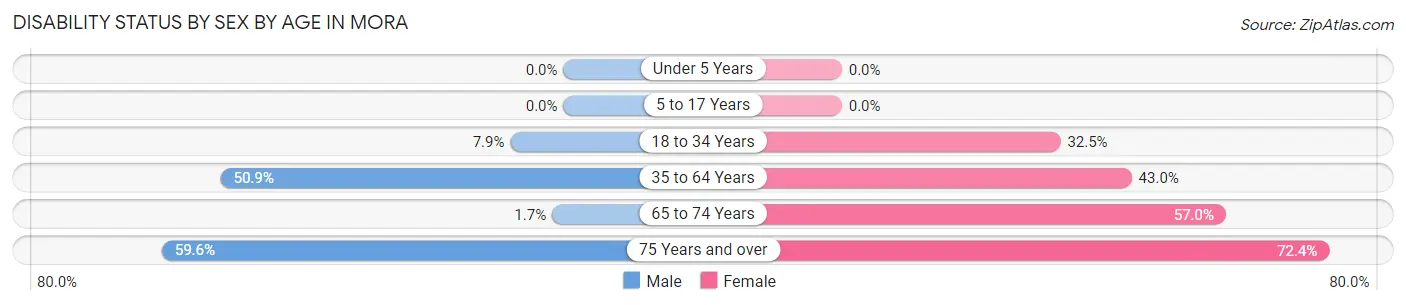
| Age Bracket | Male | Female |
| Under 5 Years | 0 (0.0%) | 0 (0.0%) |
| 5 to 17 Years | 0 (0.0%) | 0 (0.0%) |
| 18 to 34 Years | 26 (7.9%) | 25 (32.5%) |
| 35 to 64 Years | 113 (50.9%) | 102 (43.0%) |
| 65 to 74 Years | 1 (1.7%) | 61 (57.0%) |
| 75 Years and over | 31 (59.6%) | 55 (72.4%) |
Disability Class by Sex by Age in Mora
Disability Class: Hearing Difficulty
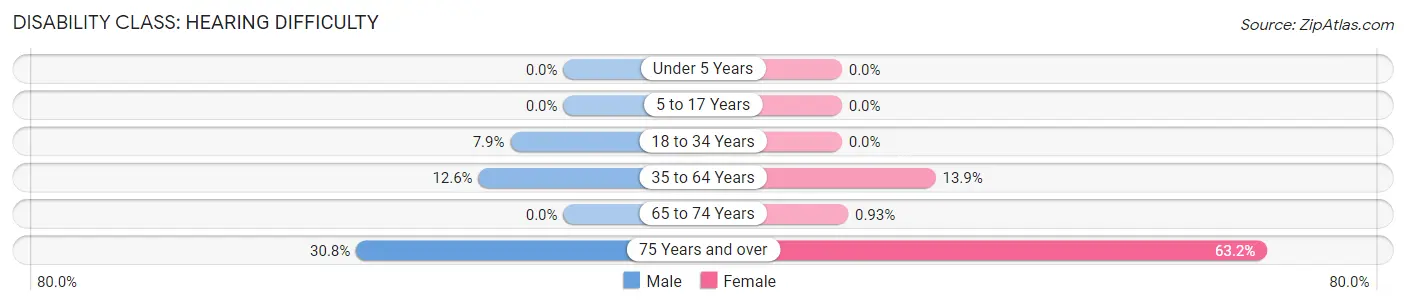
| Age Bracket | Male | Female |
| Under 5 Years | 0 (0.0%) | 0 (0.0%) |
| 5 to 17 Years | 0 (0.0%) | 0 (0.0%) |
| 18 to 34 Years | 26 (7.9%) | 0 (0.0%) |
| 35 to 64 Years | 28 (12.6%) | 33 (13.9%) |
| 65 to 74 Years | 0 (0.0%) | 1 (0.9%) |
| 75 Years and over | 16 (30.8%) | 48 (63.2%) |
Disability Class: Vision Difficulty
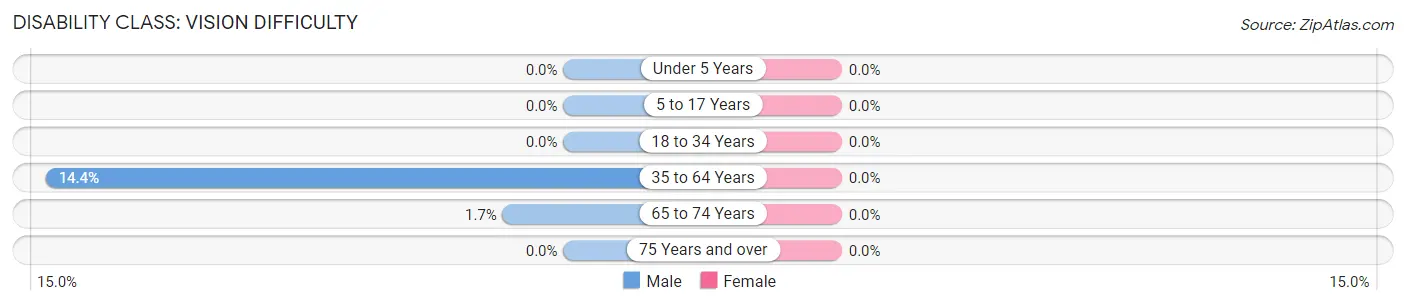
| Age Bracket | Male | Female |
| Under 5 Years | 0 (0.0%) | 0 (0.0%) |
| 5 to 17 Years | 0 (0.0%) | 0 (0.0%) |
| 18 to 34 Years | 0 (0.0%) | 0 (0.0%) |
| 35 to 64 Years | 32 (14.4%) | 0 (0.0%) |
| 65 to 74 Years | 1 (1.7%) | 0 (0.0%) |
| 75 Years and over | 0 (0.0%) | 0 (0.0%) |
Disability Class: Cognitive Difficulty
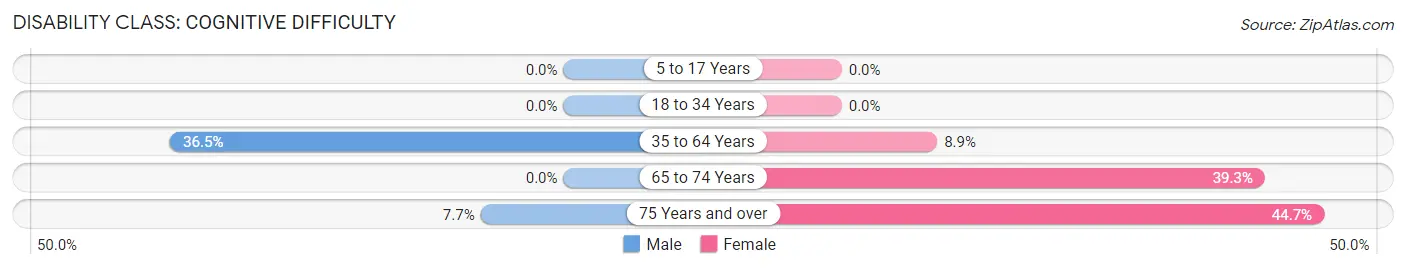
| Age Bracket | Male | Female |
| 5 to 17 Years | 0 (0.0%) | 0 (0.0%) |
| 18 to 34 Years | 0 (0.0%) | 0 (0.0%) |
| 35 to 64 Years | 81 (36.5%) | 21 (8.9%) |
| 65 to 74 Years | 0 (0.0%) | 42 (39.3%) |
| 75 Years and over | 4 (7.7%) | 34 (44.7%) |
Disability Class: Ambulatory Difficulty
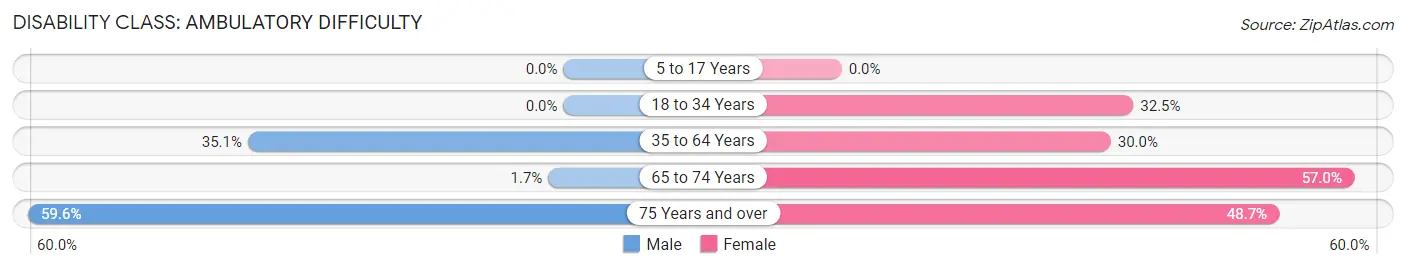
| Age Bracket | Male | Female |
| 5 to 17 Years | 0 (0.0%) | 0 (0.0%) |
| 18 to 34 Years | 0 (0.0%) | 25 (32.5%) |
| 35 to 64 Years | 78 (35.1%) | 71 (30.0%) |
| 65 to 74 Years | 1 (1.7%) | 61 (57.0%) |
| 75 Years and over | 31 (59.6%) | 37 (48.7%) |
Disability Class: Self-Care Difficulty
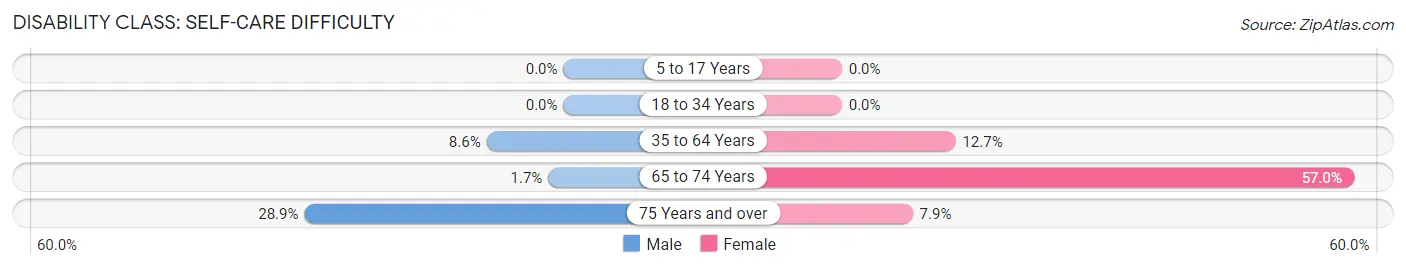
| Age Bracket | Male | Female |
| 5 to 17 Years | 0 (0.0%) | 0 (0.0%) |
| 18 to 34 Years | 0 (0.0%) | 0 (0.0%) |
| 35 to 64 Years | 19 (8.6%) | 30 (12.7%) |
| 65 to 74 Years | 1 (1.7%) | 61 (57.0%) |
| 75 Years and over | 15 (28.8%) | 6 (7.9%) |
Technology Access in Mora
Computing Device Access in Mora
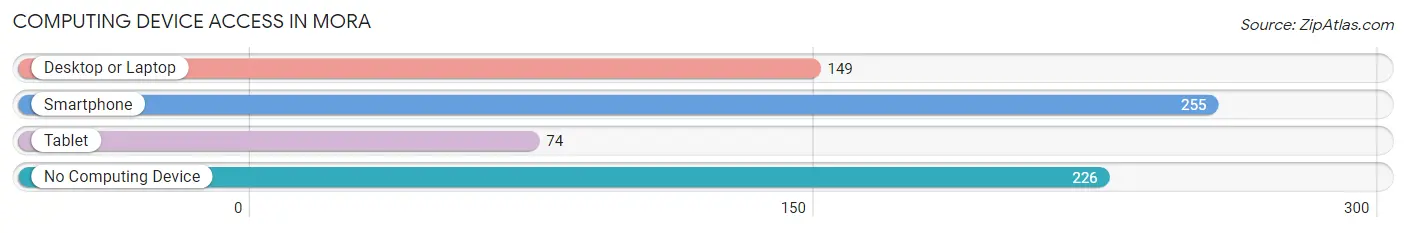
| Device Type | # Households | % Households |
| Desktop or Laptop | 149 | 30.3% |
| Smartphone | 255 | 51.8% |
| Tablet | 74 | 15.0% |
| No Computing Device | 226 | 45.9% |
| Total | 492 | 100.0% |
Internet Access in Mora
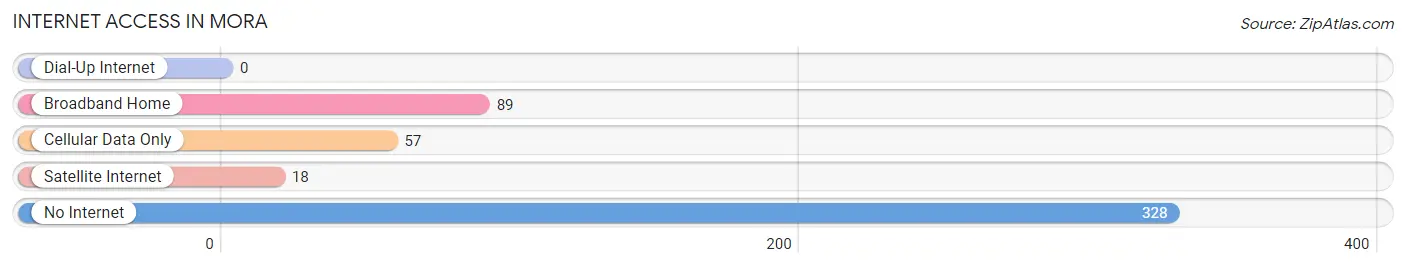
| Internet Type | # Households | % Households |
| Dial-Up Internet | 0 | 0.0% |
| Broadband Home | 89 | 18.1% |
| Cellular Data Only | 57 | 11.6% |
| Satellite Internet | 18 | 3.7% |
| No Internet | 328 | 66.7% |
| Total | 492 | 100.0% |
Mora Summary
Mora is a municipality located in the central region of Puerto Rico. It is part of the San Juan-Caguas-Guaynabo Metropolitan Statistical Area. The town is located in the northern part of the island, in the foothills of the Cordillera Central mountain range. As of the 2010 census, the population of Mora was 8,845.
History
Mora was founded in 1815 by Don Juan de Mora, a Spanish soldier who was granted a land grant by the Spanish Crown. The town was originally called San Juan de la Mora, but the name was later shortened to Mora. The town was officially recognized by the Spanish government in 1820.
In the 19th century, Mora was an important agricultural center, producing coffee, sugar cane, and tobacco. The town was also known for its pottery and ceramics.
Geography
Mora is located in the northern part of Puerto Rico, in the foothills of the Cordillera Central mountain range. The town is bordered by the municipalities of San Juan, Caguas, and Guaynabo. The town has a total area of 8.3 square miles (21.5 km2).
Economy
Mora's economy is largely based on agriculture, with coffee, sugar cane, and tobacco being the main crops. The town is also known for its pottery and ceramics.
Demographics
As of the 2010 census, the population of Mora was 8,845. The population is mostly of Spanish and African descent. The median household income in Mora is $17,845, and the median age is 37. The town has a literacy rate of 94.3%.
Common Questions
What is Per Capita Income in Mora?
Per Capita income in Mora is $11,740.
What is the Median Family Income in Mora?
Median Family Income in Mora is $17,143.
What is the Median Household income in Mora?
Median Household Income in Mora is $18,145.
What is Inequality or Gini Index in Mora?
Inequality or Gini Index in Mora is 0.55.
What is the Total Population of Mora?
Total Population of Mora is 1,337.
What is the Total Male Population of Mora?
Total Male Population of Mora is 827.
What is the Total Female Population of Mora?
Total Female Population of Mora is 510.
What is the Ratio of Males per 100 Females in Mora?
There are 162.16 Males per 100 Females in Mora.
What is the Ratio of Females per 100 Males in Mora?
There are 61.67 Females per 100 Males in Mora.
What is the Median Population Age in Mora?
Median Population Age in Mora is 49.4 Years.
What is the Average Family Size in Mora
Average Family Size in Mora is 3.3 People.
What is the Average Household Size in Mora
Average Household Size in Mora is 2.6 People.
How Large is the Labor Force in Mora?
There are 334 People in the Labor Forcein in Mora.
What is the Percentage of People in the Labor Force in Mora?
27.7% of People are in the Labor Force in Mora.
What is the Unemployment Rate in Mora?
Unemployment Rate in Mora is 9.3%.