Las Croabas, PR Map & Demographics
Las Croabas Map
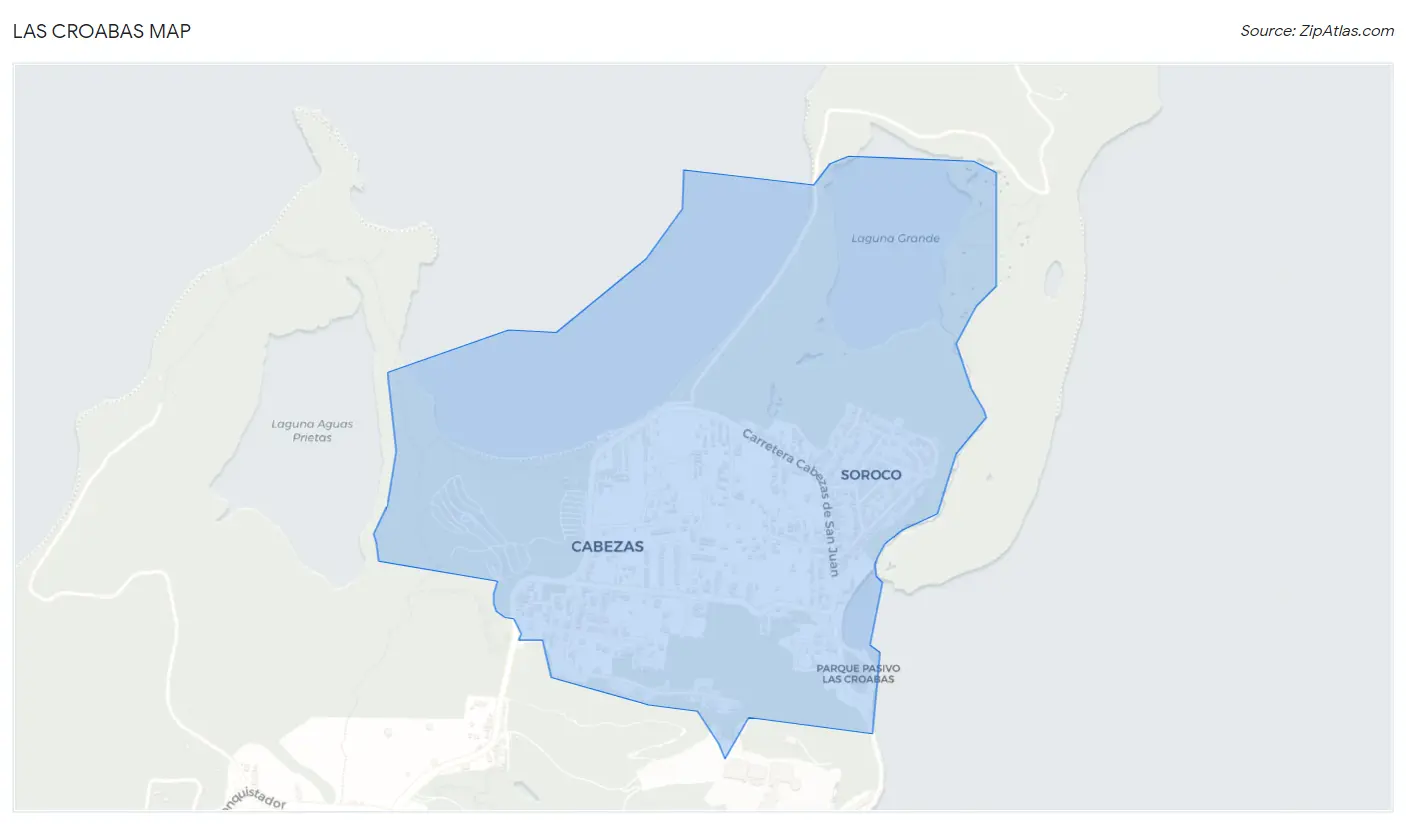
Las Croabas Overview
$13,043
PER CAPITA INCOME
$18,375
AVG FAMILY INCOME
$16,795
AVG HOUSEHOLD INCOME
5.7%
WAGE / INCOME GAP [ % ]
94.3¢/ $1
WAGE / INCOME GAP [ $ ]
0.35
INEQUALITY / GINI INDEX
666
TOTAL POPULATION
375
MALE POPULATION
291
FEMALE POPULATION
128.87
MALES / 100 FEMALES
77.60
FEMALES / 100 MALES
53.0
MEDIAN AGE
2.9
AVG FAMILY SIZE
1.9
AVG HOUSEHOLD SIZE
246
LABOR FORCE [ PEOPLE ]
44.6%
PERCENT IN LABOR FORCE
15.4%
UNEMPLOYMENT RATE
Income in Las Croabas
Income Overview in Las Croabas
Per Capita Income in Las Croabas is $13,043, while median incomes of families and households are $18,375 and $16,795 respectively.
| Characteristic | Number | Measure |
| Per Capita Income | 666 | $13,043 |
| Median Family Income | 158 | $18,375 |
| Mean Family Income | 158 | $21,012 |
| Median Household Income | 353 | $16,795 |
| Mean Household Income | 353 | $23,692 |
| Income Deficit | 158 | $0 |
| Wage / Income Gap (%) | 666 | 5.73% |
| Wage / Income Gap ($) | 666 | 94.27¢ per $1 |
| Gini / Inequality Index | 666 | 0.35 |
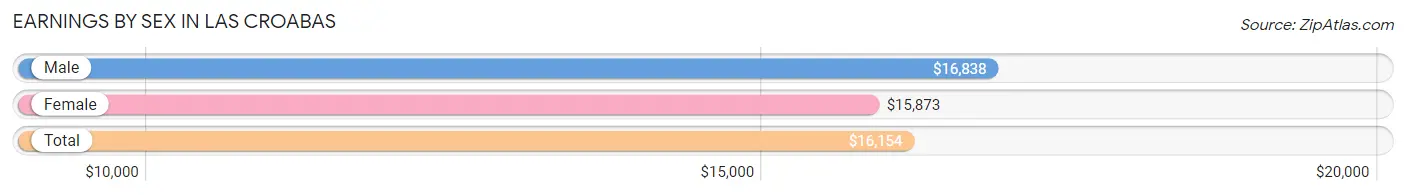
Earnings by Sex in Las Croabas
Average Earnings in Las Croabas are $16,154, $16,838 for men and $15,873 for women, a difference of 5.7%.
| Sex | Number | Average Earnings |
| Male | 90 (39.5%) | $16,838 |
| Female | 138 (60.5%) | $15,873 |
| Total | 228 (100.0%) | $16,154 |
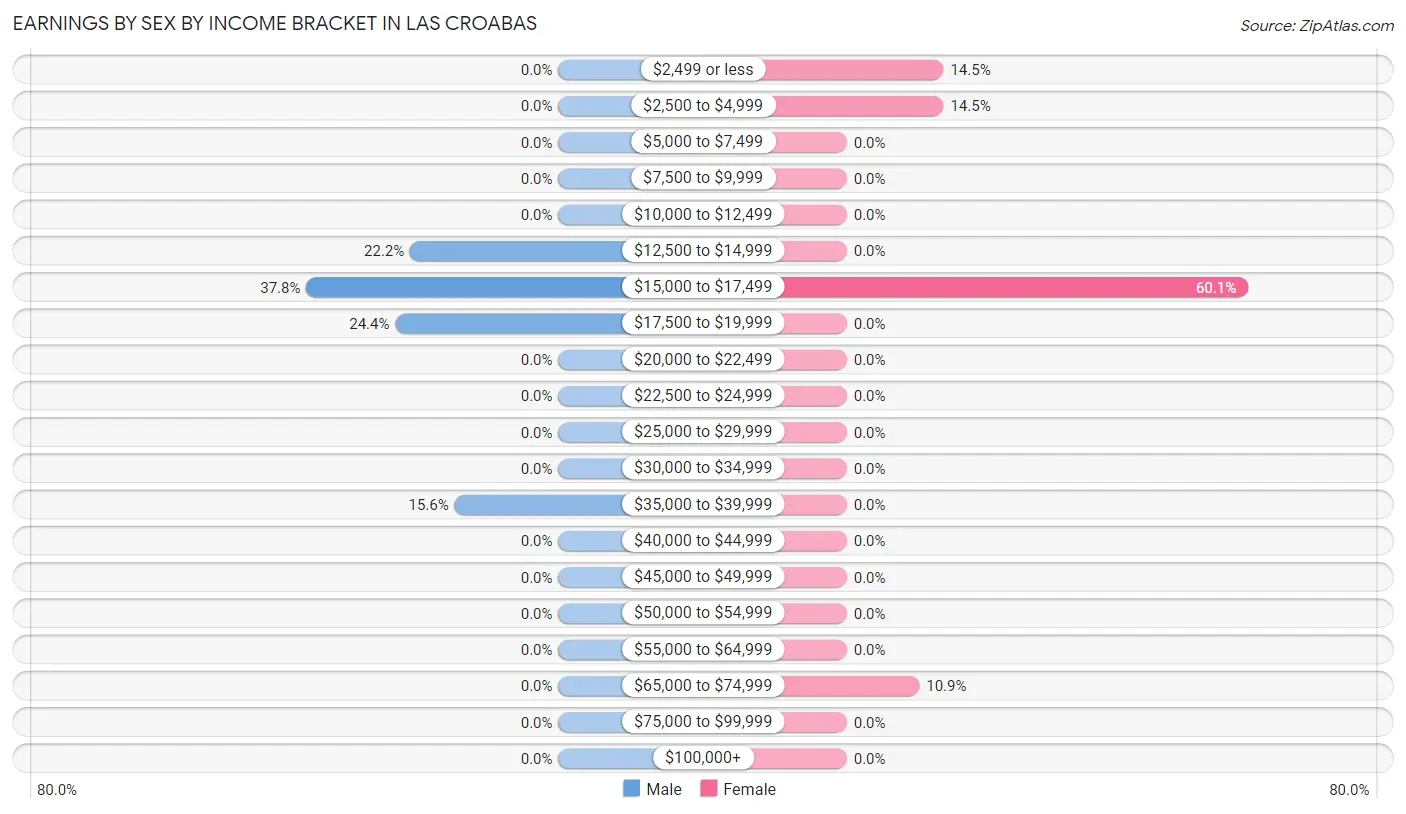
Earnings by Sex by Income Bracket in Las Croabas
The most common earnings brackets in Las Croabas are $15,000 to $17,499 for men (34 | 37.8%) and $15,000 to $17,499 for women (83 | 60.1%).
| Income | Male | Female |
| $2,499 or less | 0 (0.0%) | 20 (14.5%) |
| $2,500 to $4,999 | 0 (0.0%) | 20 (14.5%) |
| $5,000 to $7,499 | 0 (0.0%) | 0 (0.0%) |
| $7,500 to $9,999 | 0 (0.0%) | 0 (0.0%) |
| $10,000 to $12,499 | 0 (0.0%) | 0 (0.0%) |
| $12,500 to $14,999 | 20 (22.2%) | 0 (0.0%) |
| $15,000 to $17,499 | 34 (37.8%) | 83 (60.1%) |
| $17,500 to $19,999 | 22 (24.4%) | 0 (0.0%) |
| $20,000 to $22,499 | 0 (0.0%) | 0 (0.0%) |
| $22,500 to $24,999 | 0 (0.0%) | 0 (0.0%) |
| $25,000 to $29,999 | 0 (0.0%) | 0 (0.0%) |
| $30,000 to $34,999 | 0 (0.0%) | 0 (0.0%) |
| $35,000 to $39,999 | 14 (15.6%) | 0 (0.0%) |
| $40,000 to $44,999 | 0 (0.0%) | 0 (0.0%) |
| $45,000 to $49,999 | 0 (0.0%) | 0 (0.0%) |
| $50,000 to $54,999 | 0 (0.0%) | 0 (0.0%) |
| $55,000 to $64,999 | 0 (0.0%) | 0 (0.0%) |
| $65,000 to $74,999 | 0 (0.0%) | 15 (10.9%) |
| $75,000 to $99,999 | 0 (0.0%) | 0 (0.0%) |
| $100,000+ | 0 (0.0%) | 0 (0.0%) |
| Total | 90 (100.0%) | 138 (100.0%) |
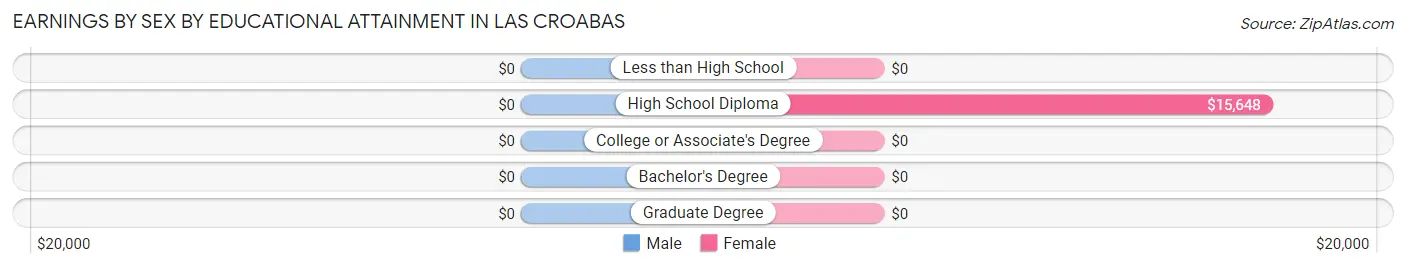
Earnings by Sex by Educational Attainment in Las Croabas
| Educational Attainment | Male Income | Female Income |
| Less than High School | - | - |
| High School Diploma | - | - |
| College or Associate's Degree | - | - |
| Bachelor's Degree | - | - |
| Graduate Degree | - | - |
| Total | $16,838 | $15,873 |
Family Income in Las Croabas
Family Income Brackets in Las Croabas
According to the Las Croabas family income data, there are 92 families falling into the $15,000 to $24,999 income range, which is the most common income bracket and makes up 58.2% of all families.
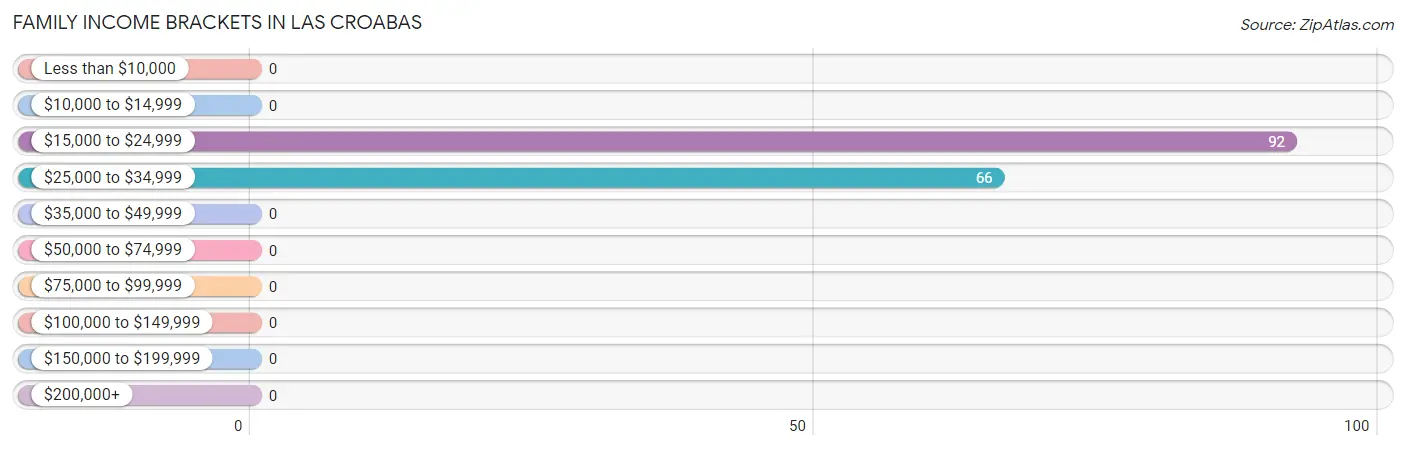
| Income Bracket | # Families | % Families |
| Less than $10,000 | 0 | 0.0% |
| $10,000 to $14,999 | 0 | 0.0% |
| $15,000 to $24,999 | 92 | 58.2% |
| $25,000 to $34,999 | 66 | 41.8% |
| $35,000 to $49,999 | 0 | 0.0% |
| $50,000 to $74,999 | 0 | 0.0% |
| $75,000 to $99,999 | 0 | 0.0% |
| $100,000 to $149,999 | 0 | 0.0% |
| $150,000 to $199,999 | 0 | 0.0% |
| $200,000+ | 0 | 0.0% |
Family Income by Famaliy Size in Las Croabas
2-person families (105 | 66.5%) account for the highest median family income in Las Croabas with $16,823 per family, while 2-person families (105 | 66.5%) have the highest median income of $8,412 per family member.
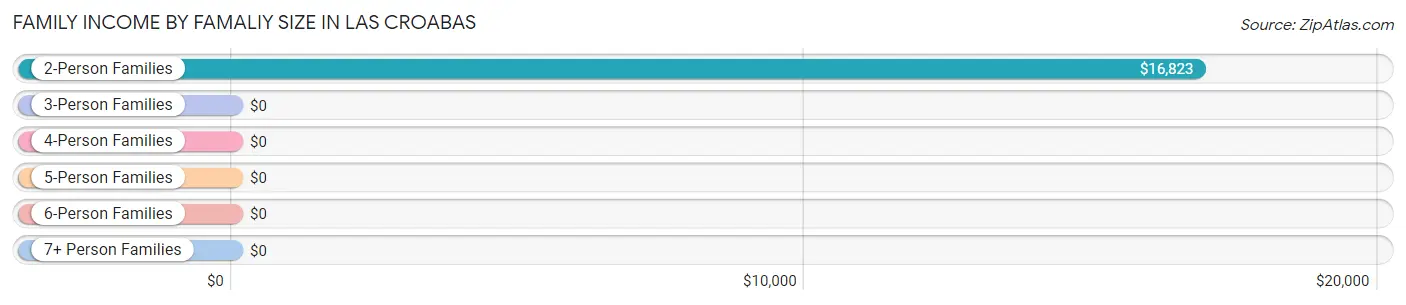
| Income Bracket | # Families | Median Income |
| 2-Person Families | 105 (66.5%) | $16,823 |
| 3-Person Families | 33 (20.9%) | $0 |
| 4-Person Families | 20 (12.7%) | $0 |
| 5-Person Families | 0 (0.0%) | $0 |
| 6-Person Families | 0 (0.0%) | $0 |
| 7+ Person Families | 0 (0.0%) | $0 |
| Total | 158 (100.0%) | $18,375 |
Family Income by Number of Earners in Las Croabas
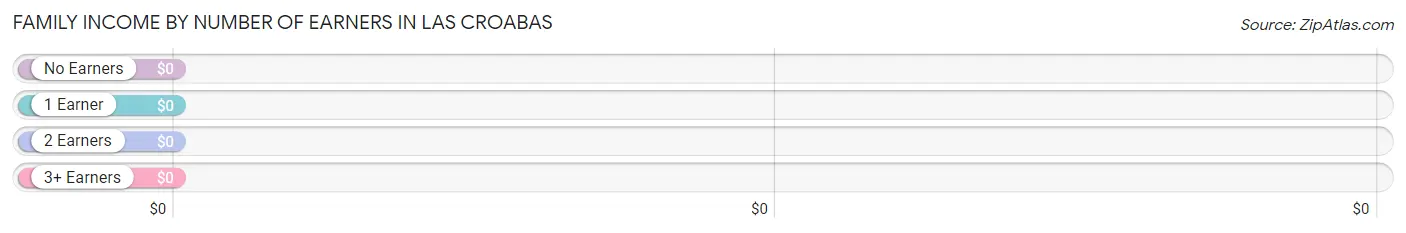
| Number of Earners | # Families | Median Income |
| No Earners | 94 (59.5%) | $0 |
| 1 Earner | 44 (27.9%) | $0 |
| 2 Earners | 20 (12.7%) | $0 |
| 3+ Earners | 0 (0.0%) | $0 |
| Total | 158 (100.0%) | $18,375 |
Household Income in Las Croabas
Household Income Brackets in Las Croabas
With 185 households falling in the category, the $15,000 to $24,999 income range is the most frequent in Las Croabas, accounting for 52.4% of all households.
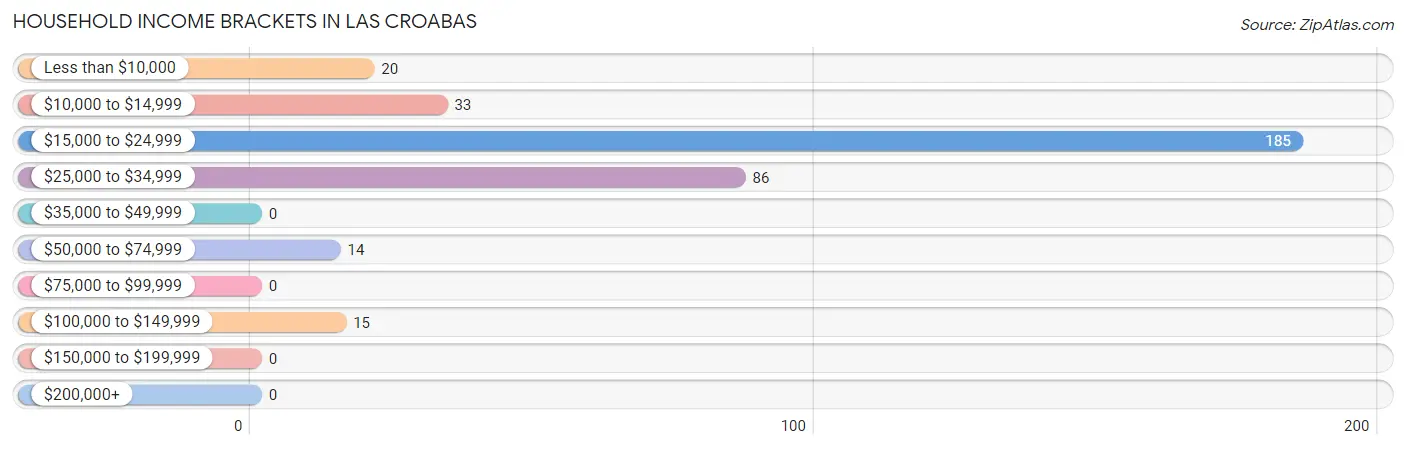
| Income Bracket | # Households | % Households |
| Less than $10,000 | 20 | 5.7% |
| $10,000 to $14,999 | 33 | 9.3% |
| $15,000 to $24,999 | 185 | 52.4% |
| $25,000 to $34,999 | 86 | 24.4% |
| $35,000 to $49,999 | 0 | 0.0% |
| $50,000 to $74,999 | 14 | 4.0% |
| $75,000 to $99,999 | 0 | 0.0% |
| $100,000 to $149,999 | 15 | 4.2% |
| $150,000 to $199,999 | 0 | 0.0% |
| $200,000+ | 0 | 0.0% |
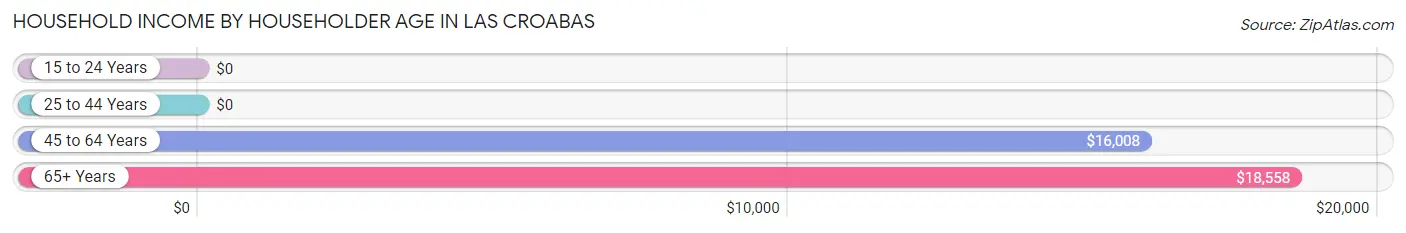
Household Income by Householder Age in Las Croabas
The median household income in Las Croabas is $16,795, with the highest median household income of $18,558 found in the 65+ years age bracket for the primary householder. A total of 107 households (30.3%) fall into this category.
| Income Bracket | # Households | Median Income |
| 15 to 24 Years | 0 (0.0%) | $0 |
| 25 to 44 Years | 40 (11.3%) | $0 |
| 45 to 64 Years | 206 (58.4%) | $16,008 |
| 65+ Years | 107 (30.3%) | $18,558 |
| Total | 353 (100.0%) | $16,795 |
Poverty in Las Croabas
Income Below Poverty by Sex and Age in Las Croabas
With 56.8% poverty level for males and 36.8% for females among the residents of Las Croabas, under 5 year old males and 45 to 54 year old females are the most vulnerable to poverty, with 34 males (100.0%) and 63 females (80.8%) in their respective age groups living below the poverty level.
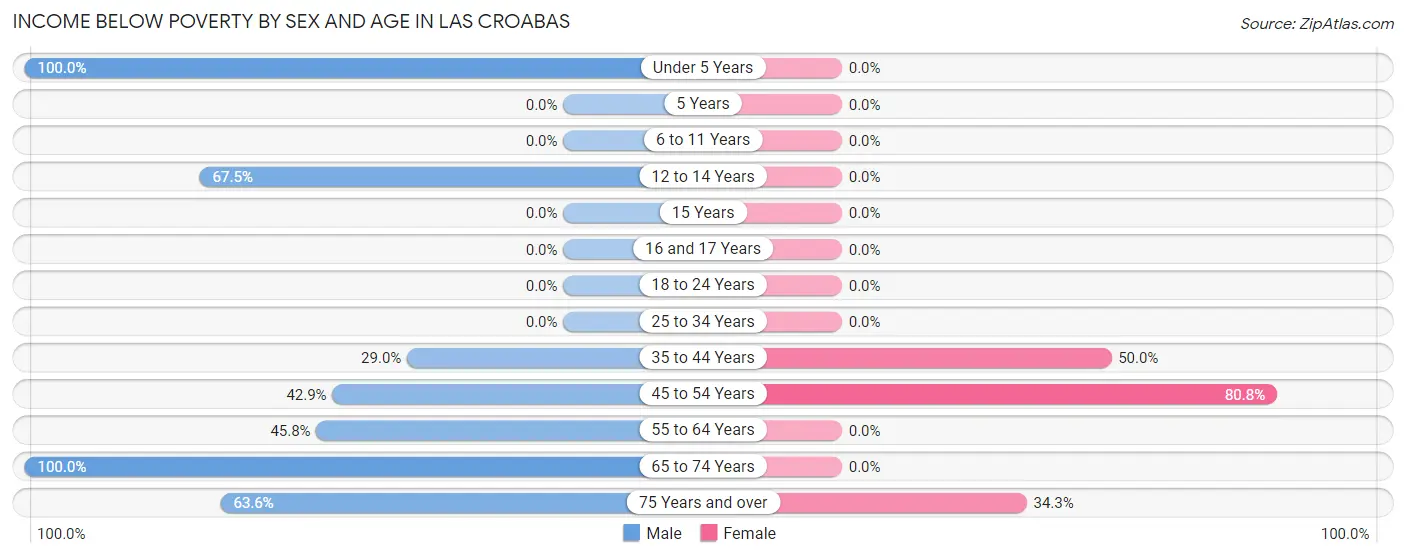
| Age Bracket | Male | Female |
| Under 5 Years | 34 (100.0%) | 0 (0.0%) |
| 5 Years | 0 (0.0%) | 0 (0.0%) |
| 6 to 11 Years | 0 (0.0%) | 0 (0.0%) |
| 12 to 14 Years | 54 (67.5%) | 0 (0.0%) |
| 15 Years | 0 (0.0%) | 0 (0.0%) |
| 16 and 17 Years | 0 (0.0%) | 0 (0.0%) |
| 18 to 24 Years | 0 (0.0%) | 0 (0.0%) |
| 25 to 34 Years | 0 (0.0%) | 0 (0.0%) |
| 35 to 44 Years | 20 (29.0%) | 20 (50.0%) |
| 45 to 54 Years | 24 (42.9%) | 63 (80.8%) |
| 55 to 64 Years | 33 (45.8%) | 0 (0.0%) |
| 65 to 74 Years | 20 (100.0%) | 0 (0.0%) |
| 75 Years and over | 28 (63.6%) | 24 (34.3%) |
| Total | 213 (56.8%) | 107 (36.8%) |
Income Above Poverty by Sex and Age in Las Croabas
According to the poverty statistics in Las Croabas, males aged 35 to 44 years and females aged 55 to 64 years are the age groups that are most secure financially, with 71.0% of males and 100.0% of females in these age groups living above the poverty line.
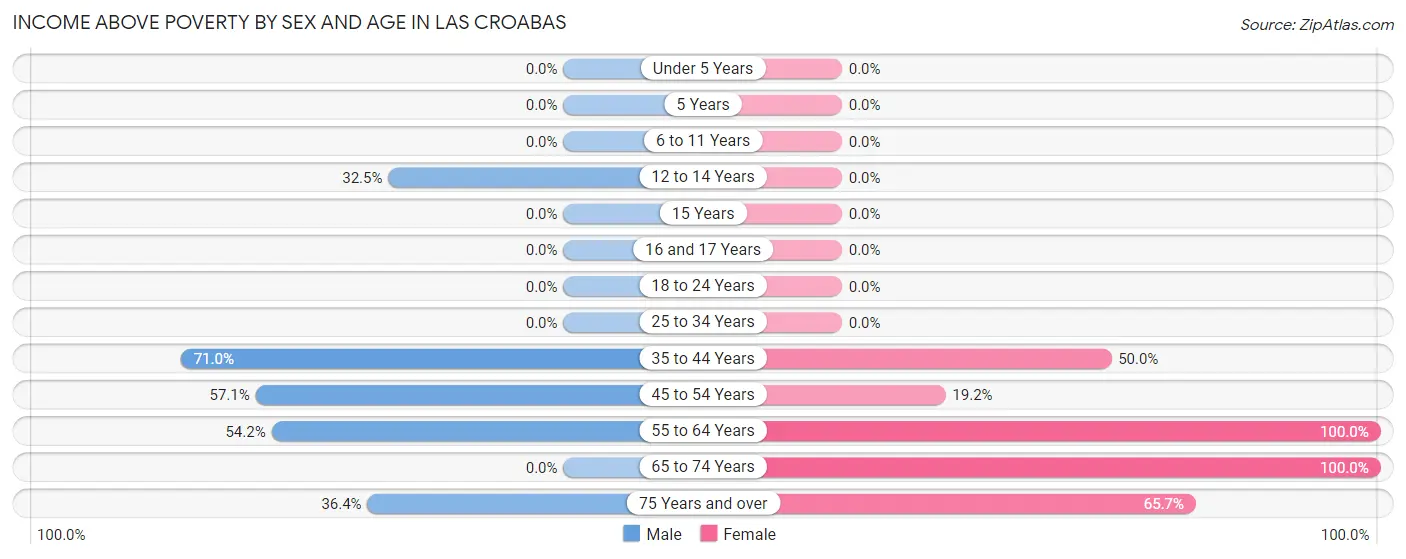
| Age Bracket | Male | Female |
| Under 5 Years | 0 (0.0%) | 0 (0.0%) |
| 5 Years | 0 (0.0%) | 0 (0.0%) |
| 6 to 11 Years | 0 (0.0%) | 0 (0.0%) |
| 12 to 14 Years | 26 (32.5%) | 0 (0.0%) |
| 15 Years | 0 (0.0%) | 0 (0.0%) |
| 16 and 17 Years | 0 (0.0%) | 0 (0.0%) |
| 18 to 24 Years | 0 (0.0%) | 0 (0.0%) |
| 25 to 34 Years | 0 (0.0%) | 0 (0.0%) |
| 35 to 44 Years | 49 (71.0%) | 20 (50.0%) |
| 45 to 54 Years | 32 (57.1%) | 15 (19.2%) |
| 55 to 64 Years | 39 (54.2%) | 90 (100.0%) |
| 65 to 74 Years | 0 (0.0%) | 13 (100.0%) |
| 75 Years and over | 16 (36.4%) | 46 (65.7%) |
| Total | 162 (43.2%) | 184 (63.2%) |
Income Below Poverty Among Married-Couple Families in Las Croabas
The poverty statistics for married-couple families in Las Croabas show that 68.6% or 72 of the total 105 families live below the poverty line. Families with no children have the highest poverty rate of 84.7%, comprising of 72 families. On the other hand, families with 1 or 2 children have the lowest poverty rate of 0.0%, which includes 0 families.
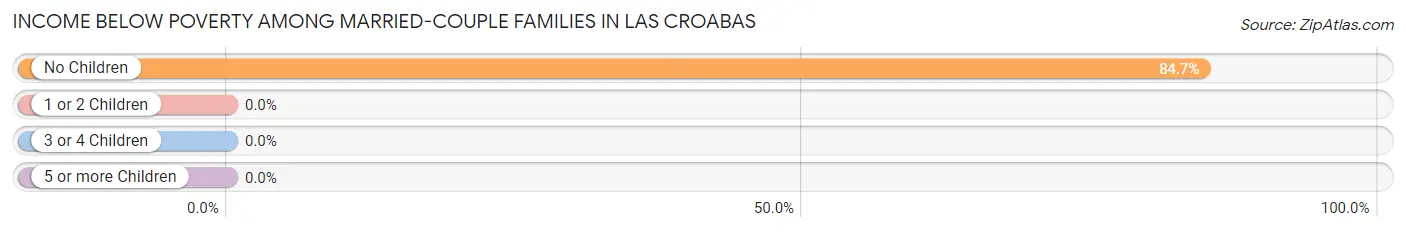
| Children | Above Poverty | Below Poverty |
| No Children | 13 (15.3%) | 72 (84.7%) |
| 1 or 2 Children | 20 (100.0%) | 0 (0.0%) |
| 3 or 4 Children | 0 (0.0%) | 0 (0.0%) |
| 5 or more Children | 0 (0.0%) | 0 (0.0%) |
| Total | 33 (31.4%) | 72 (68.6%) |
Income Below Poverty Among Single-Parent Households in Las Croabas
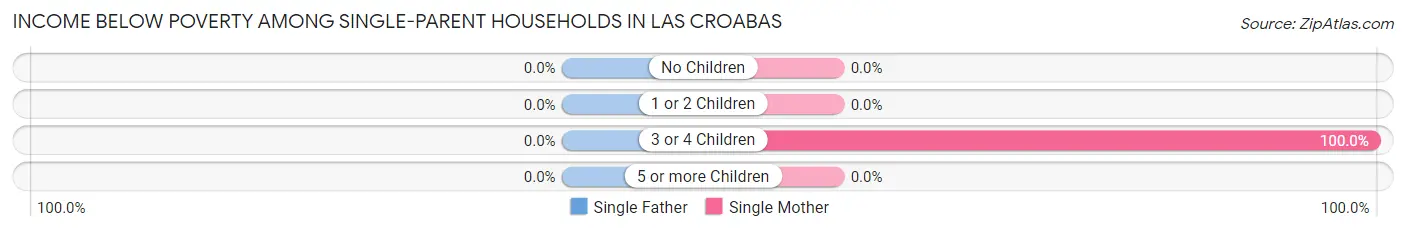
| Children | Single Father | Single Mother |
| No Children | 0 (0.0%) | 0 (0.0%) |
| 1 or 2 Children | 0 (0.0%) | 0 (0.0%) |
| 3 or 4 Children | 0 (0.0%) | 20 (100.0%) |
| 5 or more Children | 0 (0.0%) | 0 (0.0%) |
| Total | 0 (0.0%) | 20 (37.7%) |
Income Below Poverty Among Married-Couple vs Single-Parent Households in Las Croabas
The poverty data for Las Croabas shows that 72 of the married-couple family households (68.6%) and 20 of the single-parent households (37.7%) are living below the poverty level. Within the married-couple family households, those with no children have the highest poverty rate, with 72 households (84.7%) falling below the poverty line. Among the single-parent households, those with 3 or 4 children have the highest poverty rate, with 20 household (100.0%) living below poverty.
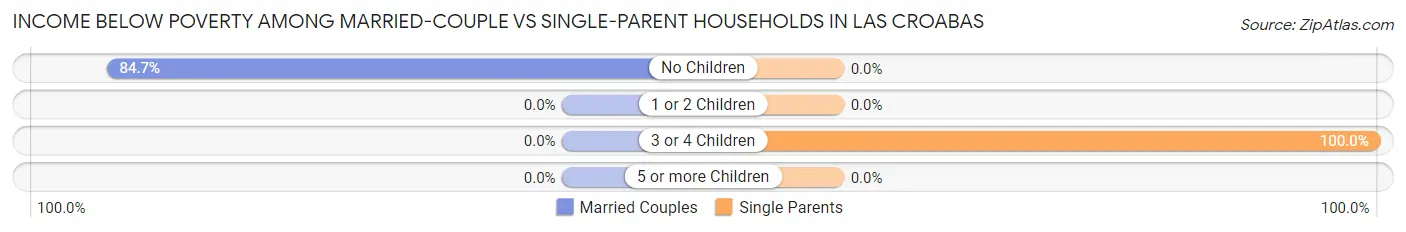
| Children | Married-Couple Families | Single-Parent Households |
| No Children | 72 (84.7%) | 0 (0.0%) |
| 1 or 2 Children | 0 (0.0%) | 0 (0.0%) |
| 3 or 4 Children | 0 (0.0%) | 20 (100.0%) |
| 5 or more Children | 0 (0.0%) | 0 (0.0%) |
| Total | 72 (68.6%) | 20 (37.7%) |
Race in Las Croabas
The most populous races in Las Croabas are Hispanic or Latino (666 | 100.0%), White / Caucasian (331 | 49.7%), and Two or more Races (154 | 23.1%).
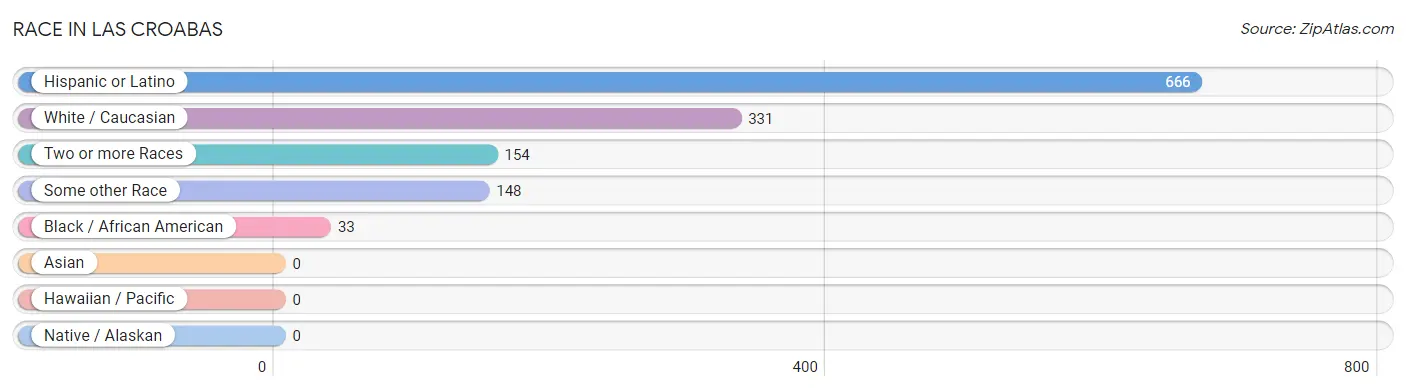
| Race | # Population | % Population |
| Asian | 0 | 0.0% |
| Black / African American | 33 | 5.0% |
| Hawaiian / Pacific | 0 | 0.0% |
| Hispanic or Latino | 666 | 100.0% |
| Native / Alaskan | 0 | 0.0% |
| White / Caucasian | 331 | 49.7% |
| Two or more Races | 154 | 23.1% |
| Some other Race | 148 | 22.2% |
| Total | 666 | 100.0% |
Ancestry in Las Croabas
The most populous ancestries reported in Las Croabas are , and Puerto Rican (666 | 100.0%), together accounting for 100.0% of all Las Croabas residents.

| Ancestry | # Population | % Population |
| Puerto Rican | 666 | 100.0% | View All 1 Rows |
Immigrants in Las Croabas

| Immigration Origin | # Population | % Population | View All 0 Rows |
Sex and Age in Las Croabas
Sex and Age in Las Croabas
The most populous age groups in Las Croabas are 10 to 14 Years (80 | 21.3%) for men and 55 to 59 Years (63 | 21.6%) for women.
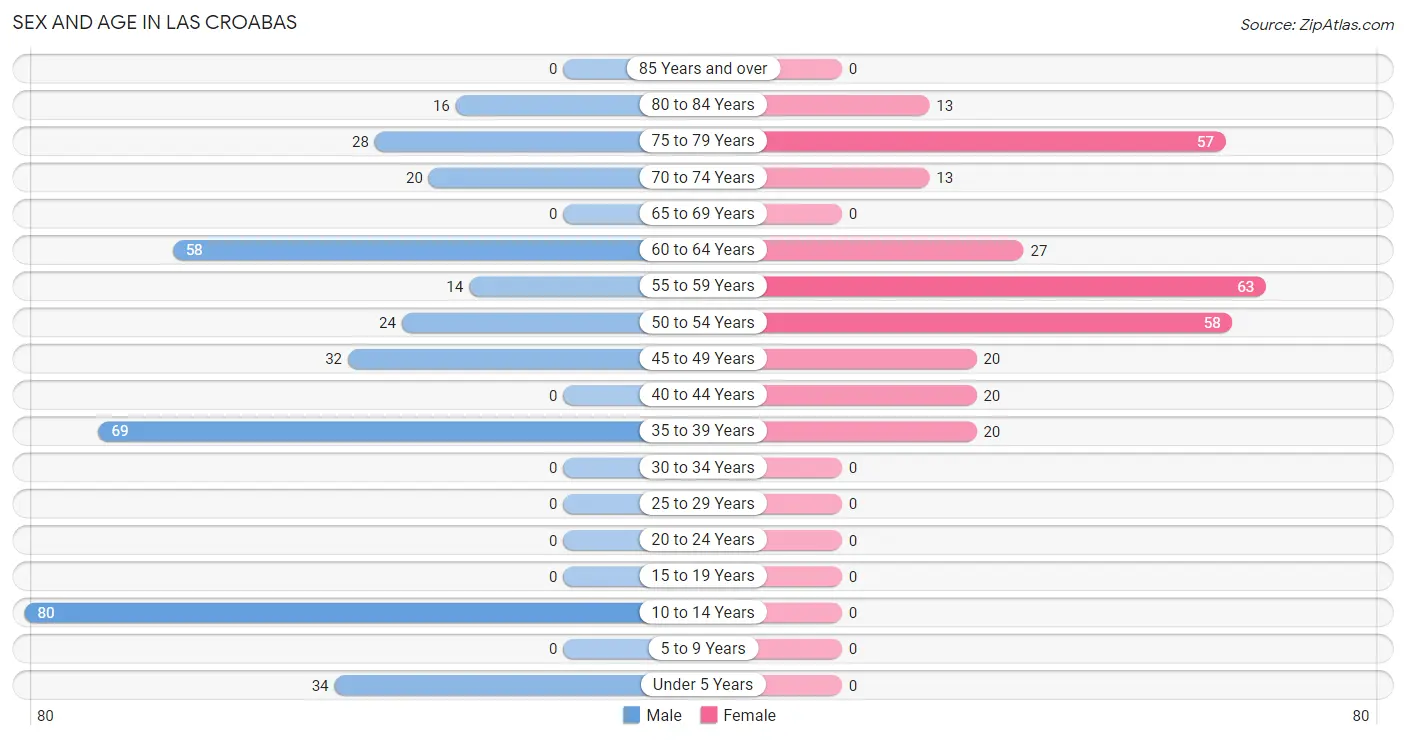
| Age Bracket | Male | Female |
| Under 5 Years | 34 (9.1%) | 0 (0.0%) |
| 5 to 9 Years | 0 (0.0%) | 0 (0.0%) |
| 10 to 14 Years | 80 (21.3%) | 0 (0.0%) |
| 15 to 19 Years | 0 (0.0%) | 0 (0.0%) |
| 20 to 24 Years | 0 (0.0%) | 0 (0.0%) |
| 25 to 29 Years | 0 (0.0%) | 0 (0.0%) |
| 30 to 34 Years | 0 (0.0%) | 0 (0.0%) |
| 35 to 39 Years | 69 (18.4%) | 20 (6.9%) |
| 40 to 44 Years | 0 (0.0%) | 20 (6.9%) |
| 45 to 49 Years | 32 (8.5%) | 20 (6.9%) |
| 50 to 54 Years | 24 (6.4%) | 58 (19.9%) |
| 55 to 59 Years | 14 (3.7%) | 63 (21.6%) |
| 60 to 64 Years | 58 (15.5%) | 27 (9.3%) |
| 65 to 69 Years | 0 (0.0%) | 0 (0.0%) |
| 70 to 74 Years | 20 (5.3%) | 13 (4.5%) |
| 75 to 79 Years | 28 (7.5%) | 57 (19.6%) |
| 80 to 84 Years | 16 (4.3%) | 13 (4.5%) |
| 85 Years and over | 0 (0.0%) | 0 (0.0%) |
| Total | 375 (100.0%) | 291 (100.0%) |
Families and Households in Las Croabas
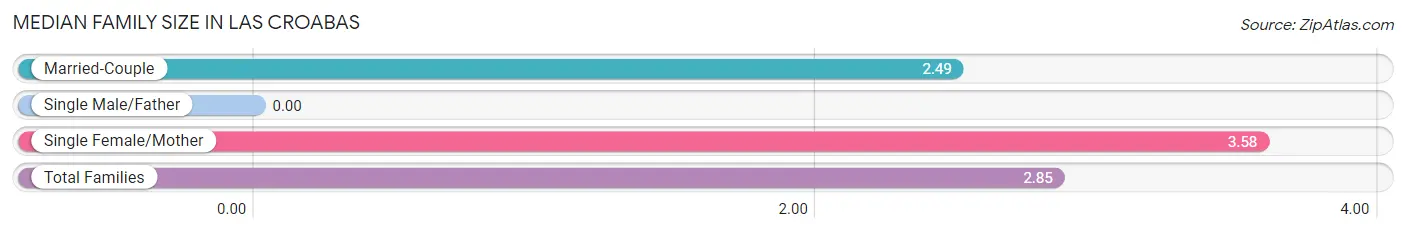
Median Family Size in Las Croabas
| Family Type | # Families | Family Size |
| Married-Couple | 105 (66.5%) | 2.49 |
| Single Male/Father | 0 (0.0%) | - |
| Single Female/Mother | 53 (33.5%) | 3.58 |
| Total Families | 158 (100.0%) | 2.85 |
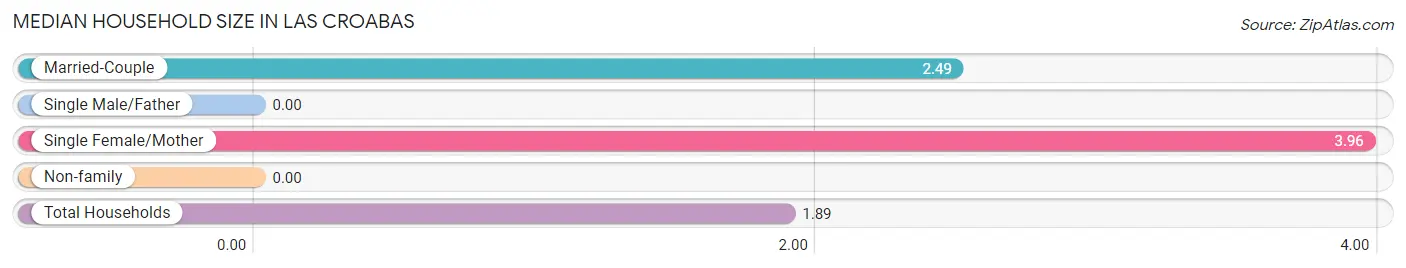
Median Household Size in Las Croabas
| Household Type | # Households | Household Size |
| Married-Couple | 105 (29.7%) | 2.49 |
| Single Male/Father | 0 (0.0%) | - |
| Single Female/Mother | 53 (15.0%) | 3.96 |
| Non-family | 195 (55.2%) | - |
| Total Households | 353 (100.0%) | 1.89 |
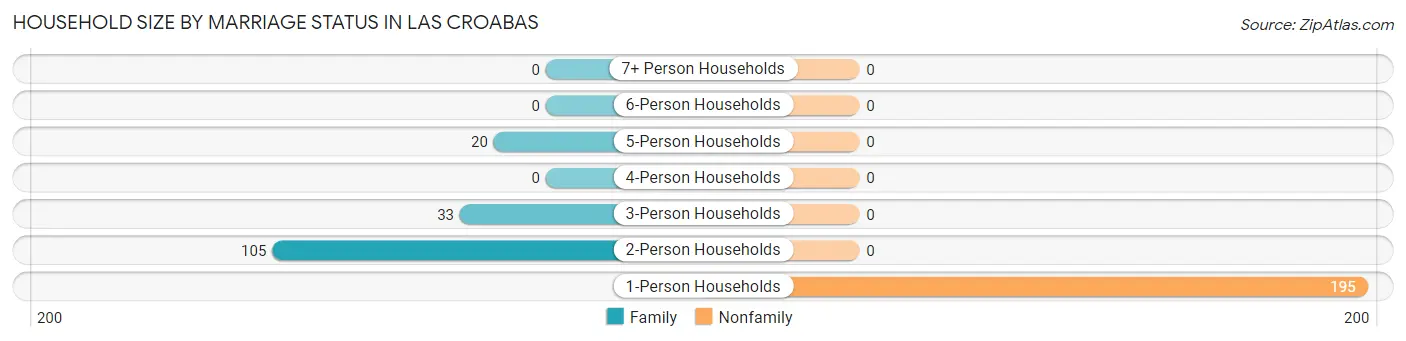
Household Size by Marriage Status in Las Croabas
Out of a total of 353 households in Las Croabas, 158 (44.8%) are family households, while 195 (55.2%) are nonfamily households. The most numerous type of family households are 2-person households, comprising 105, and the most common type of nonfamily households are 1-person households, comprising 195.
| Household Size | Family Households | Nonfamily Households |
| 1-Person Households | - | 195 (55.2%) |
| 2-Person Households | 105 (29.7%) | 0 (0.0%) |
| 3-Person Households | 33 (9.3%) | 0 (0.0%) |
| 4-Person Households | 0 (0.0%) | 0 (0.0%) |
| 5-Person Households | 20 (5.7%) | 0 (0.0%) |
| 6-Person Households | 0 (0.0%) | 0 (0.0%) |
| 7+ Person Households | 0 (0.0%) | 0 (0.0%) |
| Total | 158 (44.8%) | 195 (55.2%) |
Female Fertility in Las Croabas
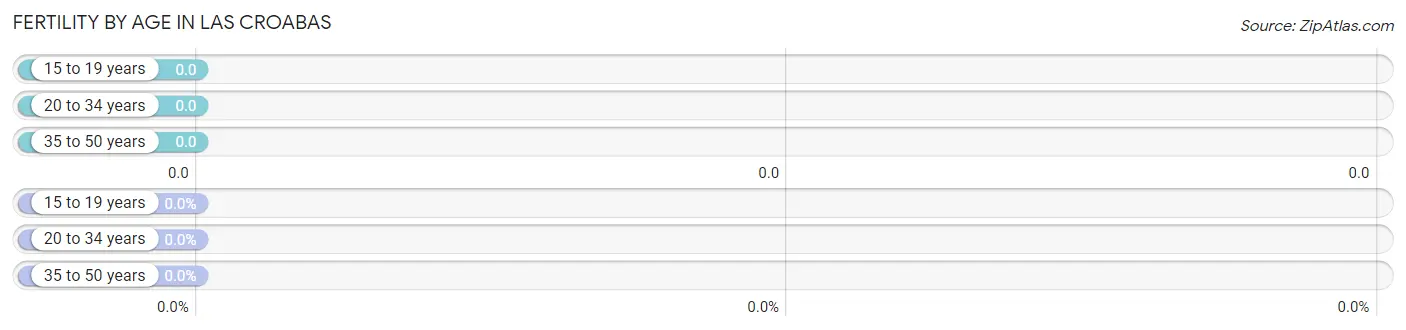
Fertility by Age in Las Croabas
| Age Bracket | Women with Births | Births / 1,000 Women |
| 15 to 19 years | 0 (0.0%) | 0.0 |
| 20 to 34 years | 0 (0.0%) | 0.0 |
| 35 to 50 years | 0 (0.0%) | 0.0 |
| Total | 0 (0.0%) | 0.0 |
Fertility by Age by Marriage Status in Las Croabas
| Age Bracket | Married | Unmarried |
| 15 to 19 years | 0 (0.0%) | 0 (0.0%) |
| 20 to 34 years | 0 (0.0%) | 0 (0.0%) |
| 35 to 50 years | 0 (0.0%) | 0 (0.0%) |
| Total | 0 (0.0%) | 0 (0.0%) |
Fertility by Education in Las Croabas
| Educational Attainment | Women with Births | Births / 1,000 Women |
| Less than High School | 0 (0.0%) | 0.0 |
| High School Diploma | 0 (0.0%) | 0.0 |
| College or Associate's Degree | 0 (0.0%) | 0.0 |
| Bachelor's Degree | 0 (0.0%) | 0.0 |
| Graduate Degree | 0 (0.0%) | 0.0 |
| Total | 0 (0.0%) | 0.0 |
Fertility by Education by Marriage Status in Las Croabas
| Educational Attainment | Married | Unmarried |
| Less than High School | 0 (0.0%) | 0 (0.0%) |
| High School Diploma | 0 (0.0%) | 0 (0.0%) |
| College or Associate's Degree | 0 (0.0%) | 0 (0.0%) |
| Bachelor's Degree | 0 (0.0%) | 0 (0.0%) |
| Graduate Degree | 0 (0.0%) | 0 (0.0%) |
| Total | 0 (0.0%) | 0 (0.0%) |
Employment Characteristics in Las Croabas
Employment by Class of Employer in Las Croabas
Among the 183 employed individuals in Las Croabas, self-employed (not incorporated) (107 | 58.5%), private company employees (62 | 33.9%), and federal government employees (14 | 7.6%) make up the most common classes of employment.
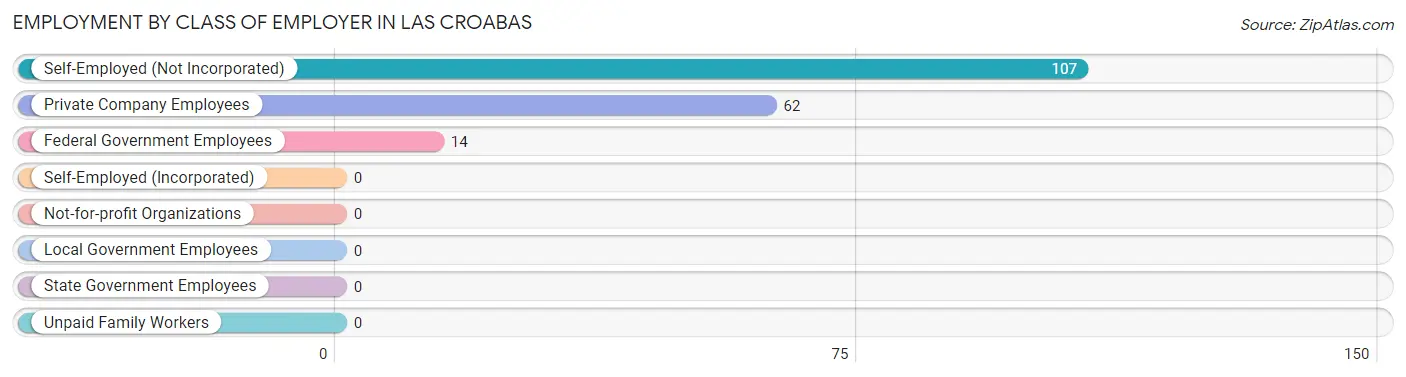
| Employer Class | # Employees | % Employees |
| Private Company Employees | 62 | 33.9% |
| Self-Employed (Incorporated) | 0 | 0.0% |
| Self-Employed (Not Incorporated) | 107 | 58.5% |
| Not-for-profit Organizations | 0 | 0.0% |
| Local Government Employees | 0 | 0.0% |
| State Government Employees | 0 | 0.0% |
| Federal Government Employees | 14 | 7.6% |
| Unpaid Family Workers | 0 | 0.0% |
| Total | 183 | 100.0% |
Employment Status by Age in Las Croabas
According to the labor force statistics for Las Croabas, out of the total population over 16 years of age (552), 44.6% or 246 individuals are in the labor force, with 15.4% or 38 of them unemployed. The age group with the highest labor force participation rate is 55 to 59 years, with 100.0% or 77 individuals in the labor force. Within the labor force, the 45 to 54 years age range has the highest percentage of unemployed individuals, with 34.9% or 38 of them being unemployed.
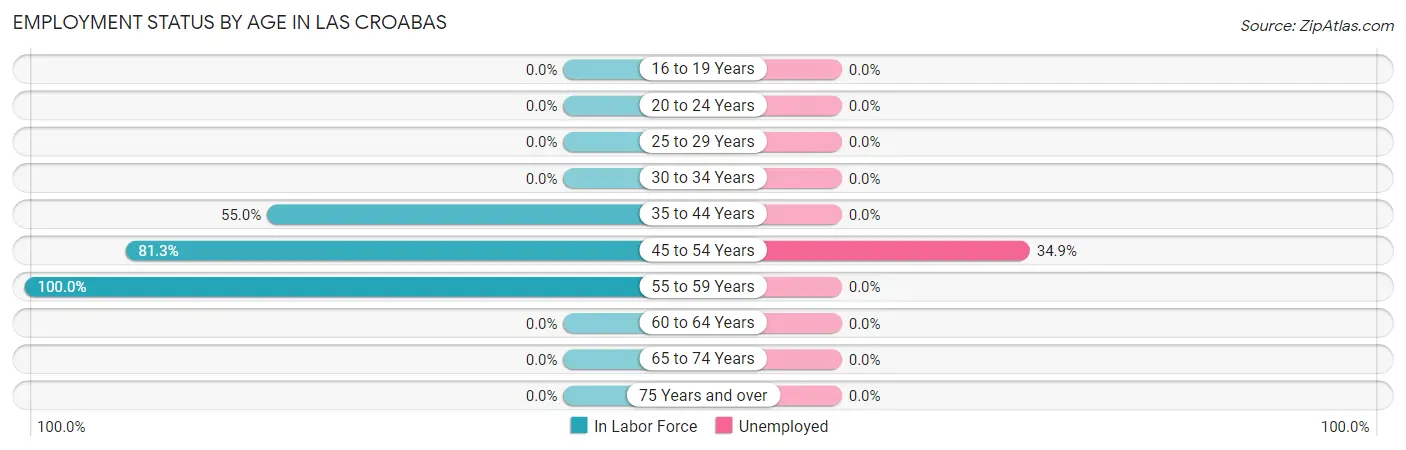
| Age Bracket | In Labor Force | Unemployed |
| 16 to 19 Years | 0 (0.0%) | 0 (0.0%) |
| 20 to 24 Years | 0 (0.0%) | 0 (0.0%) |
| 25 to 29 Years | 0 (0.0%) | 0 (0.0%) |
| 30 to 34 Years | 0 (0.0%) | 0 (0.0%) |
| 35 to 44 Years | 60 (55.0%) | 0 (0.0%) |
| 45 to 54 Years | 109 (81.3%) | 38 (34.9%) |
| 55 to 59 Years | 77 (100.0%) | 0 (0.0%) |
| 60 to 64 Years | 0 (0.0%) | 0 (0.0%) |
| 65 to 74 Years | 0 (0.0%) | 0 (0.0%) |
| 75 Years and over | 0 (0.0%) | 0 (0.0%) |
| Total | 246 (44.6%) | 38 (15.4%) |
Employment Status by Educational Attainment in Las Croabas
According to labor force statistics for Las Croabas, 60.7% of individuals (246) out of the total population between 25 and 64 years of age (405) are in the labor force, with 15.4% or 38 of them being unemployed. The group with the highest labor force participation rate are those with the educational attainment of college / associate degree, with 100.0% or 10 individuals in the labor force. Within the labor force, individuals with high school diploma education have the highest percentage of unemployment, with 23.0% or 38 of them being unemployed.
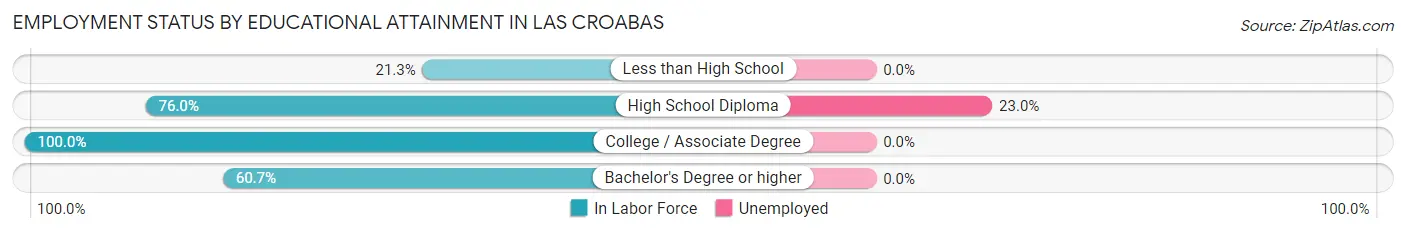
| Educational Attainment | In Labor Force | Unemployed |
| Less than High School | 20 (21.3%) | 0 (0.0%) |
| High School Diploma | 165 (76.0%) | 50 (23.0%) |
| College / Associate Degree | 10 (100.0%) | 0 (0.0%) |
| Bachelor's Degree or higher | 51 (60.7%) | 0 (0.0%) |
| Total | 246 (60.7%) | 62 (15.4%) |
Employment Occupations by Sex in Las Croabas
Management, Business, Science and Arts Occupations
The most common Management, Business, Science and Arts occupations in Las Croabas are Community & Social Service (15 | 7.2%), and Legal Services & Support (15 | 7.2%).
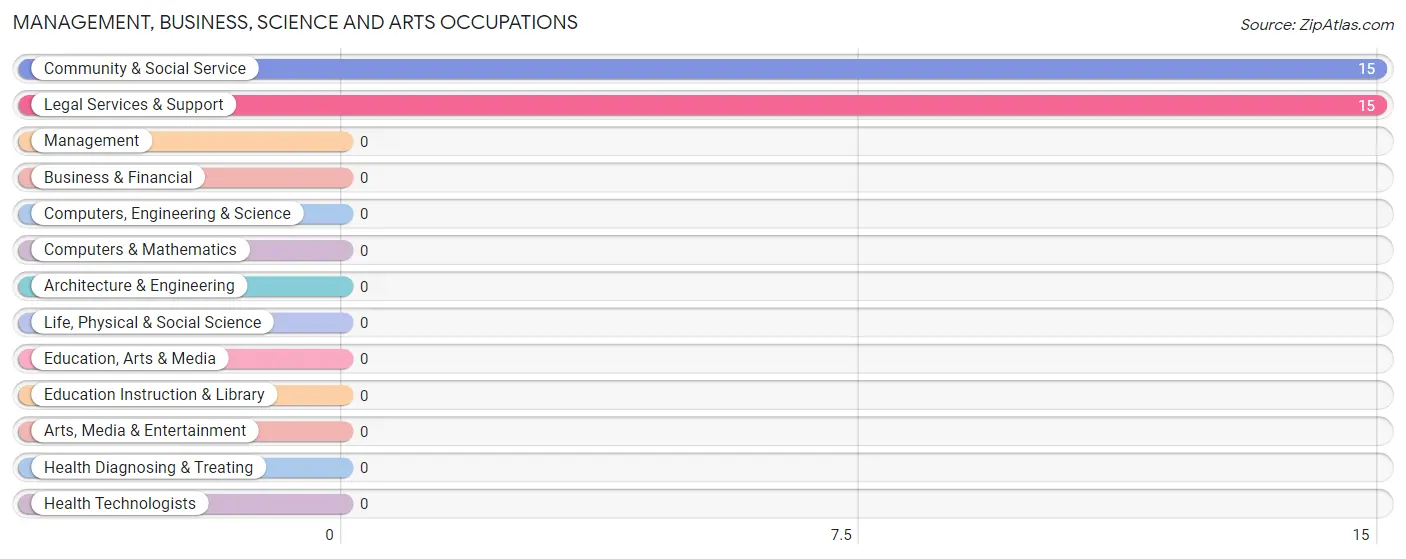
Management, Business, Science and Arts Occupations by Sex
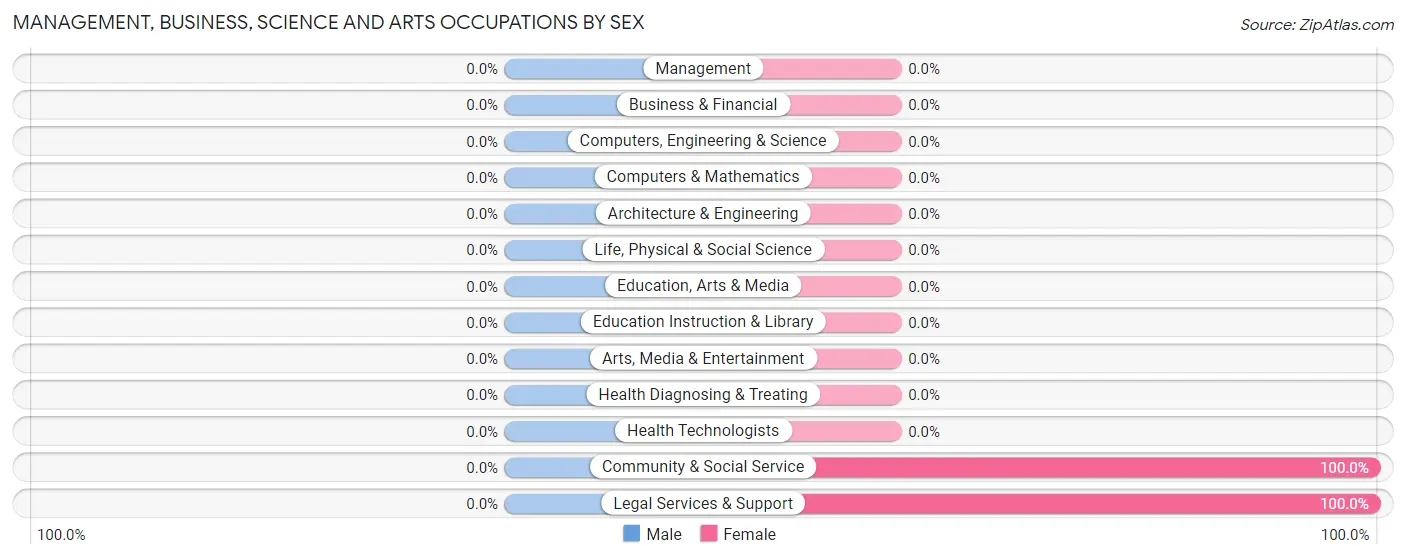
| Occupation | Male | Female |
| Management | 0 (0.0%) | 0 (0.0%) |
| Business & Financial | 0 (0.0%) | 0 (0.0%) |
| Computers, Engineering & Science | 0 (0.0%) | 0 (0.0%) |
| Computers & Mathematics | 0 (0.0%) | 0 (0.0%) |
| Architecture & Engineering | 0 (0.0%) | 0 (0.0%) |
| Life, Physical & Social Science | 0 (0.0%) | 0 (0.0%) |
| Community & Social Service | 0 (0.0%) | 15 (100.0%) |
| Education, Arts & Media | 0 (0.0%) | 0 (0.0%) |
| Legal Services & Support | 0 (0.0%) | 15 (100.0%) |
| Education Instruction & Library | 0 (0.0%) | 0 (0.0%) |
| Arts, Media & Entertainment | 0 (0.0%) | 0 (0.0%) |
| Health Diagnosing & Treating | 0 (0.0%) | 0 (0.0%) |
| Health Technologists | 0 (0.0%) | 0 (0.0%) |
| Total (Category) | 0 (0.0%) | 15 (100.0%) |
| Total (Overall) | 90 (43.3%) | 118 (56.7%) |
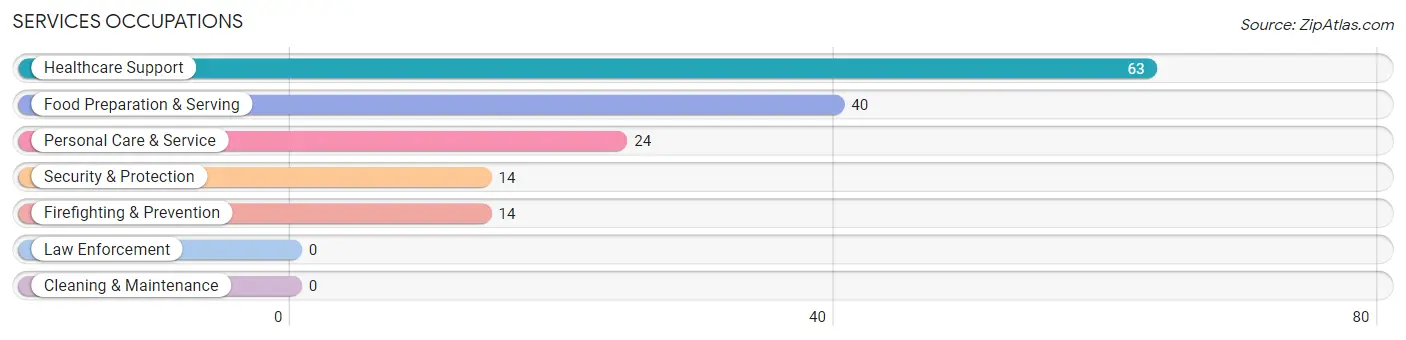
Services Occupations
The most common Services occupations in Las Croabas are Healthcare Support (63 | 30.3%), Food Preparation & Serving (40 | 19.2%), Personal Care & Service (24 | 11.5%), Security & Protection (14 | 6.7%), and Firefighting & Prevention (14 | 6.7%).
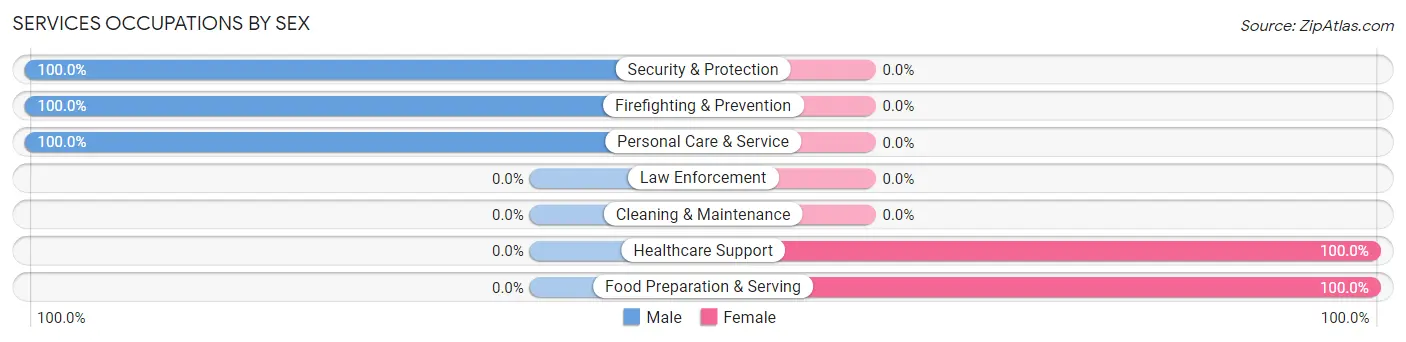
Services Occupations by Sex
Within the Services occupations in Las Croabas, the most male-oriented occupations are Security & Protection (100.0%), Firefighting & Prevention (100.0%), and Personal Care & Service (100.0%), while the most female-oriented occupations are Healthcare Support (100.0%), and Food Preparation & Serving (100.0%).
| Occupation | Male | Female |
| Healthcare Support | 0 (0.0%) | 63 (100.0%) |
| Security & Protection | 14 (100.0%) | 0 (0.0%) |
| Firefighting & Prevention | 14 (100.0%) | 0 (0.0%) |
| Law Enforcement | 0 (0.0%) | 0 (0.0%) |
| Food Preparation & Serving | 0 (0.0%) | 40 (100.0%) |
| Cleaning & Maintenance | 0 (0.0%) | 0 (0.0%) |
| Personal Care & Service | 24 (100.0%) | 0 (0.0%) |
| Total (Category) | 38 (27.0%) | 103 (73.1%) |
| Total (Overall) | 90 (43.3%) | 118 (56.7%) |
Sales and Office Occupations
Sales and Office Occupations by Sex
| Occupation | Male | Female |
| Sales & Related | 0 (0.0%) | 0 (0.0%) |
| Office & Administration | 0 (0.0%) | 0 (0.0%) |
| Total (Category) | 0 (0.0%) | 0 (0.0%) |
| Total (Overall) | 90 (43.3%) | 118 (56.7%) |
Natural Resources, Construction and Maintenance Occupations
The most common Natural Resources, Construction and Maintenance occupations in Las Croabas are , and Farming, Fishing & Forestry (10 | 4.8%).
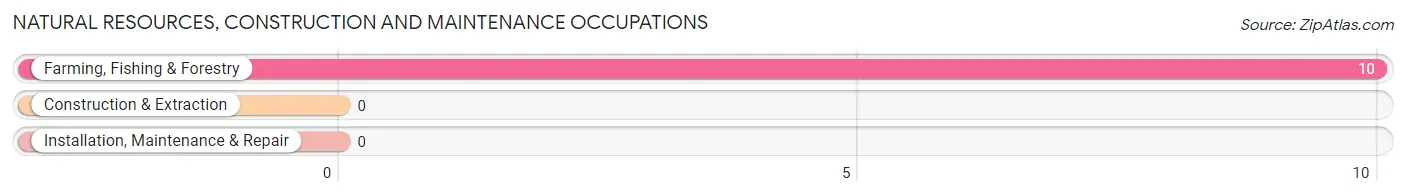
Natural Resources, Construction and Maintenance Occupations by Sex
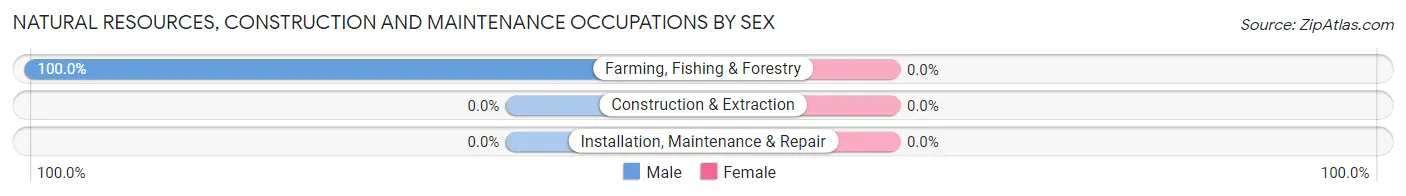
| Occupation | Male | Female |
| Farming, Fishing & Forestry | 10 (100.0%) | 0 (0.0%) |
| Construction & Extraction | 0 (0.0%) | 0 (0.0%) |
| Installation, Maintenance & Repair | 0 (0.0%) | 0 (0.0%) |
| Total (Category) | 10 (100.0%) | 0 (0.0%) |
| Total (Overall) | 90 (43.3%) | 118 (56.7%) |
Production, Transportation and Moving Occupations
The most common Production, Transportation and Moving occupations in Las Croabas are Production (22 | 10.6%), and Material Moving (20 | 9.6%).
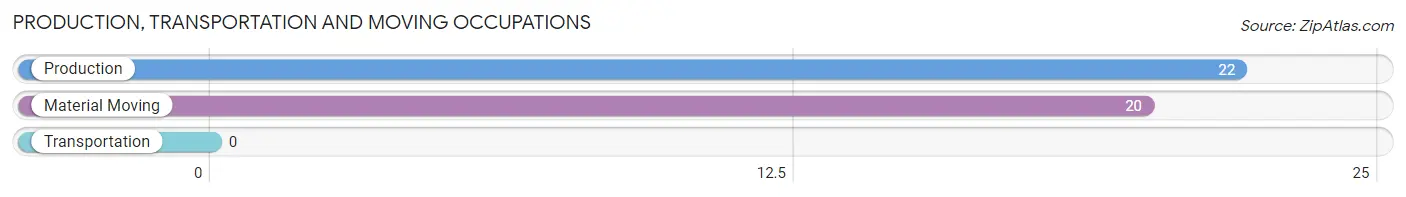
Production, Transportation and Moving Occupations by Sex
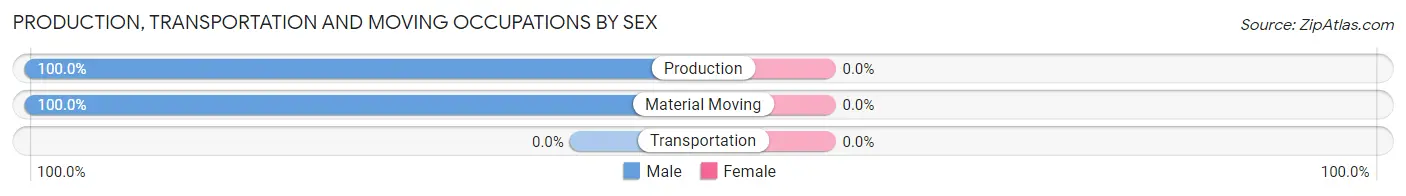
| Occupation | Male | Female |
| Production | 22 (100.0%) | 0 (0.0%) |
| Transportation | 0 (0.0%) | 0 (0.0%) |
| Material Moving | 20 (100.0%) | 0 (0.0%) |
| Total (Category) | 42 (100.0%) | 0 (0.0%) |
| Total (Overall) | 90 (43.3%) | 118 (56.7%) |
Employment Industries by Sex in Las Croabas
Employment Industries in Las Croabas
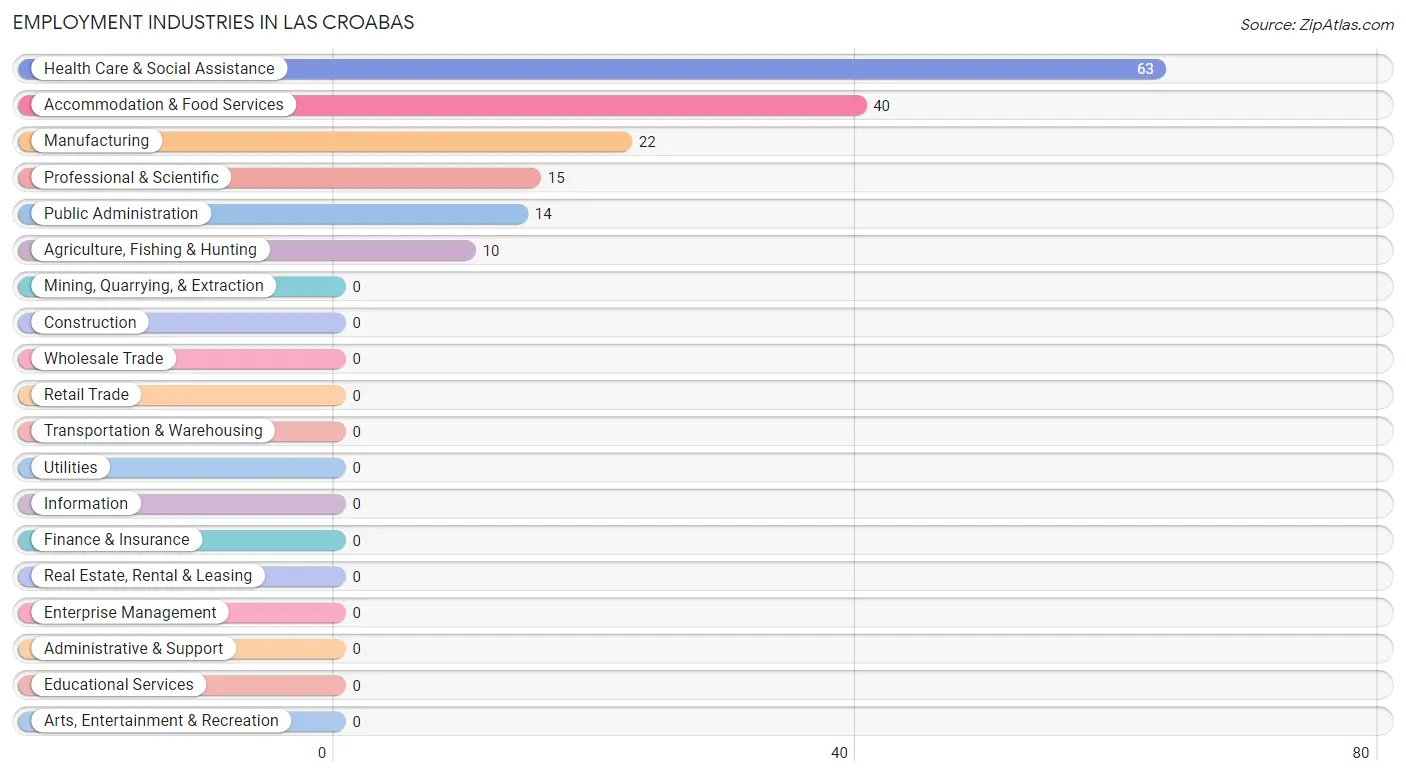
The major employment industries in Las Croabas include Health Care & Social Assistance (63 | 30.3%), Accommodation & Food Services (40 | 19.2%), Manufacturing (22 | 10.6%), Professional & Scientific (15 | 7.2%), and Public Administration (14 | 6.7%).
Employment Industries by Sex in Las Croabas
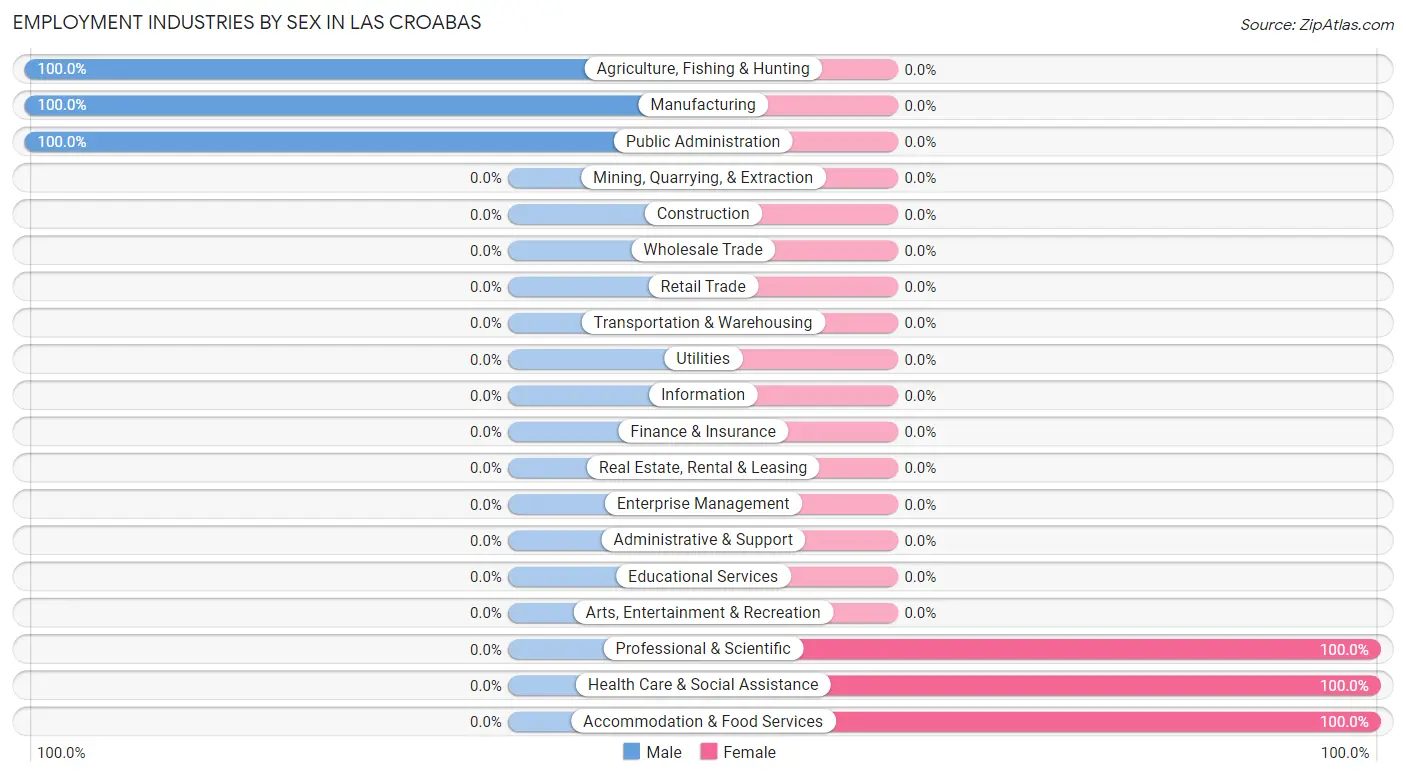
The Las Croabas industries that see more men than women are Agriculture, Fishing & Hunting (100.0%), Manufacturing (100.0%), and Public Administration (100.0%), whereas the industries that tend to have a higher number of women are Professional & Scientific (100.0%), Health Care & Social Assistance (100.0%), and Accommodation & Food Services (100.0%).
| Industry | Male | Female |
| Agriculture, Fishing & Hunting | 10 (100.0%) | 0 (0.0%) |
| Mining, Quarrying, & Extraction | 0 (0.0%) | 0 (0.0%) |
| Construction | 0 (0.0%) | 0 (0.0%) |
| Manufacturing | 22 (100.0%) | 0 (0.0%) |
| Wholesale Trade | 0 (0.0%) | 0 (0.0%) |
| Retail Trade | 0 (0.0%) | 0 (0.0%) |
| Transportation & Warehousing | 0 (0.0%) | 0 (0.0%) |
| Utilities | 0 (0.0%) | 0 (0.0%) |
| Information | 0 (0.0%) | 0 (0.0%) |
| Finance & Insurance | 0 (0.0%) | 0 (0.0%) |
| Real Estate, Rental & Leasing | 0 (0.0%) | 0 (0.0%) |
| Professional & Scientific | 0 (0.0%) | 15 (100.0%) |
| Enterprise Management | 0 (0.0%) | 0 (0.0%) |
| Administrative & Support | 0 (0.0%) | 0 (0.0%) |
| Educational Services | 0 (0.0%) | 0 (0.0%) |
| Health Care & Social Assistance | 0 (0.0%) | 63 (100.0%) |
| Arts, Entertainment & Recreation | 0 (0.0%) | 0 (0.0%) |
| Accommodation & Food Services | 0 (0.0%) | 40 (100.0%) |
| Public Administration | 14 (100.0%) | 0 (0.0%) |
| Total | 90 (43.3%) | 118 (56.7%) |
Education in Las Croabas
School Enrollment in Las Croabas
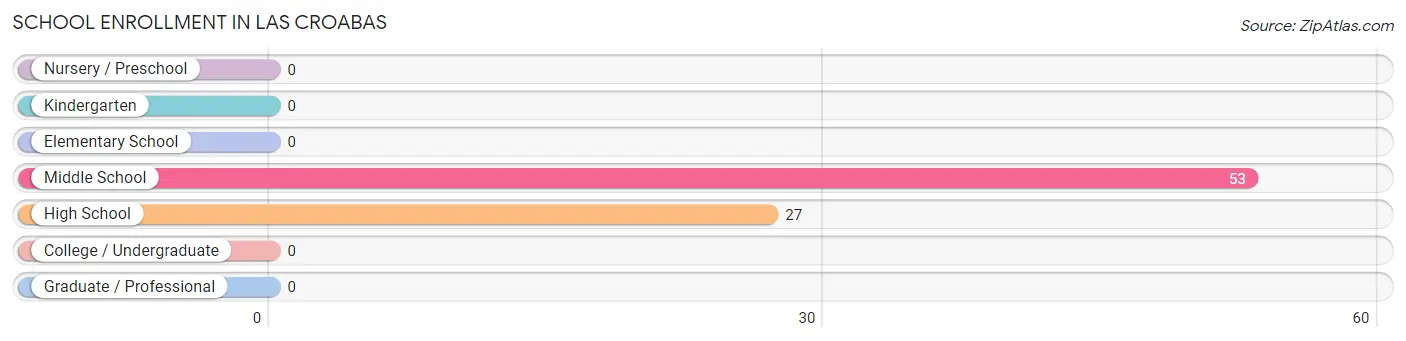
The most common levels of schooling among the 80 students in Las Croabas are middle school (53 | 66.2%), and high school (27 | 33.8%).
| School Level | # Students | % Students |
| Nursery / Preschool | 0 | 0.0% |
| Kindergarten | 0 | 0.0% |
| Elementary School | 0 | 0.0% |
| Middle School | 53 | 66.2% |
| High School | 27 | 33.8% |
| College / Undergraduate | 0 | 0.0% |
| Graduate / Professional | 0 | 0.0% |
| Total | 80 | 100.0% |
School Enrollment by Age by Funding Source in Las Croabas
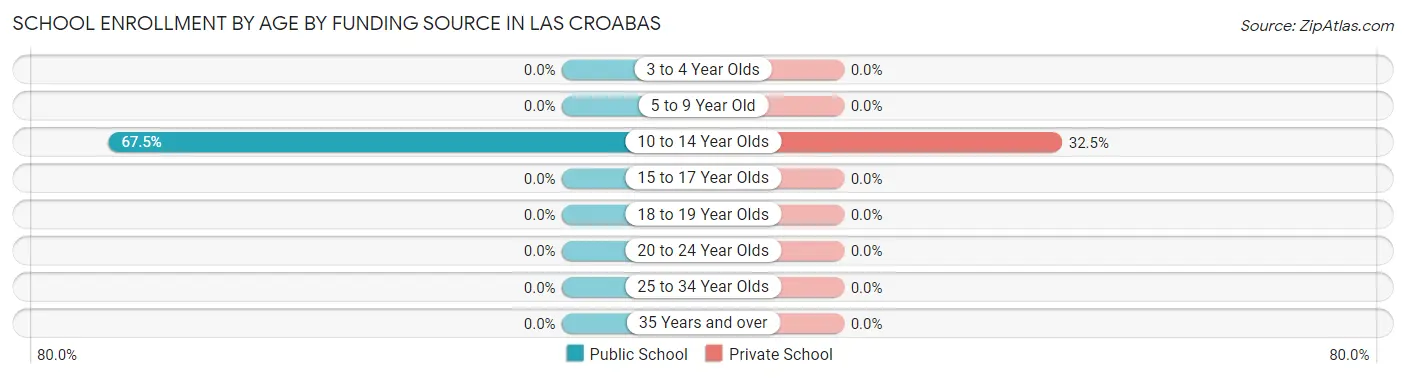
Out of a total of 80 students who are enrolled in schools in Las Croabas, 26 (32.5%) attend a private institution, while the remaining 54 (67.5%) are enrolled in public schools. The age group of 10 to 14 year olds has the highest likelihood of being enrolled in private schools, with 26 (32.5% in the age bracket) enrolled. Conversely, the age group of 10 to 14 year olds has the lowest likelihood of being enrolled in a private school, with 54 (67.5% in the age bracket) attending a public institution.
| Age Bracket | Public School | Private School |
| 3 to 4 Year Olds | 0 (0.0%) | 0 (0.0%) |
| 5 to 9 Year Old | 0 (0.0%) | 0 (0.0%) |
| 10 to 14 Year Olds | 54 (67.5%) | 26 (32.5%) |
| 15 to 17 Year Olds | 0 (0.0%) | 0 (0.0%) |
| 18 to 19 Year Olds | 0 (0.0%) | 0 (0.0%) |
| 20 to 24 Year Olds | 0 (0.0%) | 0 (0.0%) |
| 25 to 34 Year Olds | 0 (0.0%) | 0 (0.0%) |
| 35 Years and over | 0 (0.0%) | 0 (0.0%) |
| Total | 54 (67.5%) | 26 (32.5%) |
Educational Attainment by Field of Study in Las Croabas
Bio, nature & agricultural (33 | 39.3%), business (22 | 26.2%), social sciences (15 | 17.9%), and education (14 | 16.7%) are the most common fields of study among 84 individuals in Las Croabas who have obtained a bachelor's degree or higher.
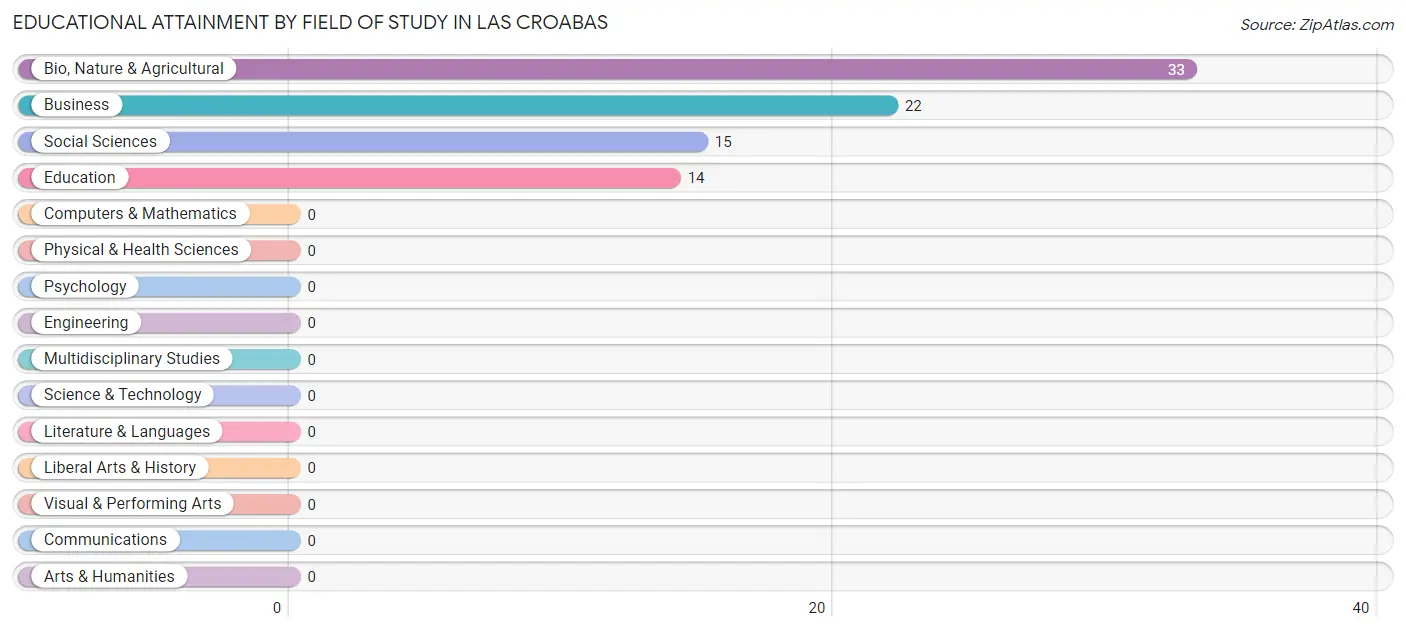
| Field of Study | # Graduates | % Graduates |
| Computers & Mathematics | 0 | 0.0% |
| Bio, Nature & Agricultural | 33 | 39.3% |
| Physical & Health Sciences | 0 | 0.0% |
| Psychology | 0 | 0.0% |
| Social Sciences | 15 | 17.9% |
| Engineering | 0 | 0.0% |
| Multidisciplinary Studies | 0 | 0.0% |
| Science & Technology | 0 | 0.0% |
| Business | 22 | 26.2% |
| Education | 14 | 16.7% |
| Literature & Languages | 0 | 0.0% |
| Liberal Arts & History | 0 | 0.0% |
| Visual & Performing Arts | 0 | 0.0% |
| Communications | 0 | 0.0% |
| Arts & Humanities | 0 | 0.0% |
| Total | 84 | 100.0% |
Transportation & Commute in Las Croabas
Vehicle Availability by Sex in Las Croabas
The most prevalent vehicle ownership categories in Las Croabas are males with 2 vehicles (60, accounting for 75.0%) and females with 2 vehicles (20, making up 58.3%).
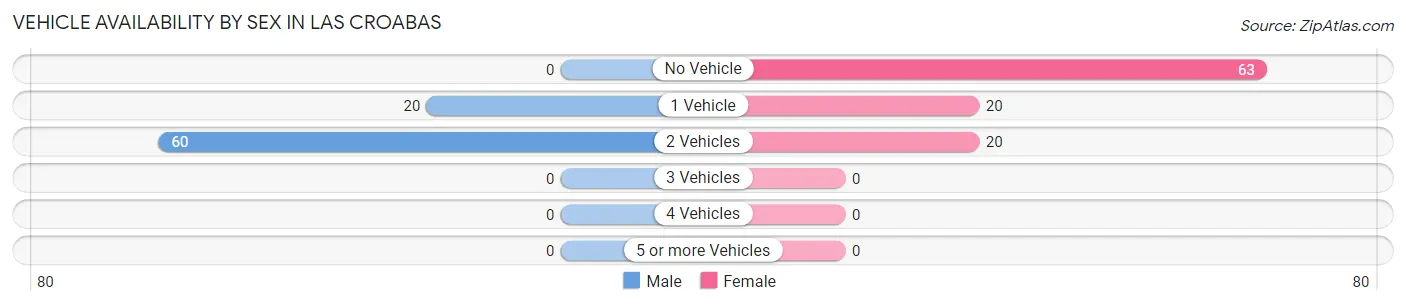
| Vehicles Available | Male | Female |
| No Vehicle | 0 (0.0%) | 63 (61.2%) |
| 1 Vehicle | 20 (25.0%) | 20 (19.4%) |
| 2 Vehicles | 60 (75.0%) | 20 (19.4%) |
| 3 Vehicles | 0 (0.0%) | 0 (0.0%) |
| 4 Vehicles | 0 (0.0%) | 0 (0.0%) |
| 5 or more Vehicles | 0 (0.0%) | 0 (0.0%) |
| Total | 80 (100.0%) | 103 (100.0%) |
Commute Time in Las Croabas
The most frequently occuring commute durations in Las Croabas are 15 to 19 minutes (66 commuters, 36.1%), less than 5 minutes (63 commuters, 34.4%), and 10 to 14 minutes (20 commuters, 10.9%).
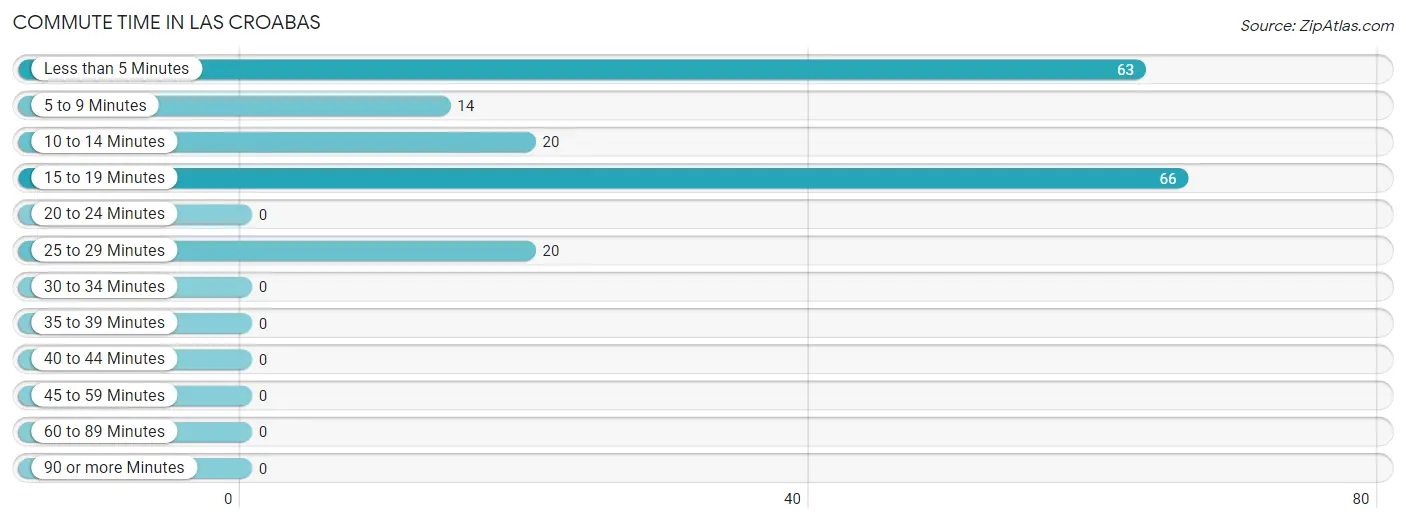
| Commute Time | # Commuters | % Commuters |
| Less than 5 Minutes | 63 | 34.4% |
| 5 to 9 Minutes | 14 | 7.6% |
| 10 to 14 Minutes | 20 | 10.9% |
| 15 to 19 Minutes | 66 | 36.1% |
| 20 to 24 Minutes | 0 | 0.0% |
| 25 to 29 Minutes | 20 | 10.9% |
| 30 to 34 Minutes | 0 | 0.0% |
| 35 to 39 Minutes | 0 | 0.0% |
| 40 to 44 Minutes | 0 | 0.0% |
| 45 to 59 Minutes | 0 | 0.0% |
| 60 to 89 Minutes | 0 | 0.0% |
| 90 or more Minutes | 0 | 0.0% |
Commute Time by Sex in Las Croabas
The most common commute times in Las Croabas are 15 to 19 minutes (66 commuters, 82.5%) for males and less than 5 minutes (63 commuters, 61.2%) for females.
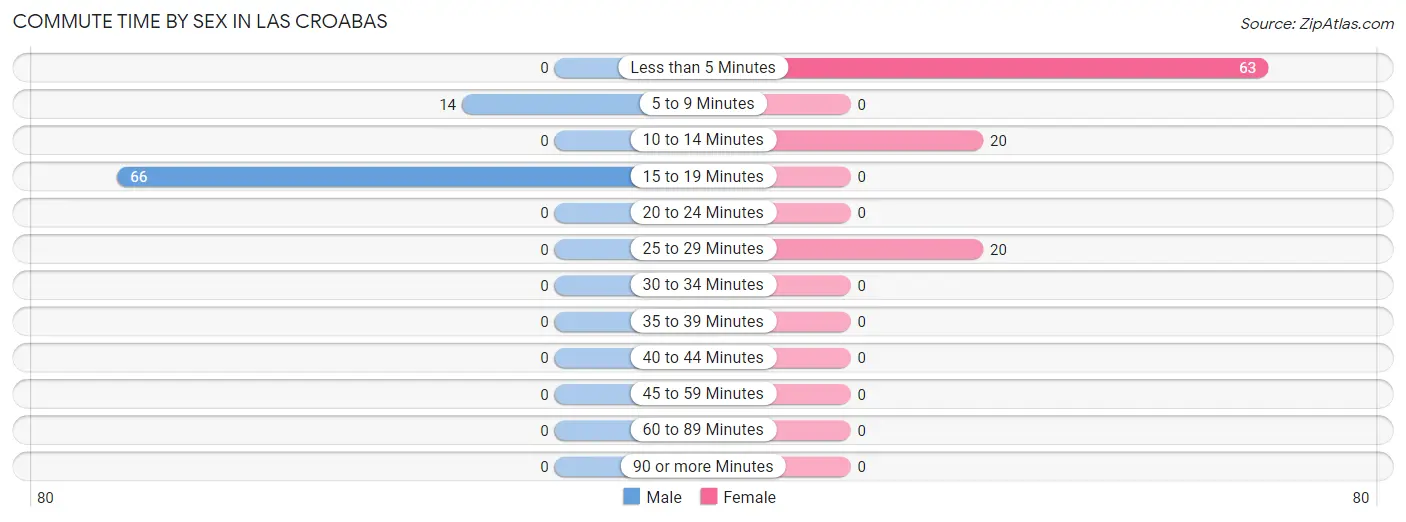
| Commute Time | Male | Female |
| Less than 5 Minutes | 0 (0.0%) | 63 (61.2%) |
| 5 to 9 Minutes | 14 (17.5%) | 0 (0.0%) |
| 10 to 14 Minutes | 0 (0.0%) | 20 (19.4%) |
| 15 to 19 Minutes | 66 (82.5%) | 0 (0.0%) |
| 20 to 24 Minutes | 0 (0.0%) | 0 (0.0%) |
| 25 to 29 Minutes | 0 (0.0%) | 20 (19.4%) |
| 30 to 34 Minutes | 0 (0.0%) | 0 (0.0%) |
| 35 to 39 Minutes | 0 (0.0%) | 0 (0.0%) |
| 40 to 44 Minutes | 0 (0.0%) | 0 (0.0%) |
| 45 to 59 Minutes | 0 (0.0%) | 0 (0.0%) |
| 60 to 89 Minutes | 0 (0.0%) | 0 (0.0%) |
| 90 or more Minutes | 0 (0.0%) | 0 (0.0%) |
Time of Departure to Work by Sex in Las Croabas
The most frequent times of departure to work in Las Croabas are 8:30 AM to 8:59 AM (24, 30.0%) for males and 8:00 AM to 8:29 AM (63, 61.2%) for females.
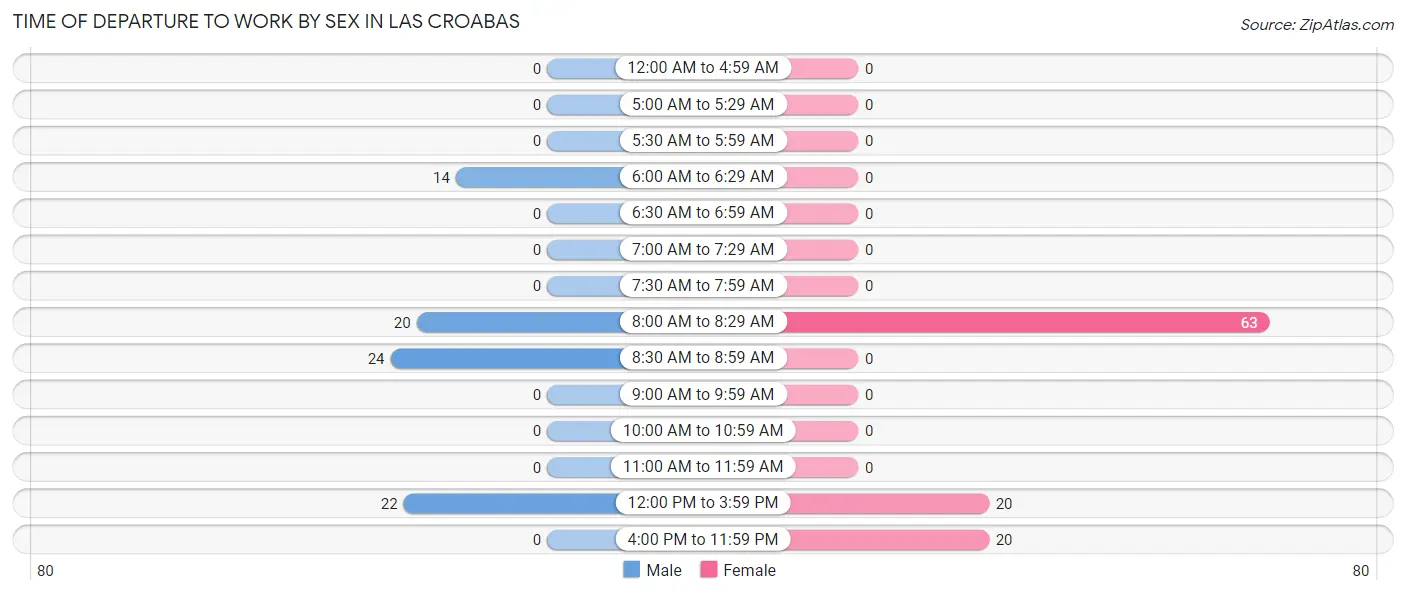
| Time of Departure | Male | Female |
| 12:00 AM to 4:59 AM | 0 (0.0%) | 0 (0.0%) |
| 5:00 AM to 5:29 AM | 0 (0.0%) | 0 (0.0%) |
| 5:30 AM to 5:59 AM | 0 (0.0%) | 0 (0.0%) |
| 6:00 AM to 6:29 AM | 14 (17.5%) | 0 (0.0%) |
| 6:30 AM to 6:59 AM | 0 (0.0%) | 0 (0.0%) |
| 7:00 AM to 7:29 AM | 0 (0.0%) | 0 (0.0%) |
| 7:30 AM to 7:59 AM | 0 (0.0%) | 0 (0.0%) |
| 8:00 AM to 8:29 AM | 20 (25.0%) | 63 (61.2%) |
| 8:30 AM to 8:59 AM | 24 (30.0%) | 0 (0.0%) |
| 9:00 AM to 9:59 AM | 0 (0.0%) | 0 (0.0%) |
| 10:00 AM to 10:59 AM | 0 (0.0%) | 0 (0.0%) |
| 11:00 AM to 11:59 AM | 0 (0.0%) | 0 (0.0%) |
| 12:00 PM to 3:59 PM | 22 (27.5%) | 20 (19.4%) |
| 4:00 PM to 11:59 PM | 0 (0.0%) | 20 (19.4%) |
| Total | 80 (100.0%) | 103 (100.0%) |
Housing Occupancy in Las Croabas
Occupancy by Ownership in Las Croabas
Of the total 353 dwellings in Las Croabas, owner-occupied units account for 137 (38.8%), while renter-occupied units make up 216 (61.2%).
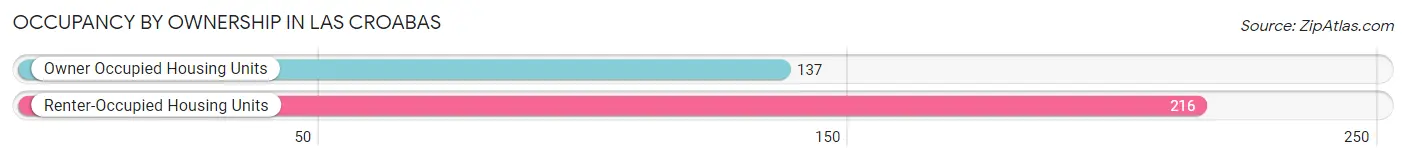
| Occupancy | # Housing Units | % Housing Units |
| Owner Occupied Housing Units | 137 | 38.8% |
| Renter-Occupied Housing Units | 216 | 61.2% |
| Total Occupied Housing Units | 353 | 100.0% |
Occupancy by Household Size in Las Croabas
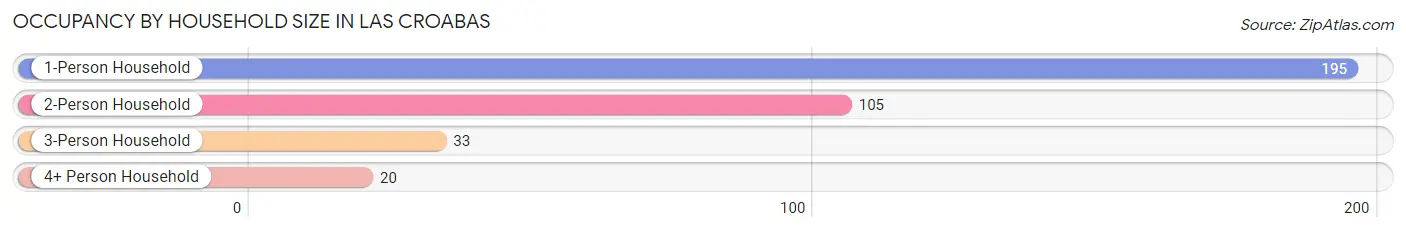
| Household Size | # Housing Units | % Housing Units |
| 1-Person Household | 195 | 55.2% |
| 2-Person Household | 105 | 29.7% |
| 3-Person Household | 33 | 9.3% |
| 4+ Person Household | 20 | 5.7% |
| Total Housing Units | 353 | 100.0% |
Occupancy by Ownership by Household Size in Las Croabas
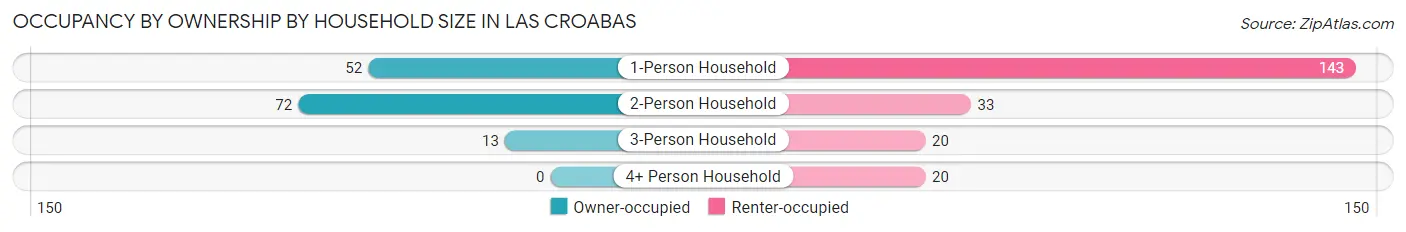
| Household Size | Owner-occupied | Renter-occupied |
| 1-Person Household | 52 (26.7%) | 143 (73.3%) |
| 2-Person Household | 72 (68.6%) | 33 (31.4%) |
| 3-Person Household | 13 (39.4%) | 20 (60.6%) |
| 4+ Person Household | 0 (0.0%) | 20 (100.0%) |
| Total Housing Units | 137 (38.8%) | 216 (61.2%) |
Occupancy by Educational Attainment in Las Croabas
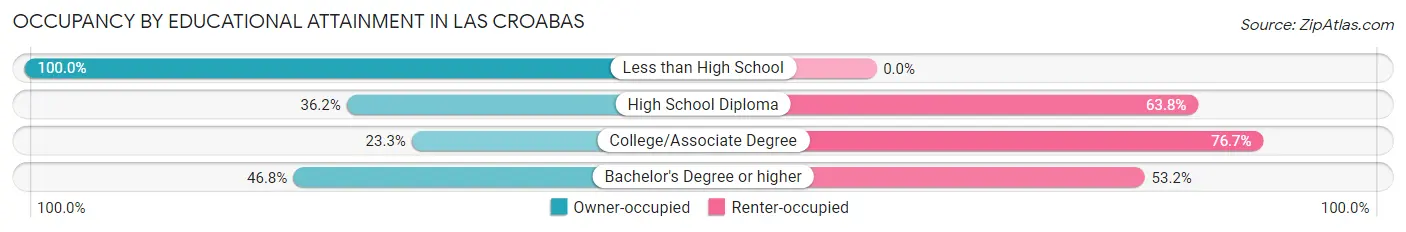
| Household Size | Owner-occupied | Renter-occupied |
| Less than High School | 13 (100.0%) | 0 (0.0%) |
| High School Diploma | 85 (36.2%) | 150 (63.8%) |
| College/Associate Degree | 10 (23.3%) | 33 (76.7%) |
| Bachelor's Degree or higher | 29 (46.8%) | 33 (53.2%) |
Occupancy by Age of Householder in Las Croabas
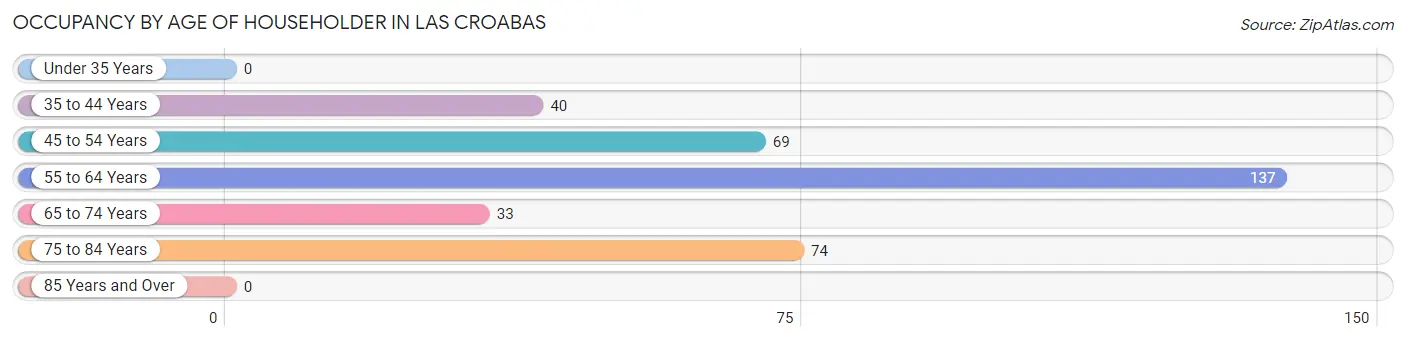
| Age Bracket | # Households | % Households |
| Under 35 Years | 0 | 0.0% |
| 35 to 44 Years | 40 | 11.3% |
| 45 to 54 Years | 69 | 19.6% |
| 55 to 64 Years | 137 | 38.8% |
| 65 to 74 Years | 33 | 9.3% |
| 75 to 84 Years | 74 | 21.0% |
| 85 Years and Over | 0 | 0.0% |
| Total | 353 | 100.0% |
Housing Finances in Las Croabas
Median Income by Occupancy in Las Croabas
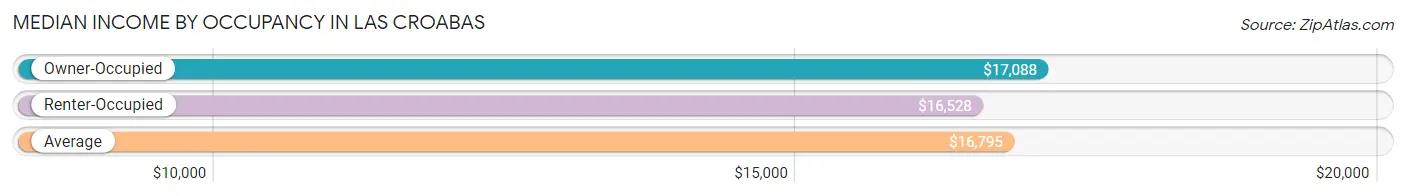
| Occupancy Type | # Households | Median Income |
| Owner-Occupied | 137 (38.8%) | $17,088 |
| Renter-Occupied | 216 (61.2%) | $16,528 |
| Average | 353 (100.0%) | $16,795 |
Occupancy by Householder Income Bracket in Las Croabas
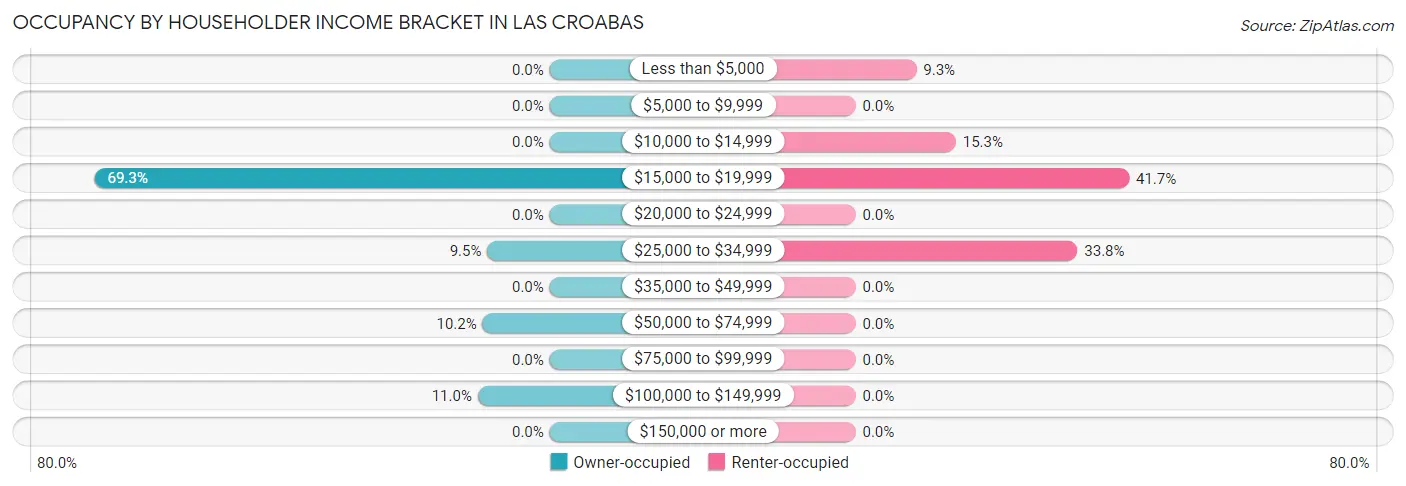
| Income Bracket | Owner-occupied | Renter-occupied |
| Less than $5,000 | 0 (0.0%) | 20 (9.3%) |
| $5,000 to $9,999 | 0 (0.0%) | 0 (0.0%) |
| $10,000 to $14,999 | 0 (0.0%) | 33 (15.3%) |
| $15,000 to $19,999 | 95 (69.3%) | 90 (41.7%) |
| $20,000 to $24,999 | 0 (0.0%) | 0 (0.0%) |
| $25,000 to $34,999 | 13 (9.5%) | 73 (33.8%) |
| $35,000 to $49,999 | 0 (0.0%) | 0 (0.0%) |
| $50,000 to $74,999 | 14 (10.2%) | 0 (0.0%) |
| $75,000 to $99,999 | 0 (0.0%) | 0 (0.0%) |
| $100,000 to $149,999 | 15 (11.0%) | 0 (0.0%) |
| $150,000 or more | 0 (0.0%) | 0 (0.0%) |
| Total | 137 (100.0%) | 216 (100.0%) |
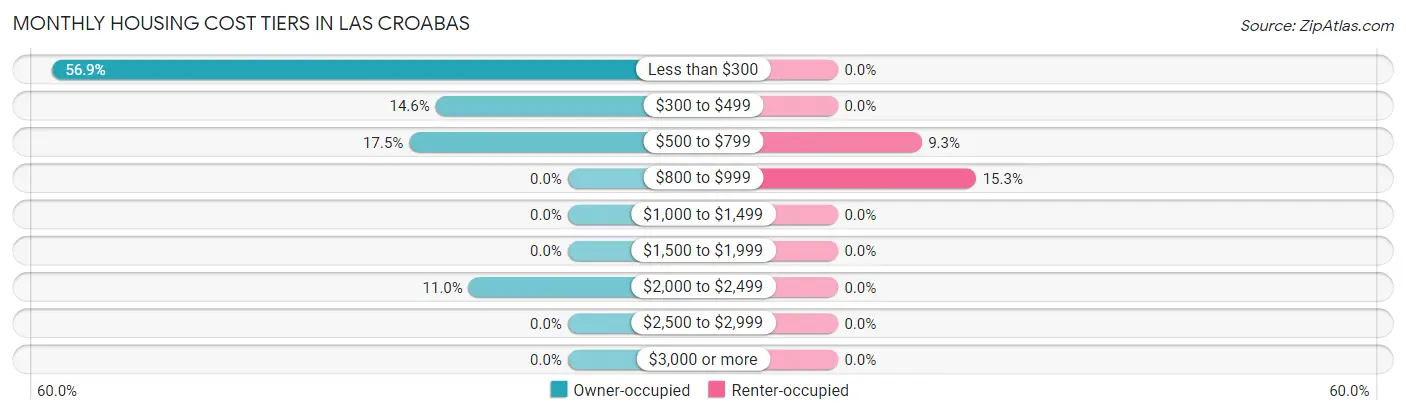
Monthly Housing Cost Tiers in Las Croabas
| Monthly Cost | Owner-occupied | Renter-occupied |
| Less than $300 | 78 (56.9%) | 0 (0.0%) |
| $300 to $499 | 20 (14.6%) | 0 (0.0%) |
| $500 to $799 | 24 (17.5%) | 20 (9.3%) |
| $800 to $999 | 0 (0.0%) | 33 (15.3%) |
| $1,000 to $1,499 | 0 (0.0%) | 0 (0.0%) |
| $1,500 to $1,999 | 0 (0.0%) | 0 (0.0%) |
| $2,000 to $2,499 | 15 (11.0%) | 0 (0.0%) |
| $2,500 to $2,999 | 0 (0.0%) | 0 (0.0%) |
| $3,000 or more | 0 (0.0%) | 0 (0.0%) |
| Total | 137 (100.0%) | 216 (100.0%) |
Physical Housing Characteristics in Las Croabas
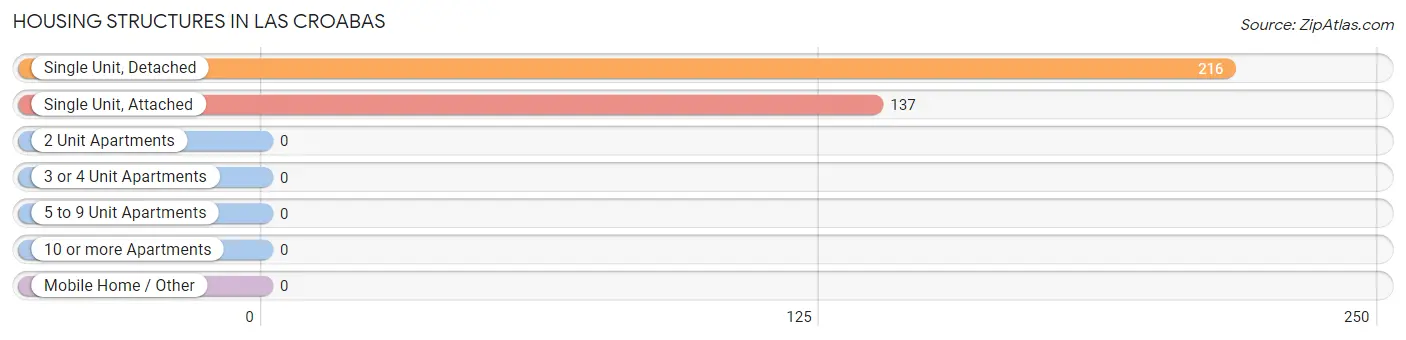
Housing Structures in Las Croabas
| Structure Type | # Housing Units | % Housing Units |
| Single Unit, Detached | 216 | 61.2% |
| Single Unit, Attached | 137 | 38.8% |
| 2 Unit Apartments | 0 | 0.0% |
| 3 or 4 Unit Apartments | 0 | 0.0% |
| 5 to 9 Unit Apartments | 0 | 0.0% |
| 10 or more Apartments | 0 | 0.0% |
| Mobile Home / Other | 0 | 0.0% |
| Total | 353 | 100.0% |
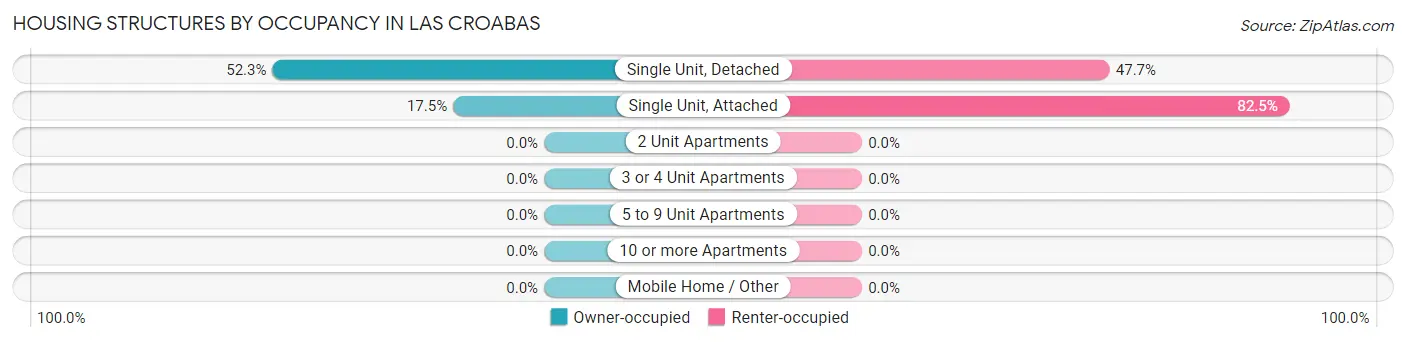
Housing Structures by Occupancy in Las Croabas
| Structure Type | Owner-occupied | Renter-occupied |
| Single Unit, Detached | 113 (52.3%) | 103 (47.7%) |
| Single Unit, Attached | 24 (17.5%) | 113 (82.5%) |
| 2 Unit Apartments | 0 (0.0%) | 0 (0.0%) |
| 3 or 4 Unit Apartments | 0 (0.0%) | 0 (0.0%) |
| 5 to 9 Unit Apartments | 0 (0.0%) | 0 (0.0%) |
| 10 or more Apartments | 0 (0.0%) | 0 (0.0%) |
| Mobile Home / Other | 0 (0.0%) | 0 (0.0%) |
| Total | 137 (38.8%) | 216 (61.2%) |
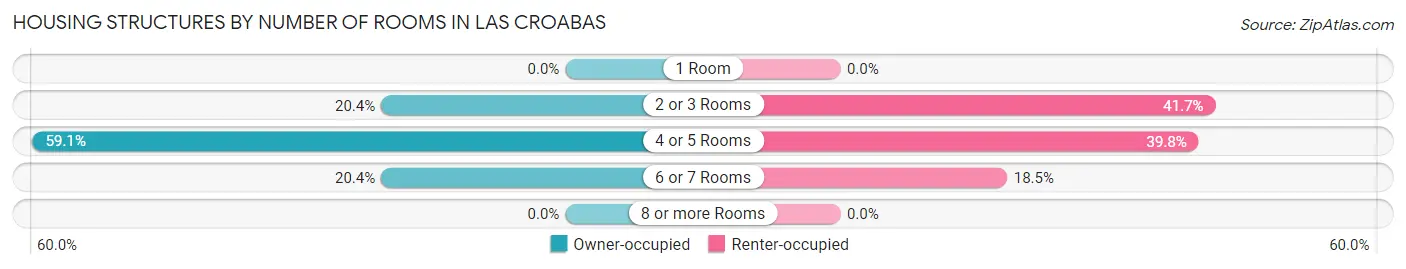
Housing Structures by Number of Rooms in Las Croabas
| Number of Rooms | Owner-occupied | Renter-occupied |
| 1 Room | 0 (0.0%) | 0 (0.0%) |
| 2 or 3 Rooms | 28 (20.4%) | 90 (41.7%) |
| 4 or 5 Rooms | 81 (59.1%) | 86 (39.8%) |
| 6 or 7 Rooms | 28 (20.4%) | 40 (18.5%) |
| 8 or more Rooms | 0 (0.0%) | 0 (0.0%) |
| Total | 137 (100.0%) | 216 (100.0%) |
Housing Structure by Heating Type in Las Croabas
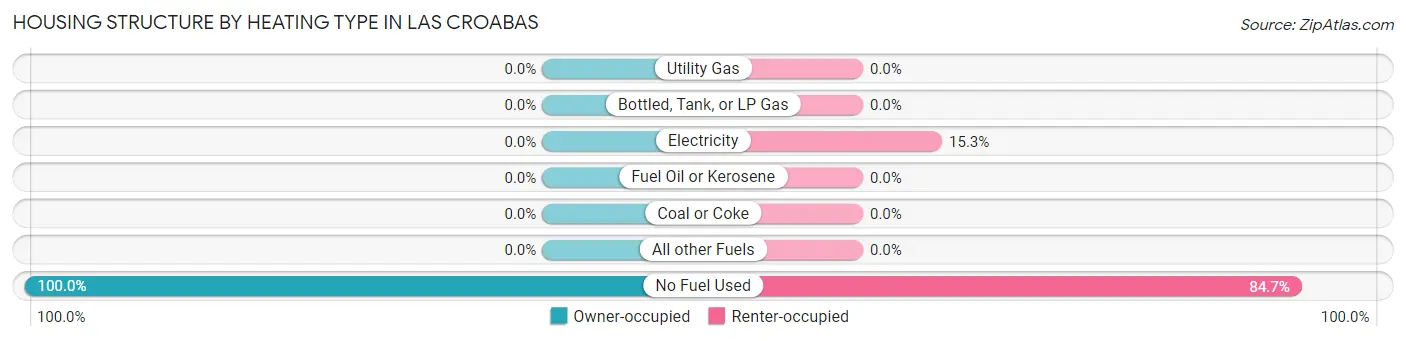
| Heating Type | Owner-occupied | Renter-occupied |
| Utility Gas | 0 (0.0%) | 0 (0.0%) |
| Bottled, Tank, or LP Gas | 0 (0.0%) | 0 (0.0%) |
| Electricity | 0 (0.0%) | 33 (15.3%) |
| Fuel Oil or Kerosene | 0 (0.0%) | 0 (0.0%) |
| Coal or Coke | 0 (0.0%) | 0 (0.0%) |
| All other Fuels | 0 (0.0%) | 0 (0.0%) |
| No Fuel Used | 137 (100.0%) | 183 (84.7%) |
| Total | 137 (100.0%) | 216 (100.0%) |
Household Vehicle Usage in Las Croabas
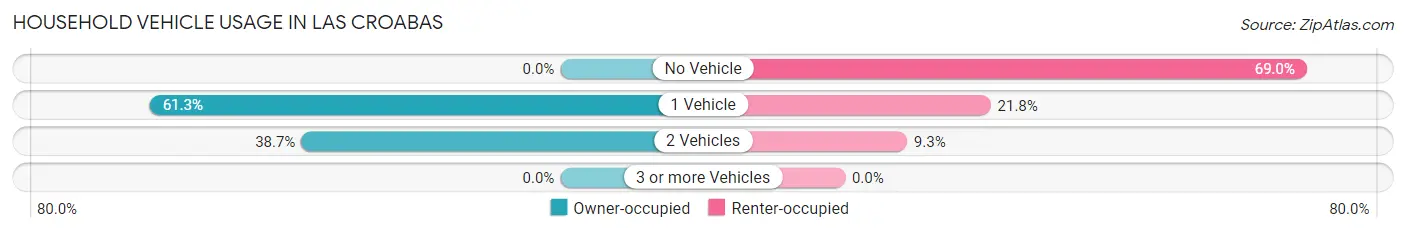
| Vehicles per Household | Owner-occupied | Renter-occupied |
| No Vehicle | 0 (0.0%) | 149 (69.0%) |
| 1 Vehicle | 84 (61.3%) | 47 (21.8%) |
| 2 Vehicles | 53 (38.7%) | 20 (9.3%) |
| 3 or more Vehicles | 0 (0.0%) | 0 (0.0%) |
| Total | 137 (100.0%) | 216 (100.0%) |
Real Estate & Mortgages in Las Croabas
Real Estate and Mortgage Overview in Las Croabas
| Characteristic | Without Mortgage | With Mortgage |
| Housing Units | 78 | 59 |
| Median Property Value | $225,000 | $0 |
| Median Household Income | $16,875 | $0 |
| Monthly Housing Costs | $132 | $0 |
| Real Estate Taxes | - | - |
Property Value by Mortgage Status in Las Croabas
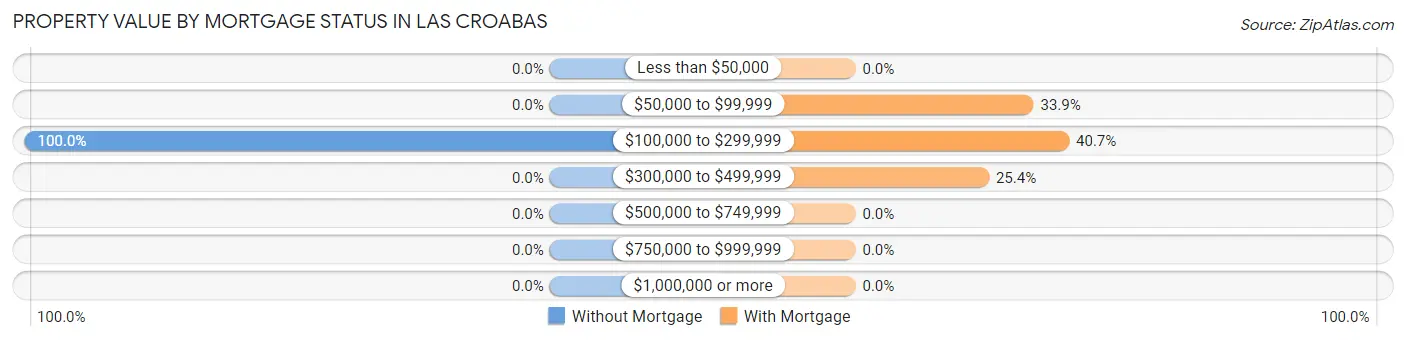
| Property Value | Without Mortgage | With Mortgage |
| Less than $50,000 | 0 (0.0%) | 0 (0.0%) |
| $50,000 to $99,999 | 0 (0.0%) | 20 (33.9%) |
| $100,000 to $299,999 | 78 (100.0%) | 24 (40.7%) |
| $300,000 to $499,999 | 0 (0.0%) | 15 (25.4%) |
| $500,000 to $749,999 | 0 (0.0%) | 0 (0.0%) |
| $750,000 to $999,999 | 0 (0.0%) | 0 (0.0%) |
| $1,000,000 or more | 0 (0.0%) | 0 (0.0%) |
| Total | 78 (100.0%) | 59 (100.0%) |
Household Income by Mortgage Status in Las Croabas
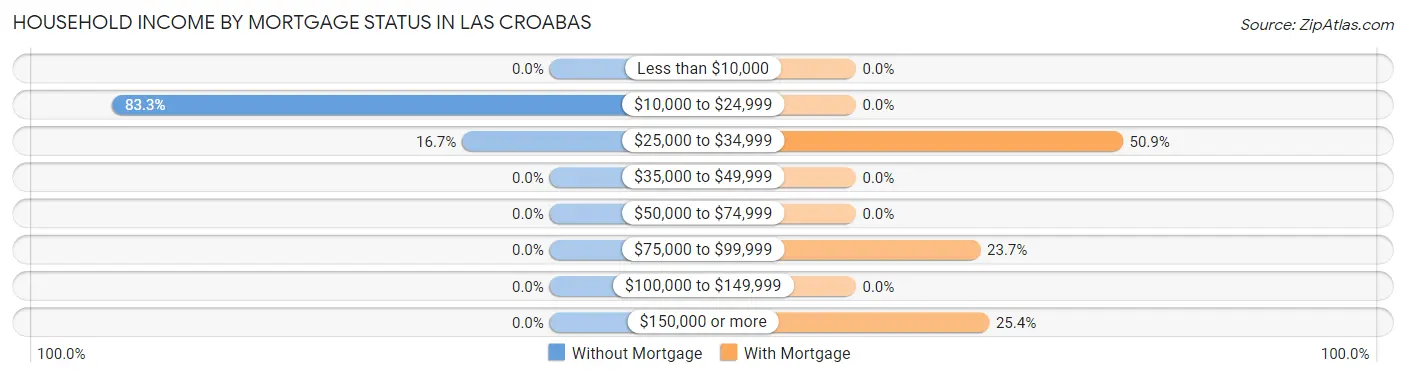
| Household Income | Without Mortgage | With Mortgage |
| Less than $10,000 | 0 (0.0%) | 0 (0.0%) |
| $10,000 to $24,999 | 65 (83.3%) | 0 (0.0%) |
| $25,000 to $34,999 | 13 (16.7%) | 30 (50.8%) |
| $35,000 to $49,999 | 0 (0.0%) | 0 (0.0%) |
| $50,000 to $74,999 | 0 (0.0%) | 0 (0.0%) |
| $75,000 to $99,999 | 0 (0.0%) | 14 (23.7%) |
| $100,000 to $149,999 | 0 (0.0%) | 0 (0.0%) |
| $150,000 or more | 0 (0.0%) | 15 (25.4%) |
| Total | 78 (100.0%) | 59 (100.0%) |
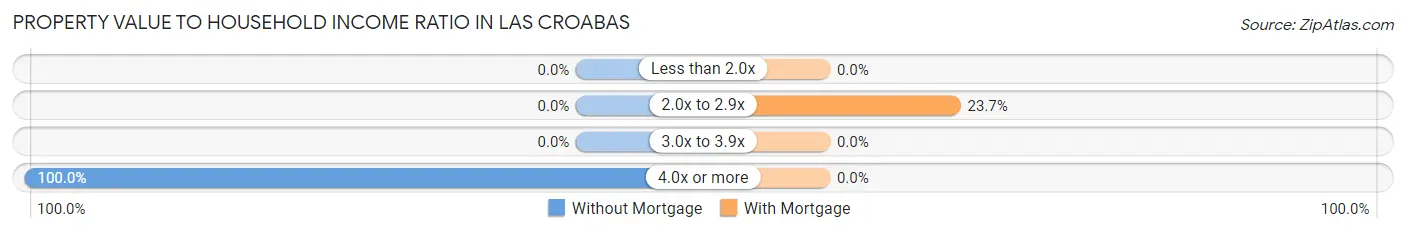
Property Value to Household Income Ratio in Las Croabas
| Value-to-Income Ratio | Without Mortgage | With Mortgage |
| Less than 2.0x | 0 (0.0%) | 0 (0.0%) |
| 2.0x to 2.9x | 0 (0.0%) | 14 (23.7%) |
| 3.0x to 3.9x | 0 (0.0%) | 0 (0.0%) |
| 4.0x or more | 78 (100.0%) | 0 (0.0%) |
| Total | 78 (100.0%) | 59 (100.0%) |
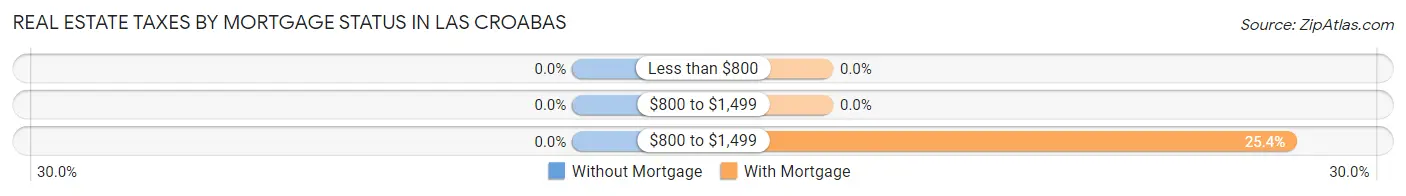
Real Estate Taxes by Mortgage Status in Las Croabas
| Property Taxes | Without Mortgage | With Mortgage |
| Less than $800 | 0 (0.0%) | 0 (0.0%) |
| $800 to $1,499 | 0 (0.0%) | 0 (0.0%) |
| $800 to $1,499 | 0 (0.0%) | 15 (25.4%) |
| Total | 78 (100.0%) | 59 (100.0%) |
Health & Disability in Las Croabas
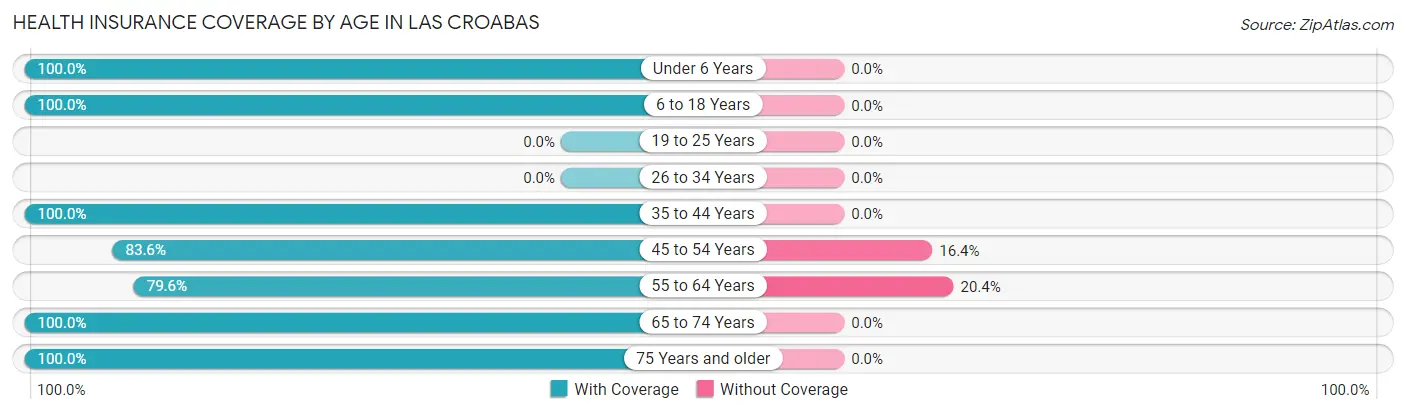
Health Insurance Coverage by Age in Las Croabas
| Age Bracket | With Coverage | Without Coverage |
| Under 6 Years | 34 (100.0%) | 0 (0.0%) |
| 6 to 18 Years | 80 (100.0%) | 0 (0.0%) |
| 19 to 25 Years | 0 (0.0%) | 0 (0.0%) |
| 26 to 34 Years | 0 (0.0%) | 0 (0.0%) |
| 35 to 44 Years | 109 (100.0%) | 0 (0.0%) |
| 45 to 54 Years | 112 (83.6%) | 22 (16.4%) |
| 55 to 64 Years | 129 (79.6%) | 33 (20.4%) |
| 65 to 74 Years | 33 (100.0%) | 0 (0.0%) |
| 75 Years and older | 114 (100.0%) | 0 (0.0%) |
| Total | 611 (91.7%) | 55 (8.3%) |
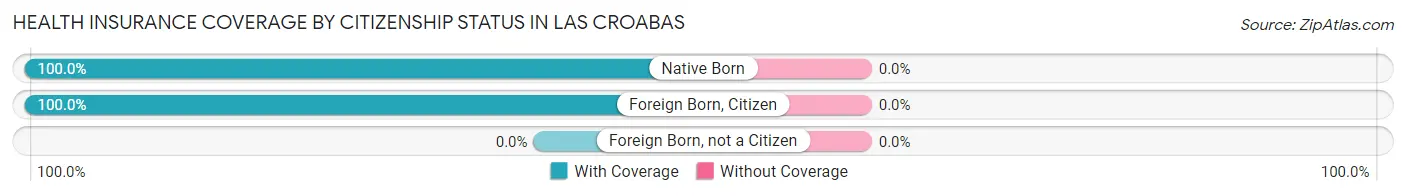
Health Insurance Coverage by Citizenship Status in Las Croabas
| Citizenship Status | With Coverage | Without Coverage |
| Native Born | 34 (100.0%) | 0 (0.0%) |
| Foreign Born, Citizen | 80 (100.0%) | 0 (0.0%) |
| Foreign Born, not a Citizen | 0 (0.0%) | 0 (0.0%) |
Health Insurance Coverage by Household Income in Las Croabas
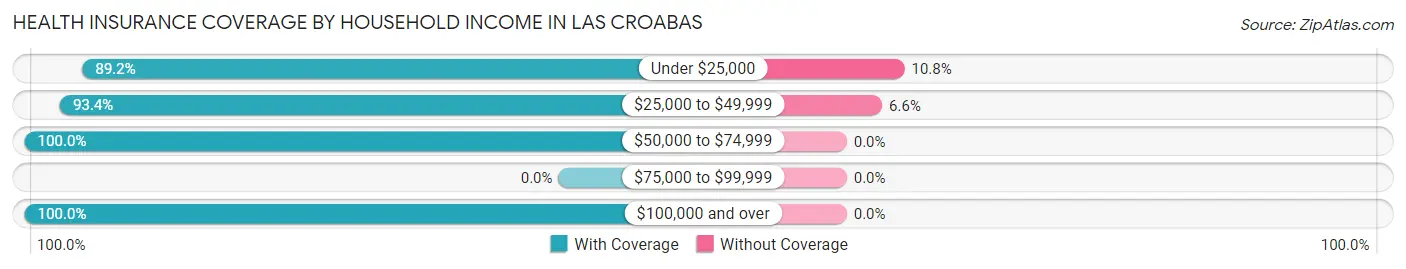
| Household Income | With Coverage | Without Coverage |
| Under $25,000 | 272 (89.2%) | 33 (10.8%) |
| $25,000 to $49,999 | 310 (93.4%) | 22 (6.6%) |
| $50,000 to $74,999 | 14 (100.0%) | 0 (0.0%) |
| $75,000 to $99,999 | 0 (0.0%) | 0 (0.0%) |
| $100,000 and over | 15 (100.0%) | 0 (0.0%) |
Public vs Private Health Insurance Coverage by Age in Las Croabas
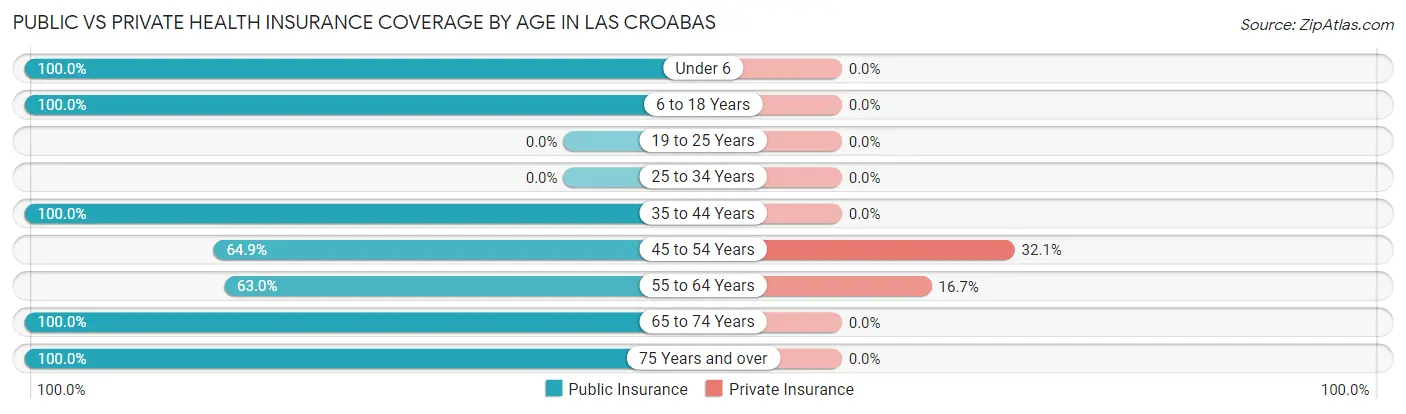
| Age Bracket | Public Insurance | Private Insurance |
| Under 6 | 34 (100.0%) | 0 (0.0%) |
| 6 to 18 Years | 80 (100.0%) | 0 (0.0%) |
| 19 to 25 Years | 0 (0.0%) | 0 (0.0%) |
| 25 to 34 Years | 0 (0.0%) | 0 (0.0%) |
| 35 to 44 Years | 109 (100.0%) | 0 (0.0%) |
| 45 to 54 Years | 87 (64.9%) | 43 (32.1%) |
| 55 to 64 Years | 102 (63.0%) | 27 (16.7%) |
| 65 to 74 Years | 33 (100.0%) | 0 (0.0%) |
| 75 Years and over | 114 (100.0%) | 0 (0.0%) |
| Total | 559 (83.9%) | 70 (10.5%) |
Disability Status by Sex by Age in Las Croabas
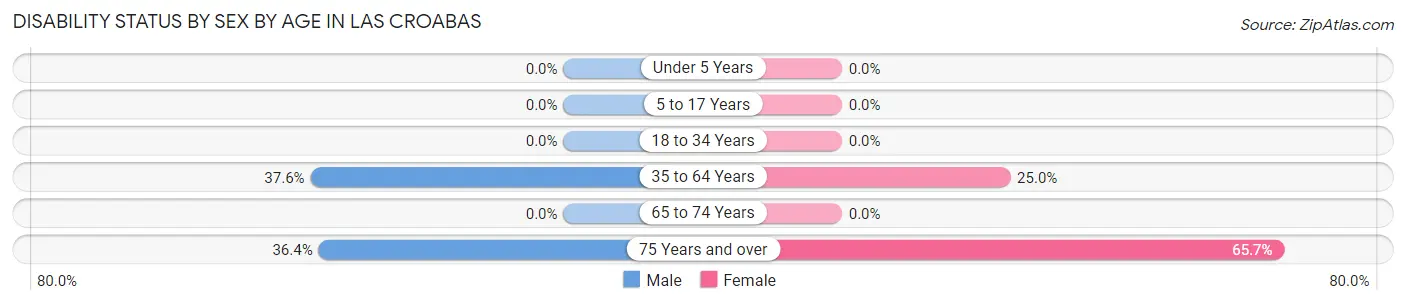
| Age Bracket | Male | Female |
| Under 5 Years | 0 (0.0%) | 0 (0.0%) |
| 5 to 17 Years | 0 (0.0%) | 0 (0.0%) |
| 18 to 34 Years | 0 (0.0%) | 0 (0.0%) |
| 35 to 64 Years | 74 (37.6%) | 52 (25.0%) |
| 65 to 74 Years | 0 (0.0%) | 0 (0.0%) |
| 75 Years and over | 16 (36.4%) | 46 (65.7%) |
Disability Class by Sex by Age in Las Croabas
Disability Class: Hearing Difficulty
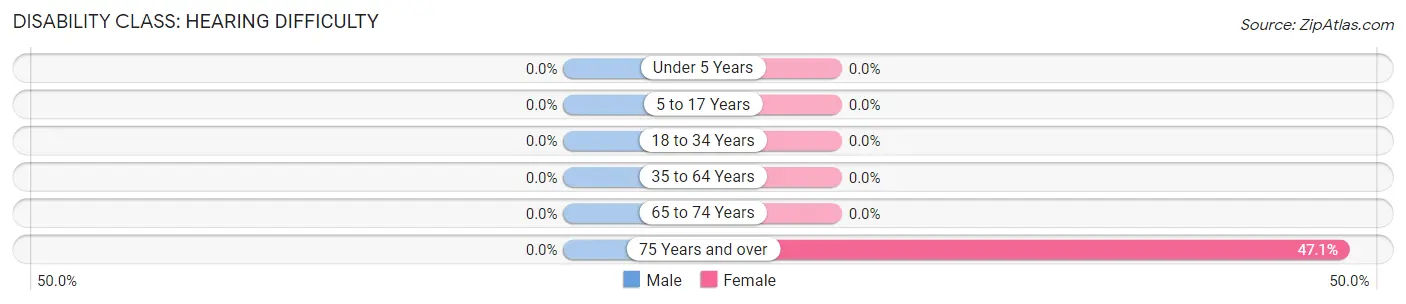
| Age Bracket | Male | Female |
| Under 5 Years | 0 (0.0%) | 0 (0.0%) |
| 5 to 17 Years | 0 (0.0%) | 0 (0.0%) |
| 18 to 34 Years | 0 (0.0%) | 0 (0.0%) |
| 35 to 64 Years | 0 (0.0%) | 0 (0.0%) |
| 65 to 74 Years | 0 (0.0%) | 0 (0.0%) |
| 75 Years and over | 0 (0.0%) | 33 (47.1%) |
Disability Class: Vision Difficulty
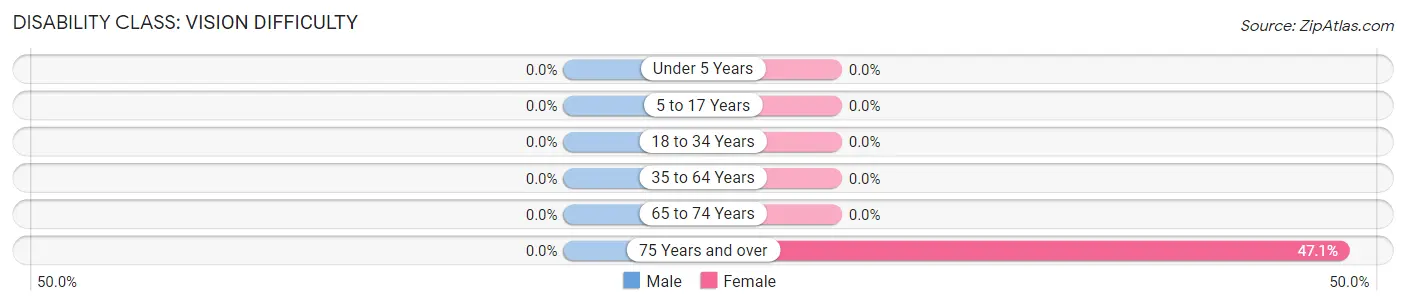
| Age Bracket | Male | Female |
| Under 5 Years | 0 (0.0%) | 0 (0.0%) |
| 5 to 17 Years | 0 (0.0%) | 0 (0.0%) |
| 18 to 34 Years | 0 (0.0%) | 0 (0.0%) |
| 35 to 64 Years | 0 (0.0%) | 0 (0.0%) |
| 65 to 74 Years | 0 (0.0%) | 0 (0.0%) |
| 75 Years and over | 0 (0.0%) | 33 (47.1%) |
Disability Class: Cognitive Difficulty
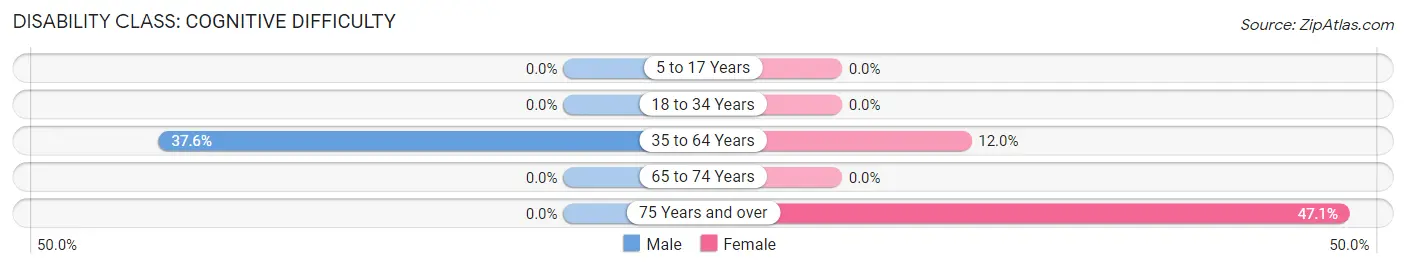
| Age Bracket | Male | Female |
| 5 to 17 Years | 0 (0.0%) | 0 (0.0%) |
| 18 to 34 Years | 0 (0.0%) | 0 (0.0%) |
| 35 to 64 Years | 74 (37.6%) | 25 (12.0%) |
| 65 to 74 Years | 0 (0.0%) | 0 (0.0%) |
| 75 Years and over | 0 (0.0%) | 33 (47.1%) |
Disability Class: Ambulatory Difficulty
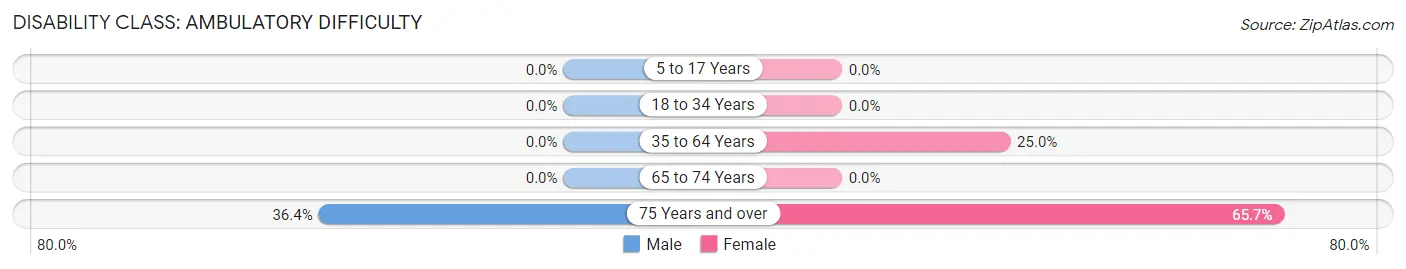
| Age Bracket | Male | Female |
| 5 to 17 Years | 0 (0.0%) | 0 (0.0%) |
| 18 to 34 Years | 0 (0.0%) | 0 (0.0%) |
| 35 to 64 Years | 0 (0.0%) | 52 (25.0%) |
| 65 to 74 Years | 0 (0.0%) | 0 (0.0%) |
| 75 Years and over | 16 (36.4%) | 46 (65.7%) |
Disability Class: Self-Care Difficulty
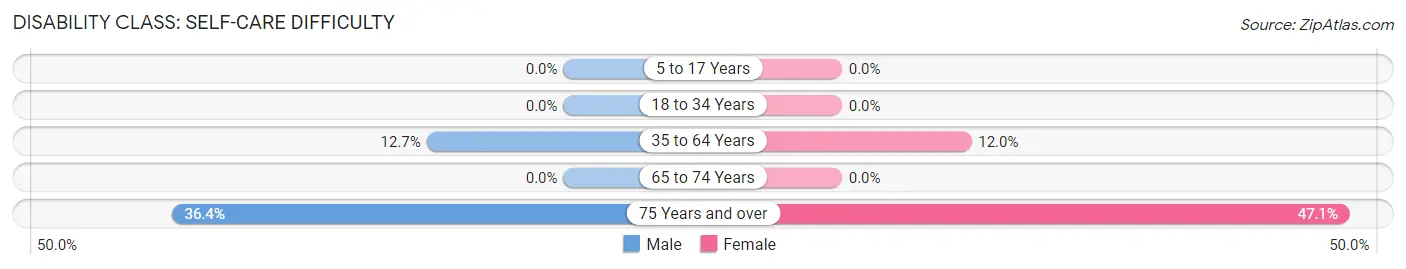
| Age Bracket | Male | Female |
| 5 to 17 Years | 0 (0.0%) | 0 (0.0%) |
| 18 to 34 Years | 0 (0.0%) | 0 (0.0%) |
| 35 to 64 Years | 25 (12.7%) | 25 (12.0%) |
| 65 to 74 Years | 0 (0.0%) | 0 (0.0%) |
| 75 Years and over | 16 (36.4%) | 33 (47.1%) |
Technology Access in Las Croabas
Computing Device Access in Las Croabas
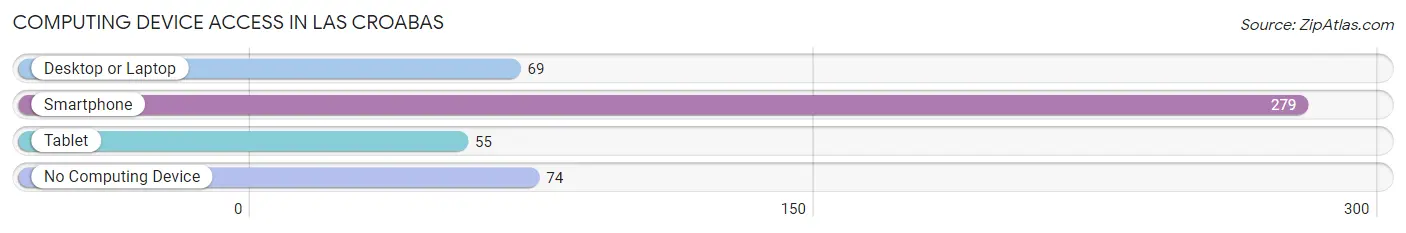
| Device Type | # Households | % Households |
| Desktop or Laptop | 69 | 19.6% |
| Smartphone | 279 | 79.0% |
| Tablet | 55 | 15.6% |
| No Computing Device | 74 | 21.0% |
| Total | 353 | 100.0% |
Internet Access in Las Croabas
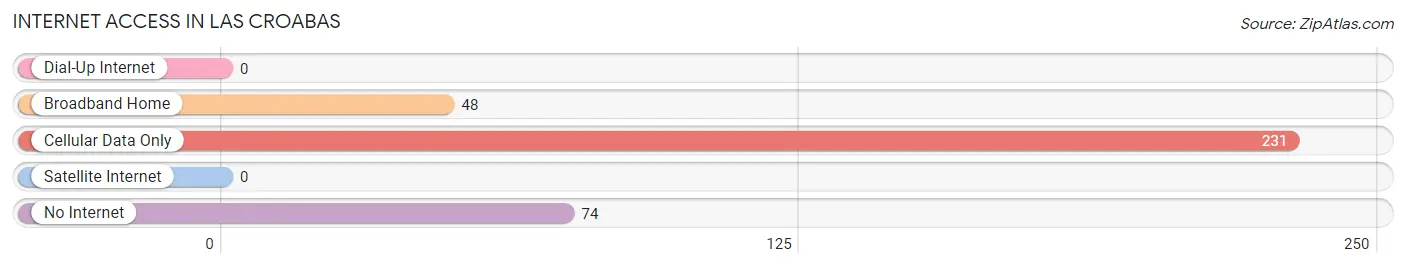
| Internet Type | # Households | % Households |
| Dial-Up Internet | 0 | 0.0% |
| Broadband Home | 48 | 13.6% |
| Cellular Data Only | 231 | 65.4% |
| Satellite Internet | 0 | 0.0% |
| No Internet | 74 | 21.0% |
| Total | 353 | 100.0% |
Las Croabas Summary
La Croabas is a small municipality located in the eastern region of Puerto Rico. It is part of the Fajardo metropolitan area and is situated on the northern coast of the island. La Croabas is a small fishing village with a population of approximately 2,000 people.
History
La Croabas was founded in the late 19th century by a group of fishermen from the nearby town of Fajardo. The name of the town is derived from the Spanish word “croabas”, which means “crab”. The fishermen were attracted to the area due to its abundance of crabs, which they used to make a living.
The town was officially established in 1891 and was initially part of the municipality of Fajardo. In the early 20th century, La Croabas was annexed to the municipality of Ceiba. In the 1950s, the town was annexed to the municipality of Fajardo once again.
Geography
La Croabas is located on the northern coast of Puerto Rico, approximately 20 miles east of the capital city of San Juan. The town is situated on a small peninsula, which is surrounded by the Atlantic Ocean on one side and the Caribbean Sea on the other. The town is bordered by the municipalities of Fajardo, Ceiba, and Naguabo.
The terrain of La Croabas is mostly flat, with some hills in the northern part of the town. The climate is tropical, with temperatures ranging from the mid-70s to the mid-80s throughout the year.
Economy
The economy of La Croabas is largely based on fishing and tourism. The town is home to several small fishing fleets, which provide employment for many of the town’s residents. The town also has several small restaurants and bars, which cater to tourists who come to the area to enjoy the beaches and other attractions.
In recent years, the town has seen an increase in tourism due to its proximity to the El Yunque National Forest and the nearby islands of Vieques and Culebra.
Demographics
As of the 2010 census, the population of La Croabas was 2,039. The population is predominantly of Puerto Rican descent, with a small minority of African and European descent. The median age of the population is 38.5 years, and the median household income is $20,000.
The majority of the population is Roman Catholic, with a small minority of other religious affiliations. The town is served by two public schools, one elementary school and one high school.
La Croabas is a small but vibrant town with a rich history and culture. The town is known for its beautiful beaches, its abundance of seafood, and its friendly people. The town is a popular destination for tourists, and its economy is largely based on fishing and tourism. La Croabas is a great place to visit and explore, and its residents are proud of their town and its history.
Common Questions
What is Per Capita Income in Las Croabas?
Per Capita income in Las Croabas is $13,043.
What is the Median Family Income in Las Croabas?
Median Family Income in Las Croabas is $18,375.
What is the Median Household income in Las Croabas?
Median Household Income in Las Croabas is $16,795.
What is Income or Wage Gap in Las Croabas?
Income or Wage Gap in Las Croabas is 5.7%.
Women in Las Croabas earn 94.3 cents for every dollar earned by a man.
What is Inequality or Gini Index in Las Croabas?
Inequality or Gini Index in Las Croabas is 0.35.
What is the Total Population of Las Croabas?
Total Population of Las Croabas is 666.
What is the Total Male Population of Las Croabas?
Total Male Population of Las Croabas is 375.
What is the Total Female Population of Las Croabas?
Total Female Population of Las Croabas is 291.
What is the Ratio of Males per 100 Females in Las Croabas?
There are 128.87 Males per 100 Females in Las Croabas.
What is the Ratio of Females per 100 Males in Las Croabas?
There are 77.60 Females per 100 Males in Las Croabas.
What is the Median Population Age in Las Croabas?
Median Population Age in Las Croabas is 53.0 Years.
What is the Average Family Size in Las Croabas
Average Family Size in Las Croabas is 2.9 People.
What is the Average Household Size in Las Croabas
Average Household Size in Las Croabas is 1.9 People.
How Large is the Labor Force in Las Croabas?
There are 246 People in the Labor Forcein in Las Croabas.
What is the Percentage of People in the Labor Force in Las Croabas?
44.6% of People are in the Labor Force in Las Croabas.
What is the Unemployment Rate in Las Croabas?
Unemployment Rate in Las Croabas is 15.4%.