Maria Antonia, PR Map & Demographics
Maria Antonia Overview
$12,355
PER CAPITA INCOME
$30,156
AVG FAMILY INCOME
$25,721
AVG HOUSEHOLD INCOME
11.9%
WAGE / INCOME GAP [ % ]
88.1¢/ $1
WAGE / INCOME GAP [ $ ]
0.42
INEQUALITY / GINI INDEX
1,614
TOTAL POPULATION
887
MALE POPULATION
727
FEMALE POPULATION
122.01
MALES / 100 FEMALES
81.96
FEMALES / 100 MALES
42.5
MEDIAN AGE
3.1
AVG FAMILY SIZE
2.4
AVG HOUSEHOLD SIZE
668
LABOR FORCE [ PEOPLE ]
49.3%
PERCENT IN LABOR FORCE
11.2%
UNEMPLOYMENT RATE
Income in Maria Antonia
Income Overview in Maria Antonia
Per Capita Income in Maria Antonia is $12,355, while median incomes of families and households are $30,156 and $25,721 respectively.
| Characteristic | Number | Measure |
| Per Capita Income | 1,614 | $12,355 |
| Median Family Income | 387 | $30,156 |
| Mean Family Income | 387 | $31,643 |
| Median Household Income | 681 | $25,721 |
| Mean Household Income | 681 | $28,108 |
| Income Deficit | 387 | $0 |
| Wage / Income Gap (%) | 1,614 | 11.86% |
| Wage / Income Gap ($) | 1,614 | 88.14¢ per $1 |
| Gini / Inequality Index | 1,614 | 0.42 |
Earnings by Sex in Maria Antonia
Average Earnings in Maria Antonia are $17,832, $18,689 for men and $16,472 for women, a difference of 11.9%.
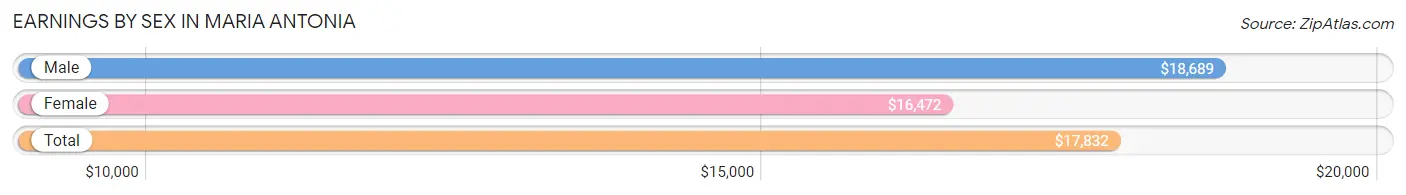
| Sex | Number | Average Earnings |
| Male | 288 (46.1%) | $18,689 |
| Female | 337 (53.9%) | $16,472 |
| Total | 625 (100.0%) | $17,832 |
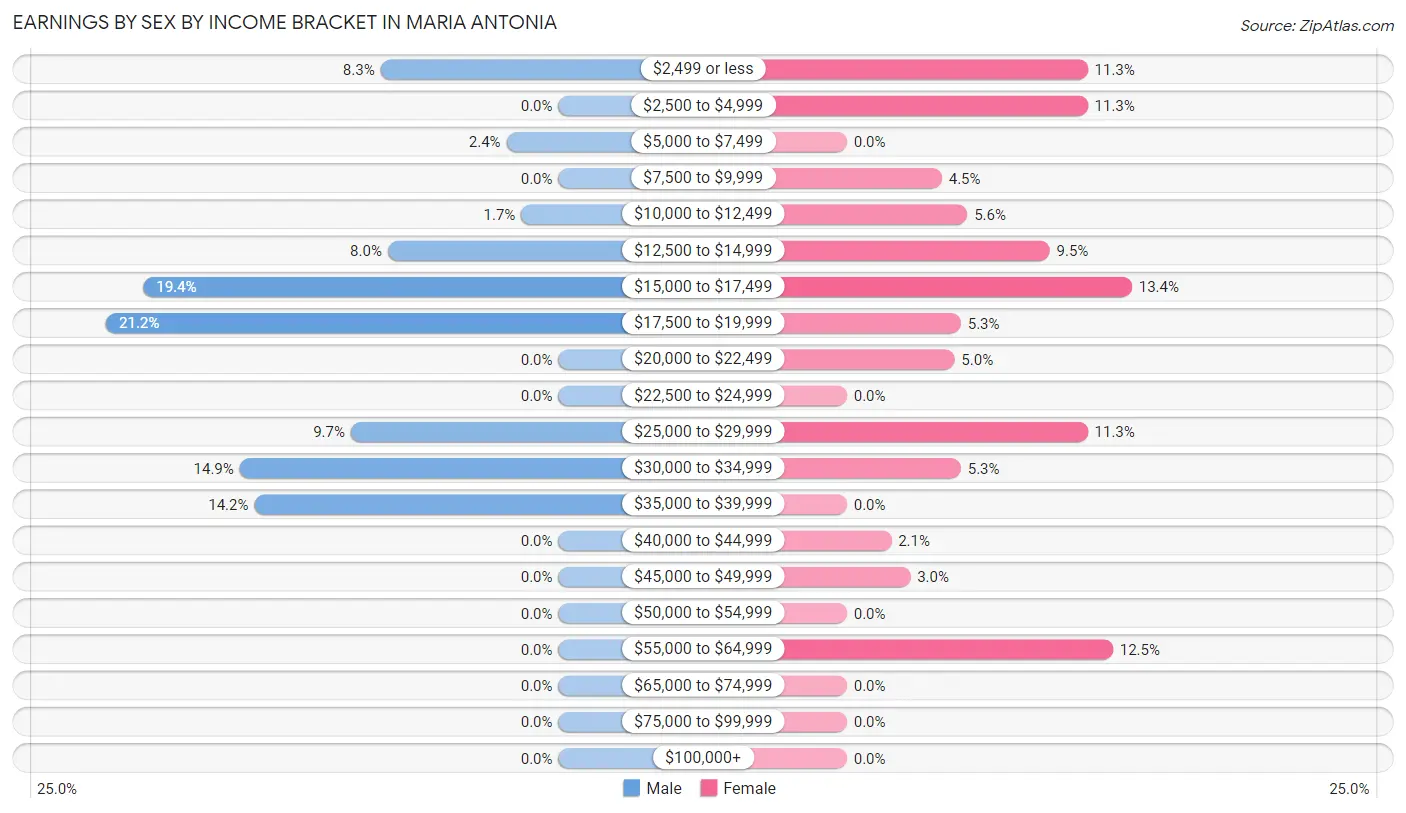
Earnings by Sex by Income Bracket in Maria Antonia
The most common earnings brackets in Maria Antonia are $17,500 to $19,999 for men (61 | 21.2%) and $15,000 to $17,499 for women (45 | 13.4%).
| Income | Male | Female |
| $2,499 or less | 24 (8.3%) | 38 (11.3%) |
| $2,500 to $4,999 | 0 (0.0%) | 38 (11.3%) |
| $5,000 to $7,499 | 7 (2.4%) | 0 (0.0%) |
| $7,500 to $9,999 | 0 (0.0%) | 15 (4.4%) |
| $10,000 to $12,499 | 5 (1.7%) | 19 (5.6%) |
| $12,500 to $14,999 | 23 (8.0%) | 32 (9.5%) |
| $15,000 to $17,499 | 56 (19.4%) | 45 (13.4%) |
| $17,500 to $19,999 | 61 (21.2%) | 18 (5.3%) |
| $20,000 to $22,499 | 0 (0.0%) | 17 (5.0%) |
| $22,500 to $24,999 | 0 (0.0%) | 0 (0.0%) |
| $25,000 to $29,999 | 28 (9.7%) | 38 (11.3%) |
| $30,000 to $34,999 | 43 (14.9%) | 18 (5.3%) |
| $35,000 to $39,999 | 41 (14.2%) | 0 (0.0%) |
| $40,000 to $44,999 | 0 (0.0%) | 7 (2.1%) |
| $45,000 to $49,999 | 0 (0.0%) | 10 (3.0%) |
| $50,000 to $54,999 | 0 (0.0%) | 0 (0.0%) |
| $55,000 to $64,999 | 0 (0.0%) | 42 (12.5%) |
| $65,000 to $74,999 | 0 (0.0%) | 0 (0.0%) |
| $75,000 to $99,999 | 0 (0.0%) | 0 (0.0%) |
| $100,000+ | 0 (0.0%) | 0 (0.0%) |
| Total | 288 (100.0%) | 337 (100.0%) |
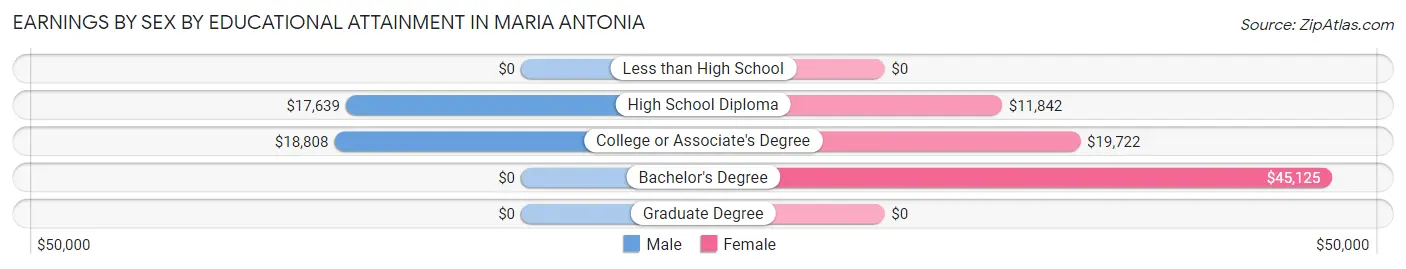
Earnings by Sex by Educational Attainment in Maria Antonia
Average earnings in Maria Antonia are $18,689 for men and $17,917 for women, a difference of 4.1%. Men with an educational attainment of college or associate's degree enjoy the highest average annual earnings of $18,808, while those with high school diploma education earn the least with $17,639. Women with an educational attainment of bachelor's degree earn the most with the average annual earnings of $45,125, while those with high school diploma education have the smallest earnings of $11,842.
| Educational Attainment | Male Income | Female Income |
| Less than High School | - | - |
| High School Diploma | $17,639 | $11,842 |
| College or Associate's Degree | $18,808 | $19,722 |
| Bachelor's Degree | - | - |
| Graduate Degree | - | - |
| Total | $18,689 | $17,917 |
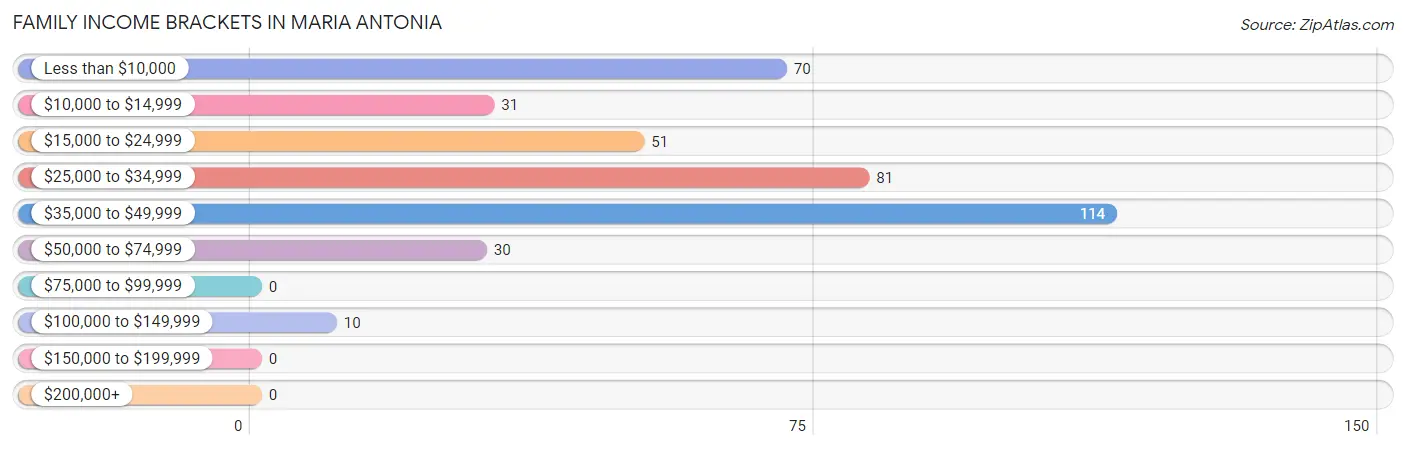
Family Income in Maria Antonia
Family Income Brackets in Maria Antonia
According to the Maria Antonia family income data, there are 114 families falling into the $35,000 to $49,999 income range, which is the most common income bracket and makes up 29.5% of all families.
| Income Bracket | # Families | % Families |
| Less than $10,000 | 70 | 18.1% |
| $10,000 to $14,999 | 31 | 8.0% |
| $15,000 to $24,999 | 51 | 13.2% |
| $25,000 to $34,999 | 81 | 20.9% |
| $35,000 to $49,999 | 114 | 29.5% |
| $50,000 to $74,999 | 30 | 7.8% |
| $75,000 to $99,999 | 0 | 0.0% |
| $100,000 to $149,999 | 10 | 2.6% |
| $150,000 to $199,999 | 0 | 0.0% |
| $200,000+ | 0 | 0.0% |
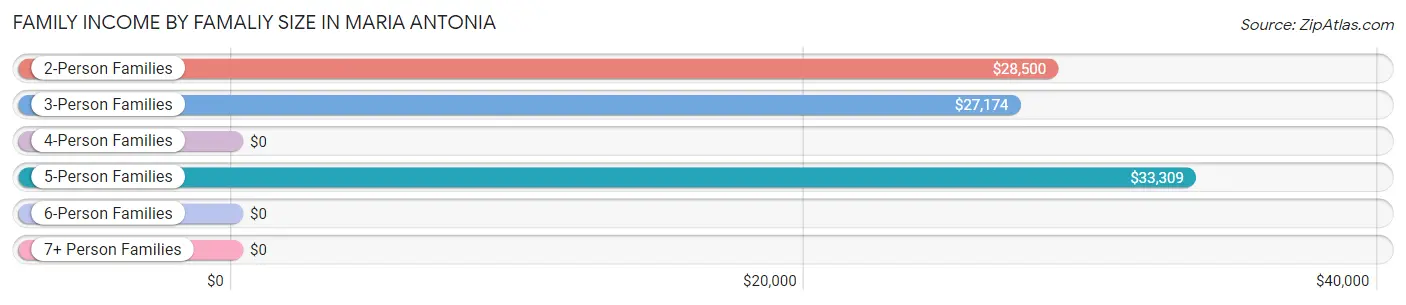
Family Income by Famaliy Size in Maria Antonia
5-person families (57 | 14.7%) account for the highest median family income in Maria Antonia with $33,309 per family, while 2-person families (216 | 55.8%) have the highest median income of $14,250 per family member.
| Income Bracket | # Families | Median Income |
| 2-Person Families | 216 (55.8%) | $28,500 |
| 3-Person Families | 104 (26.9%) | $27,174 |
| 4-Person Families | 10 (2.6%) | $0 |
| 5-Person Families | 57 (14.7%) | $33,309 |
| 6-Person Families | 0 (0.0%) | $0 |
| 7+ Person Families | 0 (0.0%) | $0 |
| Total | 387 (100.0%) | $30,156 |
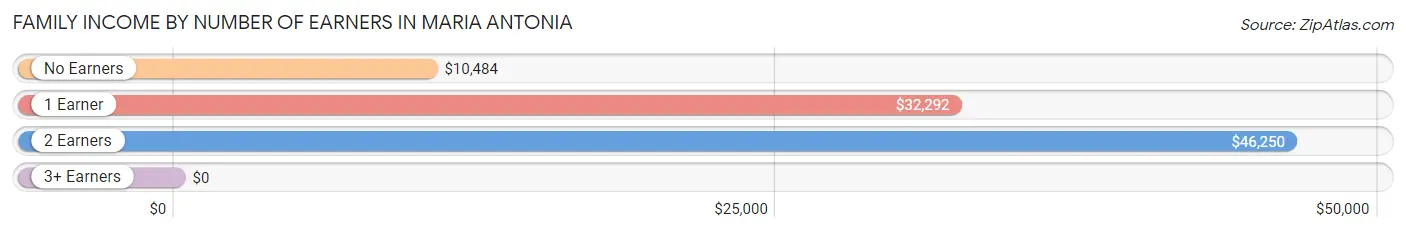
Family Income by Number of Earners in Maria Antonia
| Number of Earners | # Families | Median Income |
| No Earners | 152 (39.3%) | $10,484 |
| 1 Earner | 146 (37.7%) | $32,292 |
| 2 Earners | 81 (20.9%) | $46,250 |
| 3+ Earners | 8 (2.1%) | $0 |
| Total | 387 (100.0%) | $30,156 |
Household Income in Maria Antonia
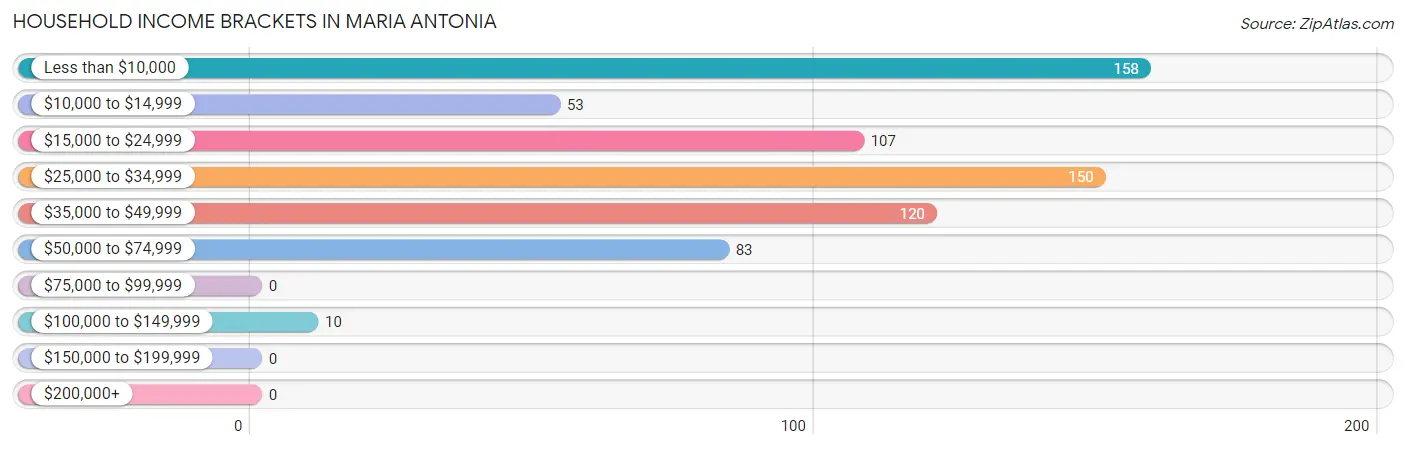
Household Income Brackets in Maria Antonia
With 158 households falling in the category, the less than $10,000 income range is the most frequent in Maria Antonia, accounting for 23.2% of all households.
| Income Bracket | # Households | % Households |
| Less than $10,000 | 158 | 23.2% |
| $10,000 to $14,999 | 53 | 7.8% |
| $15,000 to $24,999 | 107 | 15.7% |
| $25,000 to $34,999 | 150 | 22.0% |
| $35,000 to $49,999 | 120 | 17.6% |
| $50,000 to $74,999 | 83 | 12.2% |
| $75,000 to $99,999 | 0 | 0.0% |
| $100,000 to $149,999 | 10 | 1.5% |
| $150,000 to $199,999 | 0 | 0.0% |
| $200,000+ | 0 | 0.0% |
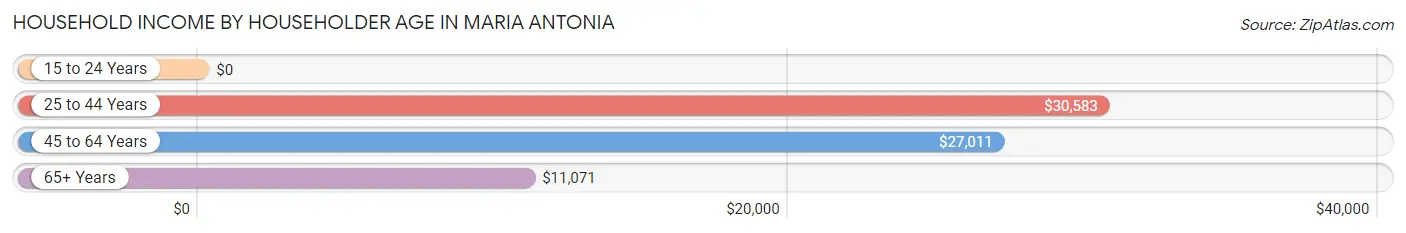
Household Income by Householder Age in Maria Antonia
The median household income in Maria Antonia is $25,721, with the highest median household income of $30,583 found in the 25 to 44 years age bracket for the primary householder. A total of 229 households (33.6%) fall into this category.
| Income Bracket | # Households | Median Income |
| 15 to 24 Years | 0 (0.0%) | $0 |
| 25 to 44 Years | 229 (33.6%) | $30,583 |
| 45 to 64 Years | 252 (37.0%) | $27,011 |
| 65+ Years | 200 (29.4%) | $11,071 |
| Total | 681 (100.0%) | $25,721 |
Poverty in Maria Antonia
Income Below Poverty by Sex and Age in Maria Antonia
With 44.2% poverty level for males and 54.1% for females among the residents of Maria Antonia, 12 to 14 year old males and 18 to 24 year old females are the most vulnerable to poverty, with 34 males (100.0%) and 69 females (100.0%) in their respective age groups living below the poverty level.
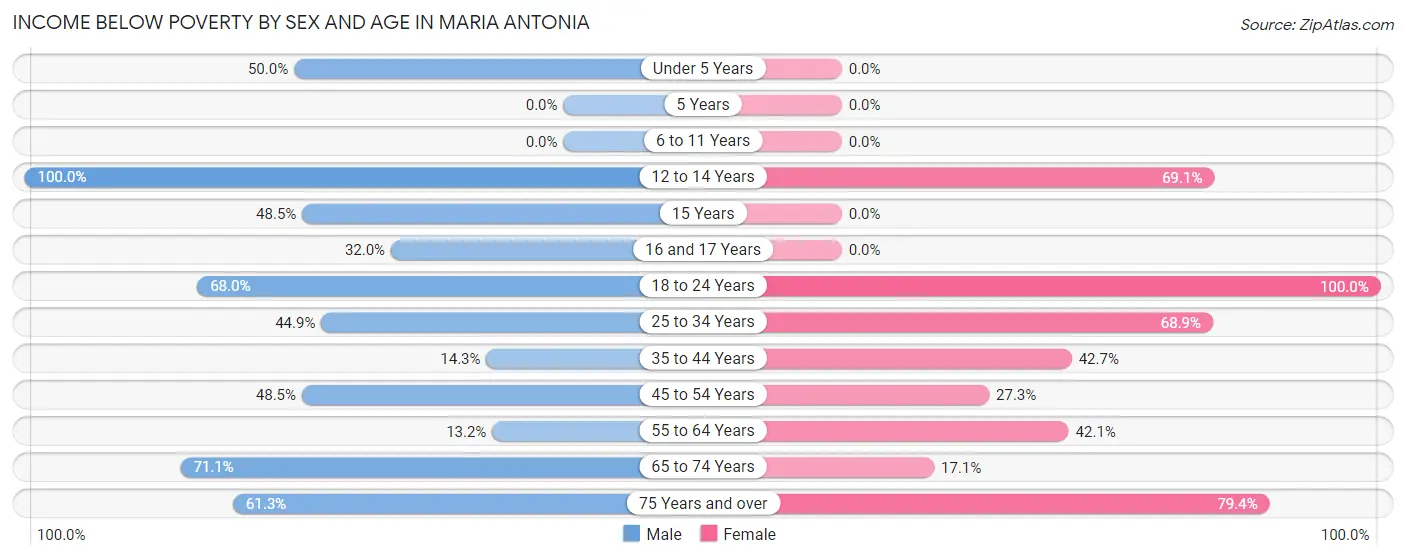
| Age Bracket | Male | Female |
| Under 5 Years | 29 (50.0%) | 0 (0.0%) |
| 5 Years | 0 (0.0%) | 0 (0.0%) |
| 6 to 11 Years | 0 (0.0%) | 0 (0.0%) |
| 12 to 14 Years | 34 (100.0%) | 47 (69.1%) |
| 15 Years | 16 (48.5%) | 0 (0.0%) |
| 16 and 17 Years | 8 (32.0%) | 0 (0.0%) |
| 18 to 24 Years | 53 (67.9%) | 69 (100.0%) |
| 25 to 34 Years | 40 (44.9%) | 73 (68.9%) |
| 35 to 44 Years | 23 (14.3%) | 35 (42.7%) |
| 45 to 54 Years | 50 (48.5%) | 38 (27.3%) |
| 55 to 64 Years | 7 (13.2%) | 48 (42.1%) |
| 65 to 74 Years | 86 (71.1%) | 6 (17.1%) |
| 75 Years and over | 46 (61.3%) | 77 (79.4%) |
| Total | 392 (44.2%) | 393 (54.1%) |
Income Above Poverty by Sex and Age in Maria Antonia
According to the poverty statistics in Maria Antonia, males aged 6 to 11 years and females aged 6 to 11 years are the age groups that are most secure financially, with 100.0% of males and 100.0% of females in these age groups living above the poverty line.
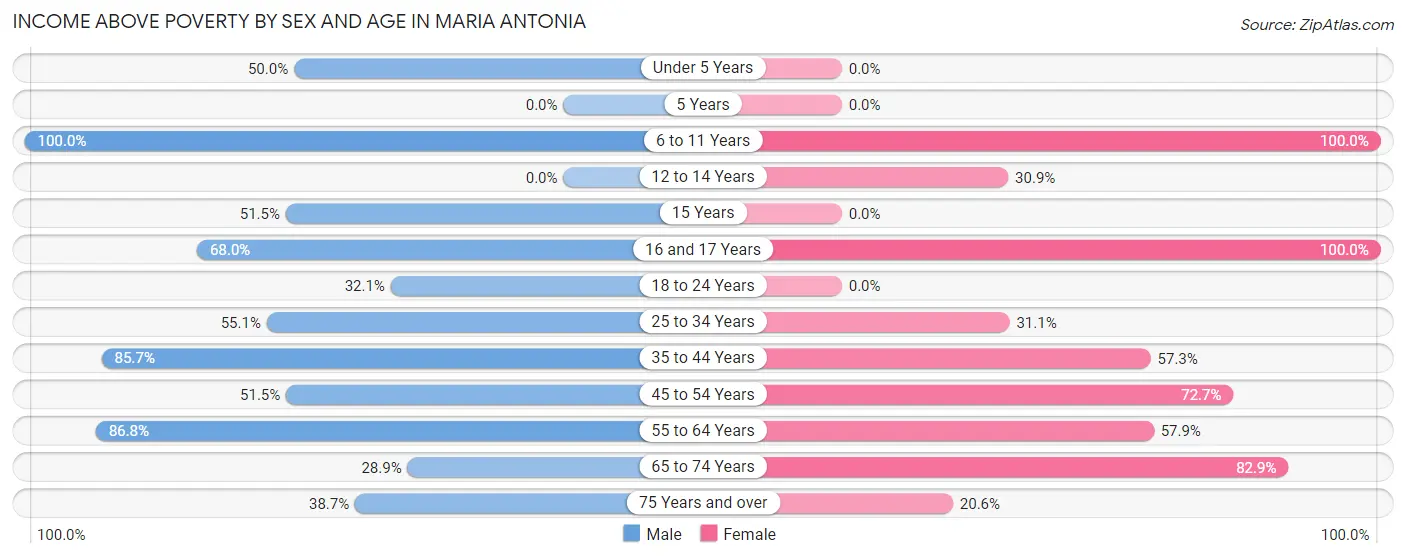
| Age Bracket | Male | Female |
| Under 5 Years | 29 (50.0%) | 0 (0.0%) |
| 5 Years | 0 (0.0%) | 0 (0.0%) |
| 6 to 11 Years | 57 (100.0%) | 10 (100.0%) |
| 12 to 14 Years | 0 (0.0%) | 21 (30.9%) |
| 15 Years | 17 (51.5%) | 0 (0.0%) |
| 16 and 17 Years | 17 (68.0%) | 7 (100.0%) |
| 18 to 24 Years | 25 (32.1%) | 0 (0.0%) |
| 25 to 34 Years | 49 (55.1%) | 33 (31.1%) |
| 35 to 44 Years | 138 (85.7%) | 47 (57.3%) |
| 45 to 54 Years | 53 (51.5%) | 101 (72.7%) |
| 55 to 64 Years | 46 (86.8%) | 66 (57.9%) |
| 65 to 74 Years | 35 (28.9%) | 29 (82.9%) |
| 75 Years and over | 29 (38.7%) | 20 (20.6%) |
| Total | 495 (55.8%) | 334 (45.9%) |
Income Below Poverty Among Married-Couple Families in Maria Antonia
The poverty statistics for married-couple families in Maria Antonia show that 39.6% or 108 of the total 273 families live below the poverty line. Families with 1 or 2 children have the highest poverty rate of 57.1%, comprising of 40 families. On the other hand, families with 3 or 4 children have the lowest poverty rate of 0.0%, which includes 0 families.
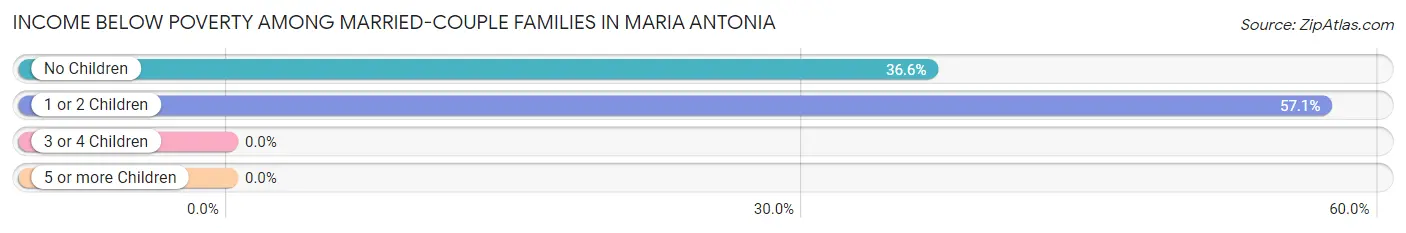
| Children | Above Poverty | Below Poverty |
| No Children | 118 (63.4%) | 68 (36.6%) |
| 1 or 2 Children | 30 (42.9%) | 40 (57.1%) |
| 3 or 4 Children | 17 (100.0%) | 0 (0.0%) |
| 5 or more Children | 0 (0.0%) | 0 (0.0%) |
| Total | 165 (60.4%) | 108 (39.6%) |
Income Below Poverty Among Single-Parent Households in Maria Antonia
According to the poverty data in Maria Antonia, 33.0% or 32 single-father households and 100.0% or 17 single-mother households are living below the poverty line. Among single-father households, those with 1 or 2 children have the highest poverty rate, with 32 households (43.8%) experiencing poverty. Likewise, among single-mother households, those with 1 or 2 children have the highest poverty rate, with 17 households (100.0%) falling below the poverty line.
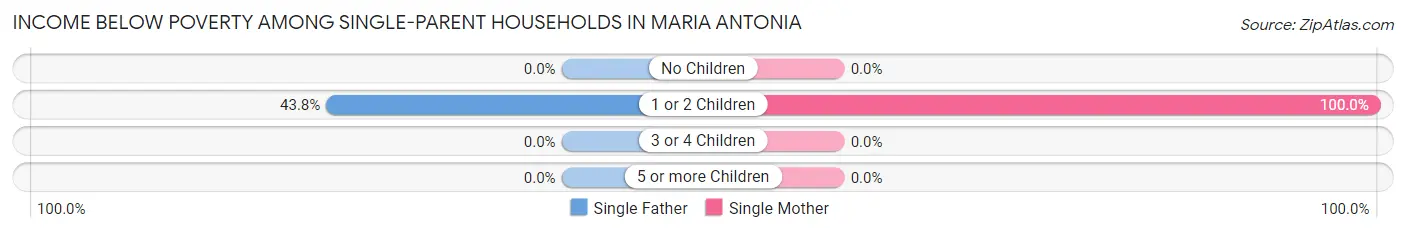
| Children | Single Father | Single Mother |
| No Children | 0 (0.0%) | 0 (0.0%) |
| 1 or 2 Children | 32 (43.8%) | 17 (100.0%) |
| 3 or 4 Children | 0 (0.0%) | 0 (0.0%) |
| 5 or more Children | 0 (0.0%) | 0 (0.0%) |
| Total | 32 (33.0%) | 17 (100.0%) |
Income Below Poverty Among Married-Couple vs Single-Parent Households in Maria Antonia
The poverty data for Maria Antonia shows that 108 of the married-couple family households (39.6%) and 49 of the single-parent households (43.0%) are living below the poverty level. Within the married-couple family households, those with 1 or 2 children have the highest poverty rate, with 40 households (57.1%) falling below the poverty line. Among the single-parent households, those with 1 or 2 children have the highest poverty rate, with 49 household (54.4%) living below poverty.
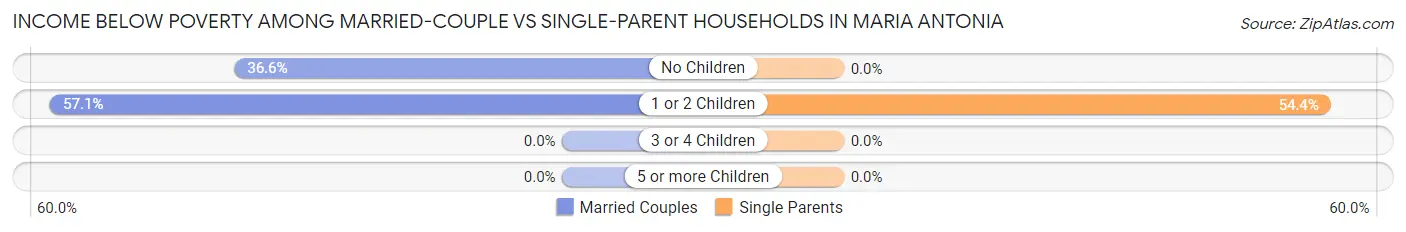
| Children | Married-Couple Families | Single-Parent Households |
| No Children | 68 (36.6%) | 0 (0.0%) |
| 1 or 2 Children | 40 (57.1%) | 49 (54.4%) |
| 3 or 4 Children | 0 (0.0%) | 0 (0.0%) |
| 5 or more Children | 0 (0.0%) | 0 (0.0%) |
| Total | 108 (39.6%) | 49 (43.0%) |
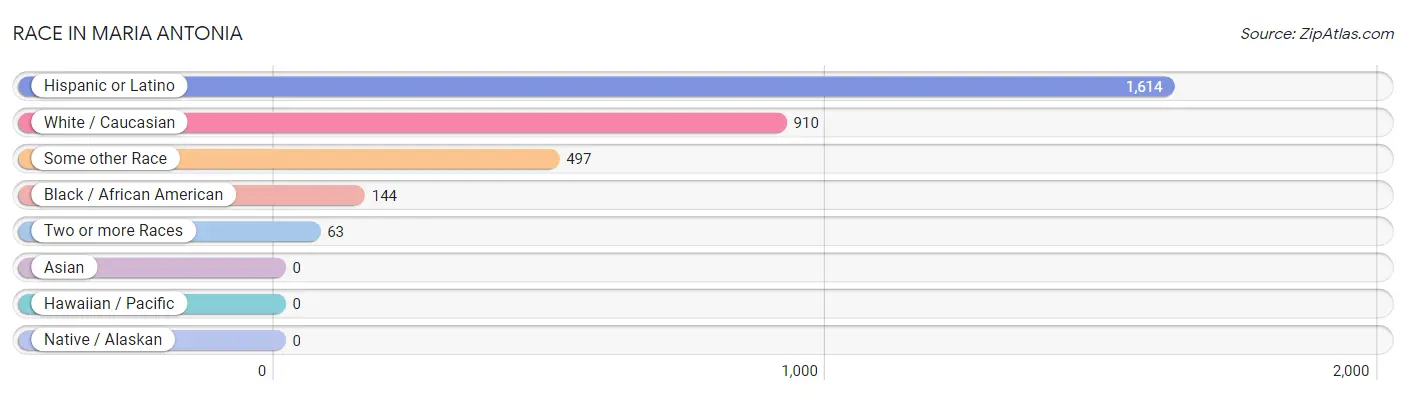
Race in Maria Antonia
The most populous races in Maria Antonia are Hispanic or Latino (1,614 | 100.0%), White / Caucasian (910 | 56.4%), and Some other Race (497 | 30.8%).
| Race | # Population | % Population |
| Asian | 0 | 0.0% |
| Black / African American | 144 | 8.9% |
| Hawaiian / Pacific | 0 | 0.0% |
| Hispanic or Latino | 1,614 | 100.0% |
| Native / Alaskan | 0 | 0.0% |
| White / Caucasian | 910 | 56.4% |
| Two or more Races | 63 | 3.9% |
| Some other Race | 497 | 30.8% |
| Total | 1,614 | 100.0% |
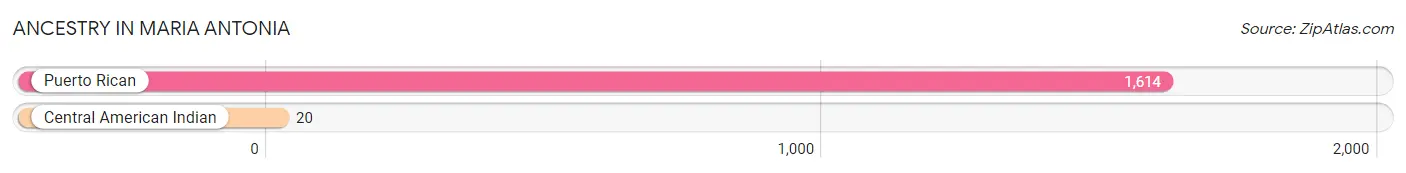
Ancestry in Maria Antonia
The most populous ancestries reported in Maria Antonia are Puerto Rican (1,614 | 100.0%), and Central American Indian (20 | 1.2%), together accounting for 101.2% of all Maria Antonia residents.
| Ancestry | # Population | % Population |
| Central American Indian | 20 | 1.2% |
| Puerto Rican | 1,614 | 100.0% | View All 2 Rows |
Immigrants in Maria Antonia

| Immigration Origin | # Population | % Population | View All 0 Rows |
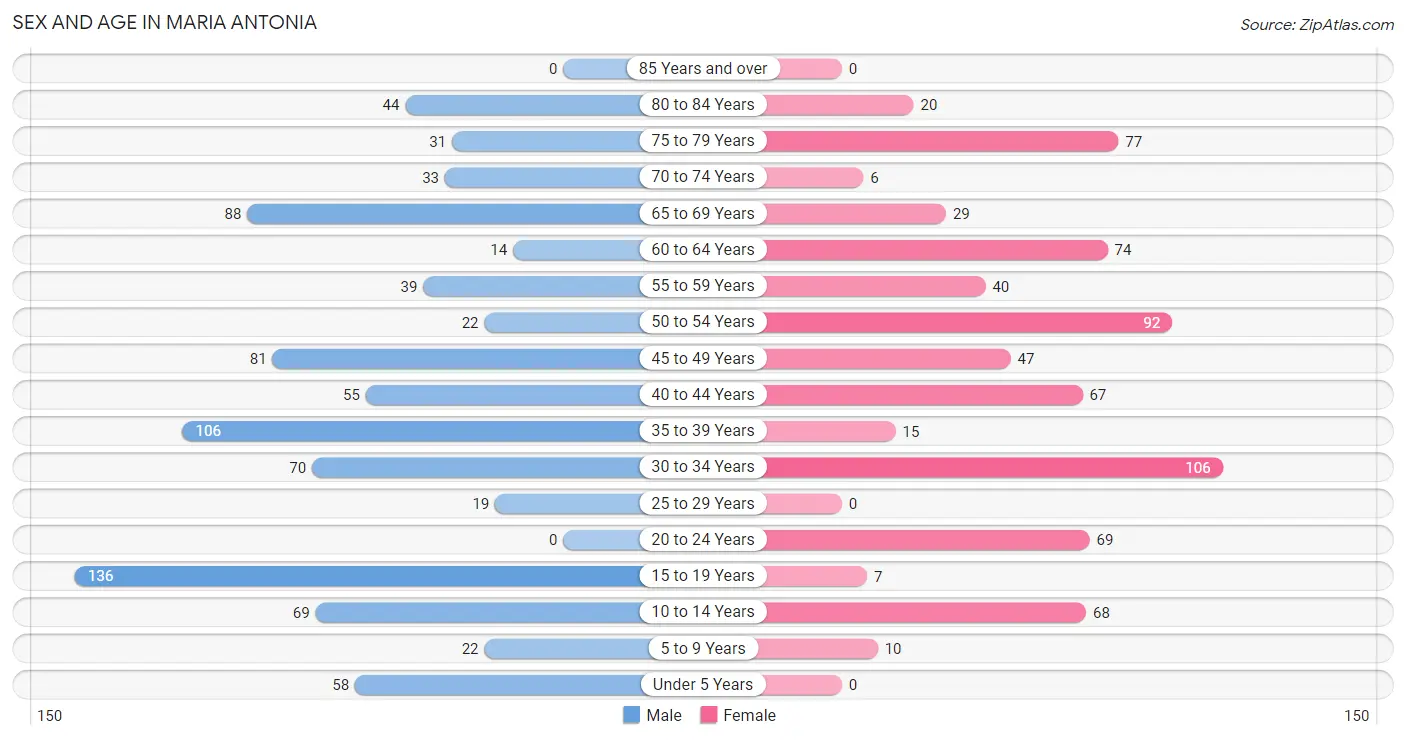
Sex and Age in Maria Antonia
Sex and Age in Maria Antonia
The most populous age groups in Maria Antonia are 15 to 19 Years (136 | 15.3%) for men and 30 to 34 Years (106 | 14.6%) for women.
| Age Bracket | Male | Female |
| Under 5 Years | 58 (6.5%) | 0 (0.0%) |
| 5 to 9 Years | 22 (2.5%) | 10 (1.4%) |
| 10 to 14 Years | 69 (7.8%) | 68 (9.3%) |
| 15 to 19 Years | 136 (15.3%) | 7 (1.0%) |
| 20 to 24 Years | 0 (0.0%) | 69 (9.5%) |
| 25 to 29 Years | 19 (2.1%) | 0 (0.0%) |
| 30 to 34 Years | 70 (7.9%) | 106 (14.6%) |
| 35 to 39 Years | 106 (11.9%) | 15 (2.1%) |
| 40 to 44 Years | 55 (6.2%) | 67 (9.2%) |
| 45 to 49 Years | 81 (9.1%) | 47 (6.5%) |
| 50 to 54 Years | 22 (2.5%) | 92 (12.7%) |
| 55 to 59 Years | 39 (4.4%) | 40 (5.5%) |
| 60 to 64 Years | 14 (1.6%) | 74 (10.2%) |
| 65 to 69 Years | 88 (9.9%) | 29 (4.0%) |
| 70 to 74 Years | 33 (3.7%) | 6 (0.8%) |
| 75 to 79 Years | 31 (3.5%) | 77 (10.6%) |
| 80 to 84 Years | 44 (5.0%) | 20 (2.8%) |
| 85 Years and over | 0 (0.0%) | 0 (0.0%) |
| Total | 887 (100.0%) | 727 (100.0%) |
Families and Households in Maria Antonia
Median Family Size in Maria Antonia
The median family size in Maria Antonia is 3.07 persons per family, with married-couple families (273 | 70.5%) accounting for the largest median family size of 3.39 persons per family. On the other hand, single female/mother families (17 | 4.4%) represent the smallest median family size with 1.94 persons per family.
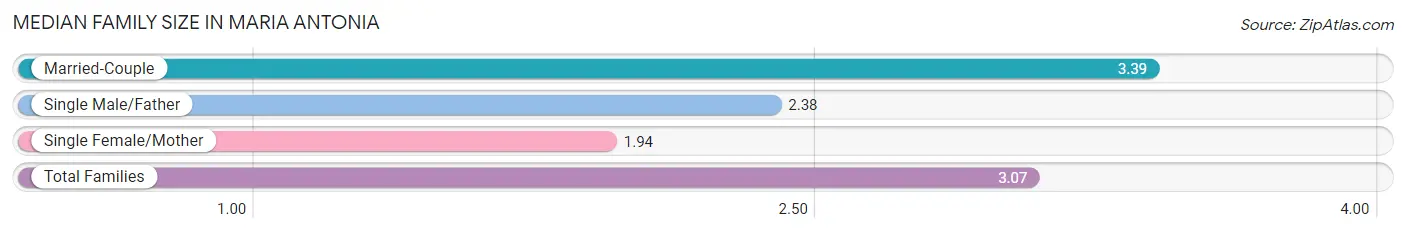
| Family Type | # Families | Family Size |
| Married-Couple | 273 (70.5%) | 3.39 |
| Single Male/Father | 97 (25.1%) | 2.38 |
| Single Female/Mother | 17 (4.4%) | 1.94 |
| Total Families | 387 (100.0%) | 3.07 |
Median Household Size in Maria Antonia
The median household size in Maria Antonia is 2.37 persons per household, with married-couple households (273 | 40.1%) accounting for the largest median household size of 3.39 persons per household. non-family households (294 | 43.2%) represent the smallest median household size with 1.09 persons per household.
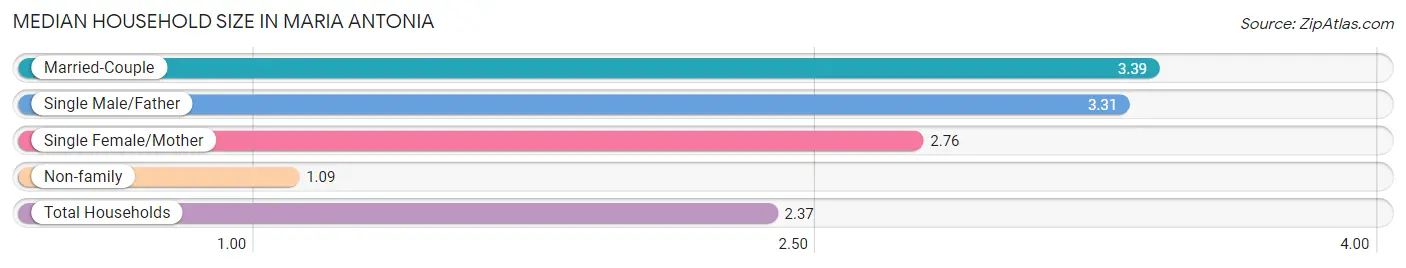
| Household Type | # Households | Household Size |
| Married-Couple | 273 (40.1%) | 3.39 |
| Single Male/Father | 97 (14.2%) | 3.31 |
| Single Female/Mother | 17 (2.5%) | 2.76 |
| Non-family | 294 (43.2%) | 1.09 |
| Total Households | 681 (100.0%) | 2.37 |
Household Size by Marriage Status in Maria Antonia
Out of a total of 681 households in Maria Antonia, 387 (56.8%) are family households, while 294 (43.2%) are nonfamily households. The most numerous type of family households are 2-person households, comprising 169, and the most common type of nonfamily households are 1-person households, comprising 278.
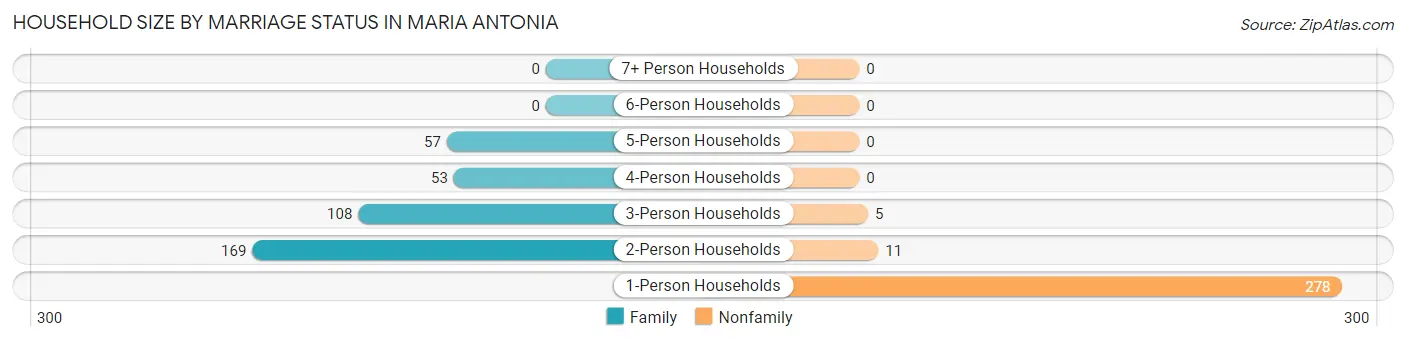
| Household Size | Family Households | Nonfamily Households |
| 1-Person Households | - | 278 (40.8%) |
| 2-Person Households | 169 (24.8%) | 11 (1.6%) |
| 3-Person Households | 108 (15.9%) | 5 (0.7%) |
| 4-Person Households | 53 (7.8%) | 0 (0.0%) |
| 5-Person Households | 57 (8.4%) | 0 (0.0%) |
| 6-Person Households | 0 (0.0%) | 0 (0.0%) |
| 7+ Person Households | 0 (0.0%) | 0 (0.0%) |
| Total | 387 (56.8%) | 294 (43.2%) |
Female Fertility in Maria Antonia
Fertility by Age in Maria Antonia
Average fertility rate in Maria Antonia is 73.0 births per 1,000 women. Women in the age bracket of 20 to 34 years have the highest fertility rate with 160.0 births per 1,000 women. Women in the age bracket of 20 to 34 years acount for 100.0% of all women with births.
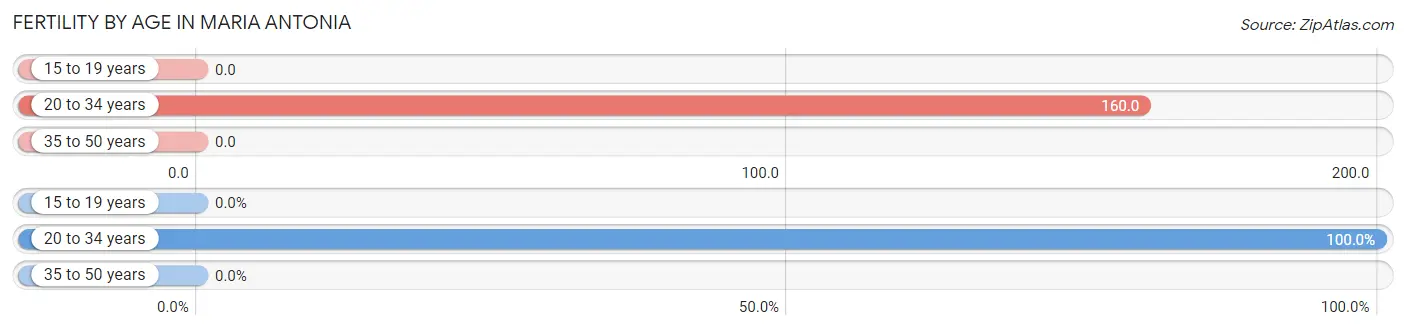
| Age Bracket | Women with Births | Births / 1,000 Women |
| 15 to 19 years | 0 (0.0%) | 0.0 |
| 20 to 34 years | 28 (100.0%) | 160.0 |
| 35 to 50 years | 0 (0.0%) | 0.0 |
| Total | 28 (100.0%) | 73.0 |
Fertility by Age by Marriage Status in Maria Antonia
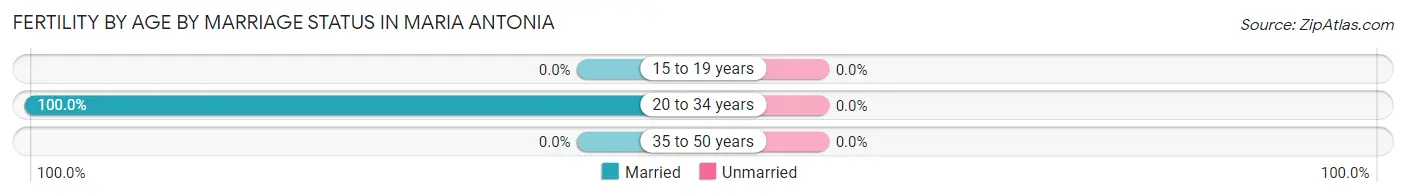
| Age Bracket | Married | Unmarried |
| 15 to 19 years | 0 (0.0%) | 0 (0.0%) |
| 20 to 34 years | 28 (100.0%) | 0 (0.0%) |
| 35 to 50 years | 0 (0.0%) | 0 (0.0%) |
| Total | 28 (100.0%) | 0 (0.0%) |
Fertility by Education in Maria Antonia
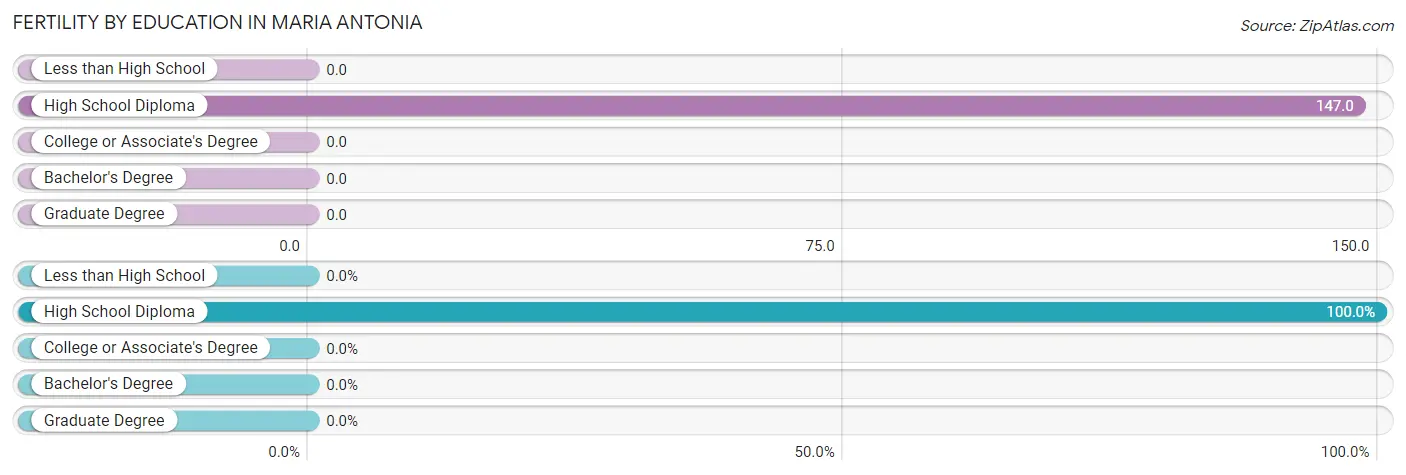
| Educational Attainment | Women with Births | Births / 1,000 Women |
| Less than High School | 0 (0.0%) | 0.0 |
| High School Diploma | 28 (100.0%) | 147.0 |
| College or Associate's Degree | 0 (0.0%) | 0.0 |
| Bachelor's Degree | 0 (0.0%) | 0.0 |
| Graduate Degree | 0 (0.0%) | 0.0 |
| Total | 28 (100.0%) | 73.0 |
Fertility by Education by Marriage Status in Maria Antonia
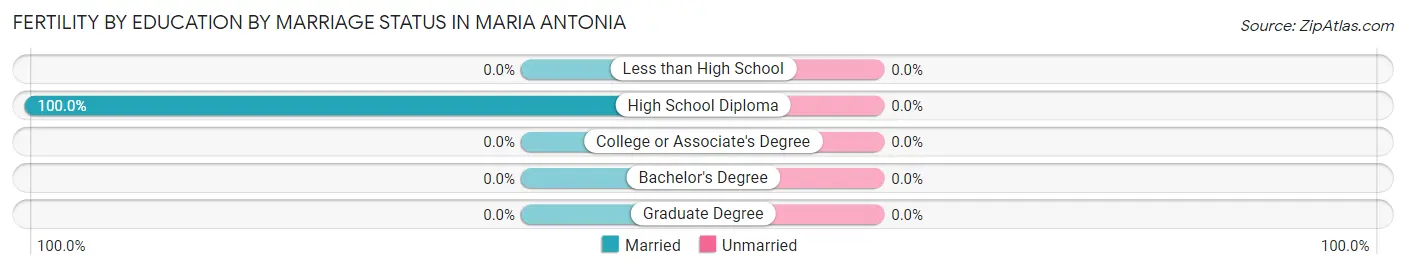
| Educational Attainment | Married | Unmarried |
| Less than High School | 0 (0.0%) | 0 (0.0%) |
| High School Diploma | 28 (100.0%) | 0 (0.0%) |
| College or Associate's Degree | 0 (0.0%) | 0 (0.0%) |
| Bachelor's Degree | 0 (0.0%) | 0 (0.0%) |
| Graduate Degree | 0 (0.0%) | 0 (0.0%) |
| Total | 28 (100.0%) | 0 (0.0%) |
Employment Characteristics in Maria Antonia
Employment by Class of Employer in Maria Antonia
Among the 562 employed individuals in Maria Antonia, private company employees (356 | 63.3%), state government employees (183 | 32.6%), and local government employees (23 | 4.1%) make up the most common classes of employment.
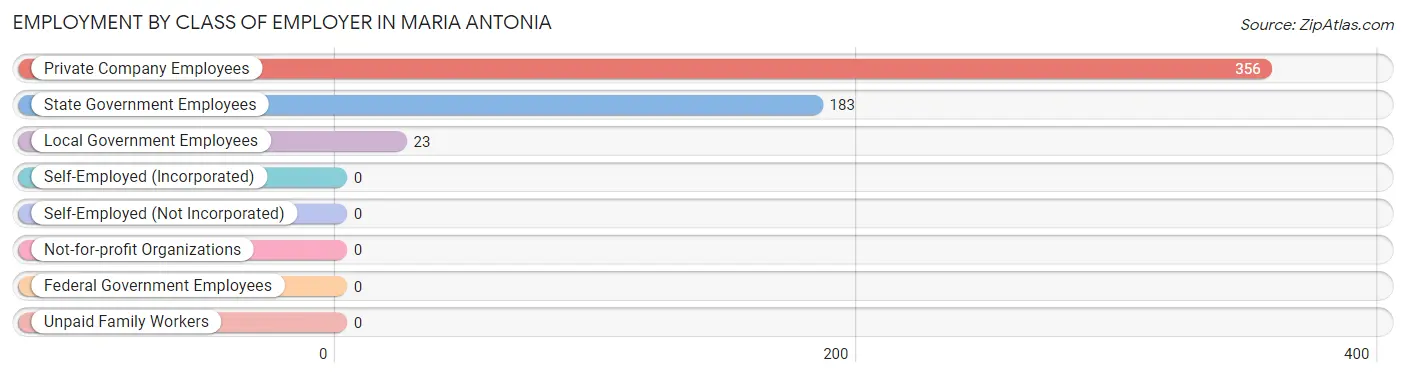
| Employer Class | # Employees | % Employees |
| Private Company Employees | 356 | 63.3% |
| Self-Employed (Incorporated) | 0 | 0.0% |
| Self-Employed (Not Incorporated) | 0 | 0.0% |
| Not-for-profit Organizations | 0 | 0.0% |
| Local Government Employees | 23 | 4.1% |
| State Government Employees | 183 | 32.6% |
| Federal Government Employees | 0 | 0.0% |
| Unpaid Family Workers | 0 | 0.0% |
| Total | 562 | 100.0% |
Employment Status by Age in Maria Antonia
According to the labor force statistics for Maria Antonia, out of the total population over 16 years of age (1,354), 49.3% or 668 individuals are in the labor force, with 11.2% or 75 of them unemployed. The age group with the highest labor force participation rate is 25 to 29 years, with 100.0% or 19 individuals in the labor force. Within the labor force, the 16 to 19 years age range has the highest percentage of unemployed individuals, with 100.0% or 53 of them being unemployed.
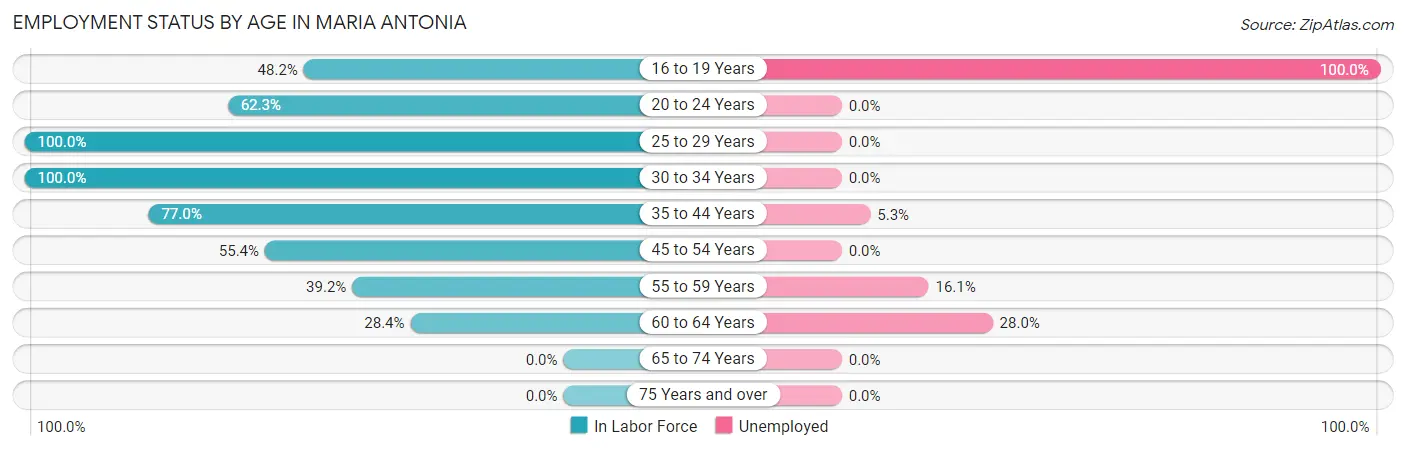
| Age Bracket | In Labor Force | Unemployed |
| 16 to 19 Years | 53 (48.2%) | 53 (100.0%) |
| 20 to 24 Years | 43 (62.3%) | 0 (0.0%) |
| 25 to 29 Years | 19 (100.0%) | 0 (0.0%) |
| 30 to 34 Years | 176 (100.0%) | 0 (0.0%) |
| 35 to 44 Years | 187 (77.0%) | 10 (5.3%) |
| 45 to 54 Years | 134 (55.4%) | 0 (0.0%) |
| 55 to 59 Years | 31 (39.2%) | 5 (16.1%) |
| 60 to 64 Years | 25 (28.4%) | 7 (28.0%) |
| 65 to 74 Years | 0 (0.0%) | 0 (0.0%) |
| 75 Years and over | 0 (0.0%) | 0 (0.0%) |
| Total | 668 (49.3%) | 75 (11.2%) |
Employment Status by Educational Attainment in Maria Antonia
According to labor force statistics for Maria Antonia, 67.5% of individuals (572) out of the total population between 25 and 64 years of age (847) are in the labor force, with 3.8% or 22 of them being unemployed. The group with the highest labor force participation rate are those with the educational attainment of bachelor's degree or higher, with 86.1% or 118 individuals in the labor force. Within the labor force, individuals with college / associate degree education have the highest percentage of unemployment, with 5.1% or 10 of them being unemployed.
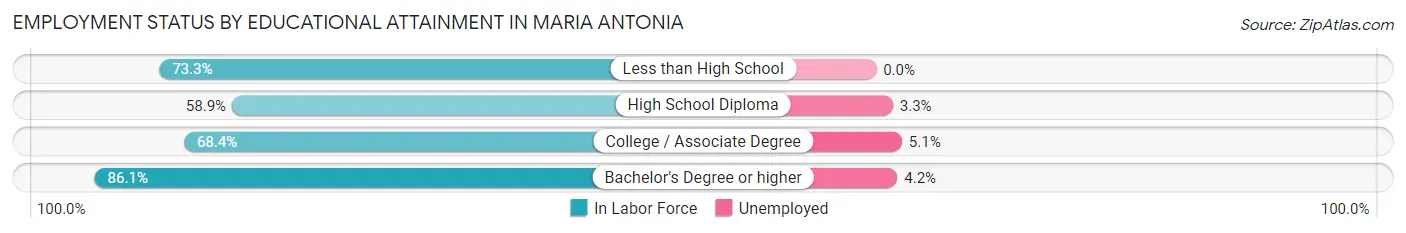
| Educational Attainment | In Labor Force | Unemployed |
| Less than High School | 44 (73.3%) | 0 (0.0%) |
| High School Diploma | 215 (58.9%) | 12 (3.3%) |
| College / Associate Degree | 195 (68.4%) | 15 (5.1%) |
| Bachelor's Degree or higher | 118 (86.1%) | 6 (4.2%) |
| Total | 572 (67.5%) | 32 (3.8%) |
Employment Occupations by Sex in Maria Antonia
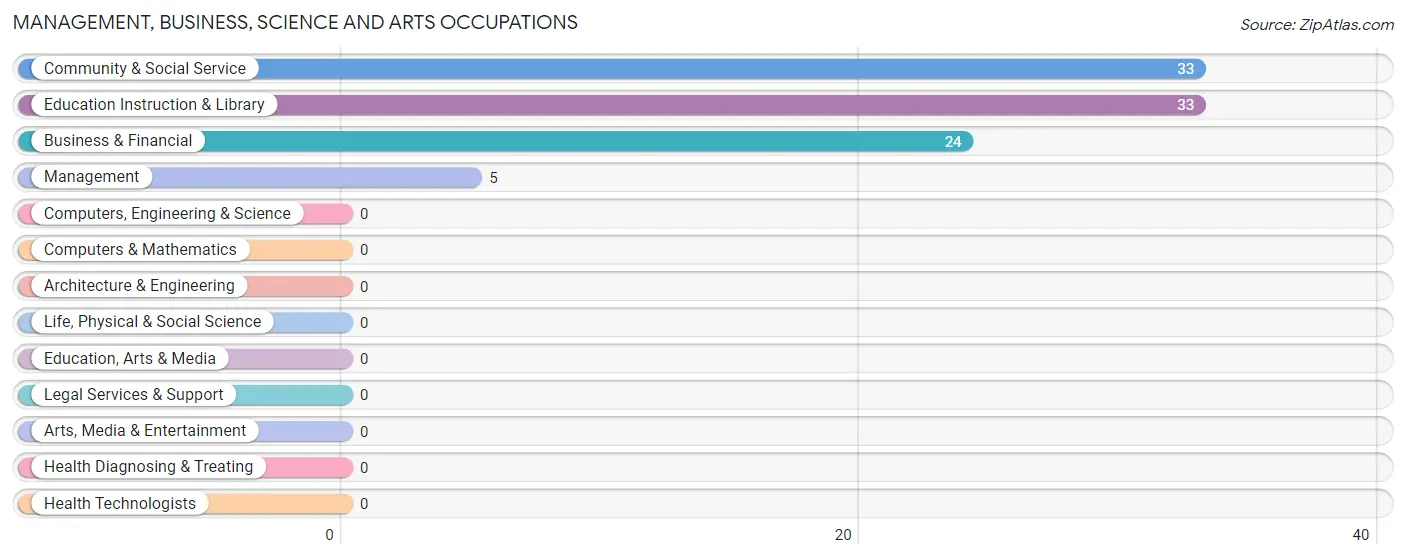
Management, Business, Science and Arts Occupations
The most common Management, Business, Science and Arts occupations in Maria Antonia are Community & Social Service (33 | 5.6%), Education Instruction & Library (33 | 5.6%), Business & Financial (24 | 4.1%), and Management (5 | 0.8%).
Management, Business, Science and Arts Occupations by Sex
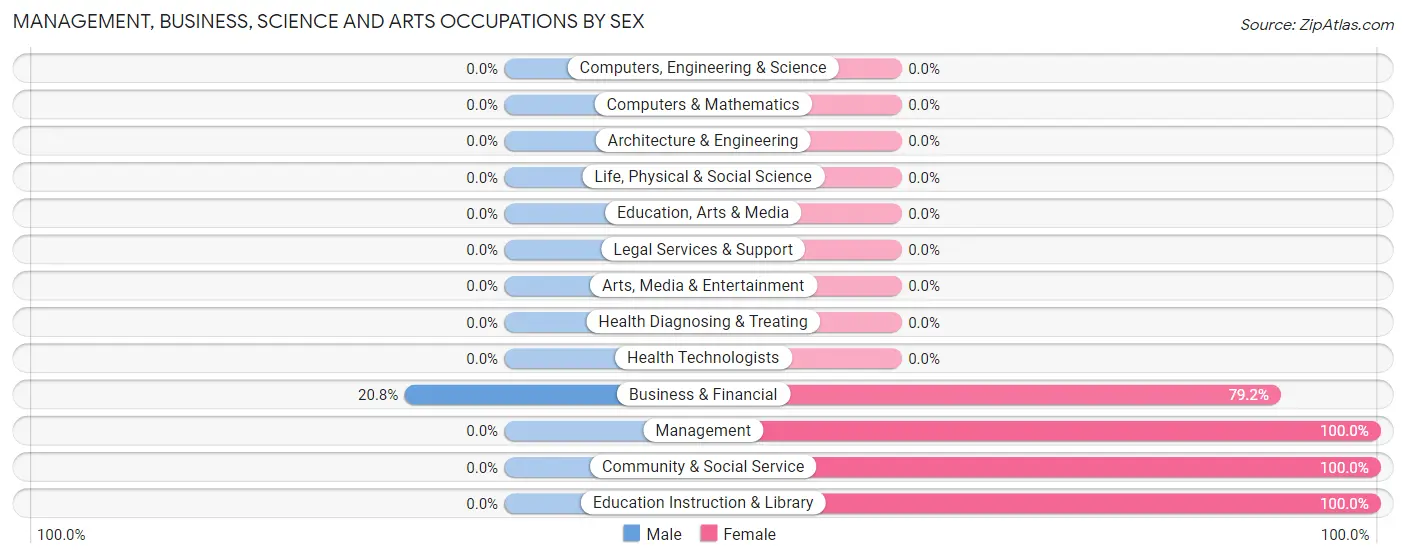
| Occupation | Male | Female |
| Management | 0 (0.0%) | 5 (100.0%) |
| Business & Financial | 5 (20.8%) | 19 (79.2%) |
| Computers, Engineering & Science | 0 (0.0%) | 0 (0.0%) |
| Computers & Mathematics | 0 (0.0%) | 0 (0.0%) |
| Architecture & Engineering | 0 (0.0%) | 0 (0.0%) |
| Life, Physical & Social Science | 0 (0.0%) | 0 (0.0%) |
| Community & Social Service | 0 (0.0%) | 33 (100.0%) |
| Education, Arts & Media | 0 (0.0%) | 0 (0.0%) |
| Legal Services & Support | 0 (0.0%) | 0 (0.0%) |
| Education Instruction & Library | 0 (0.0%) | 33 (100.0%) |
| Arts, Media & Entertainment | 0 (0.0%) | 0 (0.0%) |
| Health Diagnosing & Treating | 0 (0.0%) | 0 (0.0%) |
| Health Technologists | 0 (0.0%) | 0 (0.0%) |
| Total (Category) | 5 (8.1%) | 57 (91.9%) |
| Total (Overall) | 281 (47.4%) | 312 (52.6%) |
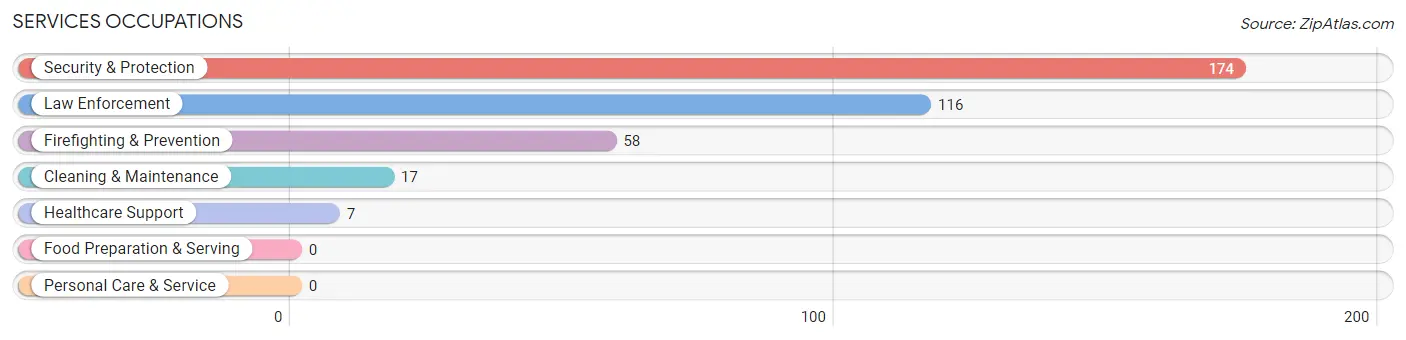
Services Occupations
The most common Services occupations in Maria Antonia are Security & Protection (174 | 29.3%), Law Enforcement (116 | 19.6%), Firefighting & Prevention (58 | 9.8%), Cleaning & Maintenance (17 | 2.9%), and Healthcare Support (7 | 1.2%).
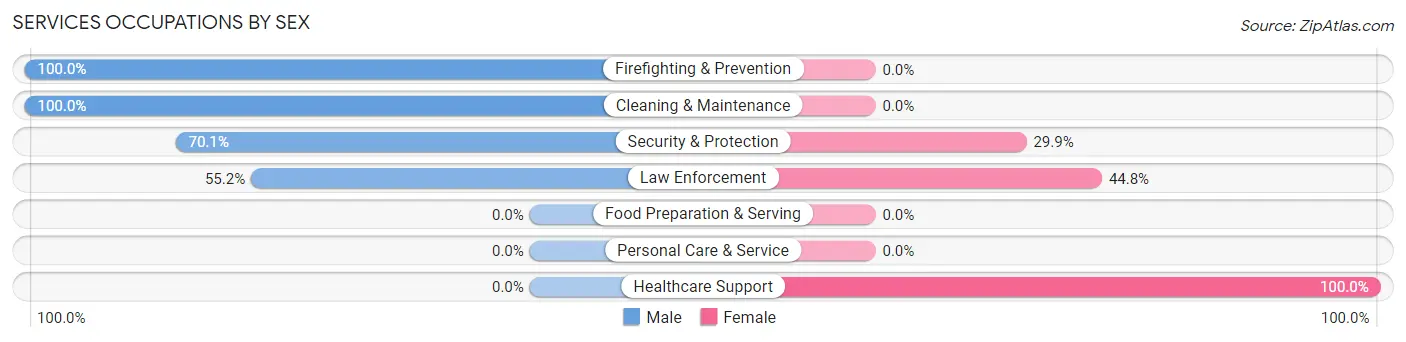
Services Occupations by Sex
Within the Services occupations in Maria Antonia, the most male-oriented occupations are Firefighting & Prevention (100.0%), Cleaning & Maintenance (100.0%), and Security & Protection (70.1%), while the most female-oriented occupations are Healthcare Support (100.0%), Law Enforcement (44.8%), and Security & Protection (29.9%).
| Occupation | Male | Female |
| Healthcare Support | 0 (0.0%) | 7 (100.0%) |
| Security & Protection | 122 (70.1%) | 52 (29.9%) |
| Firefighting & Prevention | 58 (100.0%) | 0 (0.0%) |
| Law Enforcement | 64 (55.2%) | 52 (44.8%) |
| Food Preparation & Serving | 0 (0.0%) | 0 (0.0%) |
| Cleaning & Maintenance | 17 (100.0%) | 0 (0.0%) |
| Personal Care & Service | 0 (0.0%) | 0 (0.0%) |
| Total (Category) | 139 (70.2%) | 59 (29.8%) |
| Total (Overall) | 281 (47.4%) | 312 (52.6%) |
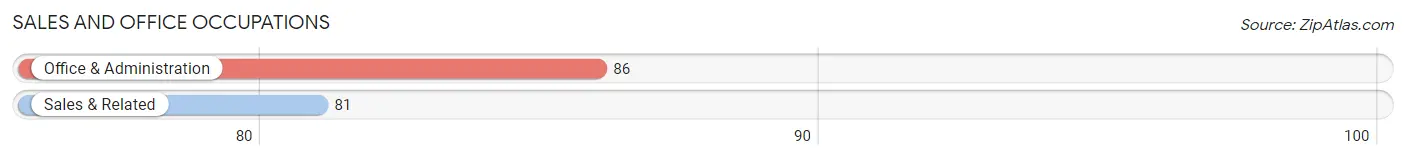
Sales and Office Occupations
The most common Sales and Office occupations in Maria Antonia are Office & Administration (86 | 14.5%), and Sales & Related (81 | 13.7%).
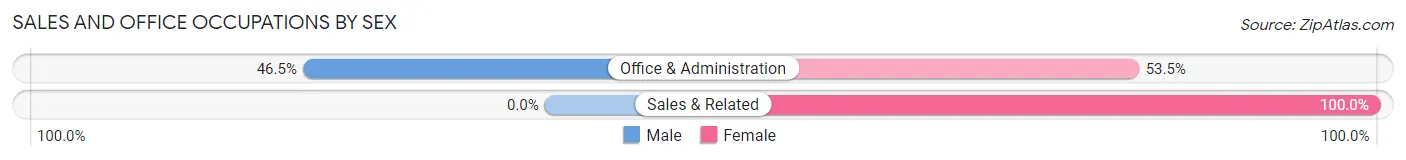
Sales and Office Occupations by Sex
| Occupation | Male | Female |
| Sales & Related | 0 (0.0%) | 81 (100.0%) |
| Office & Administration | 40 (46.5%) | 46 (53.5%) |
| Total (Category) | 40 (23.9%) | 127 (76.0%) |
| Total (Overall) | 281 (47.4%) | 312 (52.6%) |
Natural Resources, Construction and Maintenance Occupations
Natural Resources, Construction and Maintenance Occupations by Sex
| Occupation | Male | Female |
| Farming, Fishing & Forestry | 0 (0.0%) | 0 (0.0%) |
| Construction & Extraction | 0 (0.0%) | 0 (0.0%) |
| Installation, Maintenance & Repair | 0 (0.0%) | 0 (0.0%) |
| Total (Category) | 0 (0.0%) | 0 (0.0%) |
| Total (Overall) | 281 (47.4%) | 312 (52.6%) |
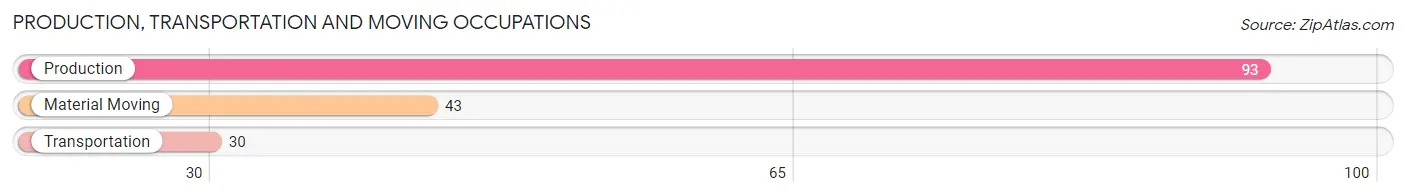
Production, Transportation and Moving Occupations
The most common Production, Transportation and Moving occupations in Maria Antonia are Production (93 | 15.7%), Material Moving (43 | 7.2%), and Transportation (30 | 5.1%).
Production, Transportation and Moving Occupations by Sex
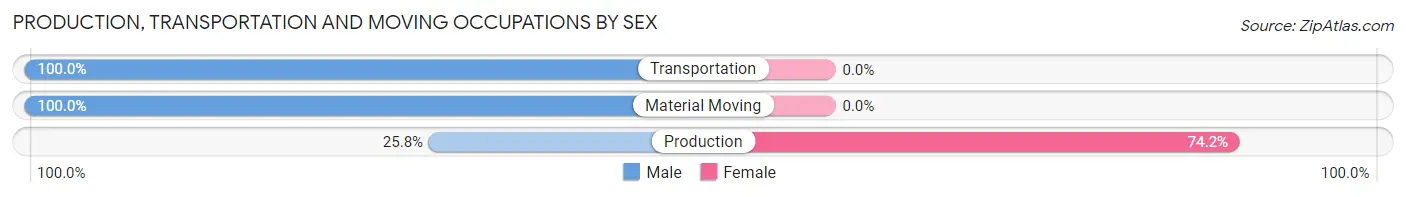
| Occupation | Male | Female |
| Production | 24 (25.8%) | 69 (74.2%) |
| Transportation | 30 (100.0%) | 0 (0.0%) |
| Material Moving | 43 (100.0%) | 0 (0.0%) |
| Total (Category) | 97 (58.4%) | 69 (41.6%) |
| Total (Overall) | 281 (47.4%) | 312 (52.6%) |
Employment Industries by Sex in Maria Antonia
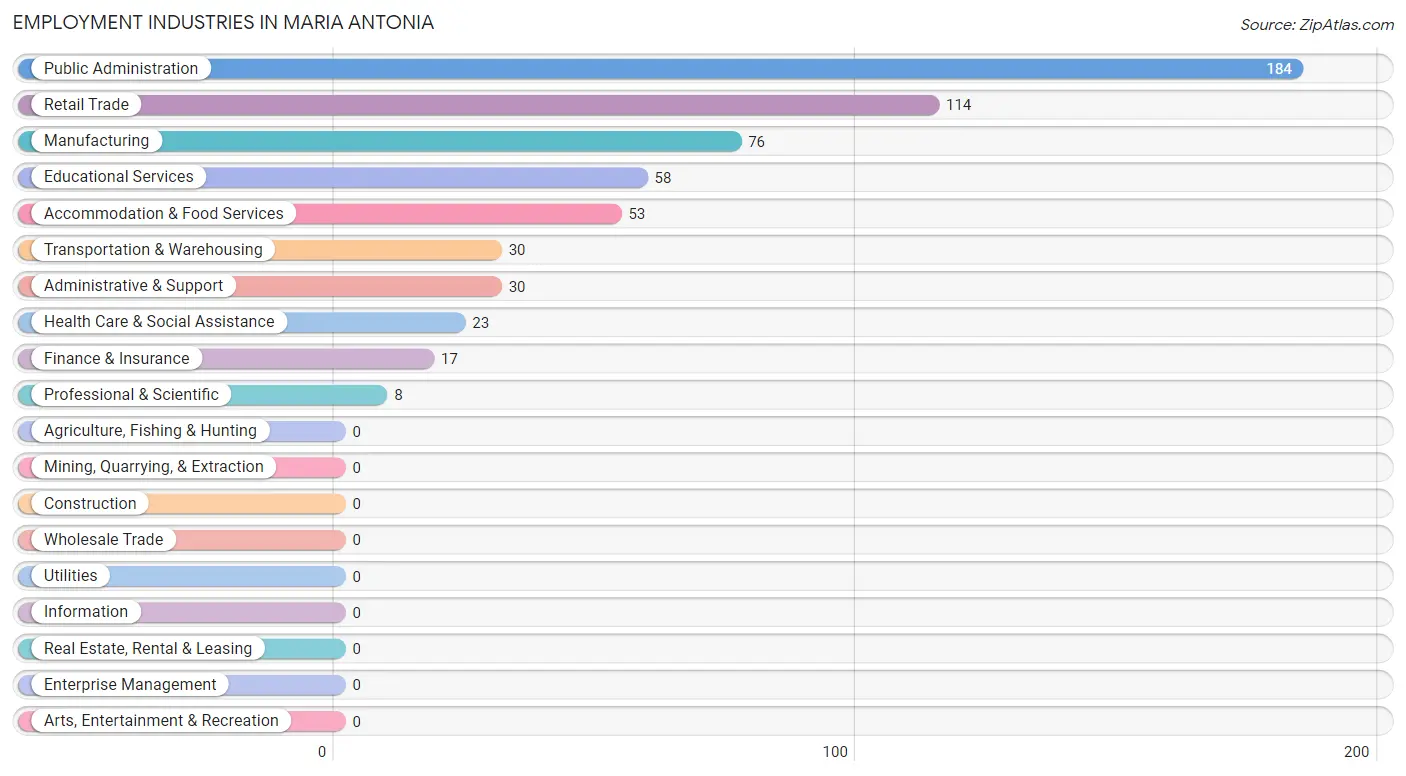
Employment Industries in Maria Antonia
The major employment industries in Maria Antonia include Public Administration (184 | 31.0%), Retail Trade (114 | 19.2%), Manufacturing (76 | 12.8%), Educational Services (58 | 9.8%), and Accommodation & Food Services (53 | 8.9%).
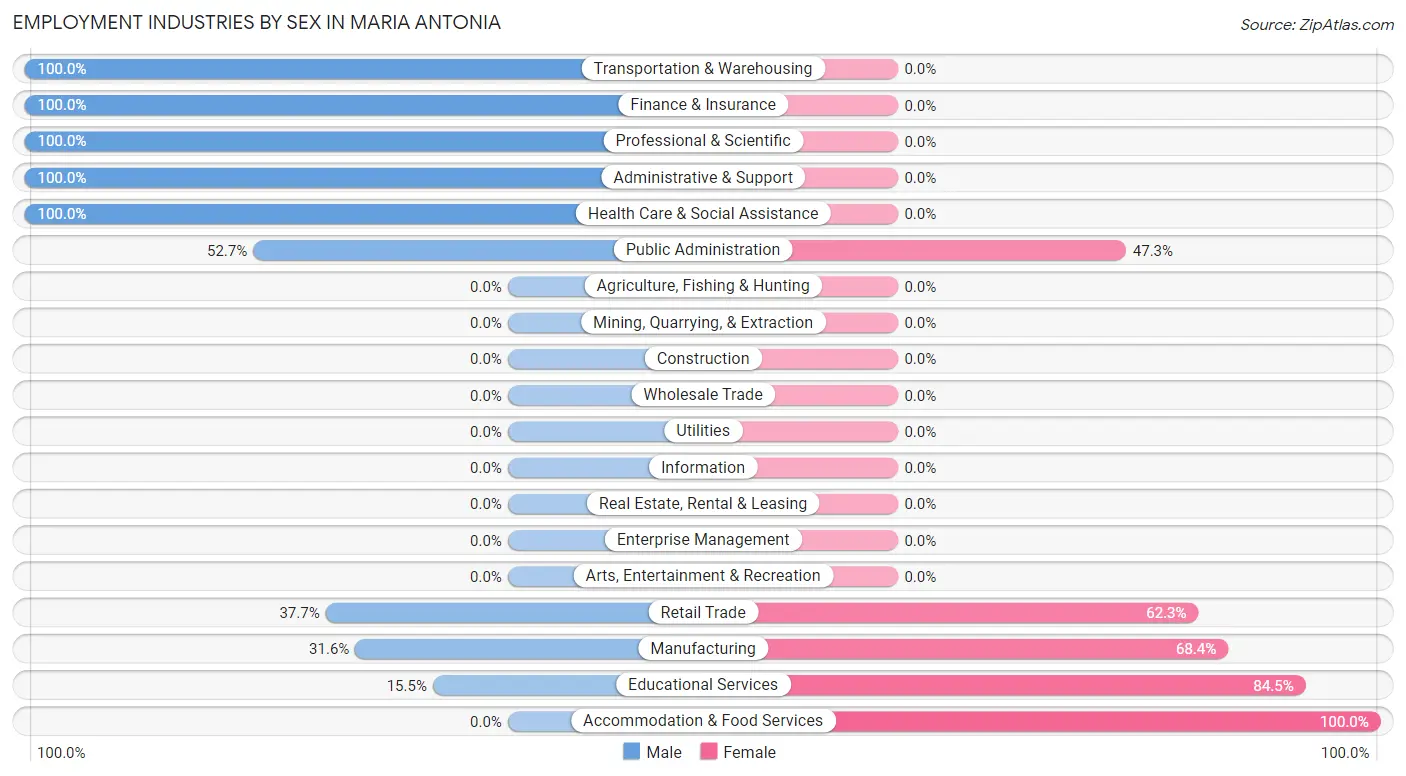
Employment Industries by Sex in Maria Antonia
The Maria Antonia industries that see more men than women are Transportation & Warehousing (100.0%), Finance & Insurance (100.0%), and Professional & Scientific (100.0%), whereas the industries that tend to have a higher number of women are Accommodation & Food Services (100.0%), Educational Services (84.5%), and Manufacturing (68.4%).
| Industry | Male | Female |
| Agriculture, Fishing & Hunting | 0 (0.0%) | 0 (0.0%) |
| Mining, Quarrying, & Extraction | 0 (0.0%) | 0 (0.0%) |
| Construction | 0 (0.0%) | 0 (0.0%) |
| Manufacturing | 24 (31.6%) | 52 (68.4%) |
| Wholesale Trade | 0 (0.0%) | 0 (0.0%) |
| Retail Trade | 43 (37.7%) | 71 (62.3%) |
| Transportation & Warehousing | 30 (100.0%) | 0 (0.0%) |
| Utilities | 0 (0.0%) | 0 (0.0%) |
| Information | 0 (0.0%) | 0 (0.0%) |
| Finance & Insurance | 17 (100.0%) | 0 (0.0%) |
| Real Estate, Rental & Leasing | 0 (0.0%) | 0 (0.0%) |
| Professional & Scientific | 8 (100.0%) | 0 (0.0%) |
| Enterprise Management | 0 (0.0%) | 0 (0.0%) |
| Administrative & Support | 30 (100.0%) | 0 (0.0%) |
| Educational Services | 9 (15.5%) | 49 (84.5%) |
| Health Care & Social Assistance | 23 (100.0%) | 0 (0.0%) |
| Arts, Entertainment & Recreation | 0 (0.0%) | 0 (0.0%) |
| Accommodation & Food Services | 0 (0.0%) | 53 (100.0%) |
| Public Administration | 97 (52.7%) | 87 (47.3%) |
| Total | 281 (47.4%) | 312 (52.6%) |
Education in Maria Antonia
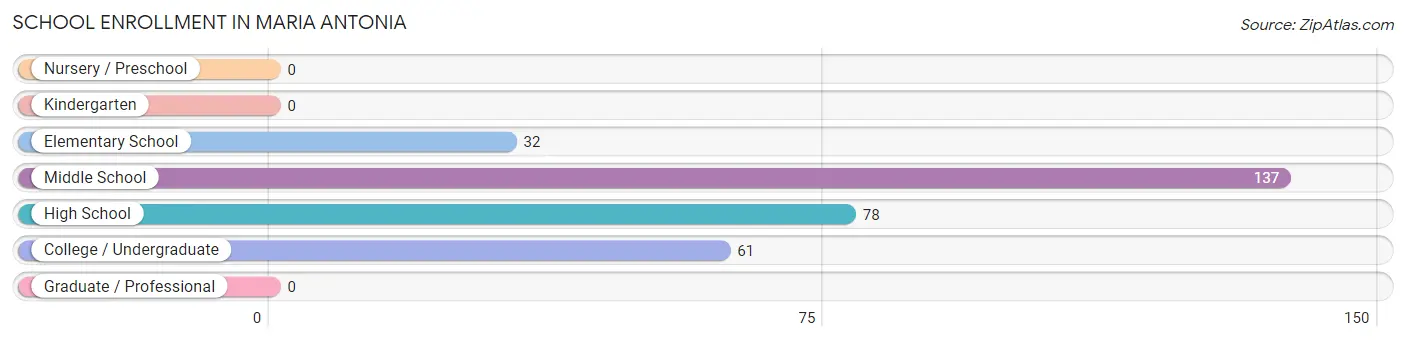
School Enrollment in Maria Antonia
The most common levels of schooling among the 308 students in Maria Antonia are middle school (137 | 44.5%), high school (78 | 25.3%), and college / undergraduate (61 | 19.8%).
| School Level | # Students | % Students |
| Nursery / Preschool | 0 | 0.0% |
| Kindergarten | 0 | 0.0% |
| Elementary School | 32 | 10.4% |
| Middle School | 137 | 44.5% |
| High School | 78 | 25.3% |
| College / Undergraduate | 61 | 19.8% |
| Graduate / Professional | 0 | 0.0% |
| Total | 308 | 100.0% |
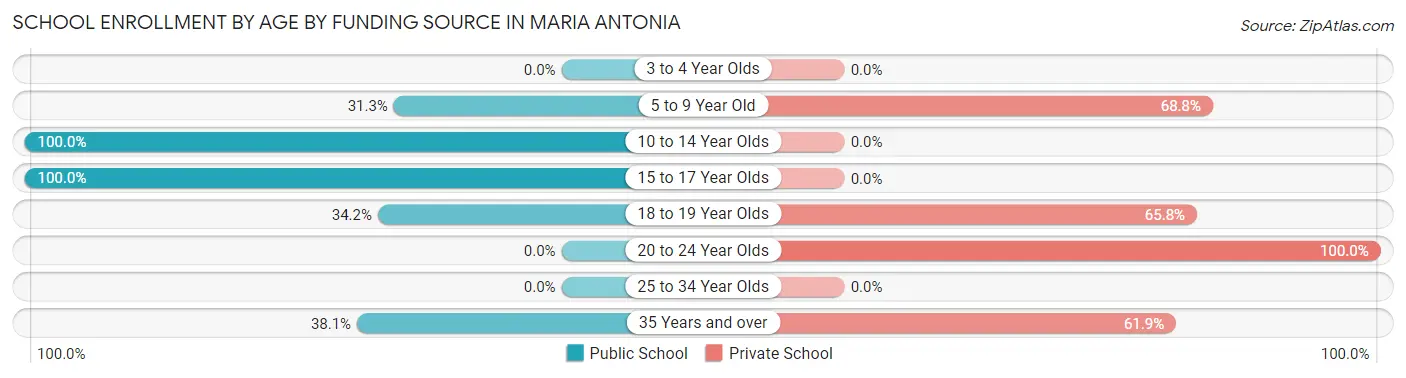
School Enrollment by Age by Funding Source in Maria Antonia
Out of a total of 308 students who are enrolled in schools in Maria Antonia, 75 (24.4%) attend a private institution, while the remaining 233 (75.6%) are enrolled in public schools. The age group of 20 to 24 year olds has the highest likelihood of being enrolled in private schools, with 15 (100.0% in the age bracket) enrolled. Conversely, the age group of 10 to 14 year olds has the lowest likelihood of being enrolled in a private school, with 137 (100.0% in the age bracket) attending a public institution.
| Age Bracket | Public School | Private School |
| 3 to 4 Year Olds | 0 (0.0%) | 0 (0.0%) |
| 5 to 9 Year Old | 10 (31.2%) | 22 (68.8%) |
| 10 to 14 Year Olds | 137 (100.0%) | 0 (0.0%) |
| 15 to 17 Year Olds | 65 (100.0%) | 0 (0.0%) |
| 18 to 19 Year Olds | 13 (34.2%) | 25 (65.8%) |
| 20 to 24 Year Olds | 0 (0.0%) | 15 (100.0%) |
| 25 to 34 Year Olds | 0 (0.0%) | 0 (0.0%) |
| 35 Years and over | 8 (38.1%) | 13 (61.9%) |
| Total | 233 (75.6%) | 75 (24.4%) |
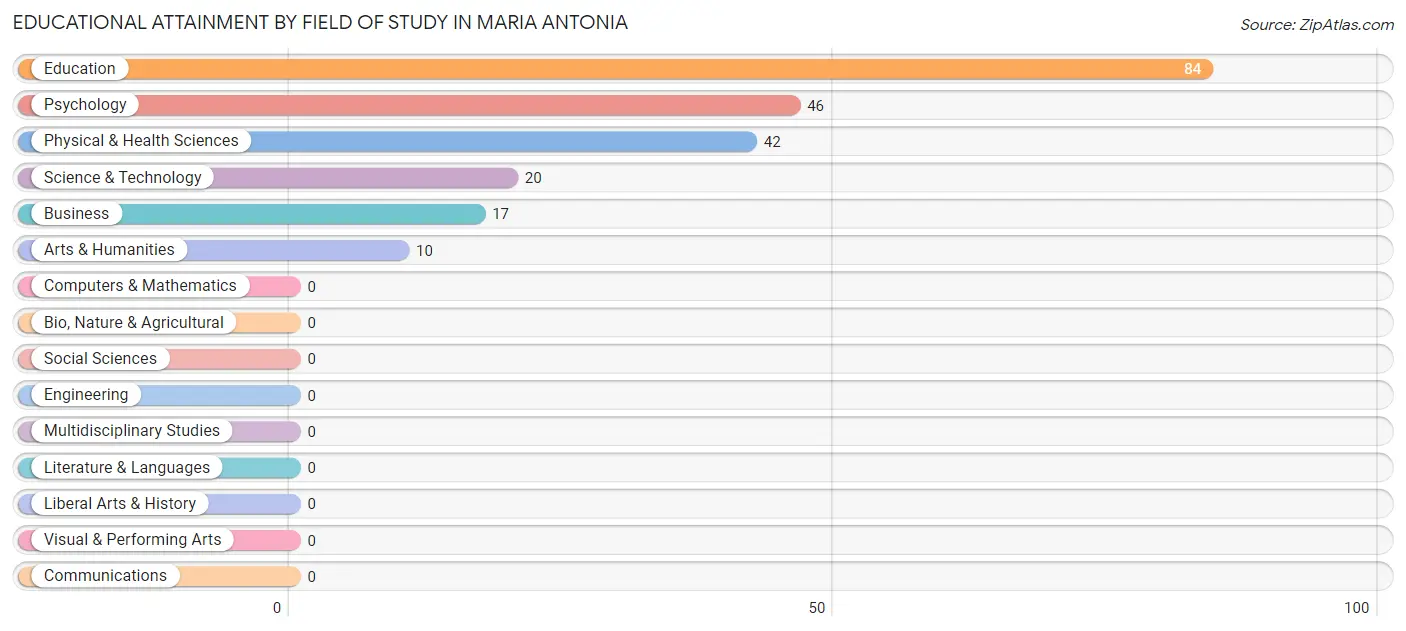
Educational Attainment by Field of Study in Maria Antonia
Education (84 | 38.4%), psychology (46 | 21.0%), physical & health sciences (42 | 19.2%), science & technology (20 | 9.1%), and business (17 | 7.8%) are the most common fields of study among 219 individuals in Maria Antonia who have obtained a bachelor's degree or higher.
| Field of Study | # Graduates | % Graduates |
| Computers & Mathematics | 0 | 0.0% |
| Bio, Nature & Agricultural | 0 | 0.0% |
| Physical & Health Sciences | 42 | 19.2% |
| Psychology | 46 | 21.0% |
| Social Sciences | 0 | 0.0% |
| Engineering | 0 | 0.0% |
| Multidisciplinary Studies | 0 | 0.0% |
| Science & Technology | 20 | 9.1% |
| Business | 17 | 7.8% |
| Education | 84 | 38.4% |
| Literature & Languages | 0 | 0.0% |
| Liberal Arts & History | 0 | 0.0% |
| Visual & Performing Arts | 0 | 0.0% |
| Communications | 0 | 0.0% |
| Arts & Humanities | 10 | 4.6% |
| Total | 219 | 100.0% |
Transportation & Commute in Maria Antonia
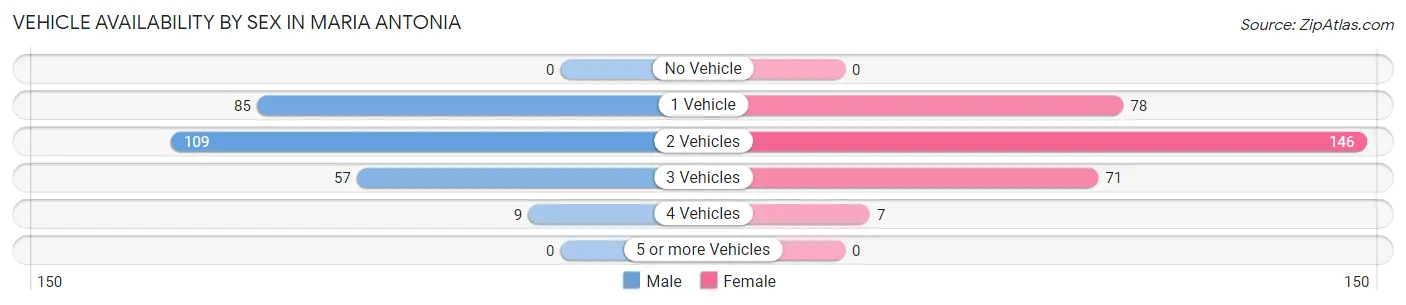
Vehicle Availability by Sex in Maria Antonia
The most prevalent vehicle ownership categories in Maria Antonia are males with 2 vehicles (109, accounting for 41.9%) and females with 2 vehicles (146, making up 36.1%).
| Vehicles Available | Male | Female |
| No Vehicle | 0 (0.0%) | 0 (0.0%) |
| 1 Vehicle | 85 (32.7%) | 78 (25.8%) |
| 2 Vehicles | 109 (41.9%) | 146 (48.3%) |
| 3 Vehicles | 57 (21.9%) | 71 (23.5%) |
| 4 Vehicles | 9 (3.5%) | 7 (2.3%) |
| 5 or more Vehicles | 0 (0.0%) | 0 (0.0%) |
| Total | 260 (100.0%) | 302 (100.0%) |
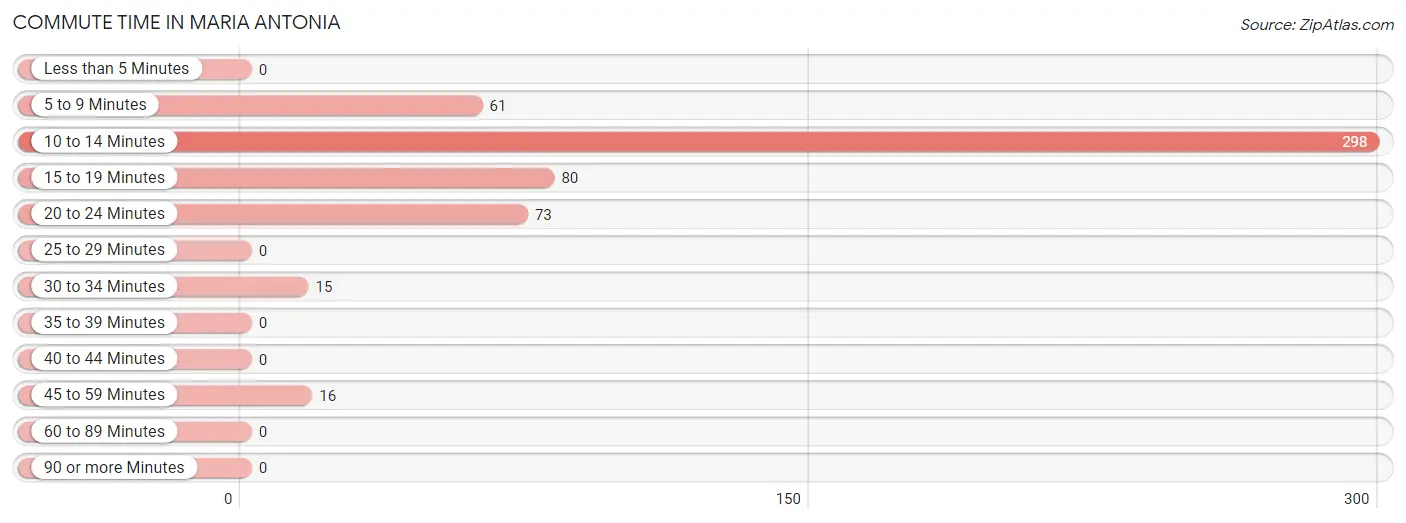
Commute Time in Maria Antonia
The most frequently occuring commute durations in Maria Antonia are 10 to 14 minutes (298 commuters, 54.9%), 15 to 19 minutes (80 commuters, 14.7%), and 20 to 24 minutes (73 commuters, 13.4%).
| Commute Time | # Commuters | % Commuters |
| Less than 5 Minutes | 0 | 0.0% |
| 5 to 9 Minutes | 61 | 11.2% |
| 10 to 14 Minutes | 298 | 54.9% |
| 15 to 19 Minutes | 80 | 14.7% |
| 20 to 24 Minutes | 73 | 13.4% |
| 25 to 29 Minutes | 0 | 0.0% |
| 30 to 34 Minutes | 15 | 2.8% |
| 35 to 39 Minutes | 0 | 0.0% |
| 40 to 44 Minutes | 0 | 0.0% |
| 45 to 59 Minutes | 16 | 2.9% |
| 60 to 89 Minutes | 0 | 0.0% |
| 90 or more Minutes | 0 | 0.0% |
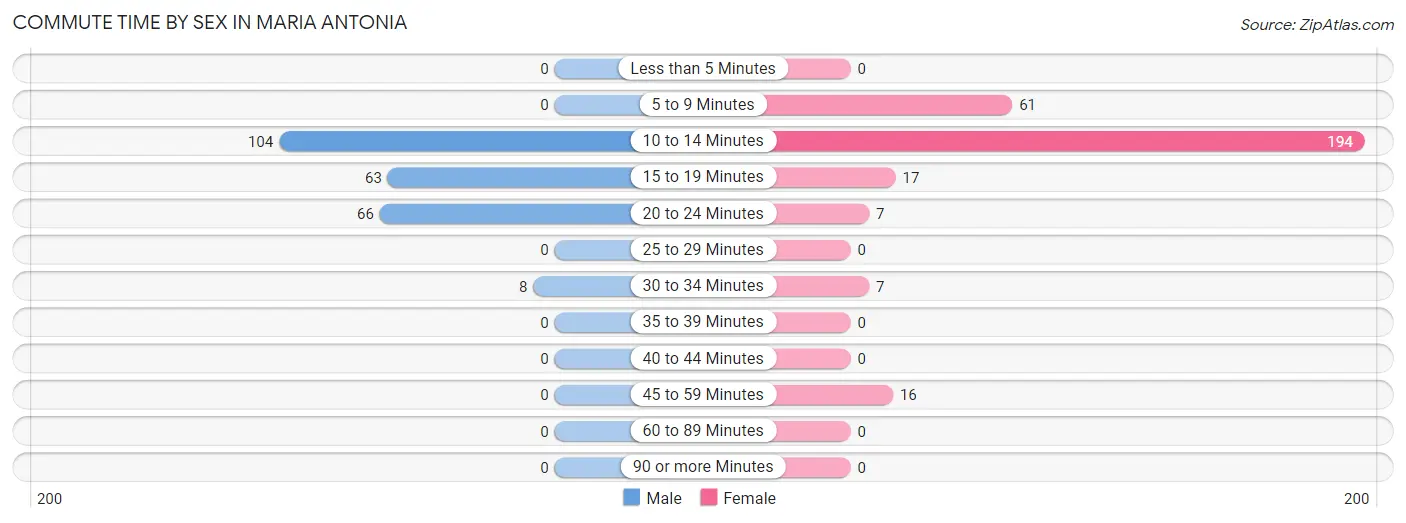
Commute Time by Sex in Maria Antonia
The most common commute times in Maria Antonia are 10 to 14 minutes (104 commuters, 43.1%) for males and 10 to 14 minutes (194 commuters, 64.2%) for females.
| Commute Time | Male | Female |
| Less than 5 Minutes | 0 (0.0%) | 0 (0.0%) |
| 5 to 9 Minutes | 0 (0.0%) | 61 (20.2%) |
| 10 to 14 Minutes | 104 (43.1%) | 194 (64.2%) |
| 15 to 19 Minutes | 63 (26.1%) | 17 (5.6%) |
| 20 to 24 Minutes | 66 (27.4%) | 7 (2.3%) |
| 25 to 29 Minutes | 0 (0.0%) | 0 (0.0%) |
| 30 to 34 Minutes | 8 (3.3%) | 7 (2.3%) |
| 35 to 39 Minutes | 0 (0.0%) | 0 (0.0%) |
| 40 to 44 Minutes | 0 (0.0%) | 0 (0.0%) |
| 45 to 59 Minutes | 0 (0.0%) | 16 (5.3%) |
| 60 to 89 Minutes | 0 (0.0%) | 0 (0.0%) |
| 90 or more Minutes | 0 (0.0%) | 0 (0.0%) |
Time of Departure to Work by Sex in Maria Antonia
The most frequent times of departure to work in Maria Antonia are 6:30 AM to 6:59 AM (69, 28.6%) for males and 10:00 AM to 10:59 AM (124, 41.1%) for females.
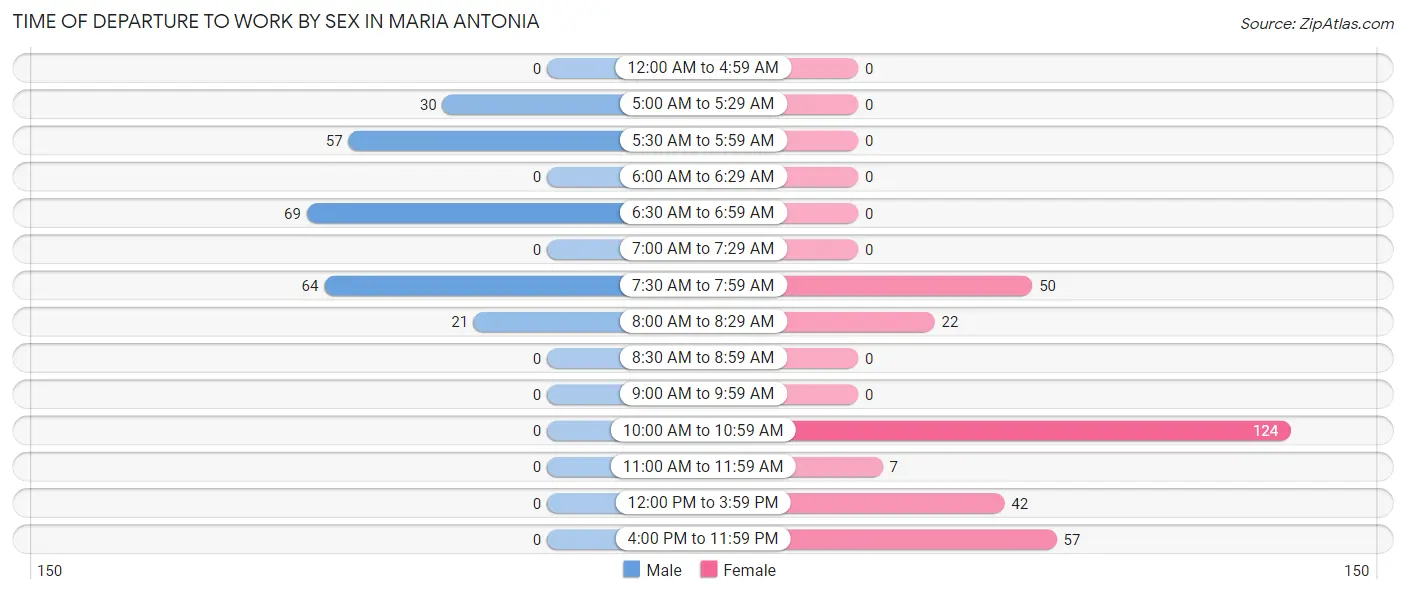
| Time of Departure | Male | Female |
| 12:00 AM to 4:59 AM | 0 (0.0%) | 0 (0.0%) |
| 5:00 AM to 5:29 AM | 30 (12.4%) | 0 (0.0%) |
| 5:30 AM to 5:59 AM | 57 (23.6%) | 0 (0.0%) |
| 6:00 AM to 6:29 AM | 0 (0.0%) | 0 (0.0%) |
| 6:30 AM to 6:59 AM | 69 (28.6%) | 0 (0.0%) |
| 7:00 AM to 7:29 AM | 0 (0.0%) | 0 (0.0%) |
| 7:30 AM to 7:59 AM | 64 (26.6%) | 50 (16.6%) |
| 8:00 AM to 8:29 AM | 21 (8.7%) | 22 (7.3%) |
| 8:30 AM to 8:59 AM | 0 (0.0%) | 0 (0.0%) |
| 9:00 AM to 9:59 AM | 0 (0.0%) | 0 (0.0%) |
| 10:00 AM to 10:59 AM | 0 (0.0%) | 124 (41.1%) |
| 11:00 AM to 11:59 AM | 0 (0.0%) | 7 (2.3%) |
| 12:00 PM to 3:59 PM | 0 (0.0%) | 42 (13.9%) |
| 4:00 PM to 11:59 PM | 0 (0.0%) | 57 (18.9%) |
| Total | 241 (100.0%) | 302 (100.0%) |
Housing Occupancy in Maria Antonia
Occupancy by Ownership in Maria Antonia
Of the total 681 dwellings in Maria Antonia, owner-occupied units account for 525 (77.1%), while renter-occupied units make up 156 (22.9%).
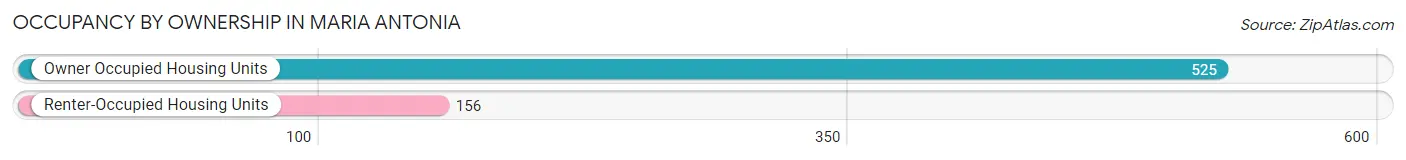
| Occupancy | # Housing Units | % Housing Units |
| Owner Occupied Housing Units | 525 | 77.1% |
| Renter-Occupied Housing Units | 156 | 22.9% |
| Total Occupied Housing Units | 681 | 100.0% |
Occupancy by Household Size in Maria Antonia
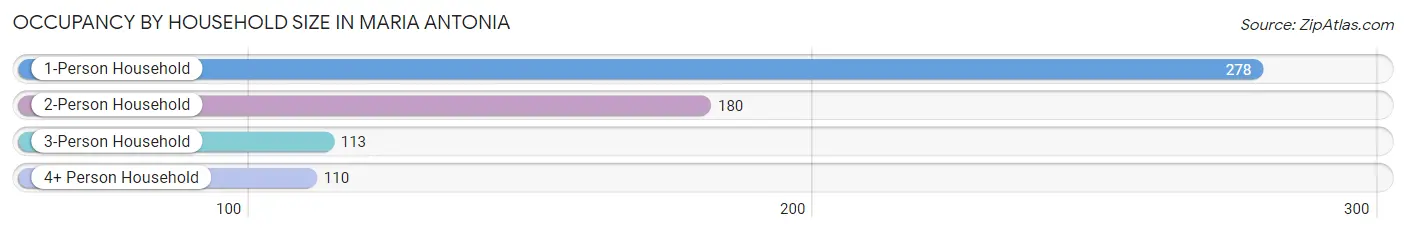
| Household Size | # Housing Units | % Housing Units |
| 1-Person Household | 278 | 40.8% |
| 2-Person Household | 180 | 26.4% |
| 3-Person Household | 113 | 16.6% |
| 4+ Person Household | 110 | 16.2% |
| Total Housing Units | 681 | 100.0% |
Occupancy by Ownership by Household Size in Maria Antonia
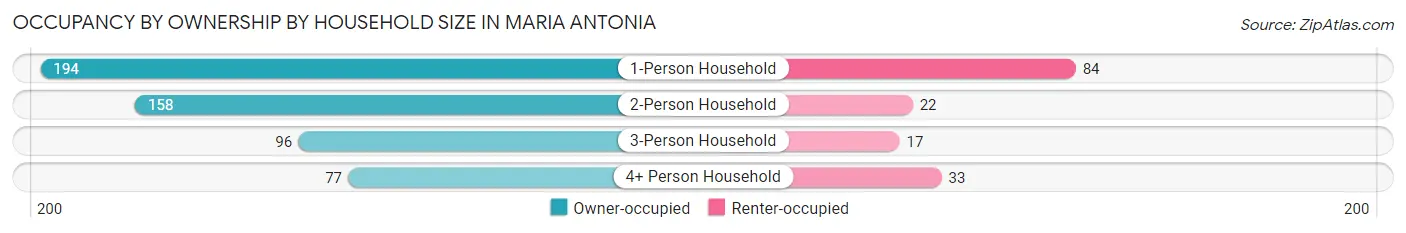
| Household Size | Owner-occupied | Renter-occupied |
| 1-Person Household | 194 (69.8%) | 84 (30.2%) |
| 2-Person Household | 158 (87.8%) | 22 (12.2%) |
| 3-Person Household | 96 (85.0%) | 17 (15.0%) |
| 4+ Person Household | 77 (70.0%) | 33 (30.0%) |
| Total Housing Units | 525 (77.1%) | 156 (22.9%) |
Occupancy by Educational Attainment in Maria Antonia
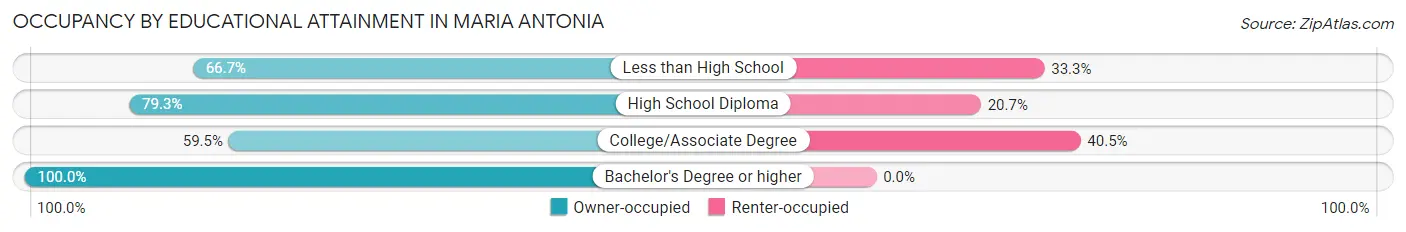
| Household Size | Owner-occupied | Renter-occupied |
| Less than High School | 66 (66.7%) | 33 (33.3%) |
| High School Diploma | 218 (79.3%) | 57 (20.7%) |
| College/Associate Degree | 97 (59.5%) | 66 (40.5%) |
| Bachelor's Degree or higher | 144 (100.0%) | 0 (0.0%) |
Occupancy by Age of Householder in Maria Antonia
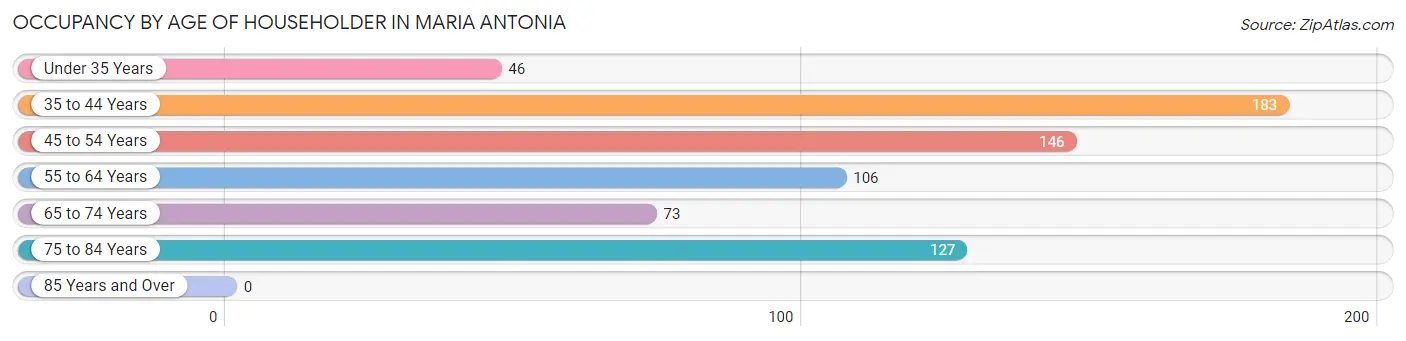
| Age Bracket | # Households | % Households |
| Under 35 Years | 46 | 6.8% |
| 35 to 44 Years | 183 | 26.9% |
| 45 to 54 Years | 146 | 21.4% |
| 55 to 64 Years | 106 | 15.6% |
| 65 to 74 Years | 73 | 10.7% |
| 75 to 84 Years | 127 | 18.6% |
| 85 Years and Over | 0 | 0.0% |
| Total | 681 | 100.0% |
Housing Finances in Maria Antonia
Median Income by Occupancy in Maria Antonia
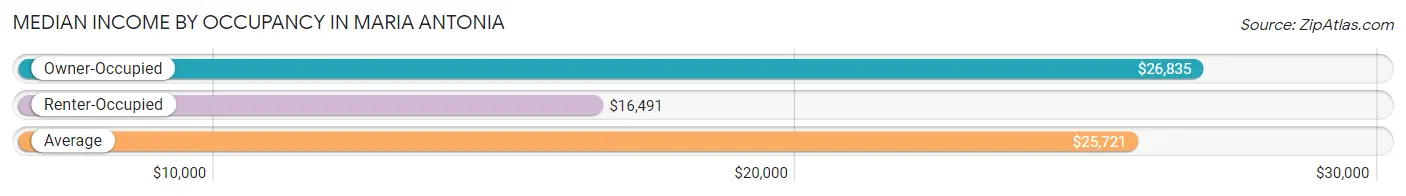
| Occupancy Type | # Households | Median Income |
| Owner-Occupied | 525 (77.1%) | $26,835 |
| Renter-Occupied | 156 (22.9%) | $16,491 |
| Average | 681 (100.0%) | $25,721 |
Occupancy by Householder Income Bracket in Maria Antonia
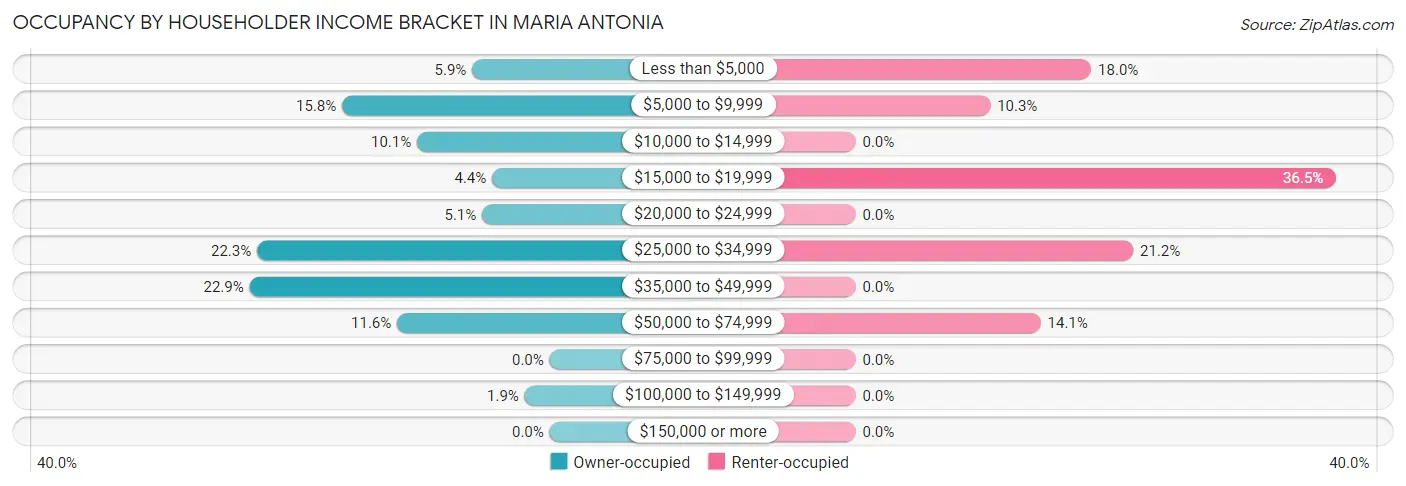
| Income Bracket | Owner-occupied | Renter-occupied |
| Less than $5,000 | 31 (5.9%) | 28 (17.9%) |
| $5,000 to $9,999 | 83 (15.8%) | 16 (10.3%) |
| $10,000 to $14,999 | 53 (10.1%) | 0 (0.0%) |
| $15,000 to $19,999 | 23 (4.4%) | 57 (36.5%) |
| $20,000 to $24,999 | 27 (5.1%) | 0 (0.0%) |
| $25,000 to $34,999 | 117 (22.3%) | 33 (21.1%) |
| $35,000 to $49,999 | 120 (22.9%) | 0 (0.0%) |
| $50,000 to $74,999 | 61 (11.6%) | 22 (14.1%) |
| $75,000 to $99,999 | 0 (0.0%) | 0 (0.0%) |
| $100,000 to $149,999 | 10 (1.9%) | 0 (0.0%) |
| $150,000 or more | 0 (0.0%) | 0 (0.0%) |
| Total | 525 (100.0%) | 156 (100.0%) |
Monthly Housing Cost Tiers in Maria Antonia
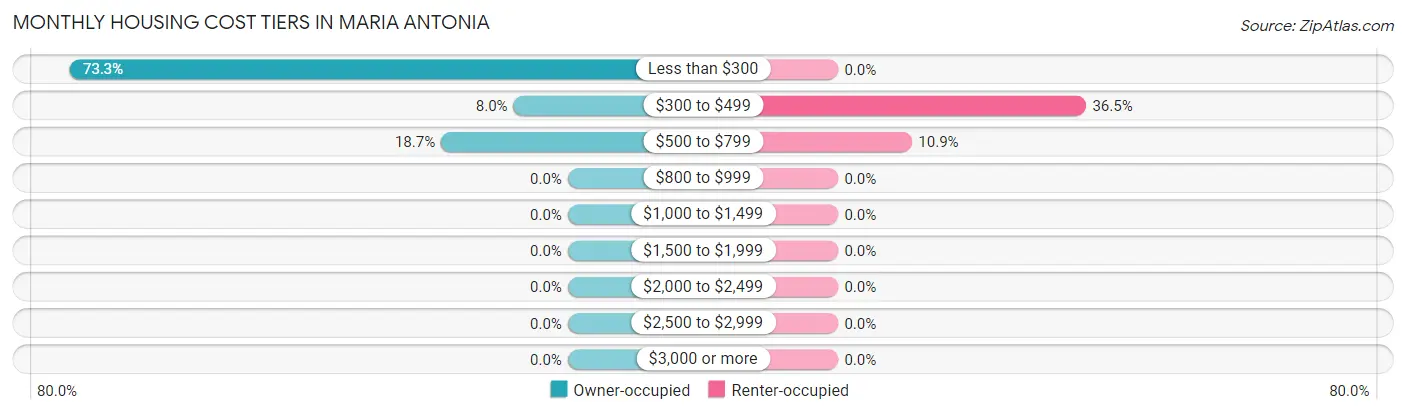
| Monthly Cost | Owner-occupied | Renter-occupied |
| Less than $300 | 385 (73.3%) | 0 (0.0%) |
| $300 to $499 | 42 (8.0%) | 57 (36.5%) |
| $500 to $799 | 98 (18.7%) | 17 (10.9%) |
| $800 to $999 | 0 (0.0%) | 0 (0.0%) |
| $1,000 to $1,499 | 0 (0.0%) | 0 (0.0%) |
| $1,500 to $1,999 | 0 (0.0%) | 0 (0.0%) |
| $2,000 to $2,499 | 0 (0.0%) | 0 (0.0%) |
| $2,500 to $2,999 | 0 (0.0%) | 0 (0.0%) |
| $3,000 or more | 0 (0.0%) | 0 (0.0%) |
| Total | 525 (100.0%) | 156 (100.0%) |
Physical Housing Characteristics in Maria Antonia
Housing Structures in Maria Antonia
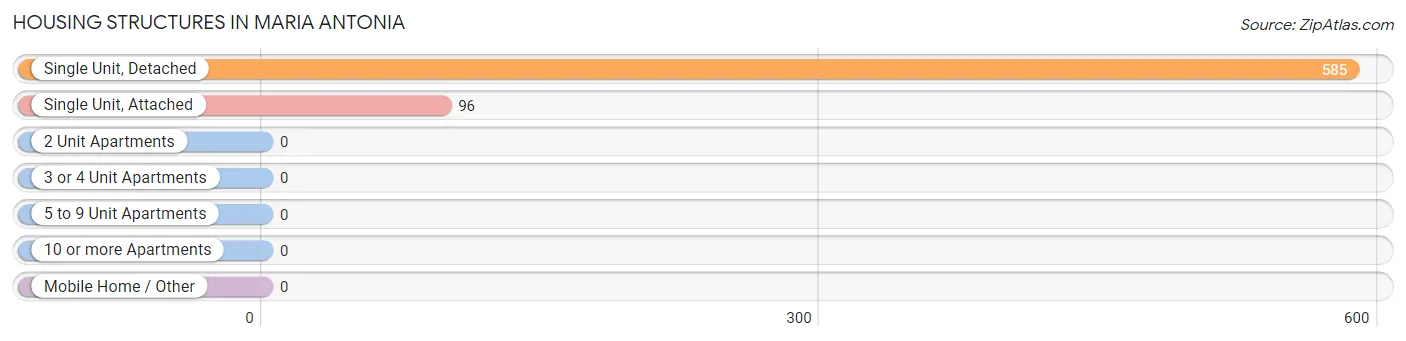
| Structure Type | # Housing Units | % Housing Units |
| Single Unit, Detached | 585 | 85.9% |
| Single Unit, Attached | 96 | 14.1% |
| 2 Unit Apartments | 0 | 0.0% |
| 3 or 4 Unit Apartments | 0 | 0.0% |
| 5 to 9 Unit Apartments | 0 | 0.0% |
| 10 or more Apartments | 0 | 0.0% |
| Mobile Home / Other | 0 | 0.0% |
| Total | 681 | 100.0% |
Housing Structures by Occupancy in Maria Antonia
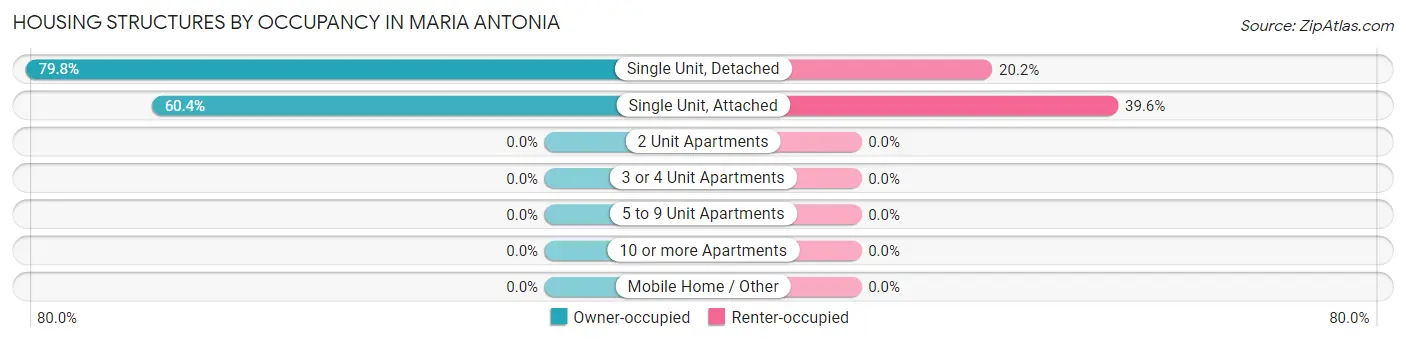
| Structure Type | Owner-occupied | Renter-occupied |
| Single Unit, Detached | 467 (79.8%) | 118 (20.2%) |
| Single Unit, Attached | 58 (60.4%) | 38 (39.6%) |
| 2 Unit Apartments | 0 (0.0%) | 0 (0.0%) |
| 3 or 4 Unit Apartments | 0 (0.0%) | 0 (0.0%) |
| 5 to 9 Unit Apartments | 0 (0.0%) | 0 (0.0%) |
| 10 or more Apartments | 0 (0.0%) | 0 (0.0%) |
| Mobile Home / Other | 0 (0.0%) | 0 (0.0%) |
| Total | 525 (77.1%) | 156 (22.9%) |
Housing Structures by Number of Rooms in Maria Antonia
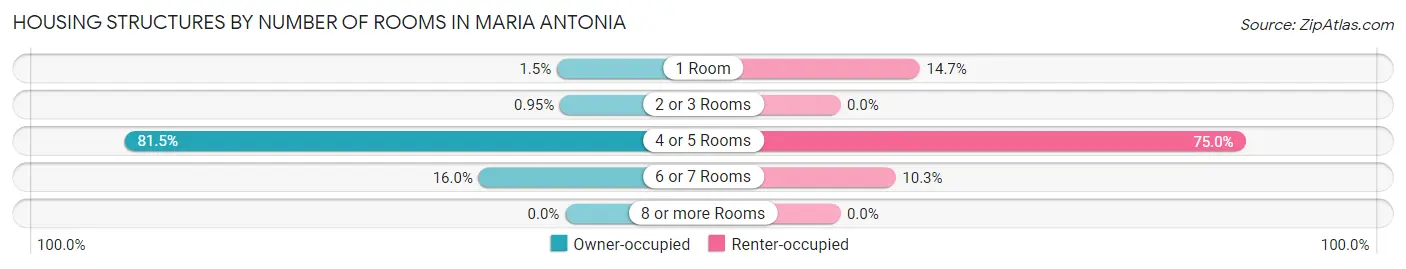
| Number of Rooms | Owner-occupied | Renter-occupied |
| 1 Room | 8 (1.5%) | 23 (14.7%) |
| 2 or 3 Rooms | 5 (0.9%) | 0 (0.0%) |
| 4 or 5 Rooms | 428 (81.5%) | 117 (75.0%) |
| 6 or 7 Rooms | 84 (16.0%) | 16 (10.3%) |
| 8 or more Rooms | 0 (0.0%) | 0 (0.0%) |
| Total | 525 (100.0%) | 156 (100.0%) |
Housing Structure by Heating Type in Maria Antonia
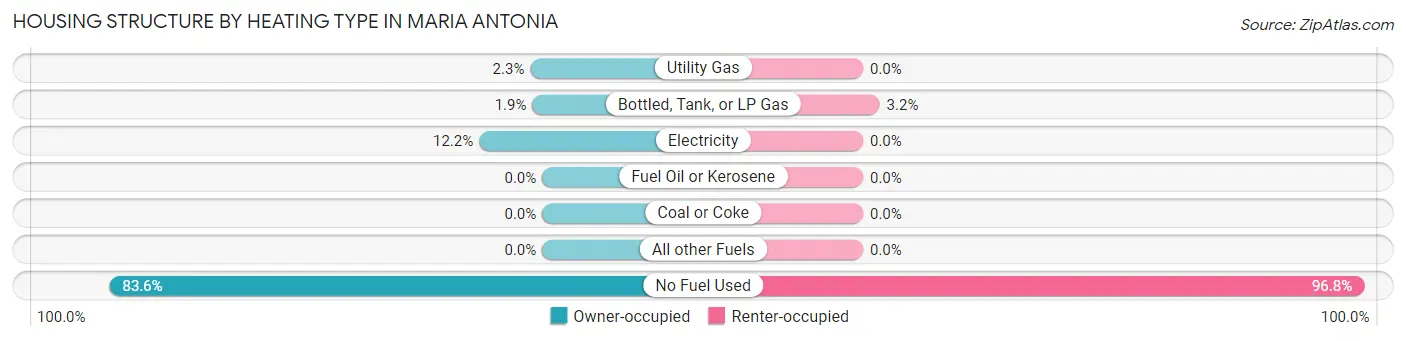
| Heating Type | Owner-occupied | Renter-occupied |
| Utility Gas | 12 (2.3%) | 0 (0.0%) |
| Bottled, Tank, or LP Gas | 10 (1.9%) | 5 (3.2%) |
| Electricity | 64 (12.2%) | 0 (0.0%) |
| Fuel Oil or Kerosene | 0 (0.0%) | 0 (0.0%) |
| Coal or Coke | 0 (0.0%) | 0 (0.0%) |
| All other Fuels | 0 (0.0%) | 0 (0.0%) |
| No Fuel Used | 439 (83.6%) | 151 (96.8%) |
| Total | 525 (100.0%) | 156 (100.0%) |
Household Vehicle Usage in Maria Antonia
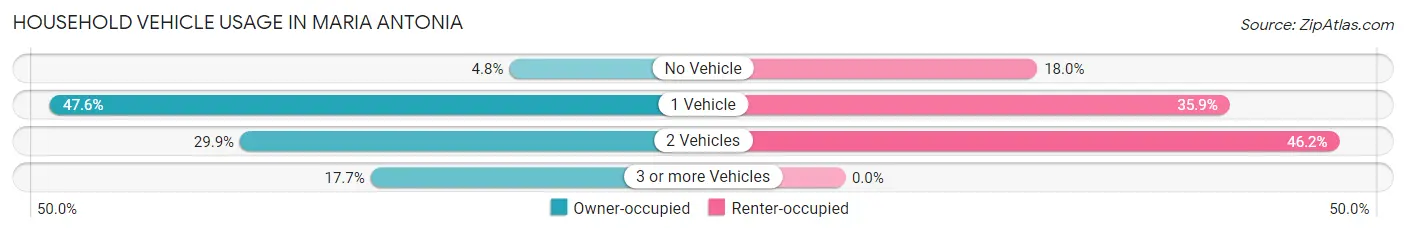
| Vehicles per Household | Owner-occupied | Renter-occupied |
| No Vehicle | 25 (4.8%) | 28 (17.9%) |
| 1 Vehicle | 250 (47.6%) | 56 (35.9%) |
| 2 Vehicles | 157 (29.9%) | 72 (46.2%) |
| 3 or more Vehicles | 93 (17.7%) | 0 (0.0%) |
| Total | 525 (100.0%) | 156 (100.0%) |
Real Estate & Mortgages in Maria Antonia
Real Estate and Mortgage Overview in Maria Antonia
| Characteristic | Without Mortgage | With Mortgage |
| Housing Units | 406 | 119 |
| Median Property Value | $85,000 | $123,200 |
| Median Household Income | $23,333 | $0 |
| Monthly Housing Costs | $116 | $0 |
| Real Estate Taxes | - | - |
Property Value by Mortgage Status in Maria Antonia
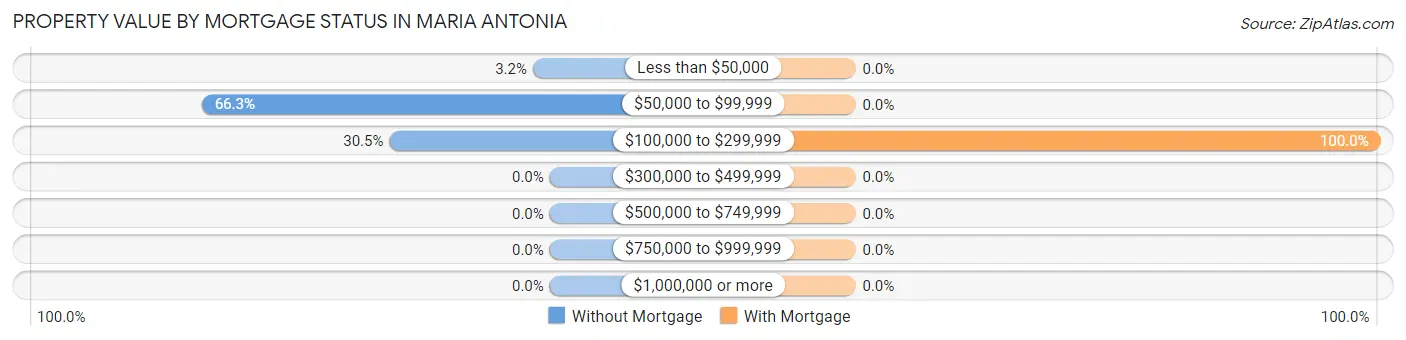
| Property Value | Without Mortgage | With Mortgage |
| Less than $50,000 | 13 (3.2%) | 0 (0.0%) |
| $50,000 to $99,999 | 269 (66.3%) | 0 (0.0%) |
| $100,000 to $299,999 | 124 (30.5%) | 119 (100.0%) |
| $300,000 to $499,999 | 0 (0.0%) | 0 (0.0%) |
| $500,000 to $749,999 | 0 (0.0%) | 0 (0.0%) |
| $750,000 to $999,999 | 0 (0.0%) | 0 (0.0%) |
| $1,000,000 or more | 0 (0.0%) | 0 (0.0%) |
| Total | 406 (100.0%) | 119 (100.0%) |
Household Income by Mortgage Status in Maria Antonia
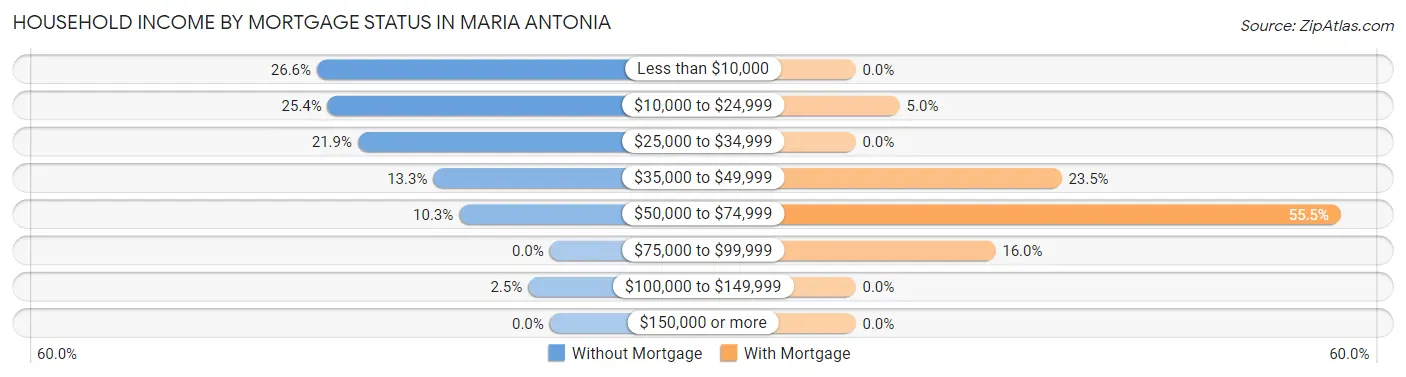
| Household Income | Without Mortgage | With Mortgage |
| Less than $10,000 | 108 (26.6%) | 0 (0.0%) |
| $10,000 to $24,999 | 103 (25.4%) | 6 (5.0%) |
| $25,000 to $34,999 | 89 (21.9%) | 0 (0.0%) |
| $35,000 to $49,999 | 54 (13.3%) | 28 (23.5%) |
| $50,000 to $74,999 | 42 (10.3%) | 66 (55.5%) |
| $75,000 to $99,999 | 0 (0.0%) | 19 (16.0%) |
| $100,000 to $149,999 | 10 (2.5%) | 0 (0.0%) |
| $150,000 or more | 0 (0.0%) | 0 (0.0%) |
| Total | 406 (100.0%) | 119 (100.0%) |
Property Value to Household Income Ratio in Maria Antonia
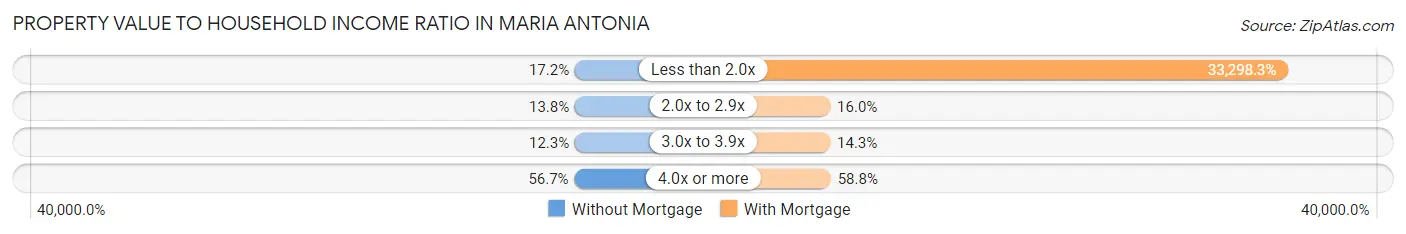
| Value-to-Income Ratio | Without Mortgage | With Mortgage |
| Less than 2.0x | 70 (17.2%) | 39,625 (33,298.3%) |
| 2.0x to 2.9x | 56 (13.8%) | 19 (16.0%) |
| 3.0x to 3.9x | 50 (12.3%) | 17 (14.3%) |
| 4.0x or more | 230 (56.7%) | 70 (58.8%) |
| Total | 406 (100.0%) | 119 (100.0%) |
Real Estate Taxes by Mortgage Status in Maria Antonia
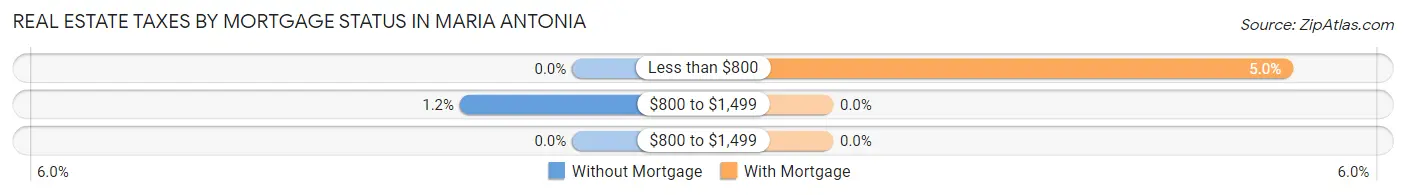
| Property Taxes | Without Mortgage | With Mortgage |
| Less than $800 | 0 (0.0%) | 6 (5.0%) |
| $800 to $1,499 | 5 (1.2%) | 0 (0.0%) |
| $800 to $1,499 | 0 (0.0%) | 0 (0.0%) |
| Total | 406 (100.0%) | 119 (100.0%) |
Health & Disability in Maria Antonia
Health Insurance Coverage by Age in Maria Antonia
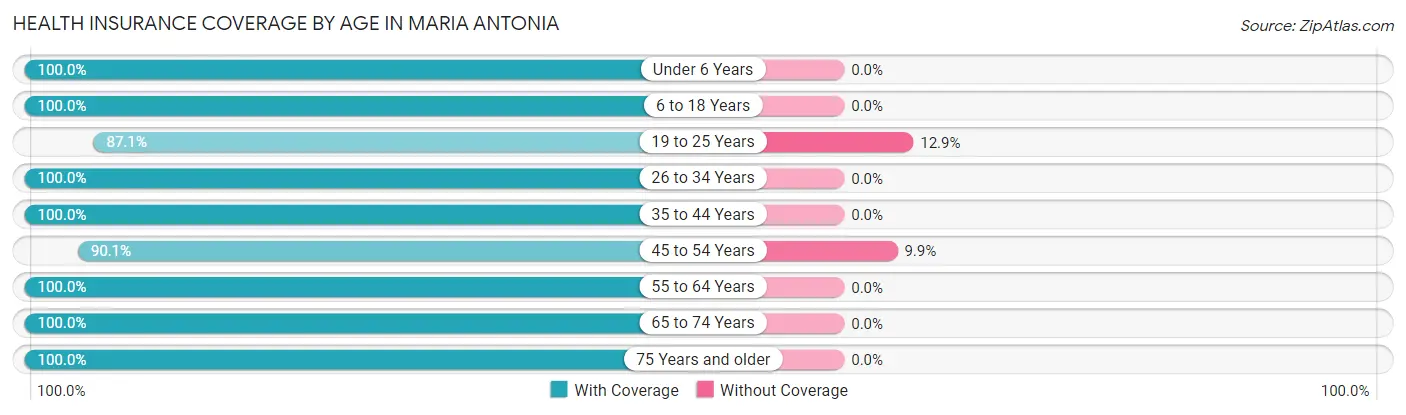
| Age Bracket | With Coverage | Without Coverage |
| Under 6 Years | 58 (100.0%) | 0 (0.0%) |
| 6 to 18 Years | 299 (100.0%) | 0 (0.0%) |
| 19 to 25 Years | 88 (87.1%) | 13 (12.9%) |
| 26 to 34 Years | 176 (100.0%) | 0 (0.0%) |
| 35 to 44 Years | 243 (100.0%) | 0 (0.0%) |
| 45 to 54 Years | 218 (90.1%) | 24 (9.9%) |
| 55 to 64 Years | 167 (100.0%) | 0 (0.0%) |
| 65 to 74 Years | 156 (100.0%) | 0 (0.0%) |
| 75 Years and older | 172 (100.0%) | 0 (0.0%) |
| Total | 1,577 (97.7%) | 37 (2.3%) |
Health Insurance Coverage by Citizenship Status in Maria Antonia
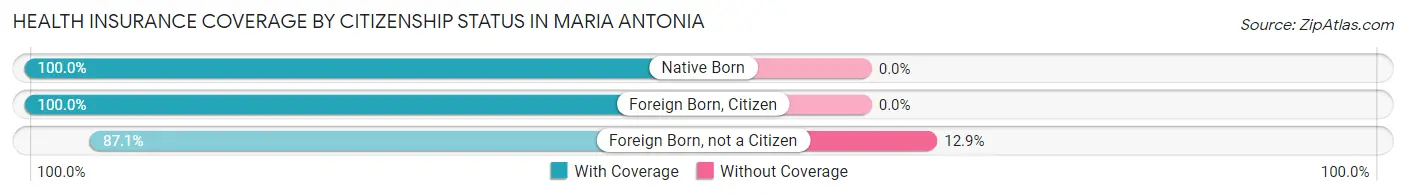
| Citizenship Status | With Coverage | Without Coverage |
| Native Born | 58 (100.0%) | 0 (0.0%) |
| Foreign Born, Citizen | 299 (100.0%) | 0 (0.0%) |
| Foreign Born, not a Citizen | 88 (87.1%) | 13 (12.9%) |
Health Insurance Coverage by Household Income in Maria Antonia
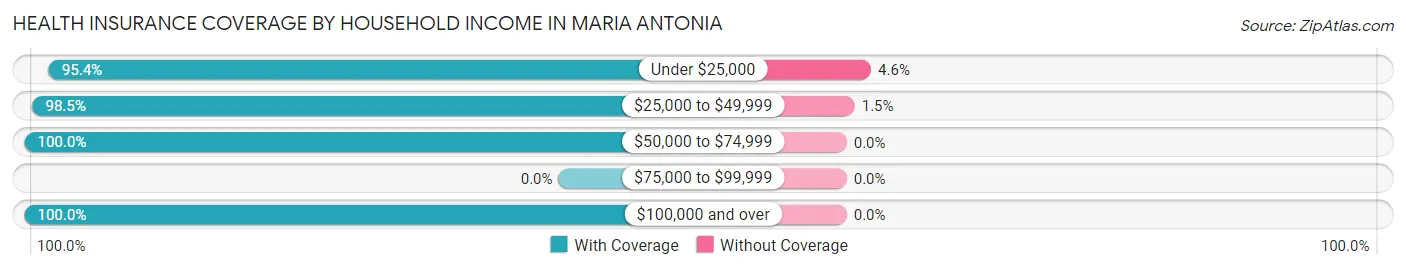
| Household Income | With Coverage | Without Coverage |
| Under $25,000 | 502 (95.4%) | 24 (4.6%) |
| $25,000 to $49,999 | 853 (98.5%) | 13 (1.5%) |
| $50,000 to $74,999 | 167 (100.0%) | 0 (0.0%) |
| $75,000 to $99,999 | 0 (0.0%) | 0 (0.0%) |
| $100,000 and over | 55 (100.0%) | 0 (0.0%) |
Public vs Private Health Insurance Coverage by Age in Maria Antonia
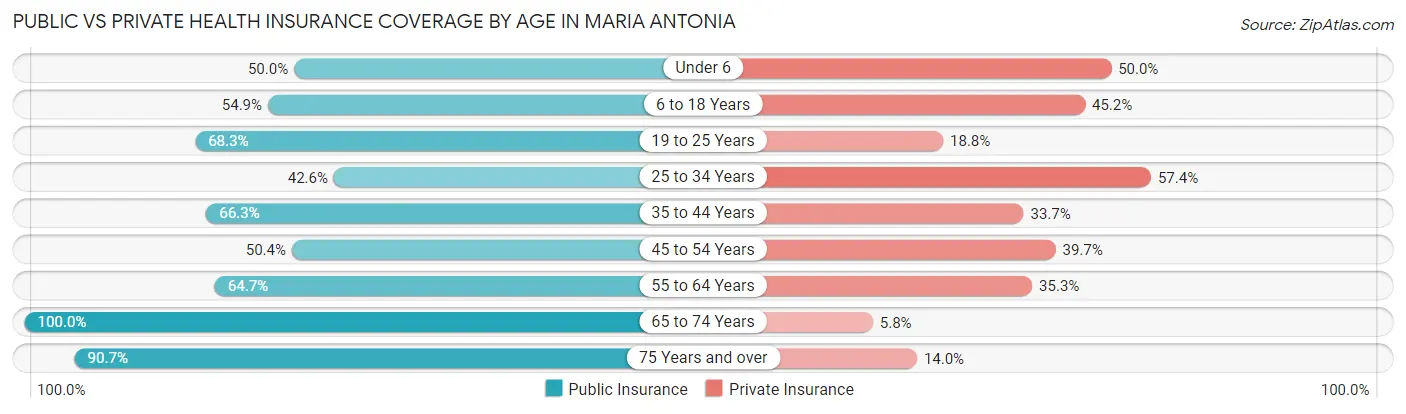
| Age Bracket | Public Insurance | Private Insurance |
| Under 6 | 29 (50.0%) | 29 (50.0%) |
| 6 to 18 Years | 164 (54.8%) | 135 (45.2%) |
| 19 to 25 Years | 69 (68.3%) | 19 (18.8%) |
| 25 to 34 Years | 75 (42.6%) | 101 (57.4%) |
| 35 to 44 Years | 161 (66.3%) | 82 (33.7%) |
| 45 to 54 Years | 122 (50.4%) | 96 (39.7%) |
| 55 to 64 Years | 108 (64.7%) | 59 (35.3%) |
| 65 to 74 Years | 156 (100.0%) | 9 (5.8%) |
| 75 Years and over | 156 (90.7%) | 24 (14.0%) |
| Total | 1,040 (64.4%) | 554 (34.3%) |
Disability Status by Sex by Age in Maria Antonia
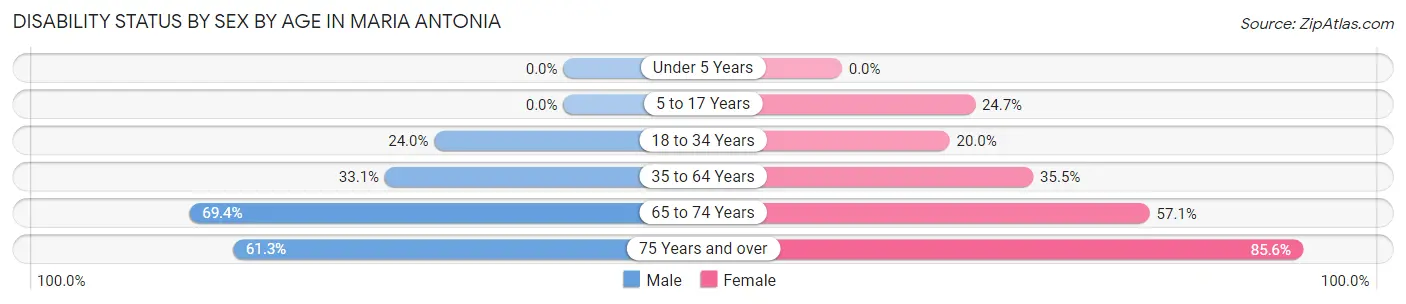
| Age Bracket | Male | Female |
| Under 5 Years | 0 (0.0%) | 0 (0.0%) |
| 5 to 17 Years | 0 (0.0%) | 21 (24.7%) |
| 18 to 34 Years | 40 (23.9%) | 35 (20.0%) |
| 35 to 64 Years | 105 (33.1%) | 119 (35.5%) |
| 65 to 74 Years | 84 (69.4%) | 20 (57.1%) |
| 75 Years and over | 46 (61.3%) | 83 (85.6%) |
Disability Class by Sex by Age in Maria Antonia
Disability Class: Hearing Difficulty
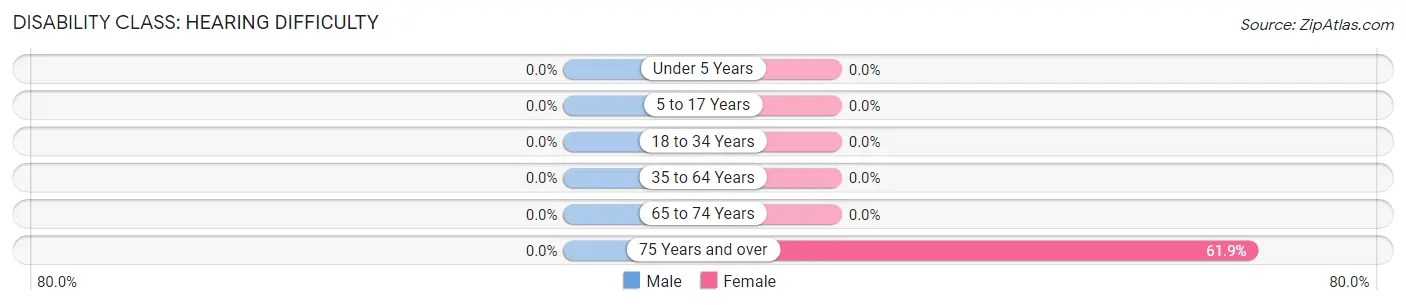
| Age Bracket | Male | Female |
| Under 5 Years | 0 (0.0%) | 0 (0.0%) |
| 5 to 17 Years | 0 (0.0%) | 0 (0.0%) |
| 18 to 34 Years | 0 (0.0%) | 0 (0.0%) |
| 35 to 64 Years | 0 (0.0%) | 0 (0.0%) |
| 65 to 74 Years | 0 (0.0%) | 0 (0.0%) |
| 75 Years and over | 0 (0.0%) | 60 (61.9%) |
Disability Class: Vision Difficulty
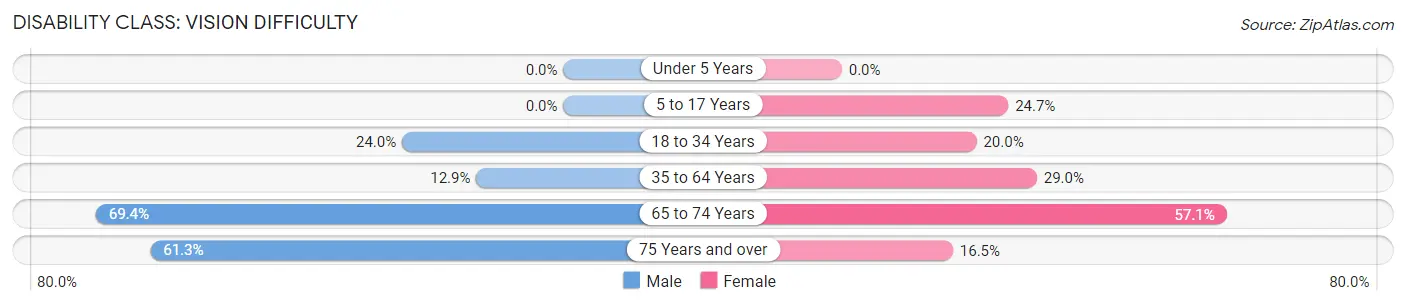
| Age Bracket | Male | Female |
| Under 5 Years | 0 (0.0%) | 0 (0.0%) |
| 5 to 17 Years | 0 (0.0%) | 21 (24.7%) |
| 18 to 34 Years | 40 (23.9%) | 35 (20.0%) |
| 35 to 64 Years | 41 (12.9%) | 97 (29.0%) |
| 65 to 74 Years | 84 (69.4%) | 20 (57.1%) |
| 75 Years and over | 46 (61.3%) | 16 (16.5%) |
Disability Class: Cognitive Difficulty
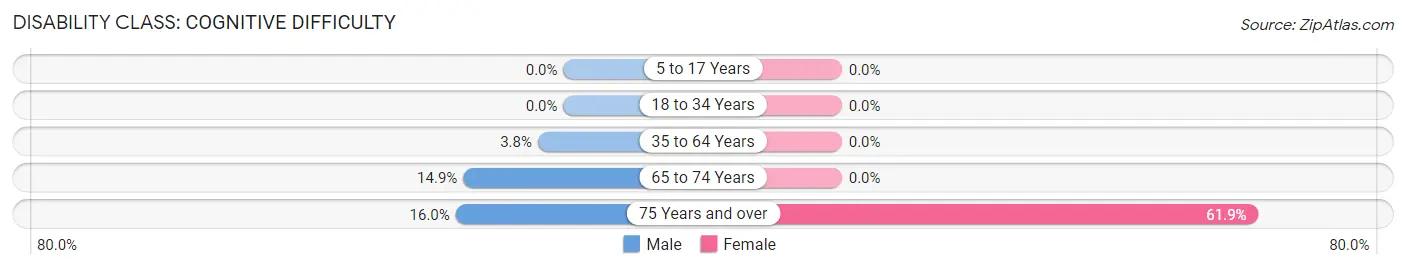
| Age Bracket | Male | Female |
| 5 to 17 Years | 0 (0.0%) | 0 (0.0%) |
| 18 to 34 Years | 0 (0.0%) | 0 (0.0%) |
| 35 to 64 Years | 12 (3.8%) | 0 (0.0%) |
| 65 to 74 Years | 18 (14.9%) | 0 (0.0%) |
| 75 Years and over | 12 (16.0%) | 60 (61.9%) |
Disability Class: Ambulatory Difficulty
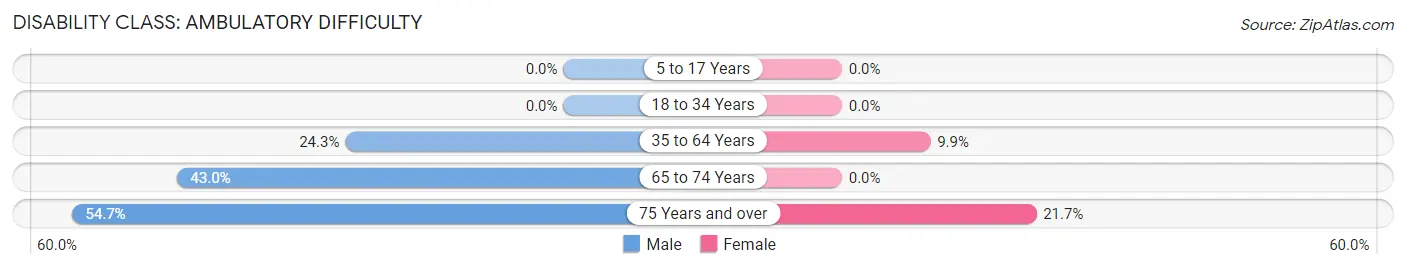
| Age Bracket | Male | Female |
| 5 to 17 Years | 0 (0.0%) | 0 (0.0%) |
| 18 to 34 Years | 0 (0.0%) | 0 (0.0%) |
| 35 to 64 Years | 77 (24.3%) | 33 (9.9%) |
| 65 to 74 Years | 52 (43.0%) | 0 (0.0%) |
| 75 Years and over | 41 (54.7%) | 21 (21.6%) |
Disability Class: Self-Care Difficulty
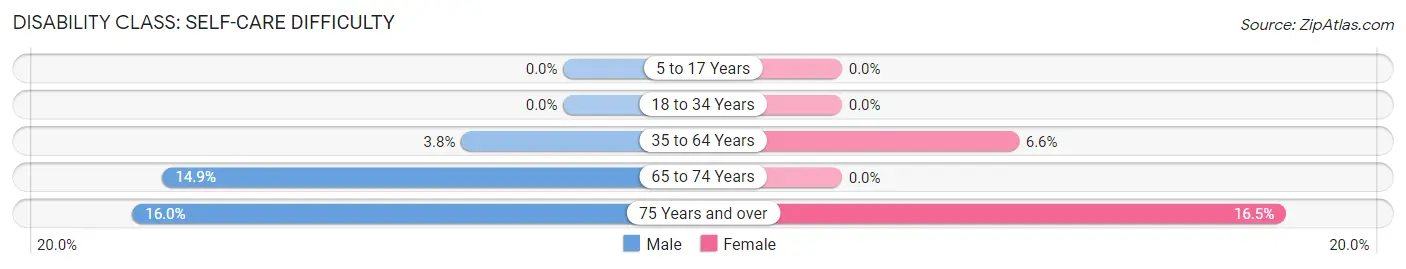
| Age Bracket | Male | Female |
| 5 to 17 Years | 0 (0.0%) | 0 (0.0%) |
| 18 to 34 Years | 0 (0.0%) | 0 (0.0%) |
| 35 to 64 Years | 12 (3.8%) | 22 (6.6%) |
| 65 to 74 Years | 18 (14.9%) | 0 (0.0%) |
| 75 Years and over | 12 (16.0%) | 16 (16.5%) |
Technology Access in Maria Antonia
Computing Device Access in Maria Antonia
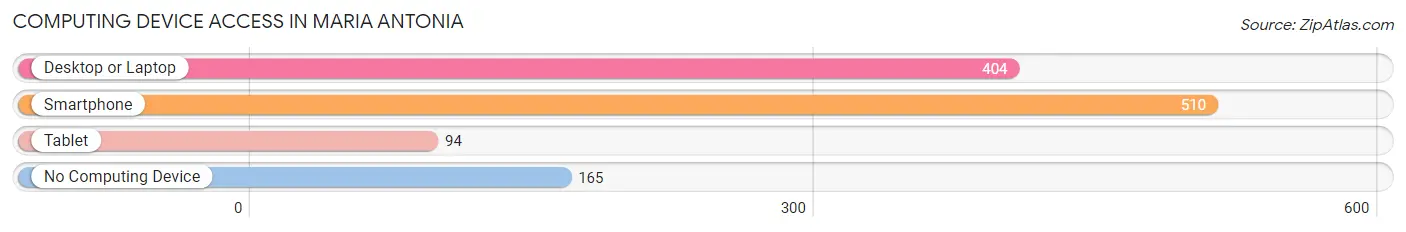
| Device Type | # Households | % Households |
| Desktop or Laptop | 404 | 59.3% |
| Smartphone | 510 | 74.9% |
| Tablet | 94 | 13.8% |
| No Computing Device | 165 | 24.2% |
| Total | 681 | 100.0% |
Internet Access in Maria Antonia
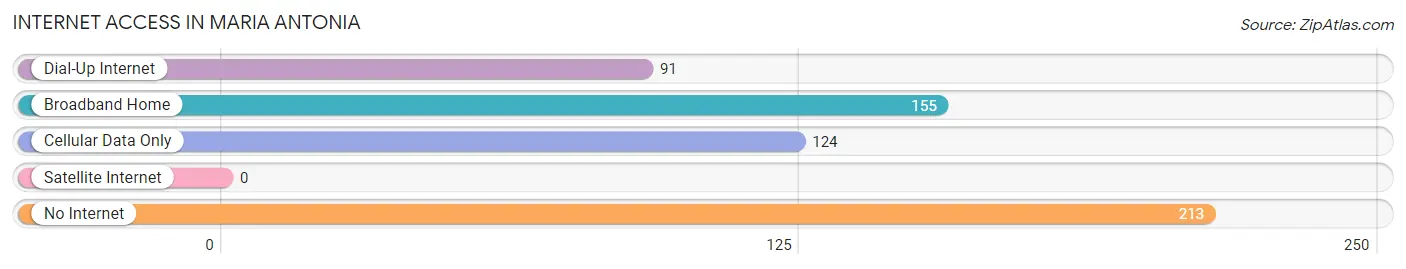
| Internet Type | # Households | % Households |
| Dial-Up Internet | 91 | 13.4% |
| Broadband Home | 155 | 22.8% |
| Cellular Data Only | 124 | 18.2% |
| Satellite Internet | 0 | 0.0% |
| No Internet | 213 | 31.3% |
| Total | 681 | 100.0% |
Maria Antonia Summary
History
The history of Puerto Rico is a long and complex one, beginning with the arrival of the first inhabitants to the island. The original inhabitants of the island were the Taíno, an Arawak-speaking people who arrived from South America around 1000 AD. The Taíno were a peaceful people who lived in small villages and practiced agriculture. They were also skilled fishermen and hunters.
The Taíno were eventually conquered by the Spanish in the late 15th century. The Spanish brought with them a new language, religion, and culture, which would shape the island’s history for centuries to come. The Spanish also brought African slaves to the island, which would become an important part of the island’s population.
In 1898, Puerto Rico was ceded to the United States as a result of the Spanish-American War. This marked the beginning of a new era in Puerto Rico’s history. The island was granted U.S. citizenship in 1917, and in 1952, it became an unincorporated territory of the United States.
Since then, Puerto Rico has experienced a period of economic growth and development, as well as political and social unrest. In the late 20th century, the island experienced a period of economic crisis, which led to a wave of migration to the mainland United States.
Geography
Puerto Rico is an archipelago located in the Caribbean Sea, east of the Dominican Republic and west of the Virgin Islands. It is the smallest and most eastern of the Greater Antilles. The main island of Puerto Rico is the largest of the archipelago, with an area of 3,515 square miles.
The island is divided into 78 municipalities, each with its own government. The capital and largest city is San Juan, located on the northern coast of the island. Other major cities include Ponce, Mayagüez, and Arecibo.
The terrain of Puerto Rico is mostly mountainous, with the highest peak being Cerro de Punta, at 4,390 feet. The climate is tropical, with temperatures ranging from the mid-70s to the mid-80s.
Economy
Puerto Rico’s economy is largely based on services, with tourism being the largest sector. Other important sectors include manufacturing, finance, and agriculture. The island is also home to a large pharmaceutical industry.
The government of Puerto Rico is responsible for providing public services, such as education, health care, and public safety. The government also provides incentives for businesses to invest in the island.
The currency of Puerto Rico is the U.S. dollar. The island is also a member of the Caribbean Community (CARICOM) and the Organization of American States (OAS).
Demographics
As of 2020, the population of Puerto Rico was estimated to be 3.2 million. The majority of the population is of mixed European and African descent, with smaller numbers of Taíno and other indigenous peoples. Spanish is the official language, although English is also widely spoken.
The majority of the population is Roman Catholic, although there are also significant numbers of Protestants and other religious groups.
Puerto Rico has a high rate of poverty, with nearly half of the population living below the poverty line. The unemployment rate is also high, at around 10%. The island also has a high rate of emigration, with many people leaving for the mainland United States in search of better economic opportunities.
Common Questions
What is Per Capita Income in Maria Antonia?
Per Capita income in Maria Antonia is $12,355.
What is the Median Family Income in Maria Antonia?
Median Family Income in Maria Antonia is $30,156.
What is the Median Household income in Maria Antonia?
Median Household Income in Maria Antonia is $25,721.
What is Income or Wage Gap in Maria Antonia?
Income or Wage Gap in Maria Antonia is 11.9%.
Women in Maria Antonia earn 88.1 cents for every dollar earned by a man.
What is Inequality or Gini Index in Maria Antonia?
Inequality or Gini Index in Maria Antonia is 0.42.
What is the Total Population of Maria Antonia?
Total Population of Maria Antonia is 1,614.
What is the Total Male Population of Maria Antonia?
Total Male Population of Maria Antonia is 887.
What is the Total Female Population of Maria Antonia?
Total Female Population of Maria Antonia is 727.
What is the Ratio of Males per 100 Females in Maria Antonia?
There are 122.01 Males per 100 Females in Maria Antonia.
What is the Ratio of Females per 100 Males in Maria Antonia?
There are 81.96 Females per 100 Males in Maria Antonia.
What is the Median Population Age in Maria Antonia?
Median Population Age in Maria Antonia is 42.5 Years.
What is the Average Family Size in Maria Antonia
Average Family Size in Maria Antonia is 3.1 People.
What is the Average Household Size in Maria Antonia
Average Household Size in Maria Antonia is 2.4 People.
How Large is the Labor Force in Maria Antonia?
There are 668 People in the Labor Forcein in Maria Antonia.
What is the Percentage of People in the Labor Force in Maria Antonia?
49.3% of People are in the Labor Force in Maria Antonia.
What is the Unemployment Rate in Maria Antonia?
Unemployment Rate in Maria Antonia is 11.2%.