Fuig, PR Map & Demographics
Fuig Map
Fuig Overview
$4,925
PER CAPITA INCOME
$10,045
AVG FAMILY INCOME
$10,940
AVG HOUSEHOLD INCOME
$12,546
FAMILY INCOME DEFICIT
0.40
INEQUALITY / GINI INDEX
1,010
TOTAL POPULATION
349
MALE POPULATION
661
FEMALE POPULATION
52.80
MALES / 100 FEMALES
189.40
FEMALES / 100 MALES
28.9
MEDIAN AGE
2.5
AVG FAMILY SIZE
2.4
AVG HOUSEHOLD SIZE
235
LABOR FORCE [ PEOPLE ]
30.5%
PERCENT IN LABOR FORCE
48.5%
UNEMPLOYMENT RATE
Income in Fuig
Income Overview in Fuig
Per Capita Income in Fuig is $4,925, while median incomes of families and households are $10,045 and $10,940 respectively.
| Characteristic | Number | Measure |
| Per Capita Income | 1,010 | $4,925 |
| Median Family Income | 322 | $10,045 |
| Mean Family Income | 322 | $8,793 |
| Median Household Income | 424 | $10,940 |
| Mean Household Income | 424 | $11,989 |
| Income Deficit | 322 | $12,546 |
| Wage / Income Gap (%) | 1,010 | 0.00% |
| Wage / Income Gap ($) | 1,010 | 100.00¢ per $1 |
| Gini / Inequality Index | 1,010 | 0.40 |
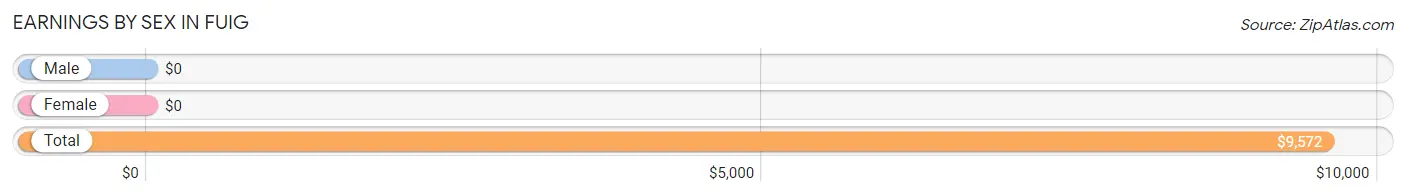
Earnings by Sex in Fuig
| Sex | Number | Average Earnings |
| Male | 147 (82.1%) | $0 |
| Female | 32 (17.9%) | $0 |
| Total | 179 (100.0%) | $9,572 |
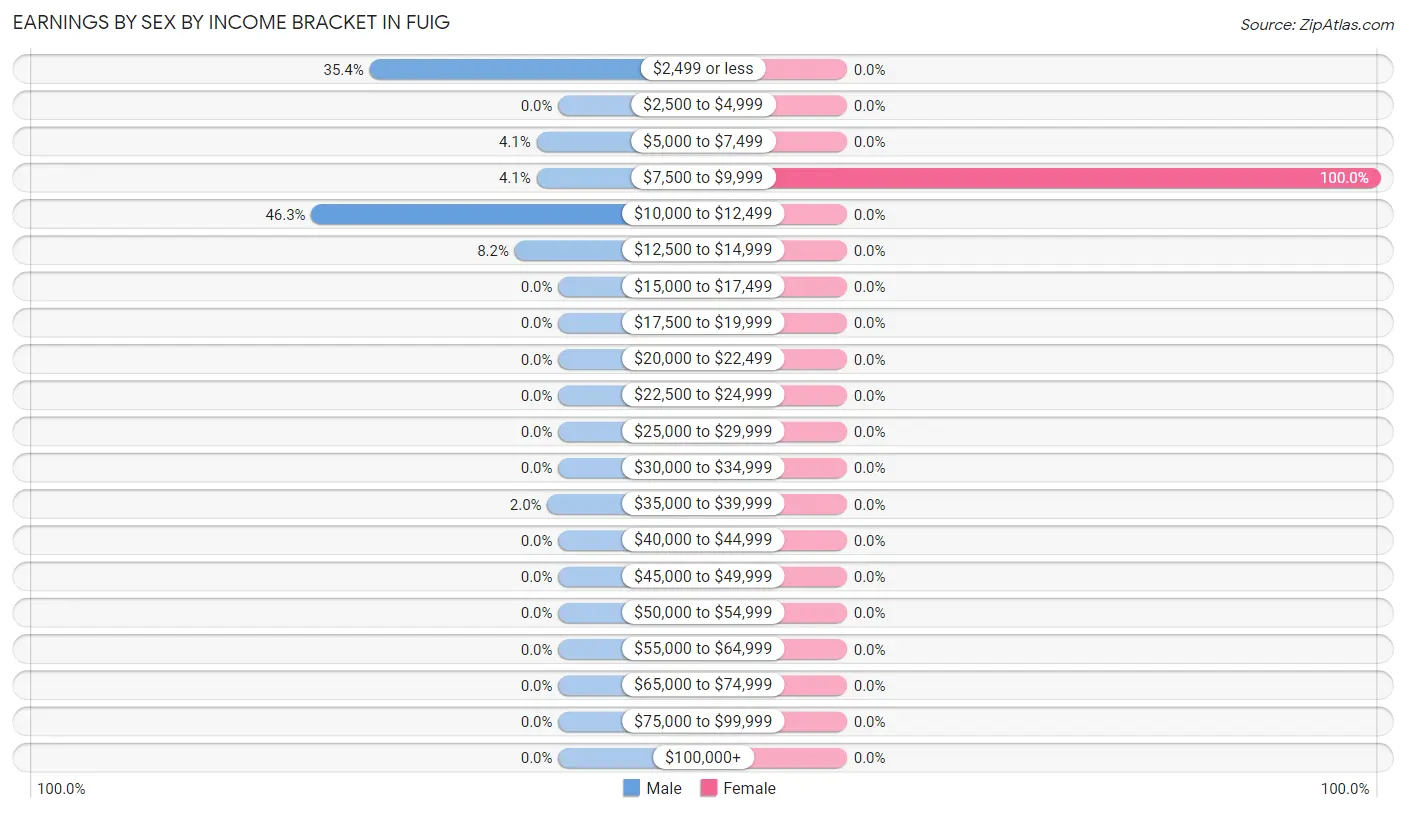
Earnings by Sex by Income Bracket in Fuig
The most common earnings brackets in Fuig are $10,000 to $12,499 for men (68 | 46.3%) and $7,500 to $9,999 for women (32 | 100.0%).
| Income | Male | Female |
| $2,499 or less | 52 (35.4%) | 0 (0.0%) |
| $2,500 to $4,999 | 0 (0.0%) | 0 (0.0%) |
| $5,000 to $7,499 | 6 (4.1%) | 0 (0.0%) |
| $7,500 to $9,999 | 6 (4.1%) | 32 (100.0%) |
| $10,000 to $12,499 | 68 (46.3%) | 0 (0.0%) |
| $12,500 to $14,999 | 12 (8.2%) | 0 (0.0%) |
| $15,000 to $17,499 | 0 (0.0%) | 0 (0.0%) |
| $17,500 to $19,999 | 0 (0.0%) | 0 (0.0%) |
| $20,000 to $22,499 | 0 (0.0%) | 0 (0.0%) |
| $22,500 to $24,999 | 0 (0.0%) | 0 (0.0%) |
| $25,000 to $29,999 | 0 (0.0%) | 0 (0.0%) |
| $30,000 to $34,999 | 0 (0.0%) | 0 (0.0%) |
| $35,000 to $39,999 | 3 (2.0%) | 0 (0.0%) |
| $40,000 to $44,999 | 0 (0.0%) | 0 (0.0%) |
| $45,000 to $49,999 | 0 (0.0%) | 0 (0.0%) |
| $50,000 to $54,999 | 0 (0.0%) | 0 (0.0%) |
| $55,000 to $64,999 | 0 (0.0%) | 0 (0.0%) |
| $65,000 to $74,999 | 0 (0.0%) | 0 (0.0%) |
| $75,000 to $99,999 | 0 (0.0%) | 0 (0.0%) |
| $100,000+ | 0 (0.0%) | 0 (0.0%) |
| Total | 147 (100.0%) | 32 (100.0%) |
Earnings by Sex by Educational Attainment in Fuig
| Educational Attainment | Male Income | Female Income |
| Less than High School | - | - |
| High School Diploma | - | - |
| College or Associate's Degree | - | - |
| Bachelor's Degree | - | - |
| Graduate Degree | - | - |
| Total | - | - |
Family Income in Fuig
Family Income Brackets in Fuig
According to the Fuig family income data, there are 159 families falling into the less than $10,000 income range, which is the most common income bracket and makes up 49.4% of all families.
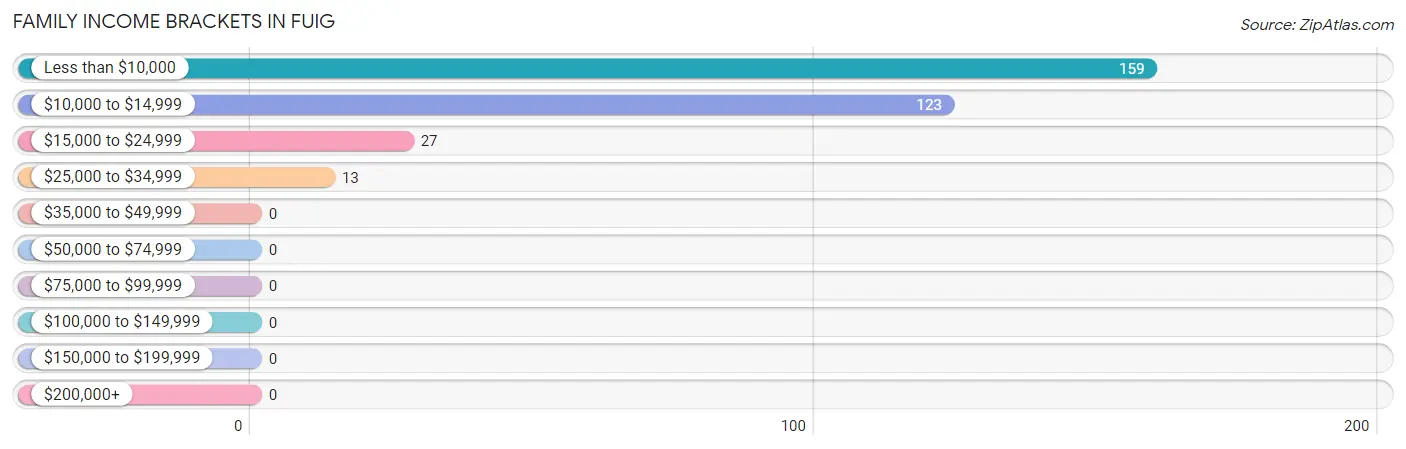
| Income Bracket | # Families | % Families |
| Less than $10,000 | 159 | 49.4% |
| $10,000 to $14,999 | 123 | 38.2% |
| $15,000 to $24,999 | 27 | 8.4% |
| $25,000 to $34,999 | 13 | 4.0% |
| $35,000 to $49,999 | 0 | 0.0% |
| $50,000 to $74,999 | 0 | 0.0% |
| $75,000 to $99,999 | 0 | 0.0% |
| $100,000 to $149,999 | 0 | 0.0% |
| $150,000 to $199,999 | 0 | 0.0% |
| $200,000+ | 0 | 0.0% |
Family Income by Famaliy Size in Fuig
2-person families (228 | 70.8%) account for the highest median family income in Fuig with $10,668 per family, while 2-person families (228 | 70.8%) have the highest median income of $5,334 per family member.
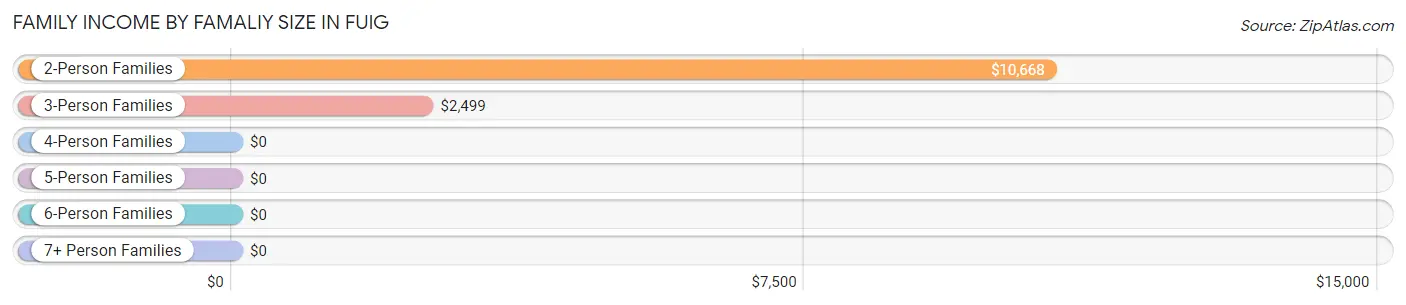
| Income Bracket | # Families | Median Income |
| 2-Person Families | 228 (70.8%) | $10,668 |
| 3-Person Families | 67 (20.8%) | $2,499 |
| 4-Person Families | 12 (3.7%) | $0 |
| 5-Person Families | 15 (4.7%) | $0 |
| 6-Person Families | 0 (0.0%) | $0 |
| 7+ Person Families | 0 (0.0%) | $0 |
| Total | 322 (100.0%) | $10,045 |
Family Income by Number of Earners in Fuig
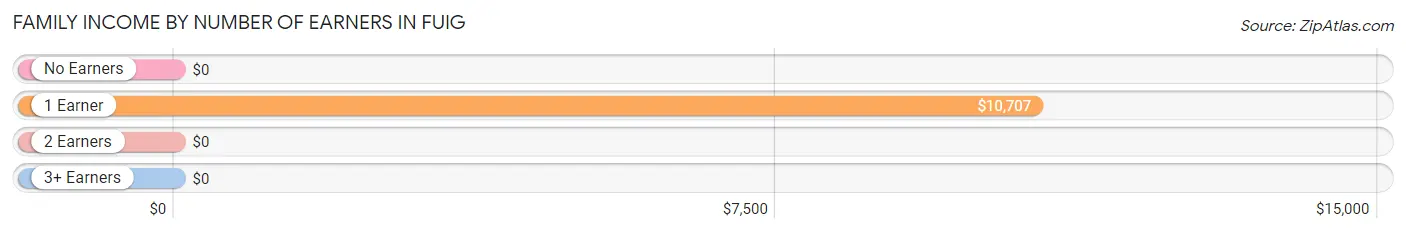
| Number of Earners | # Families | Median Income |
| No Earners | 222 (68.9%) | $0 |
| 1 Earner | 90 (28.0%) | $10,707 |
| 2 Earners | 10 (3.1%) | $0 |
| 3+ Earners | 0 (0.0%) | $0 |
| Total | 322 (100.0%) | $10,045 |
Household Income in Fuig
Household Income Brackets in Fuig
With 165 households falling in the category, the less than $10,000 income range is the most frequent in Fuig, accounting for 38.9% of all households.
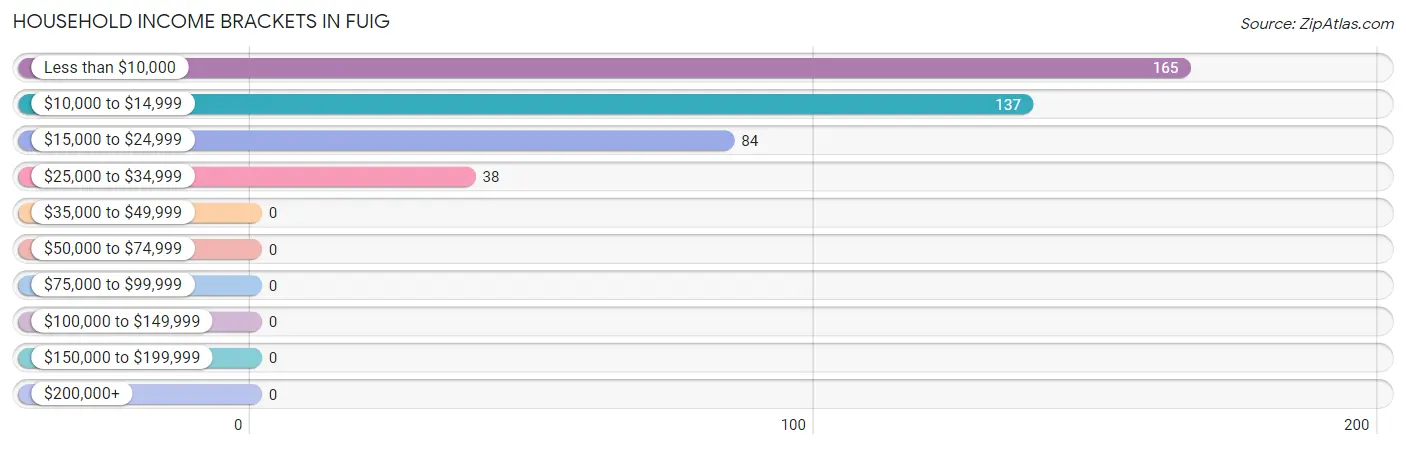
| Income Bracket | # Households | % Households |
| Less than $10,000 | 165 | 38.9% |
| $10,000 to $14,999 | 137 | 32.3% |
| $15,000 to $24,999 | 84 | 19.8% |
| $25,000 to $34,999 | 38 | 9.0% |
| $35,000 to $49,999 | 0 | 0.0% |
| $50,000 to $74,999 | 0 | 0.0% |
| $75,000 to $99,999 | 0 | 0.0% |
| $100,000 to $149,999 | 0 | 0.0% |
| $150,000 to $199,999 | 0 | 0.0% |
| $200,000+ | 0 | 0.0% |
Household Income by Householder Age in Fuig
The median household income in Fuig is $10,940, with the highest median household income of $10,846 found in the 65+ years age bracket for the primary householder. A total of 203 households (47.9%) fall into this category.
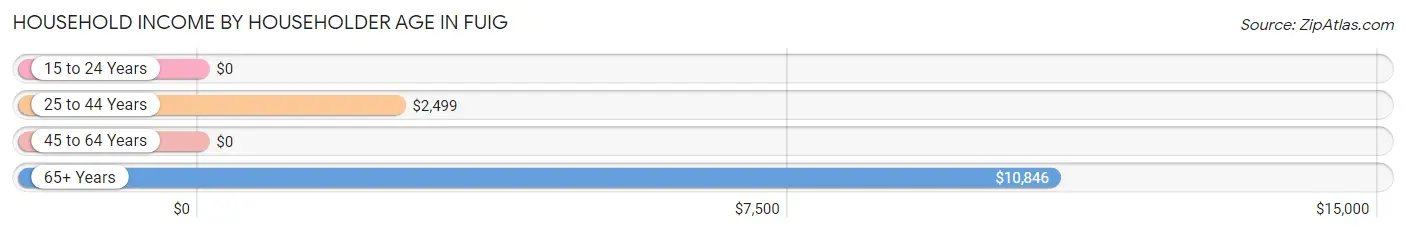
| Income Bracket | # Households | Median Income |
| 15 to 24 Years | 0 (0.0%) | $0 |
| 25 to 44 Years | 103 (24.3%) | $2,499 |
| 45 to 64 Years | 118 (27.8%) | $0 |
| 65+ Years | 203 (47.9%) | $10,846 |
| Total | 424 (100.0%) | $10,940 |
Poverty in Fuig
Income Below Poverty by Sex and Age in Fuig
With 86.3% poverty level for males and 92.6% for females among the residents of Fuig, 15 year old males and under 5 year old females are the most vulnerable to poverty, with 10 males (100.0%) and 120 females (100.0%) in their respective age groups living below the poverty level.
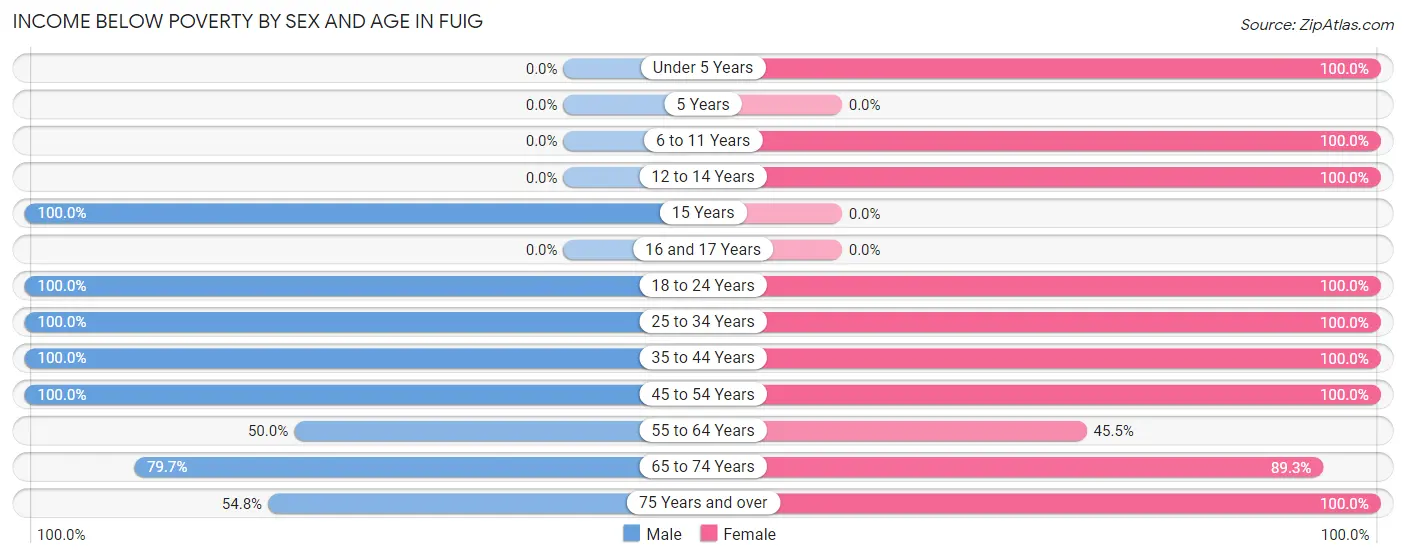
| Age Bracket | Male | Female |
| Under 5 Years | 0 (0.0%) | 120 (100.0%) |
| 5 Years | 0 (0.0%) | 0 (0.0%) |
| 6 to 11 Years | 0 (0.0%) | 94 (100.0%) |
| 12 to 14 Years | 0 (0.0%) | 16 (100.0%) |
| 15 Years | 10 (100.0%) | 0 (0.0%) |
| 16 and 17 Years | 0 (0.0%) | 0 (0.0%) |
| 18 to 24 Years | 70 (100.0%) | 29 (100.0%) |
| 25 to 34 Years | 84 (100.0%) | 89 (100.0%) |
| 35 to 44 Years | 22 (100.0%) | 11 (100.0%) |
| 45 to 54 Years | 26 (100.0%) | 55 (100.0%) |
| 55 to 64 Years | 21 (50.0%) | 30 (45.5%) |
| 65 to 74 Years | 51 (79.7%) | 109 (89.3%) |
| 75 Years and over | 17 (54.8%) | 59 (100.0%) |
| Total | 301 (86.3%) | 612 (92.6%) |
Income Above Poverty by Sex and Age in Fuig
According to the poverty statistics in Fuig, males aged 55 to 64 years and females aged 55 to 64 years are the age groups that are most secure financially, with 50.0% of males and 54.5% of females in these age groups living above the poverty line.
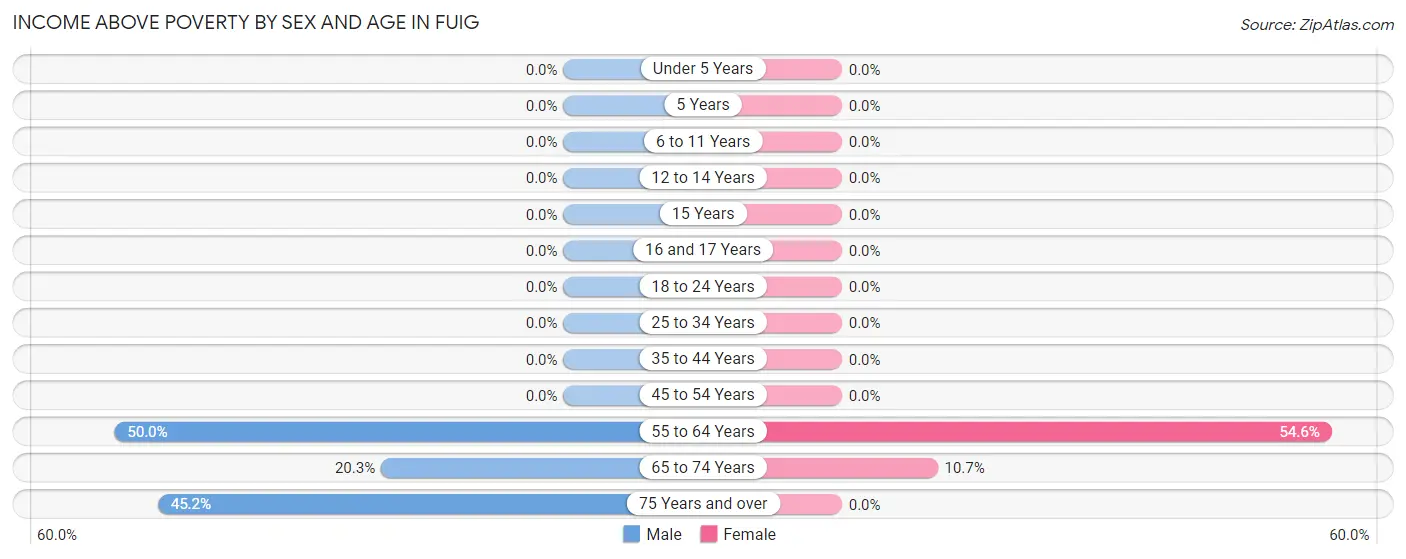
| Age Bracket | Male | Female |
| Under 5 Years | 0 (0.0%) | 0 (0.0%) |
| 5 Years | 0 (0.0%) | 0 (0.0%) |
| 6 to 11 Years | 0 (0.0%) | 0 (0.0%) |
| 12 to 14 Years | 0 (0.0%) | 0 (0.0%) |
| 15 Years | 0 (0.0%) | 0 (0.0%) |
| 16 and 17 Years | 0 (0.0%) | 0 (0.0%) |
| 18 to 24 Years | 0 (0.0%) | 0 (0.0%) |
| 25 to 34 Years | 0 (0.0%) | 0 (0.0%) |
| 35 to 44 Years | 0 (0.0%) | 0 (0.0%) |
| 45 to 54 Years | 0 (0.0%) | 0 (0.0%) |
| 55 to 64 Years | 21 (50.0%) | 36 (54.5%) |
| 65 to 74 Years | 13 (20.3%) | 13 (10.7%) |
| 75 Years and over | 14 (45.2%) | 0 (0.0%) |
| Total | 48 (13.8%) | 49 (7.4%) |
Income Below Poverty Among Married-Couple Families in Fuig
The poverty statistics for married-couple families in Fuig show that 61.6% or 45 of the total 73 families live below the poverty line. Families with 1 or 2 children have the highest poverty rate of 100.0%, comprising of 12 families. On the other hand, families with no children have the lowest poverty rate of 54.1%, which includes 33 families.
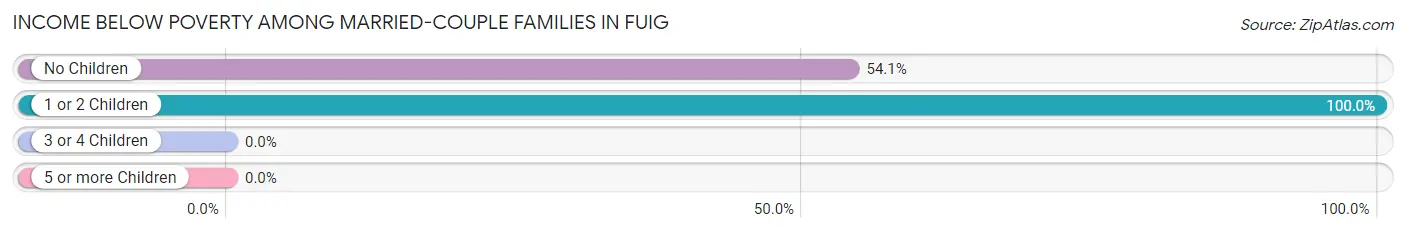
| Children | Above Poverty | Below Poverty |
| No Children | 28 (45.9%) | 33 (54.1%) |
| 1 or 2 Children | 0 (0.0%) | 12 (100.0%) |
| 3 or 4 Children | 0 (0.0%) | 0 (0.0%) |
| 5 or more Children | 0 (0.0%) | 0 (0.0%) |
| Total | 28 (38.4%) | 45 (61.6%) |
Income Below Poverty Among Single-Parent Households in Fuig
According to the poverty data in Fuig, 100.0% or 73 single-father households and 100.0% or 176 single-mother households are living below the poverty line. Among single-father households, those with no children have the highest poverty rate, with 12 households (100.0%) experiencing poverty. Likewise, among single-mother households, those with no children have the highest poverty rate, with 105 households (100.0%) falling below the poverty line.
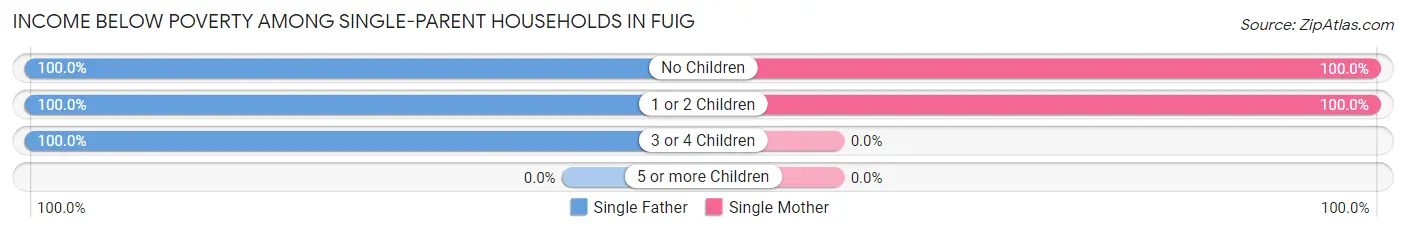
| Children | Single Father | Single Mother |
| No Children | 12 (100.0%) | 105 (100.0%) |
| 1 or 2 Children | 46 (100.0%) | 71 (100.0%) |
| 3 or 4 Children | 15 (100.0%) | 0 (0.0%) |
| 5 or more Children | 0 (0.0%) | 0 (0.0%) |
| Total | 73 (100.0%) | 176 (100.0%) |
Income Below Poverty Among Married-Couple vs Single-Parent Households in Fuig
The poverty data for Fuig shows that 45 of the married-couple family households (61.6%) and 249 of the single-parent households (100.0%) are living below the poverty level. Within the married-couple family households, those with 1 or 2 children have the highest poverty rate, with 12 households (100.0%) falling below the poverty line. Among the single-parent households, those with no children have the highest poverty rate, with 117 household (100.0%) living below poverty.
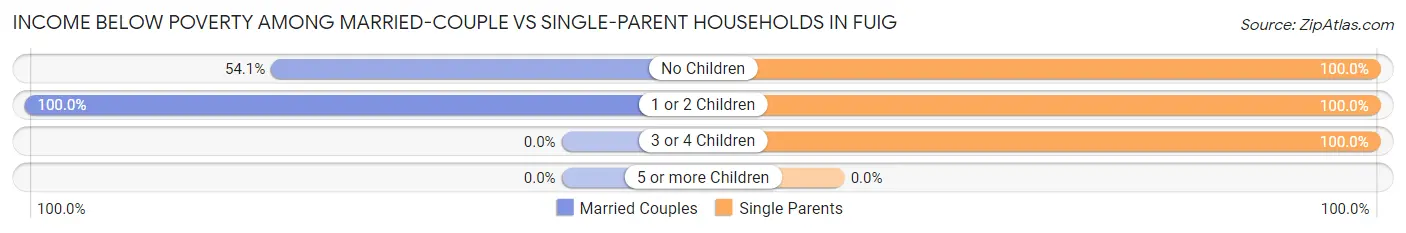
| Children | Married-Couple Families | Single-Parent Households |
| No Children | 33 (54.1%) | 117 (100.0%) |
| 1 or 2 Children | 12 (100.0%) | 117 (100.0%) |
| 3 or 4 Children | 0 (0.0%) | 15 (100.0%) |
| 5 or more Children | 0 (0.0%) | 0 (0.0%) |
| Total | 45 (61.6%) | 249 (100.0%) |
Race in Fuig
The most populous races in Fuig are Hispanic or Latino (1,005 | 99.5%), White / Caucasian (576 | 57.0%), and Some other Race (264 | 26.1%).
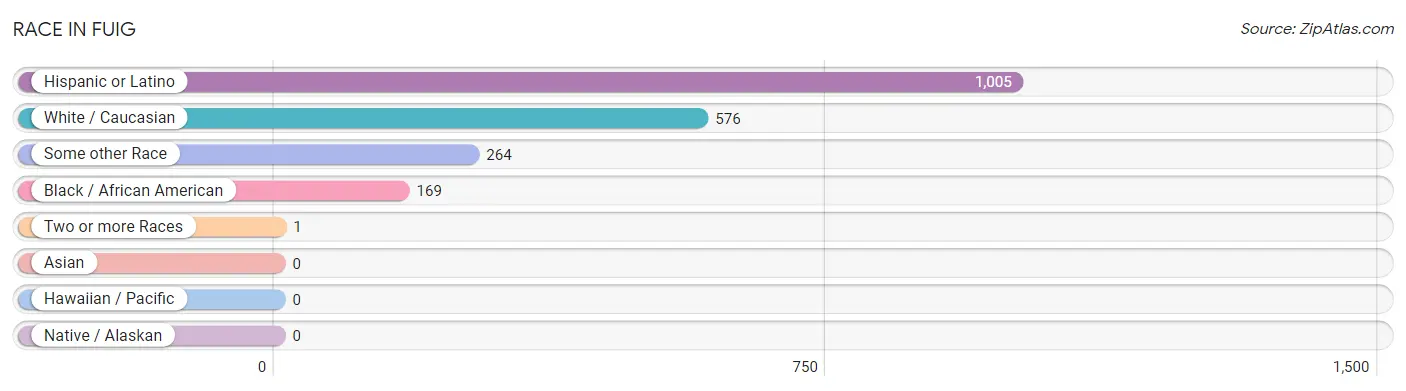
| Race | # Population | % Population |
| Asian | 0 | 0.0% |
| Black / African American | 169 | 16.7% |
| Hawaiian / Pacific | 0 | 0.0% |
| Hispanic or Latino | 1,005 | 99.5% |
| Native / Alaskan | 0 | 0.0% |
| White / Caucasian | 576 | 57.0% |
| Two or more Races | 1 | 0.1% |
| Some other Race | 264 | 26.1% |
| Total | 1,010 | 100.0% |
Ancestry in Fuig
The most populous ancestries reported in Fuig are Puerto Rican (1,002 | 99.2%), German (5 | 0.5%), and Spaniard (3 | 0.3%), together accounting for 100.0% of all Fuig residents.
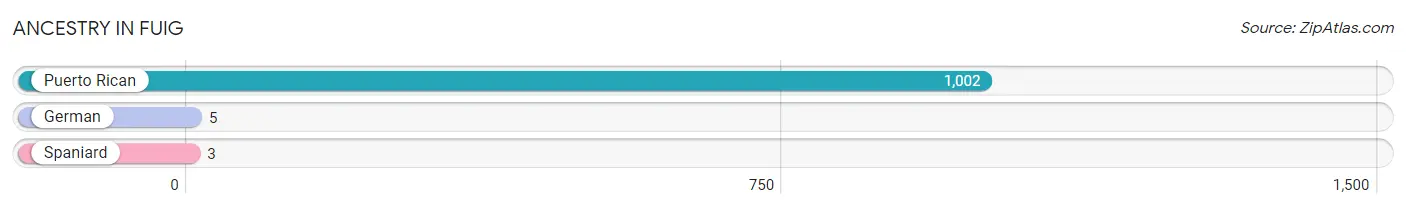
| Ancestry | # Population | % Population |
| German | 5 | 0.5% |
| Puerto Rican | 1,002 | 99.2% |
| Spaniard | 3 | 0.3% | View All 3 Rows |
Immigrants in Fuig

| Immigration Origin | # Population | % Population | View All 0 Rows |
Sex and Age in Fuig
Sex and Age in Fuig
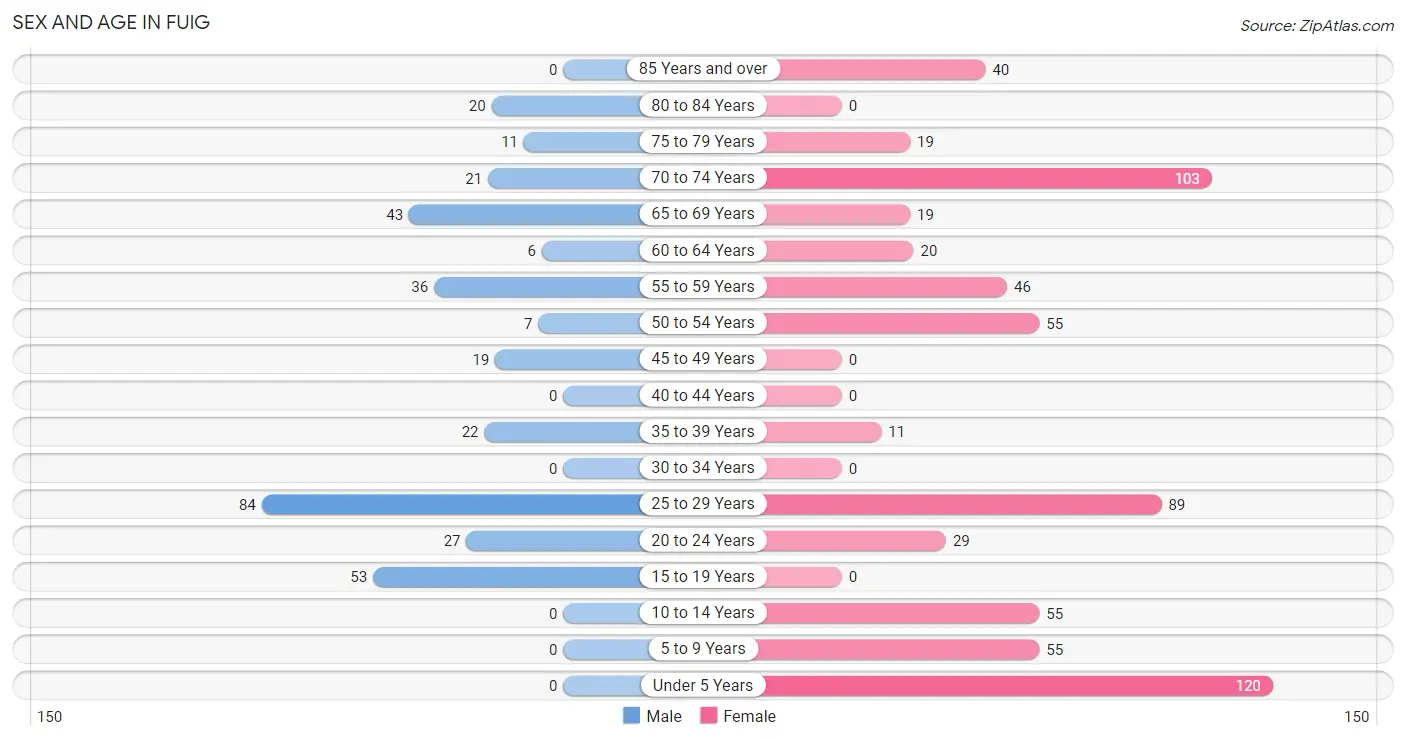
The most populous age groups in Fuig are 25 to 29 Years (84 | 24.1%) for men and Under 5 Years (120 | 18.1%) for women.
| Age Bracket | Male | Female |
| Under 5 Years | 0 (0.0%) | 120 (18.1%) |
| 5 to 9 Years | 0 (0.0%) | 55 (8.3%) |
| 10 to 14 Years | 0 (0.0%) | 55 (8.3%) |
| 15 to 19 Years | 53 (15.2%) | 0 (0.0%) |
| 20 to 24 Years | 27 (7.7%) | 29 (4.4%) |
| 25 to 29 Years | 84 (24.1%) | 89 (13.5%) |
| 30 to 34 Years | 0 (0.0%) | 0 (0.0%) |
| 35 to 39 Years | 22 (6.3%) | 11 (1.7%) |
| 40 to 44 Years | 0 (0.0%) | 0 (0.0%) |
| 45 to 49 Years | 19 (5.4%) | 0 (0.0%) |
| 50 to 54 Years | 7 (2.0%) | 55 (8.3%) |
| 55 to 59 Years | 36 (10.3%) | 46 (7.0%) |
| 60 to 64 Years | 6 (1.7%) | 20 (3.0%) |
| 65 to 69 Years | 43 (12.3%) | 19 (2.9%) |
| 70 to 74 Years | 21 (6.0%) | 103 (15.6%) |
| 75 to 79 Years | 11 (3.2%) | 19 (2.9%) |
| 80 to 84 Years | 20 (5.7%) | 0 (0.0%) |
| 85 Years and over | 0 (0.0%) | 40 (6.0%) |
| Total | 349 (100.0%) | 661 (100.0%) |
Families and Households in Fuig
Median Family Size in Fuig
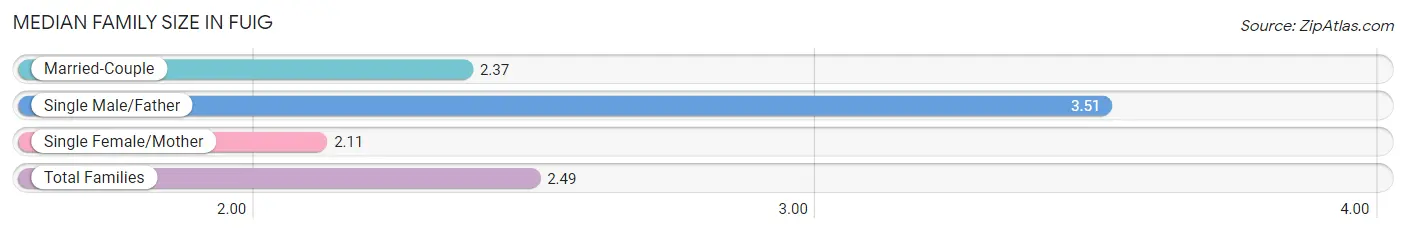
The median family size in Fuig is 2.49 persons per family, with single male/father families (73 | 22.7%) accounting for the largest median family size of 3.51 persons per family. On the other hand, single female/mother families (176 | 54.7%) represent the smallest median family size with 2.11 persons per family.
| Family Type | # Families | Family Size |
| Married-Couple | 73 (22.7%) | 2.37 |
| Single Male/Father | 73 (22.7%) | 3.51 |
| Single Female/Mother | 176 (54.7%) | 2.11 |
| Total Families | 322 (100.0%) | 2.49 |
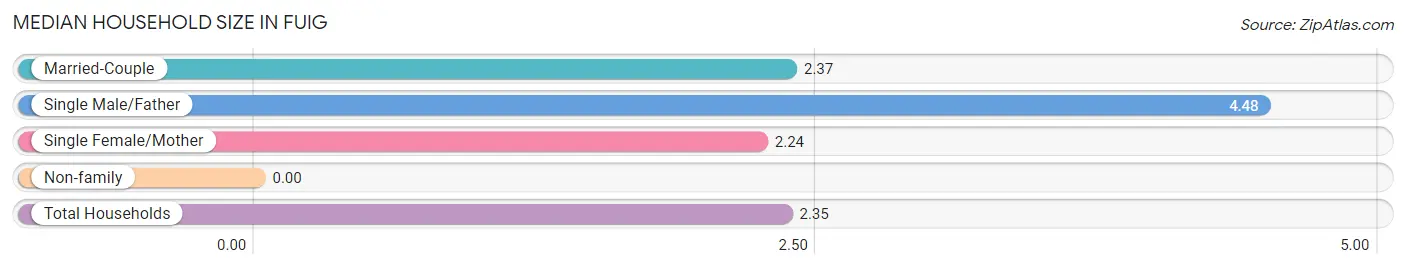
Median Household Size in Fuig
| Household Type | # Households | Household Size |
| Married-Couple | 73 (17.2%) | 2.37 |
| Single Male/Father | 73 (17.2%) | 4.48 |
| Single Female/Mother | 176 (41.5%) | 2.24 |
| Non-family | 102 (24.1%) | - |
| Total Households | 424 (100.0%) | 2.35 |
Household Size by Marriage Status in Fuig
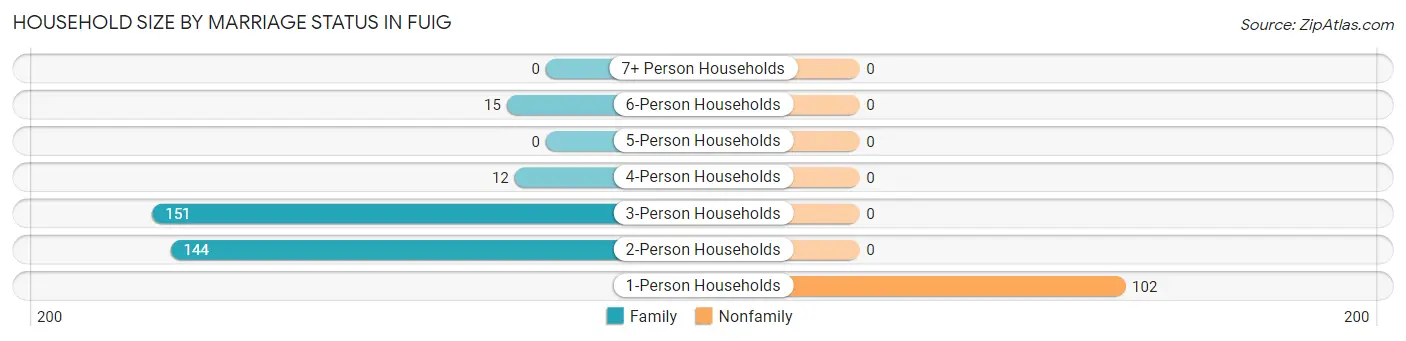
Out of a total of 424 households in Fuig, 322 (75.9%) are family households, while 102 (24.1%) are nonfamily households. The most numerous type of family households are 3-person households, comprising 151, and the most common type of nonfamily households are 1-person households, comprising 102.
| Household Size | Family Households | Nonfamily Households |
| 1-Person Households | - | 102 (24.1%) |
| 2-Person Households | 144 (34.0%) | 0 (0.0%) |
| 3-Person Households | 151 (35.6%) | 0 (0.0%) |
| 4-Person Households | 12 (2.8%) | 0 (0.0%) |
| 5-Person Households | 0 (0.0%) | 0 (0.0%) |
| 6-Person Households | 15 (3.5%) | 0 (0.0%) |
| 7+ Person Households | 0 (0.0%) | 0 (0.0%) |
| Total | 322 (75.9%) | 102 (24.1%) |
Female Fertility in Fuig
Fertility by Age in Fuig
Average fertility rate in Fuig is 203.0 births per 1,000 women. Women in the age bracket of 20 to 34 years have the highest fertility rate with 246.0 births per 1,000 women. Women in the age bracket of 20 to 34 years acount for 100.0% of all women with births.
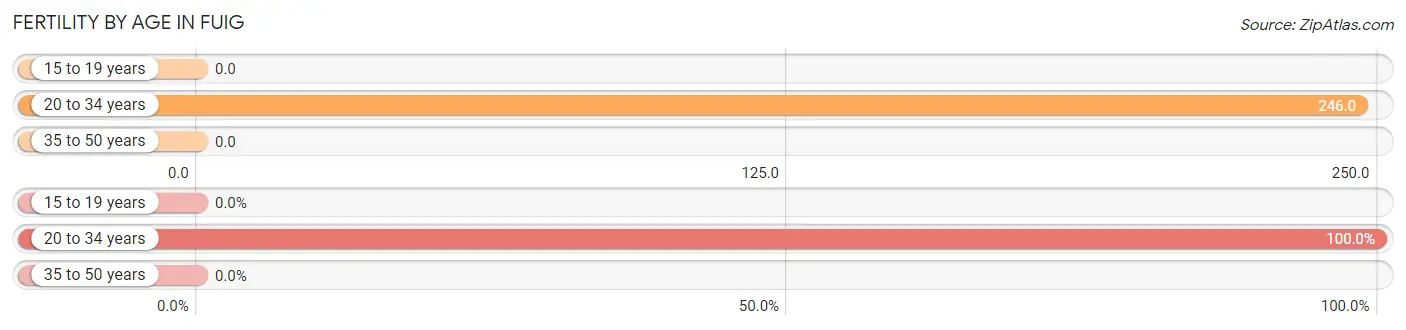
| Age Bracket | Women with Births | Births / 1,000 Women |
| 15 to 19 years | 0 (0.0%) | 0.0 |
| 20 to 34 years | 29 (100.0%) | 246.0 |
| 35 to 50 years | 0 (0.0%) | 0.0 |
| Total | 29 (100.0%) | 203.0 |
Fertility by Age by Marriage Status in Fuig
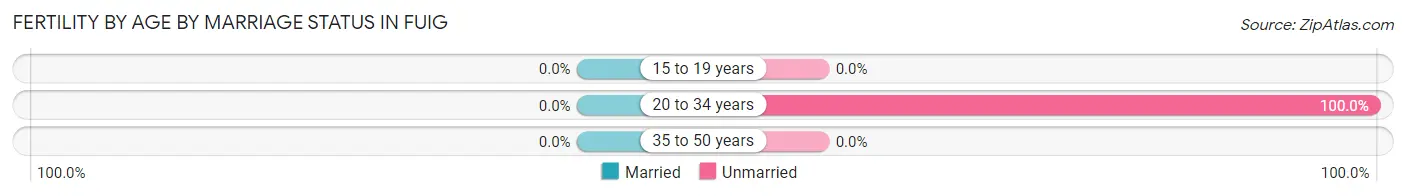
| Age Bracket | Married | Unmarried |
| 15 to 19 years | 0 (0.0%) | 0 (0.0%) |
| 20 to 34 years | 0 (0.0%) | 29 (100.0%) |
| 35 to 50 years | 0 (0.0%) | 0 (0.0%) |
| Total | 0 (0.0%) | 29 (100.0%) |
Fertility by Education in Fuig
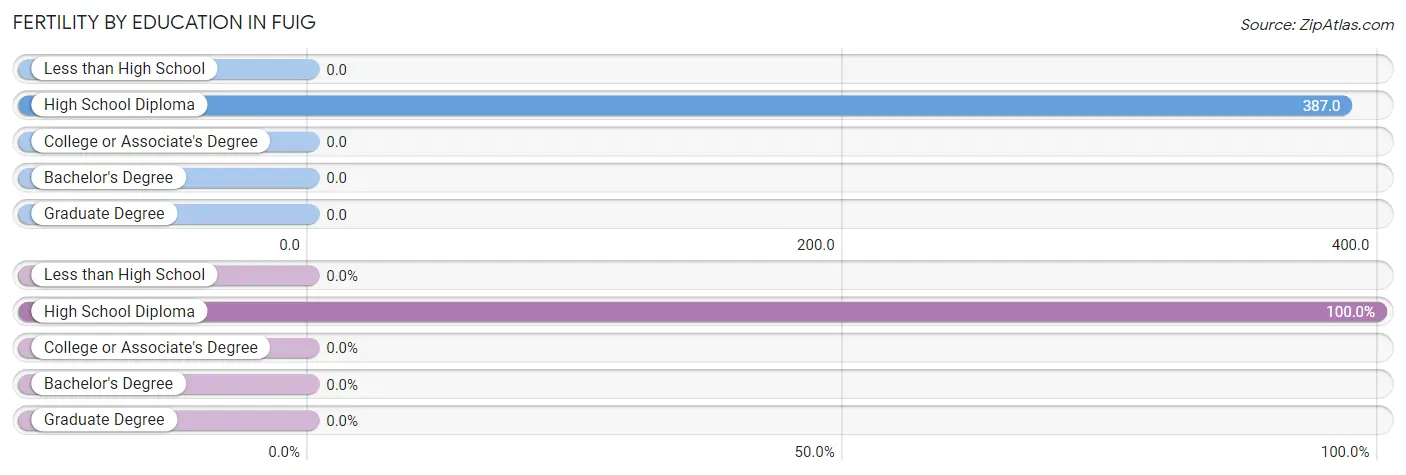
| Educational Attainment | Women with Births | Births / 1,000 Women |
| Less than High School | 0 (0.0%) | 0.0 |
| High School Diploma | 29 (100.0%) | 387.0 |
| College or Associate's Degree | 0 (0.0%) | 0.0 |
| Bachelor's Degree | 0 (0.0%) | 0.0 |
| Graduate Degree | 0 (0.0%) | 0.0 |
| Total | 29 (100.0%) | 203.0 |
Fertility by Education by Marriage Status in Fuig
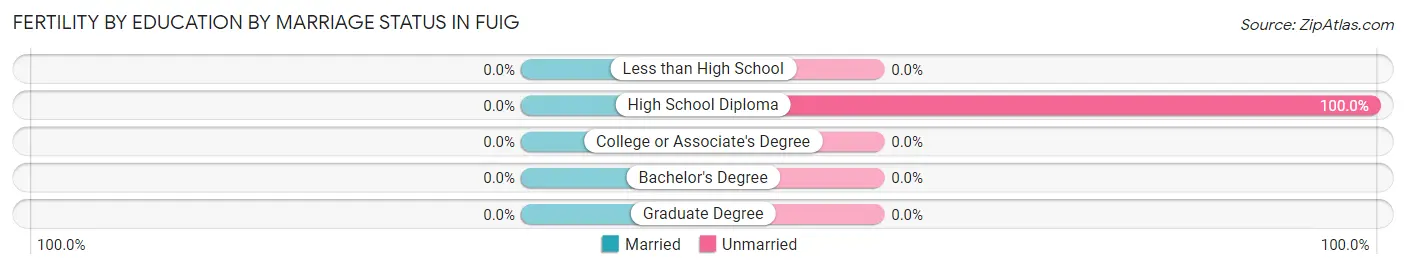
| Educational Attainment | Married | Unmarried |
| Less than High School | 0 (0.0%) | 0 (0.0%) |
| High School Diploma | 0 (0.0%) | 29 (100.0%) |
| College or Associate's Degree | 0 (0.0%) | 0 (0.0%) |
| Bachelor's Degree | 0 (0.0%) | 0 (0.0%) |
| Graduate Degree | 0 (0.0%) | 0 (0.0%) |
| Total | 0 (0.0%) | 29 (100.0%) |
Employment Characteristics in Fuig
Employment by Class of Employer in Fuig
Among the 121 employed individuals in Fuig, private company employees (106 | 87.6%), state government employees (12 | 9.9%), and not-for-profit organizations (3 | 2.5%) make up the most common classes of employment.
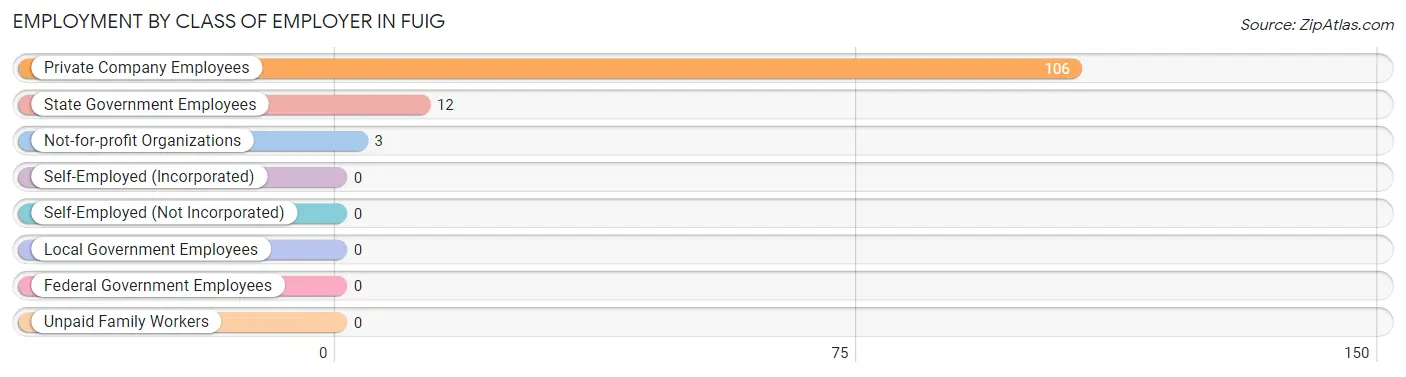
| Employer Class | # Employees | % Employees |
| Private Company Employees | 106 | 87.6% |
| Self-Employed (Incorporated) | 0 | 0.0% |
| Self-Employed (Not Incorporated) | 0 | 0.0% |
| Not-for-profit Organizations | 3 | 2.5% |
| Local Government Employees | 0 | 0.0% |
| State Government Employees | 12 | 9.9% |
| Federal Government Employees | 0 | 0.0% |
| Unpaid Family Workers | 0 | 0.0% |
| Total | 121 | 100.0% |
Employment Status by Age in Fuig
According to the labor force statistics for Fuig, out of the total population over 16 years of age (770), 30.5% or 235 individuals are in the labor force, with 48.5% or 114 of them unemployed. The age group with the highest labor force participation rate is 16 to 19 years, with 100.0% or 43 individuals in the labor force. Within the labor force, the 16 to 19 years age range has the highest percentage of unemployed individuals, with 100.0% or 43 of them being unemployed.
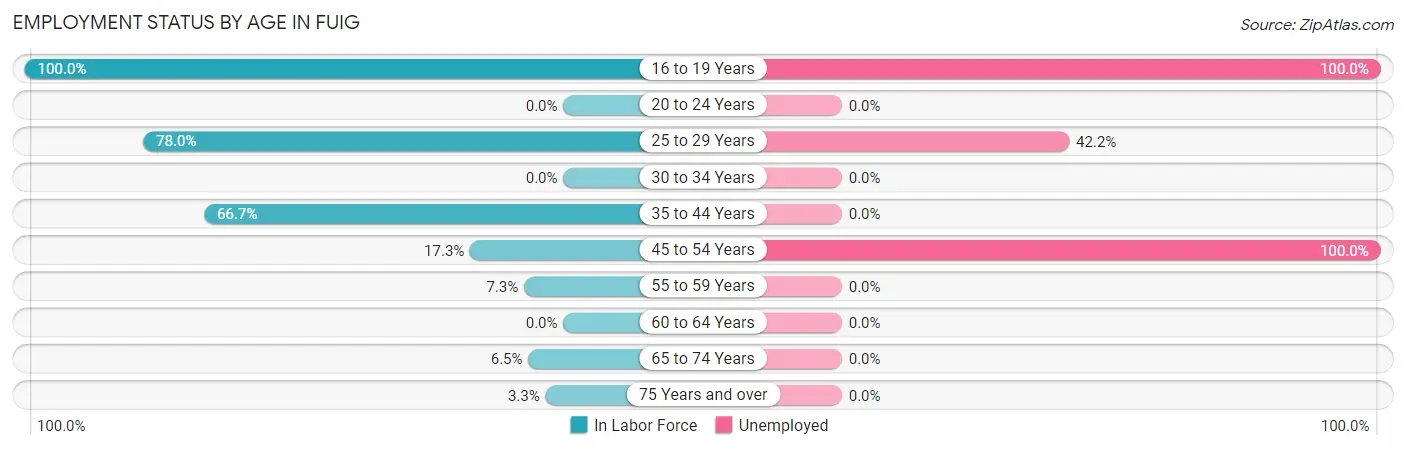
| Age Bracket | In Labor Force | Unemployed |
| 16 to 19 Years | 43 (100.0%) | 43 (100.0%) |
| 20 to 24 Years | 0 (0.0%) | 0 (0.0%) |
| 25 to 29 Years | 135 (78.0%) | 57 (42.2%) |
| 30 to 34 Years | 0 (0.0%) | 0 (0.0%) |
| 35 to 44 Years | 22 (66.7%) | 0 (0.0%) |
| 45 to 54 Years | 14 (17.3%) | 14 (100.0%) |
| 55 to 59 Years | 6 (7.3%) | 0 (0.0%) |
| 60 to 64 Years | 0 (0.0%) | 0 (0.0%) |
| 65 to 74 Years | 12 (6.5%) | 0 (0.0%) |
| 75 Years and over | 3 (3.3%) | 0 (0.0%) |
| Total | 235 (30.5%) | 114 (48.5%) |
Employment Status by Educational Attainment in Fuig
According to labor force statistics for Fuig, 44.8% of individuals (177) out of the total population between 25 and 64 years of age (395) are in the labor force, with 40.1% or 71 of them being unemployed. The group with the highest labor force participation rate are those with the educational attainment of college / associate degree, with 71.3% or 57 individuals in the labor force. Within the labor force, individuals with college / associate degree education have the highest percentage of unemployment, with 100.0% or 57 of them being unemployed.
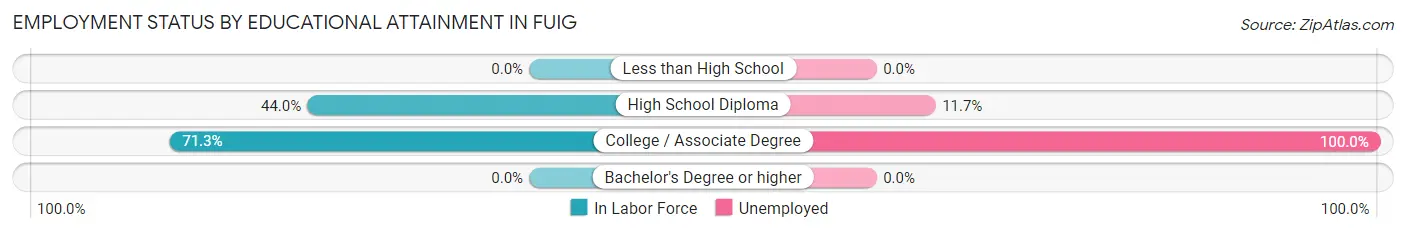
| Educational Attainment | In Labor Force | Unemployed |
| Less than High School | 0 (0.0%) | 0 (0.0%) |
| High School Diploma | 120 (44.0%) | 32 (11.7%) |
| College / Associate Degree | 57 (71.3%) | 80 (100.0%) |
| Bachelor's Degree or higher | 0 (0.0%) | 0 (0.0%) |
| Total | 177 (44.8%) | 158 (40.1%) |
Employment Occupations by Sex in Fuig
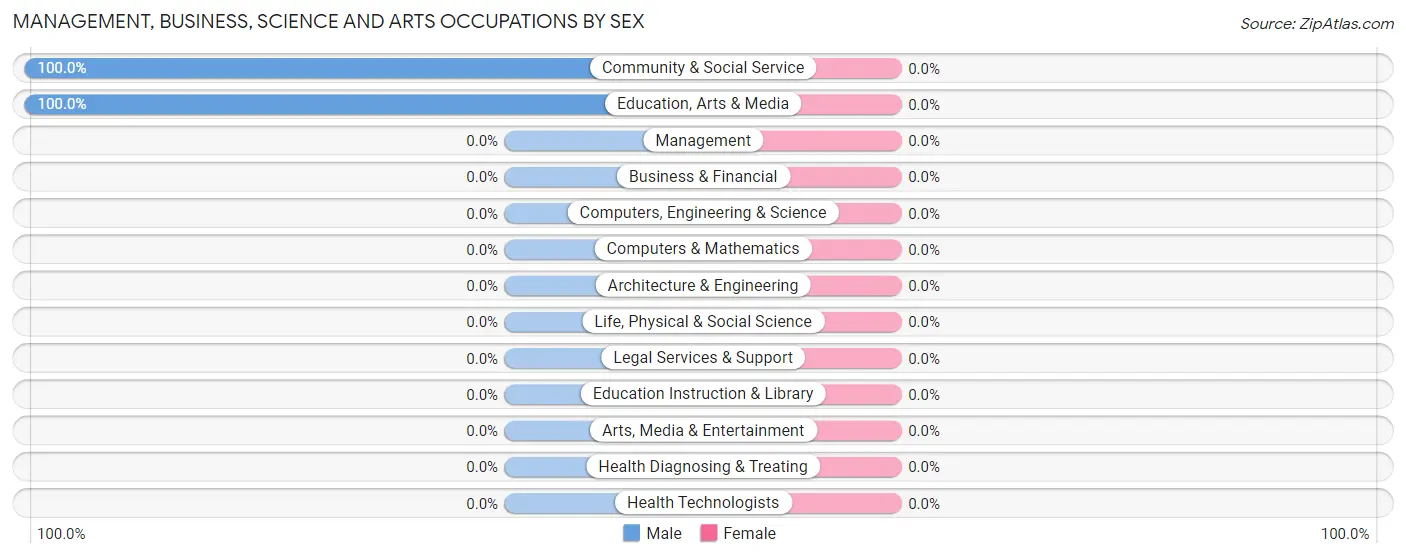
Management, Business, Science and Arts Occupations
The most common Management, Business, Science and Arts occupations in Fuig are Community & Social Service (3 | 2.5%), and Education, Arts & Media (3 | 2.5%).
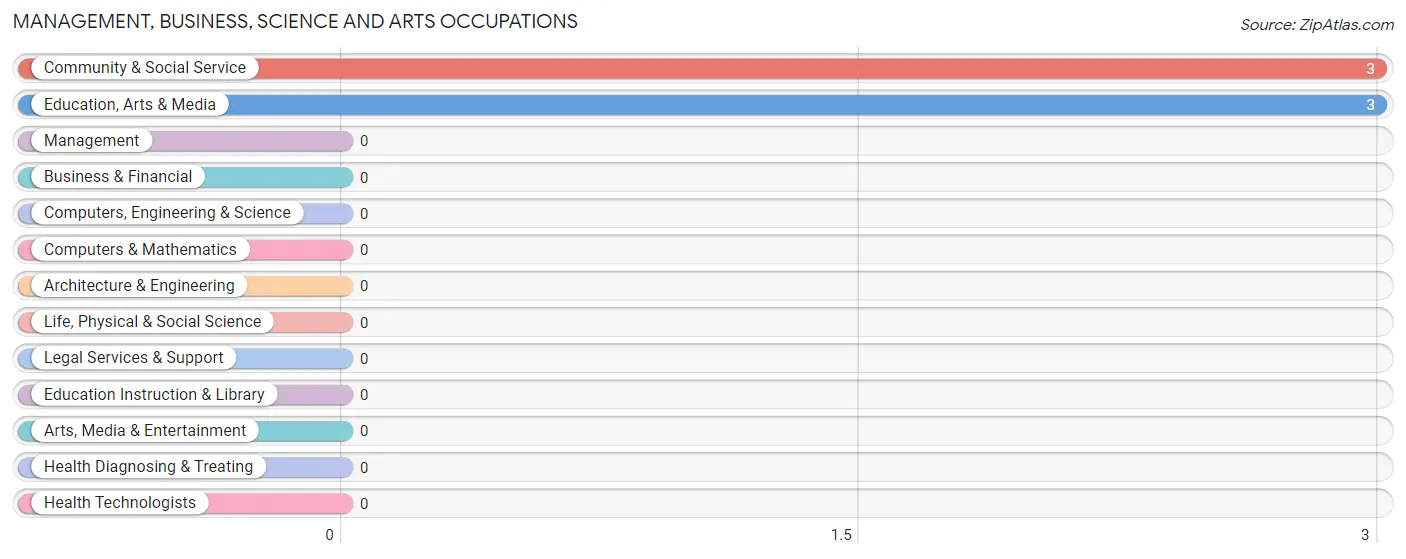
Management, Business, Science and Arts Occupations by Sex
| Occupation | Male | Female |
| Management | 0 (0.0%) | 0 (0.0%) |
| Business & Financial | 0 (0.0%) | 0 (0.0%) |
| Computers, Engineering & Science | 0 (0.0%) | 0 (0.0%) |
| Computers & Mathematics | 0 (0.0%) | 0 (0.0%) |
| Architecture & Engineering | 0 (0.0%) | 0 (0.0%) |
| Life, Physical & Social Science | 0 (0.0%) | 0 (0.0%) |
| Community & Social Service | 3 (100.0%) | 0 (0.0%) |
| Education, Arts & Media | 3 (100.0%) | 0 (0.0%) |
| Legal Services & Support | 0 (0.0%) | 0 (0.0%) |
| Education Instruction & Library | 0 (0.0%) | 0 (0.0%) |
| Arts, Media & Entertainment | 0 (0.0%) | 0 (0.0%) |
| Health Diagnosing & Treating | 0 (0.0%) | 0 (0.0%) |
| Health Technologists | 0 (0.0%) | 0 (0.0%) |
| Total (Category) | 3 (100.0%) | 0 (0.0%) |
| Total (Overall) | 89 (73.6%) | 32 (26.5%) |
Services Occupations
Services Occupations by Sex
| Occupation | Male | Female |
| Healthcare Support | 0 (0.0%) | 0 (0.0%) |
| Security & Protection | 0 (0.0%) | 0 (0.0%) |
| Firefighting & Prevention | 0 (0.0%) | 0 (0.0%) |
| Law Enforcement | 0 (0.0%) | 0 (0.0%) |
| Food Preparation & Serving | 0 (0.0%) | 0 (0.0%) |
| Cleaning & Maintenance | 0 (0.0%) | 0 (0.0%) |
| Personal Care & Service | 0 (0.0%) | 0 (0.0%) |
| Total (Category) | 0 (0.0%) | 0 (0.0%) |
| Total (Overall) | 89 (73.6%) | 32 (26.5%) |
Sales and Office Occupations
The most common Sales and Office occupations in Fuig are , and Sales & Related (38 | 31.4%).
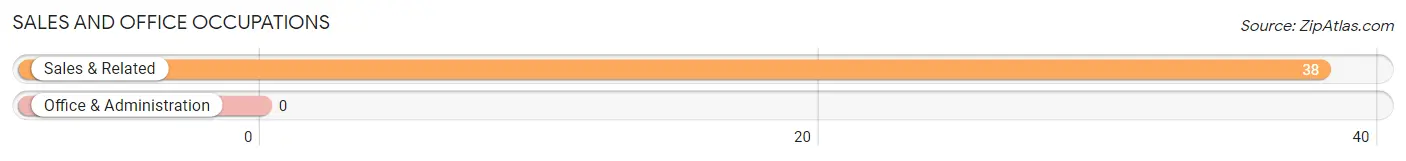
Sales and Office Occupations by Sex
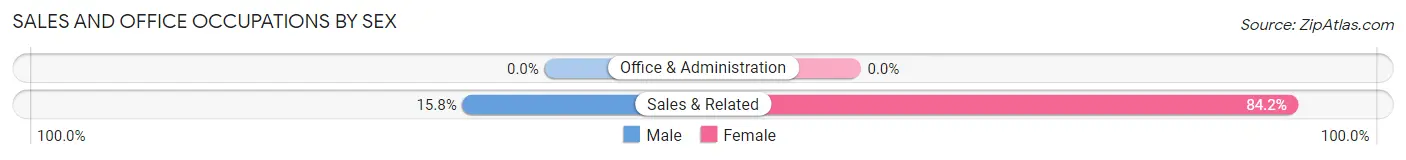
| Occupation | Male | Female |
| Sales & Related | 6 (15.8%) | 32 (84.2%) |
| Office & Administration | 0 (0.0%) | 0 (0.0%) |
| Total (Category) | 6 (15.8%) | 32 (84.2%) |
| Total (Overall) | 89 (73.6%) | 32 (26.5%) |
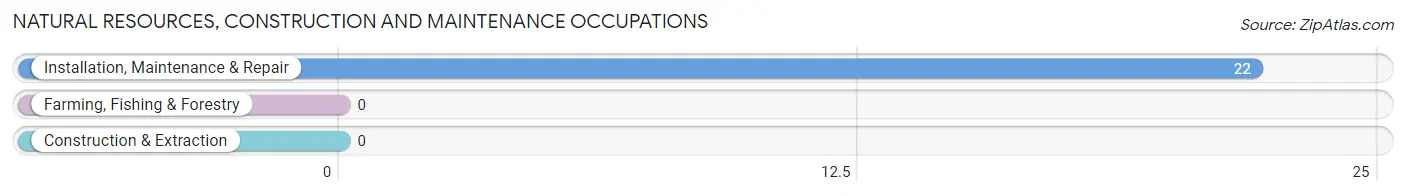
Natural Resources, Construction and Maintenance Occupations
The most common Natural Resources, Construction and Maintenance occupations in Fuig are , and Installation, Maintenance & Repair (22 | 18.2%).
Natural Resources, Construction and Maintenance Occupations by Sex
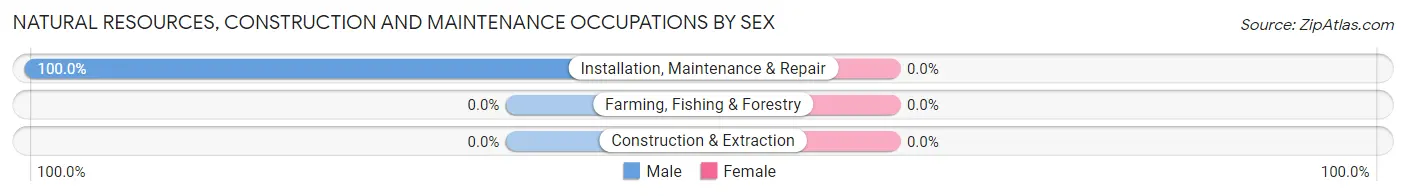
| Occupation | Male | Female |
| Farming, Fishing & Forestry | 0 (0.0%) | 0 (0.0%) |
| Construction & Extraction | 0 (0.0%) | 0 (0.0%) |
| Installation, Maintenance & Repair | 22 (100.0%) | 0 (0.0%) |
| Total (Category) | 22 (100.0%) | 0 (0.0%) |
| Total (Overall) | 89 (73.6%) | 32 (26.5%) |
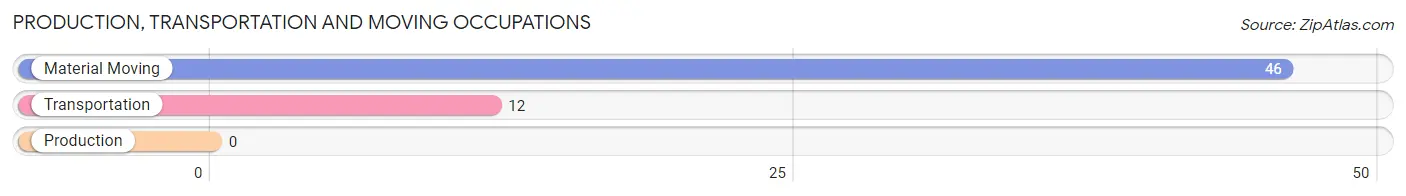
Production, Transportation and Moving Occupations
The most common Production, Transportation and Moving occupations in Fuig are Material Moving (46 | 38.0%), and Transportation (12 | 9.9%).
Production, Transportation and Moving Occupations by Sex
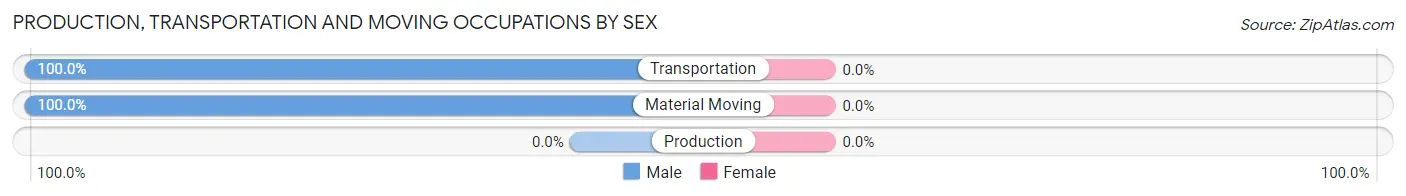
| Occupation | Male | Female |
| Production | 0 (0.0%) | 0 (0.0%) |
| Transportation | 12 (100.0%) | 0 (0.0%) |
| Material Moving | 46 (100.0%) | 0 (0.0%) |
| Total (Category) | 58 (100.0%) | 0 (0.0%) |
| Total (Overall) | 89 (73.6%) | 32 (26.5%) |
Employment Industries by Sex in Fuig
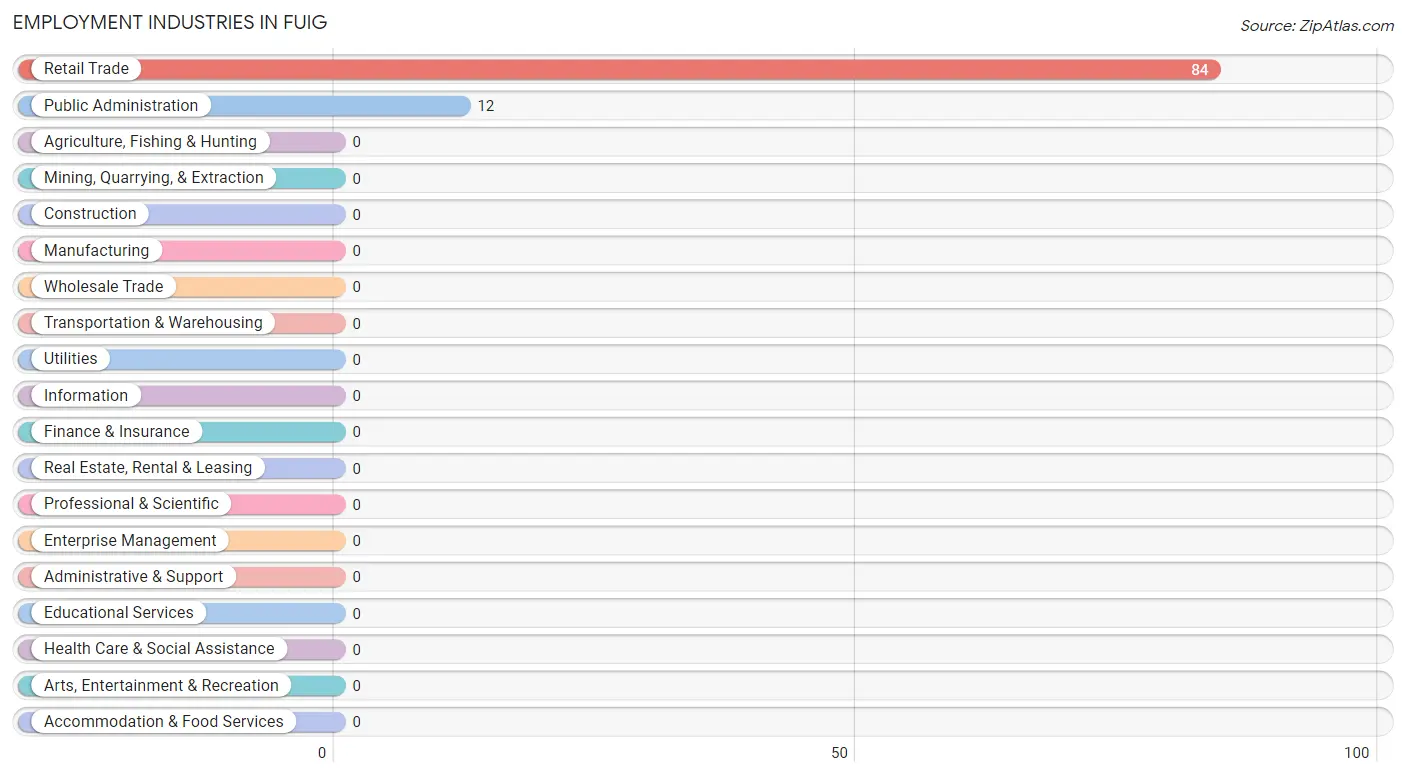
Employment Industries in Fuig
The major employment industries in Fuig include Retail Trade (84 | 69.4%), and Public Administration (12 | 9.9%).
Employment Industries by Sex in Fuig
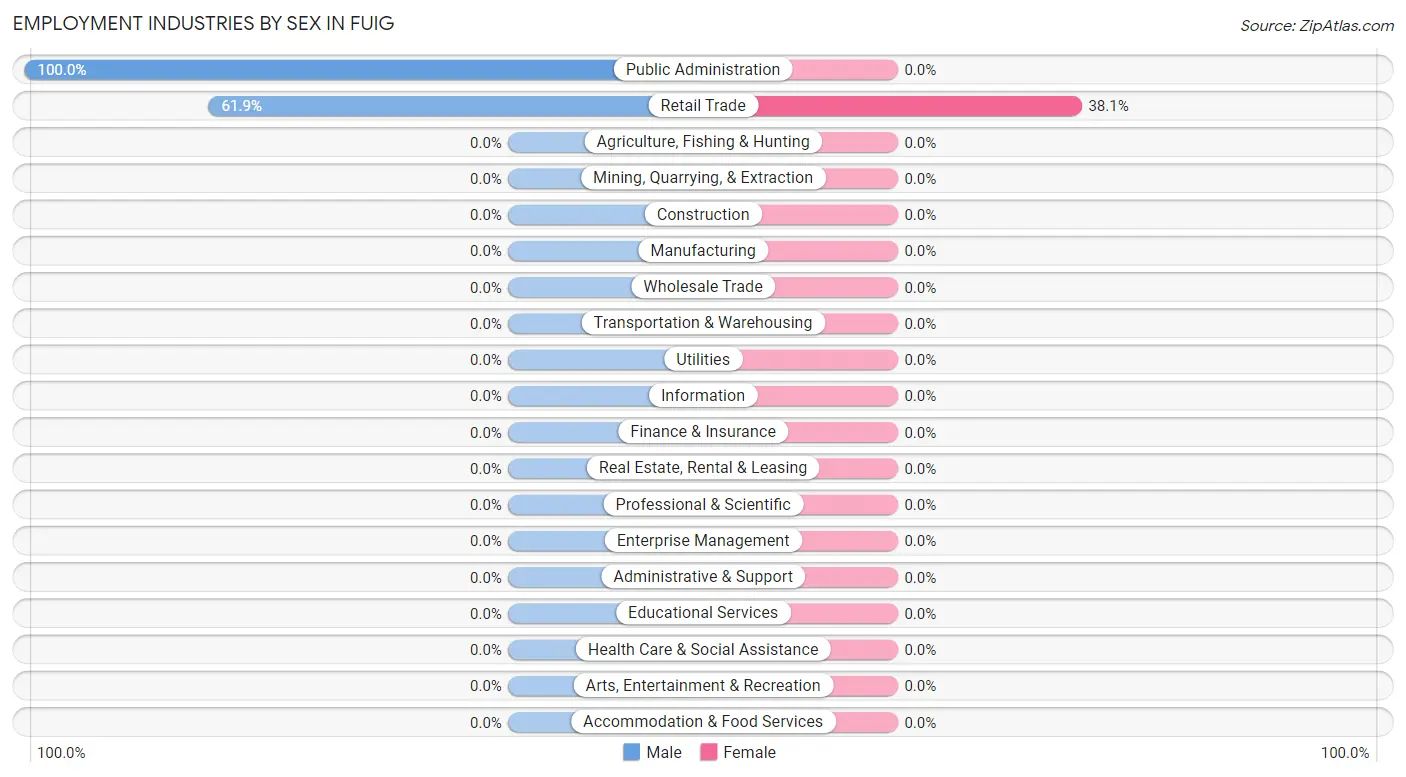
| Industry | Male | Female |
| Agriculture, Fishing & Hunting | 0 (0.0%) | 0 (0.0%) |
| Mining, Quarrying, & Extraction | 0 (0.0%) | 0 (0.0%) |
| Construction | 0 (0.0%) | 0 (0.0%) |
| Manufacturing | 0 (0.0%) | 0 (0.0%) |
| Wholesale Trade | 0 (0.0%) | 0 (0.0%) |
| Retail Trade | 52 (61.9%) | 32 (38.1%) |
| Transportation & Warehousing | 0 (0.0%) | 0 (0.0%) |
| Utilities | 0 (0.0%) | 0 (0.0%) |
| Information | 0 (0.0%) | 0 (0.0%) |
| Finance & Insurance | 0 (0.0%) | 0 (0.0%) |
| Real Estate, Rental & Leasing | 0 (0.0%) | 0 (0.0%) |
| Professional & Scientific | 0 (0.0%) | 0 (0.0%) |
| Enterprise Management | 0 (0.0%) | 0 (0.0%) |
| Administrative & Support | 0 (0.0%) | 0 (0.0%) |
| Educational Services | 0 (0.0%) | 0 (0.0%) |
| Health Care & Social Assistance | 0 (0.0%) | 0 (0.0%) |
| Arts, Entertainment & Recreation | 0 (0.0%) | 0 (0.0%) |
| Accommodation & Food Services | 0 (0.0%) | 0 (0.0%) |
| Public Administration | 12 (100.0%) | 0 (0.0%) |
| Total | 89 (73.6%) | 32 (26.5%) |
Education in Fuig
School Enrollment in Fuig
The most common levels of schooling among the 149 students in Fuig are elementary school (55 | 36.9%), middle school (55 | 36.9%), and college / undergraduate (25 | 16.8%).
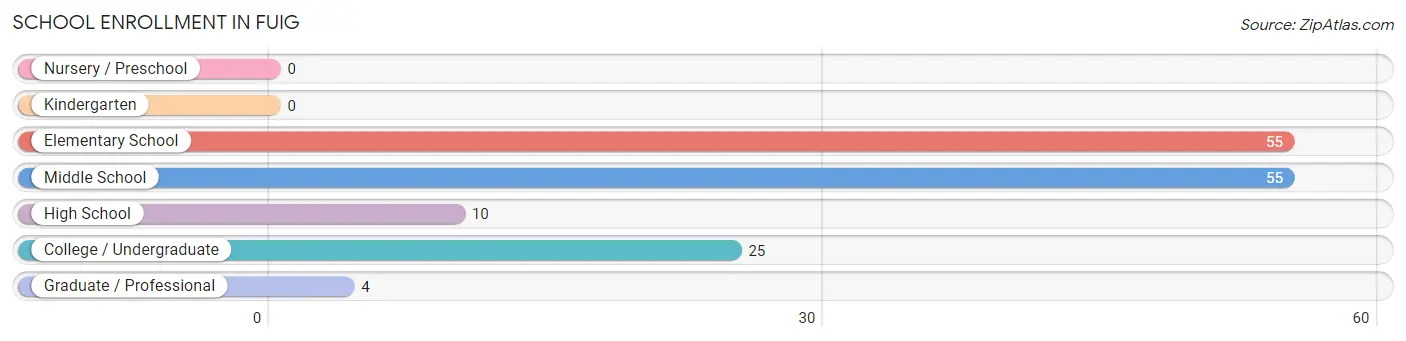
| School Level | # Students | % Students |
| Nursery / Preschool | 0 | 0.0% |
| Kindergarten | 0 | 0.0% |
| Elementary School | 55 | 36.9% |
| Middle School | 55 | 36.9% |
| High School | 10 | 6.7% |
| College / Undergraduate | 25 | 16.8% |
| Graduate / Professional | 4 | 2.7% |
| Total | 149 | 100.0% |
School Enrollment by Age by Funding Source in Fuig
Out of a total of 149 students who are enrolled in schools in Fuig, 4 (2.7%) attend a private institution, while the remaining 145 (97.3%) are enrolled in public schools. The age group of 35 years and over has the highest likelihood of being enrolled in private schools, with 4 (100.0% in the age bracket) enrolled. Conversely, the age group of 5 to 9 year old has the lowest likelihood of being enrolled in a private school, with 55 (100.0% in the age bracket) attending a public institution.
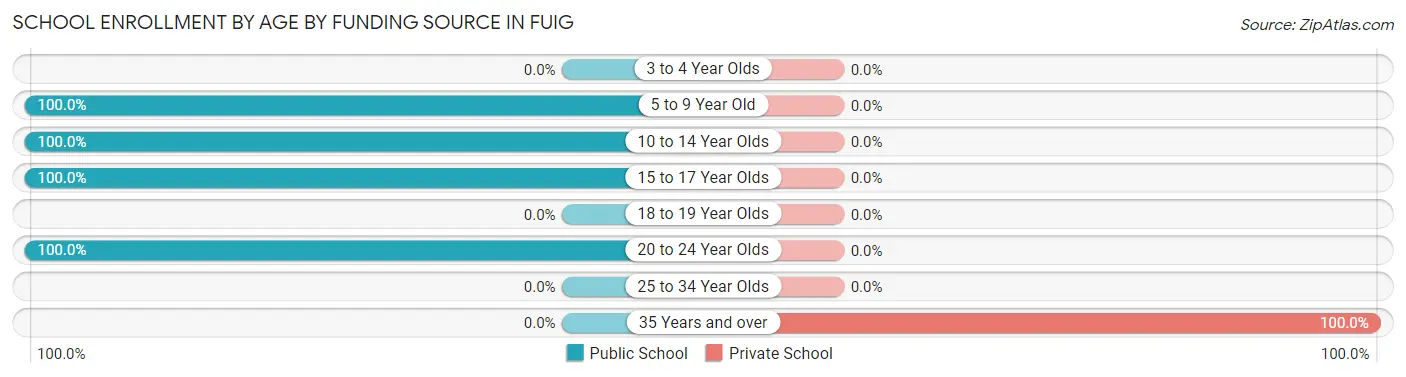
| Age Bracket | Public School | Private School |
| 3 to 4 Year Olds | 0 (0.0%) | 0 (0.0%) |
| 5 to 9 Year Old | 55 (100.0%) | 0 (0.0%) |
| 10 to 14 Year Olds | 55 (100.0%) | 0 (0.0%) |
| 15 to 17 Year Olds | 10 (100.0%) | 0 (0.0%) |
| 18 to 19 Year Olds | 0 (0.0%) | 0 (0.0%) |
| 20 to 24 Year Olds | 25 (100.0%) | 0 (0.0%) |
| 25 to 34 Year Olds | 0 (0.0%) | 0 (0.0%) |
| 35 Years and over | 0 (0.0%) | 4 (100.0%) |
| Total | 145 (97.3%) | 4 (2.7%) |
Educational Attainment by Field of Study in Fuig
Education (35 | 42.2%), business (16 | 19.3%), psychology (11 | 13.3%), arts & humanities (10 | 12.0%), and social sciences (8 | 9.6%) are the most common fields of study among 83 individuals in Fuig who have obtained a bachelor's degree or higher.
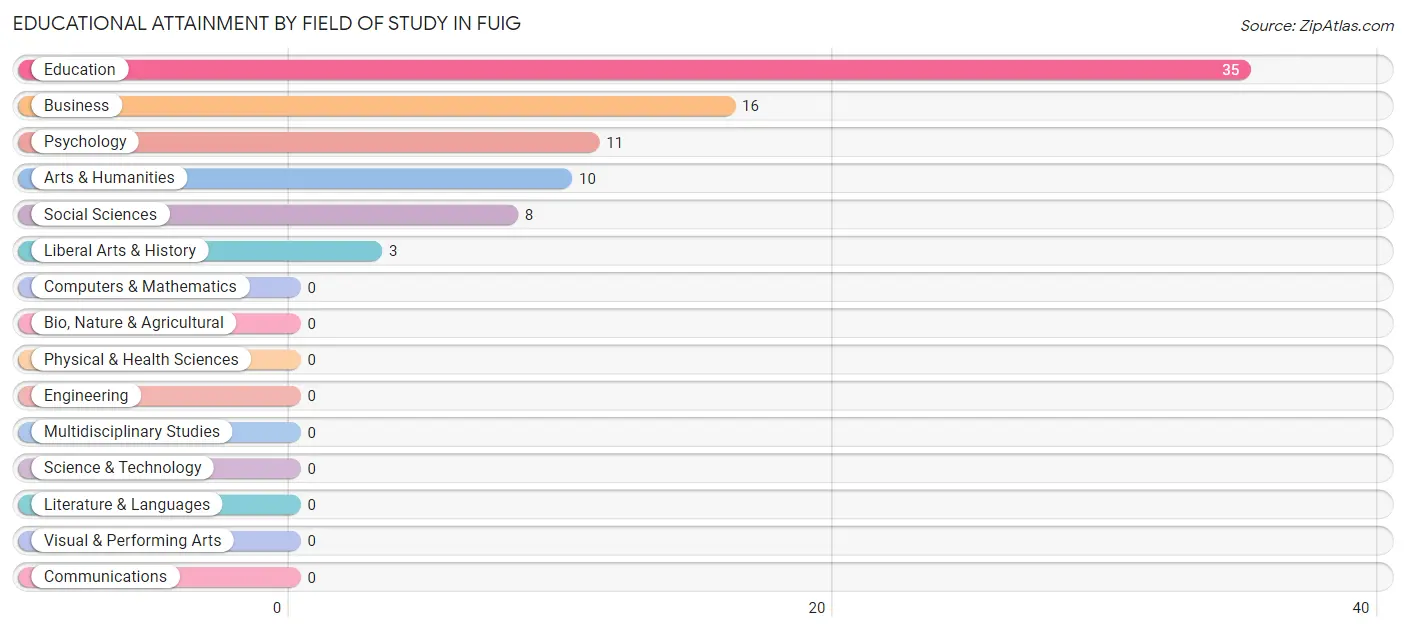
| Field of Study | # Graduates | % Graduates |
| Computers & Mathematics | 0 | 0.0% |
| Bio, Nature & Agricultural | 0 | 0.0% |
| Physical & Health Sciences | 0 | 0.0% |
| Psychology | 11 | 13.3% |
| Social Sciences | 8 | 9.6% |
| Engineering | 0 | 0.0% |
| Multidisciplinary Studies | 0 | 0.0% |
| Science & Technology | 0 | 0.0% |
| Business | 16 | 19.3% |
| Education | 35 | 42.2% |
| Literature & Languages | 0 | 0.0% |
| Liberal Arts & History | 3 | 3.6% |
| Visual & Performing Arts | 0 | 0.0% |
| Communications | 0 | 0.0% |
| Arts & Humanities | 10 | 12.0% |
| Total | 83 | 100.0% |
Transportation & Commute in Fuig
Vehicle Availability by Sex in Fuig
The most prevalent vehicle ownership categories in Fuig are males with 1 vehicle (74, accounting for 86.1%) and females with 1 vehicle (32, making up 231.2%).
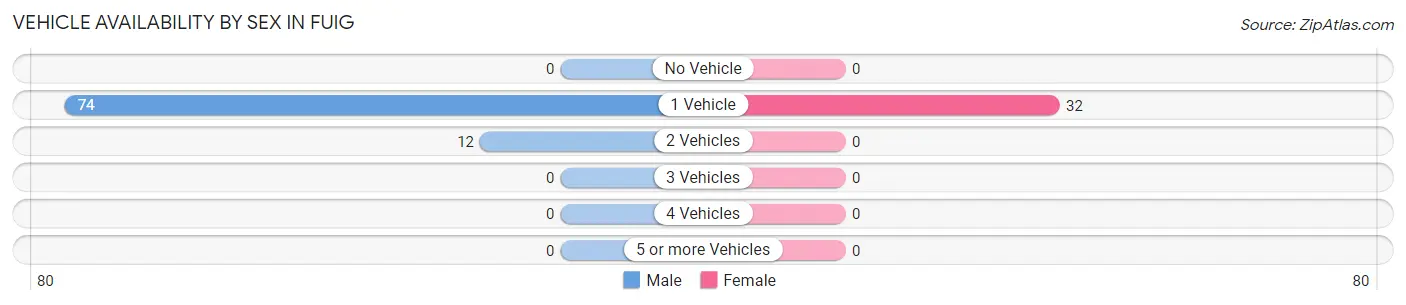
| Vehicles Available | Male | Female |
| No Vehicle | 0 (0.0%) | 0 (0.0%) |
| 1 Vehicle | 74 (86.1%) | 32 (100.0%) |
| 2 Vehicles | 12 (14.0%) | 0 (0.0%) |
| 3 Vehicles | 0 (0.0%) | 0 (0.0%) |
| 4 Vehicles | 0 (0.0%) | 0 (0.0%) |
| 5 or more Vehicles | 0 (0.0%) | 0 (0.0%) |
| Total | 86 (100.0%) | 32 (100.0%) |
Commute Time in Fuig
The most frequently occuring commute durations in Fuig are 10 to 14 minutes (106 commuters, 89.8%), 30 to 34 minutes (12 commuters, 10.2%), and less than 5 minutes (0 commuters, 0.0%).
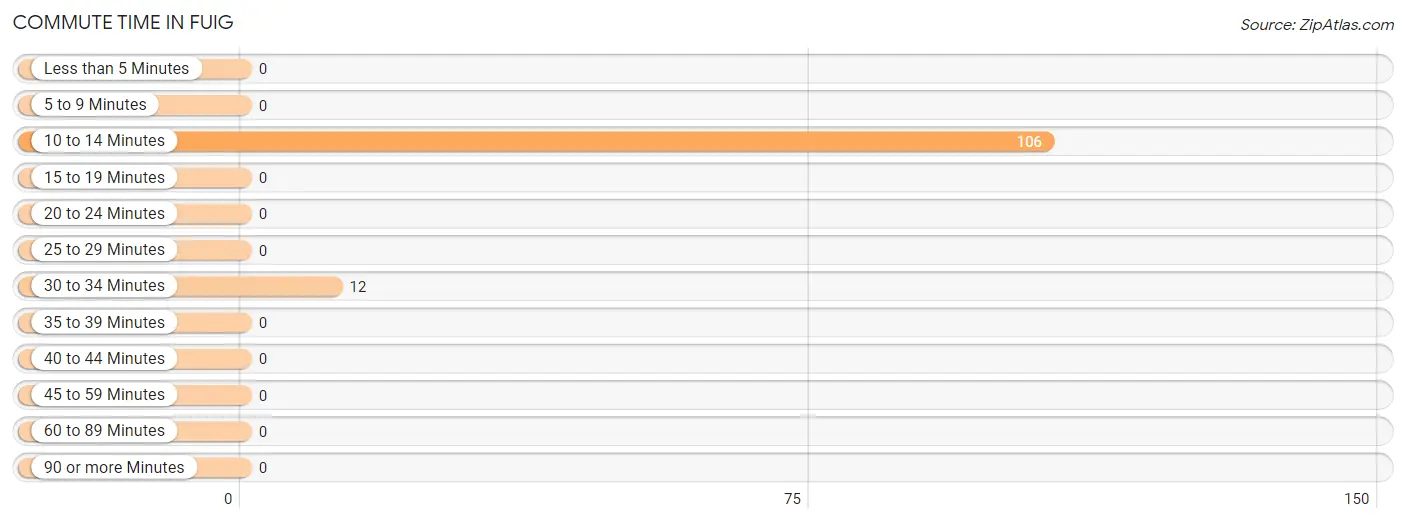
| Commute Time | # Commuters | % Commuters |
| Less than 5 Minutes | 0 | 0.0% |
| 5 to 9 Minutes | 0 | 0.0% |
| 10 to 14 Minutes | 106 | 89.8% |
| 15 to 19 Minutes | 0 | 0.0% |
| 20 to 24 Minutes | 0 | 0.0% |
| 25 to 29 Minutes | 0 | 0.0% |
| 30 to 34 Minutes | 12 | 10.2% |
| 35 to 39 Minutes | 0 | 0.0% |
| 40 to 44 Minutes | 0 | 0.0% |
| 45 to 59 Minutes | 0 | 0.0% |
| 60 to 89 Minutes | 0 | 0.0% |
| 90 or more Minutes | 0 | 0.0% |
Commute Time by Sex in Fuig
The most common commute times in Fuig are 10 to 14 minutes (74 commuters, 86.1%) for males and 10 to 14 minutes (32 commuters, 100.0%) for females.
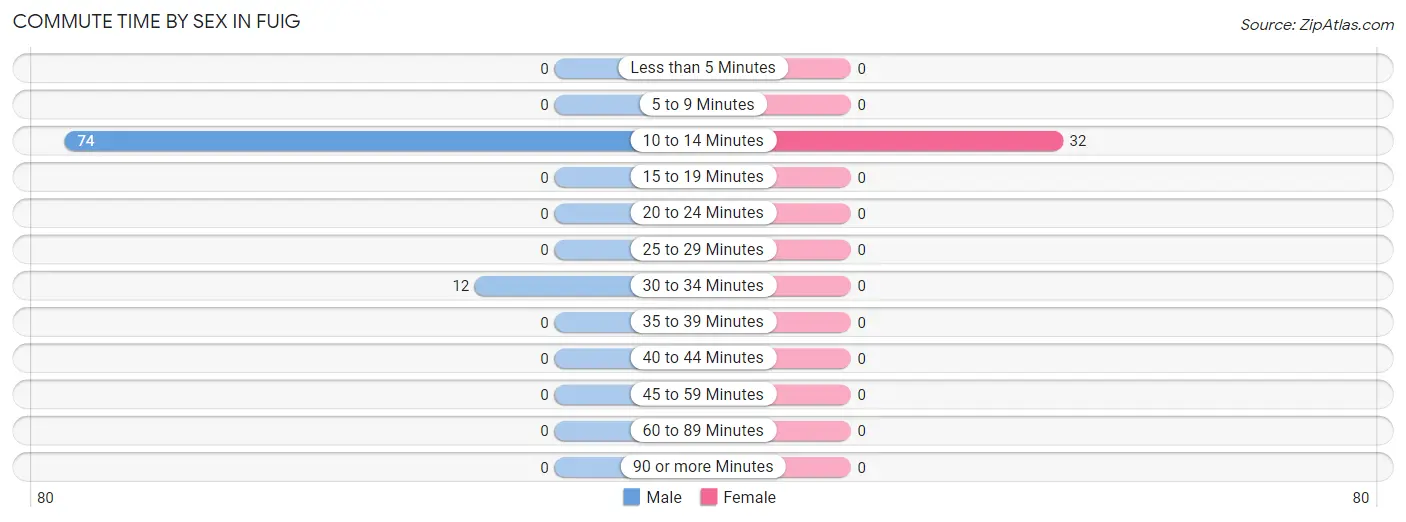
| Commute Time | Male | Female |
| Less than 5 Minutes | 0 (0.0%) | 0 (0.0%) |
| 5 to 9 Minutes | 0 (0.0%) | 0 (0.0%) |
| 10 to 14 Minutes | 74 (86.1%) | 32 (100.0%) |
| 15 to 19 Minutes | 0 (0.0%) | 0 (0.0%) |
| 20 to 24 Minutes | 0 (0.0%) | 0 (0.0%) |
| 25 to 29 Minutes | 0 (0.0%) | 0 (0.0%) |
| 30 to 34 Minutes | 12 (14.0%) | 0 (0.0%) |
| 35 to 39 Minutes | 0 (0.0%) | 0 (0.0%) |
| 40 to 44 Minutes | 0 (0.0%) | 0 (0.0%) |
| 45 to 59 Minutes | 0 (0.0%) | 0 (0.0%) |
| 60 to 89 Minutes | 0 (0.0%) | 0 (0.0%) |
| 90 or more Minutes | 0 (0.0%) | 0 (0.0%) |
Time of Departure to Work by Sex in Fuig
The most frequent times of departure to work in Fuig are 6:00 AM to 6:29 AM (46, 53.5%) for males and 7:30 AM to 7:59 AM (32, 100.0%) for females.
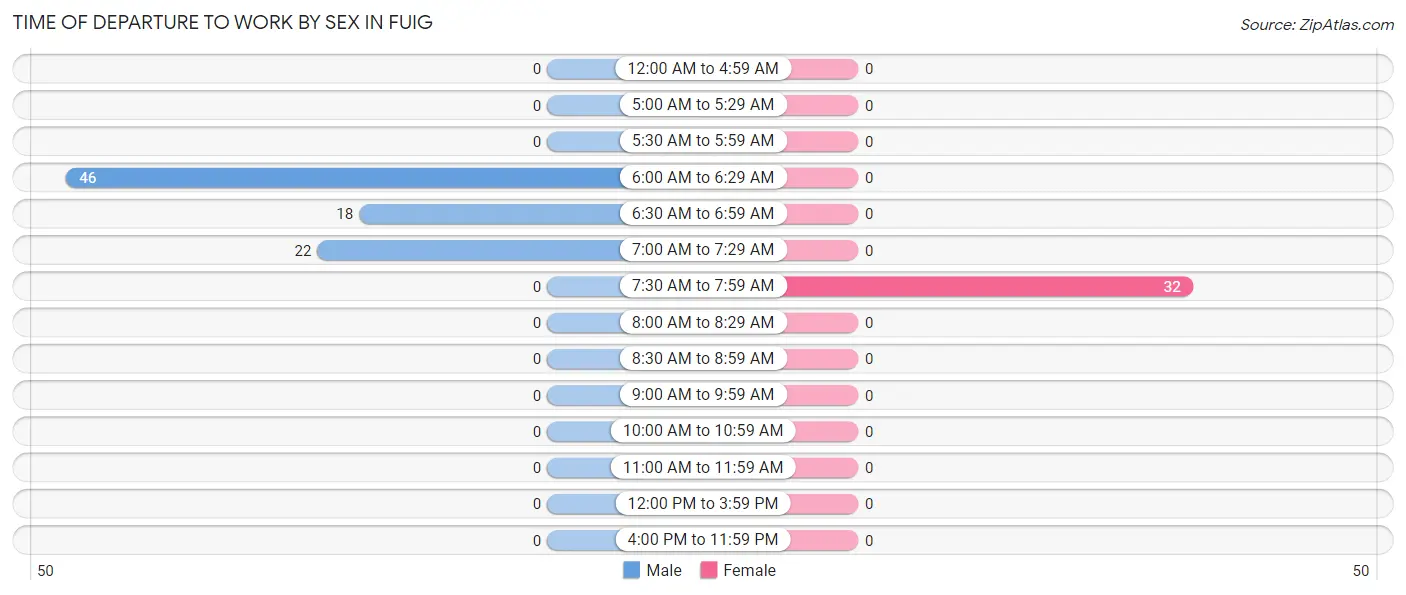
| Time of Departure | Male | Female |
| 12:00 AM to 4:59 AM | 0 (0.0%) | 0 (0.0%) |
| 5:00 AM to 5:29 AM | 0 (0.0%) | 0 (0.0%) |
| 5:30 AM to 5:59 AM | 0 (0.0%) | 0 (0.0%) |
| 6:00 AM to 6:29 AM | 46 (53.5%) | 0 (0.0%) |
| 6:30 AM to 6:59 AM | 18 (20.9%) | 0 (0.0%) |
| 7:00 AM to 7:29 AM | 22 (25.6%) | 0 (0.0%) |
| 7:30 AM to 7:59 AM | 0 (0.0%) | 32 (100.0%) |
| 8:00 AM to 8:29 AM | 0 (0.0%) | 0 (0.0%) |
| 8:30 AM to 8:59 AM | 0 (0.0%) | 0 (0.0%) |
| 9:00 AM to 9:59 AM | 0 (0.0%) | 0 (0.0%) |
| 10:00 AM to 10:59 AM | 0 (0.0%) | 0 (0.0%) |
| 11:00 AM to 11:59 AM | 0 (0.0%) | 0 (0.0%) |
| 12:00 PM to 3:59 PM | 0 (0.0%) | 0 (0.0%) |
| 4:00 PM to 11:59 PM | 0 (0.0%) | 0 (0.0%) |
| Total | 86 (100.0%) | 32 (100.0%) |
Housing Occupancy in Fuig
Occupancy by Ownership in Fuig
Of the total 424 dwellings in Fuig, owner-occupied units account for 247 (58.3%), while renter-occupied units make up 177 (41.7%).
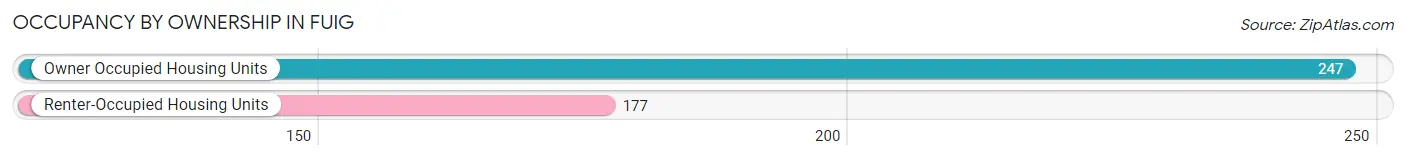
| Occupancy | # Housing Units | % Housing Units |
| Owner Occupied Housing Units | 247 | 58.3% |
| Renter-Occupied Housing Units | 177 | 41.7% |
| Total Occupied Housing Units | 424 | 100.0% |
Occupancy by Household Size in Fuig
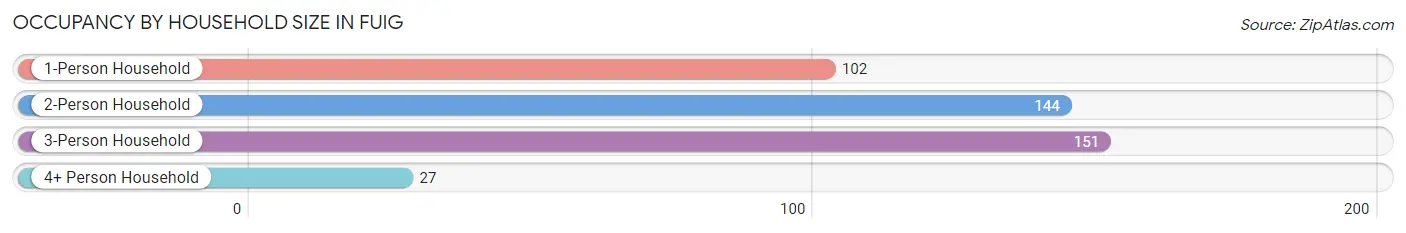
| Household Size | # Housing Units | % Housing Units |
| 1-Person Household | 102 | 24.1% |
| 2-Person Household | 144 | 34.0% |
| 3-Person Household | 151 | 35.6% |
| 4+ Person Household | 27 | 6.4% |
| Total Housing Units | 424 | 100.0% |
Occupancy by Ownership by Household Size in Fuig
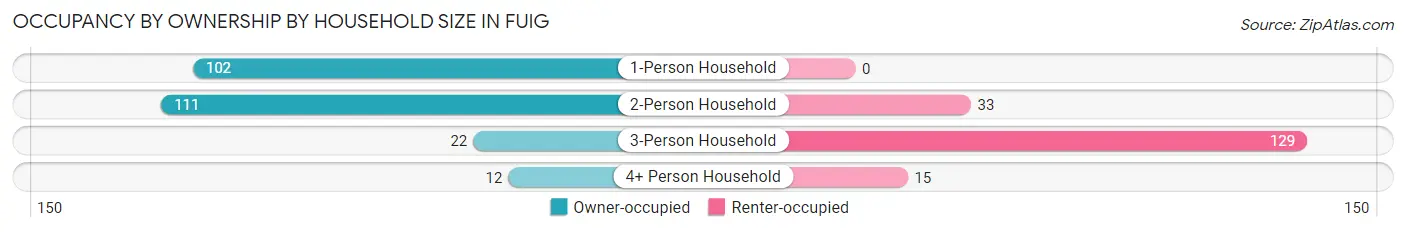
| Household Size | Owner-occupied | Renter-occupied |
| 1-Person Household | 102 (100.0%) | 0 (0.0%) |
| 2-Person Household | 111 (77.1%) | 33 (22.9%) |
| 3-Person Household | 22 (14.6%) | 129 (85.4%) |
| 4+ Person Household | 12 (44.4%) | 15 (55.6%) |
| Total Housing Units | 247 (58.3%) | 177 (41.7%) |
Occupancy by Educational Attainment in Fuig
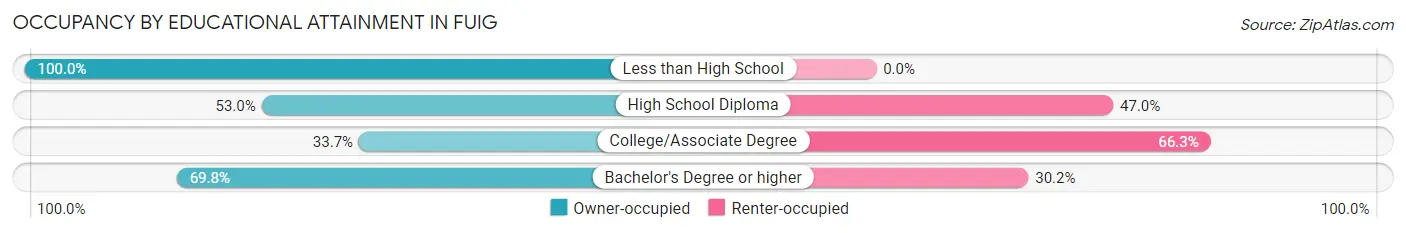
| Household Size | Owner-occupied | Renter-occupied |
| Less than High School | 60 (100.0%) | 0 (0.0%) |
| High School Diploma | 114 (53.0%) | 101 (47.0%) |
| College/Associate Degree | 29 (33.7%) | 57 (66.3%) |
| Bachelor's Degree or higher | 44 (69.8%) | 19 (30.2%) |
Occupancy by Age of Householder in Fuig
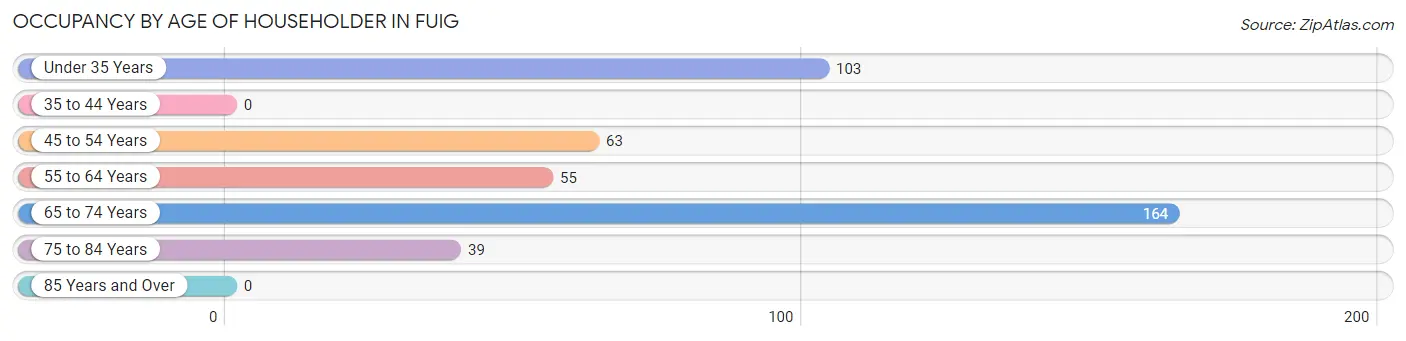
| Age Bracket | # Households | % Households |
| Under 35 Years | 103 | 24.3% |
| 35 to 44 Years | 0 | 0.0% |
| 45 to 54 Years | 63 | 14.9% |
| 55 to 64 Years | 55 | 13.0% |
| 65 to 74 Years | 164 | 38.7% |
| 75 to 84 Years | 39 | 9.2% |
| 85 Years and Over | 0 | 0.0% |
| Total | 424 | 100.0% |
Housing Finances in Fuig
Median Income by Occupancy in Fuig
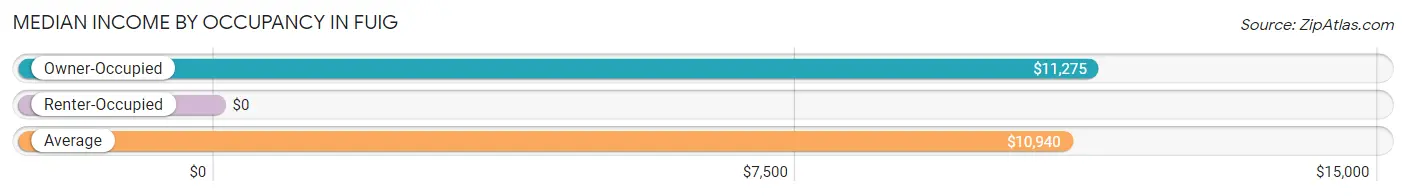
| Occupancy Type | # Households | Median Income |
| Owner-Occupied | 247 (58.3%) | $11,275 |
| Renter-Occupied | 177 (41.7%) | $0 |
| Average | 424 (100.0%) | $10,940 |
Occupancy by Householder Income Bracket in Fuig
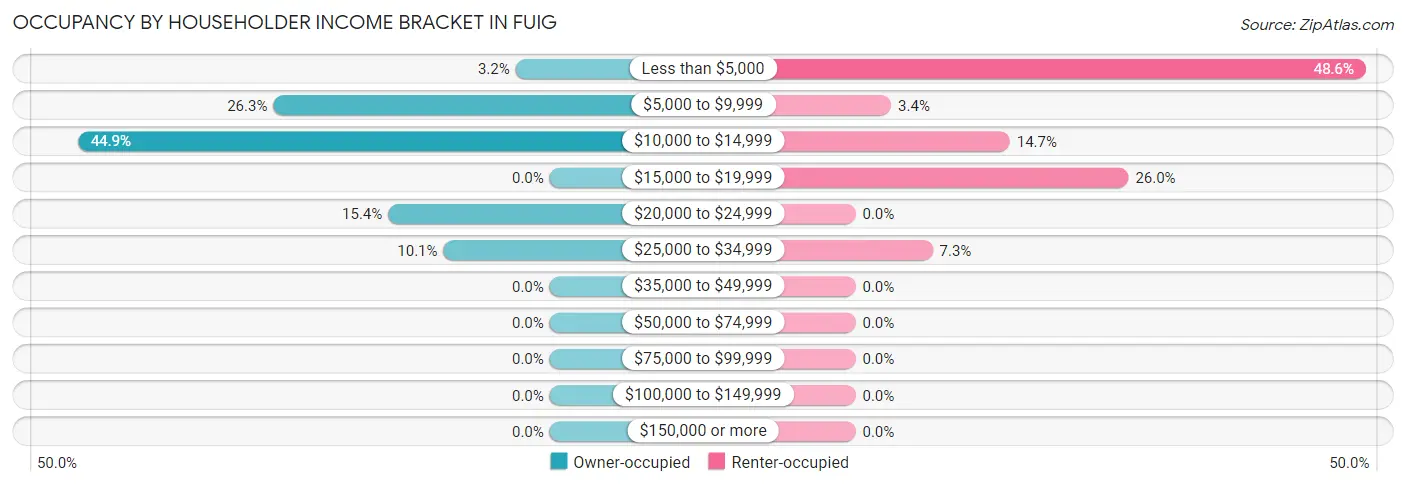
| Income Bracket | Owner-occupied | Renter-occupied |
| Less than $5,000 | 8 (3.2%) | 86 (48.6%) |
| $5,000 to $9,999 | 65 (26.3%) | 6 (3.4%) |
| $10,000 to $14,999 | 111 (44.9%) | 26 (14.7%) |
| $15,000 to $19,999 | 0 (0.0%) | 46 (26.0%) |
| $20,000 to $24,999 | 38 (15.4%) | 0 (0.0%) |
| $25,000 to $34,999 | 25 (10.1%) | 13 (7.3%) |
| $35,000 to $49,999 | 0 (0.0%) | 0 (0.0%) |
| $50,000 to $74,999 | 0 (0.0%) | 0 (0.0%) |
| $75,000 to $99,999 | 0 (0.0%) | 0 (0.0%) |
| $100,000 to $149,999 | 0 (0.0%) | 0 (0.0%) |
| $150,000 or more | 0 (0.0%) | 0 (0.0%) |
| Total | 247 (100.0%) | 177 (100.0%) |
Monthly Housing Cost Tiers in Fuig
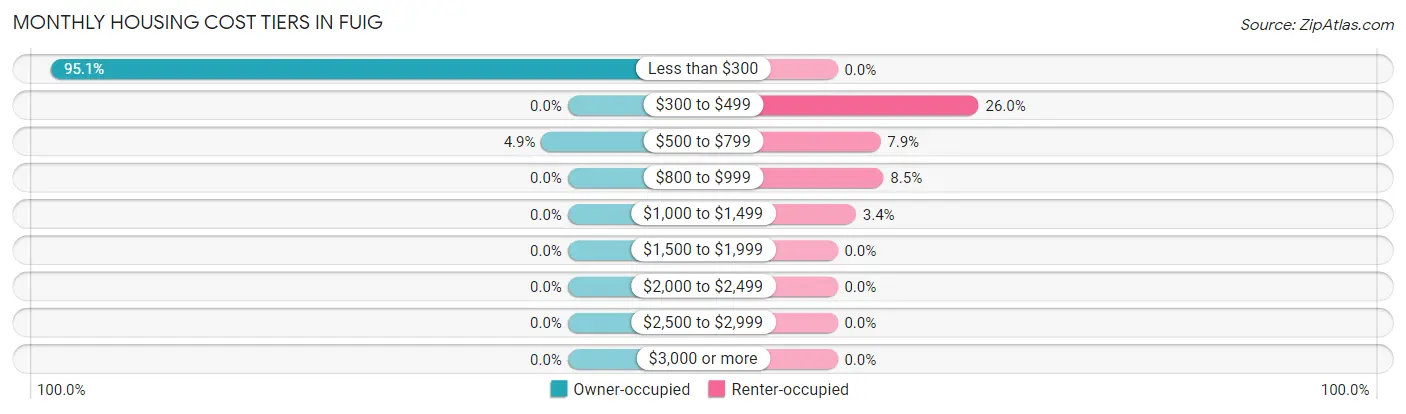
| Monthly Cost | Owner-occupied | Renter-occupied |
| Less than $300 | 235 (95.1%) | 0 (0.0%) |
| $300 to $499 | 0 (0.0%) | 46 (26.0%) |
| $500 to $799 | 12 (4.9%) | 14 (7.9%) |
| $800 to $999 | 0 (0.0%) | 15 (8.5%) |
| $1,000 to $1,499 | 0 (0.0%) | 6 (3.4%) |
| $1,500 to $1,999 | 0 (0.0%) | 0 (0.0%) |
| $2,000 to $2,499 | 0 (0.0%) | 0 (0.0%) |
| $2,500 to $2,999 | 0 (0.0%) | 0 (0.0%) |
| $3,000 or more | 0 (0.0%) | 0 (0.0%) |
| Total | 247 (100.0%) | 177 (100.0%) |
Physical Housing Characteristics in Fuig
Housing Structures in Fuig
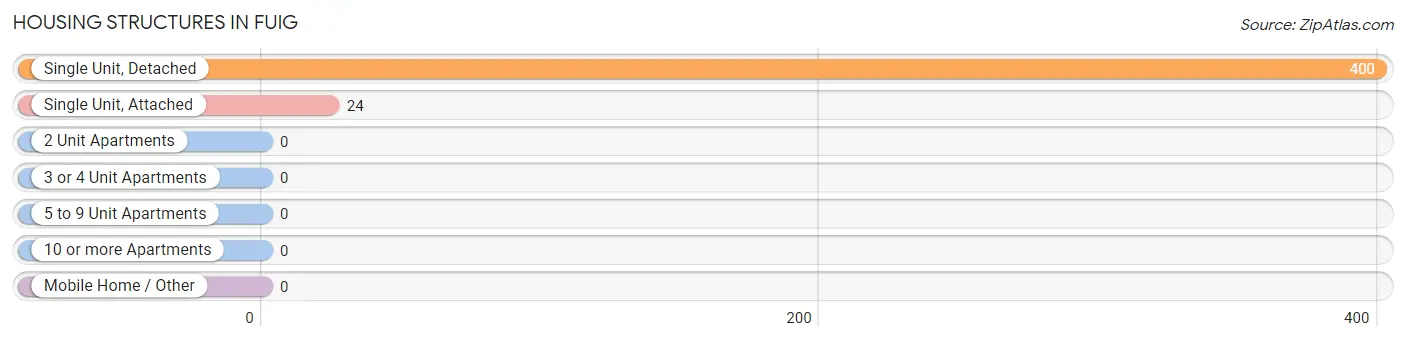
| Structure Type | # Housing Units | % Housing Units |
| Single Unit, Detached | 400 | 94.3% |
| Single Unit, Attached | 24 | 5.7% |
| 2 Unit Apartments | 0 | 0.0% |
| 3 or 4 Unit Apartments | 0 | 0.0% |
| 5 to 9 Unit Apartments | 0 | 0.0% |
| 10 or more Apartments | 0 | 0.0% |
| Mobile Home / Other | 0 | 0.0% |
| Total | 424 | 100.0% |
Housing Structures by Occupancy in Fuig
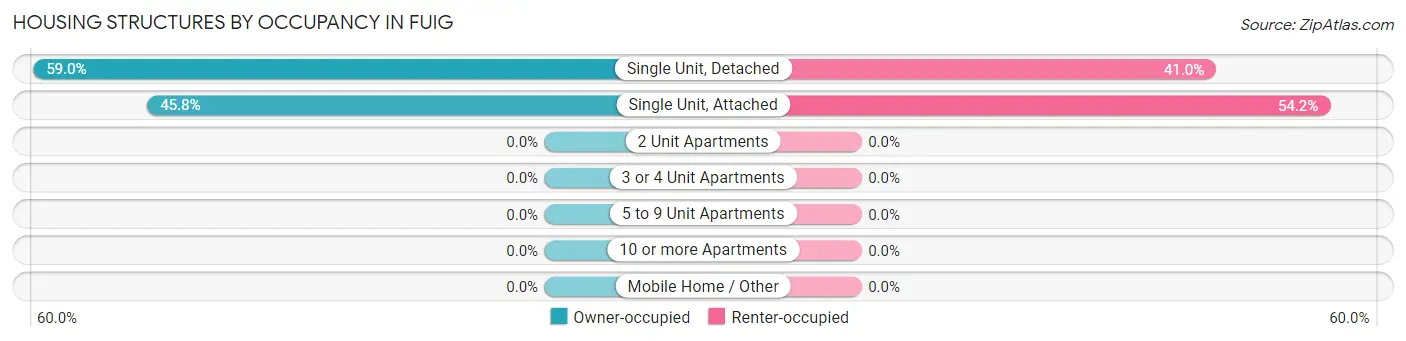
| Structure Type | Owner-occupied | Renter-occupied |
| Single Unit, Detached | 236 (59.0%) | 164 (41.0%) |
| Single Unit, Attached | 11 (45.8%) | 13 (54.2%) |
| 2 Unit Apartments | 0 (0.0%) | 0 (0.0%) |
| 3 or 4 Unit Apartments | 0 (0.0%) | 0 (0.0%) |
| 5 to 9 Unit Apartments | 0 (0.0%) | 0 (0.0%) |
| 10 or more Apartments | 0 (0.0%) | 0 (0.0%) |
| Mobile Home / Other | 0 (0.0%) | 0 (0.0%) |
| Total | 247 (58.3%) | 177 (41.7%) |
Housing Structures by Number of Rooms in Fuig
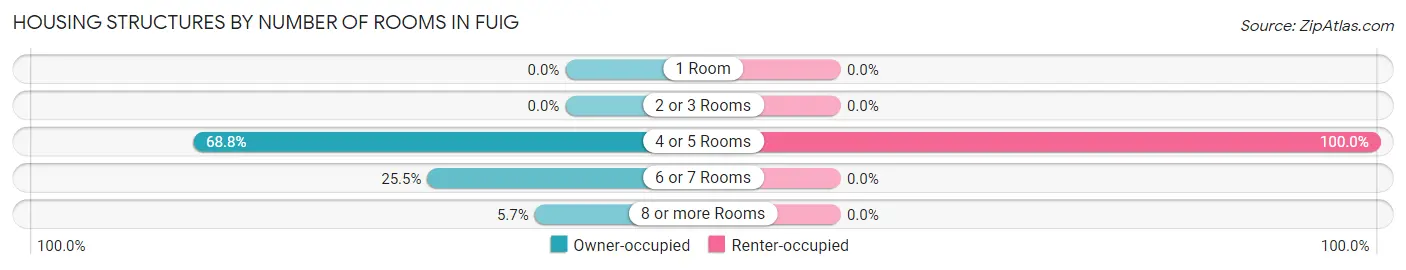
| Number of Rooms | Owner-occupied | Renter-occupied |
| 1 Room | 0 (0.0%) | 0 (0.0%) |
| 2 or 3 Rooms | 0 (0.0%) | 0 (0.0%) |
| 4 or 5 Rooms | 170 (68.8%) | 177 (100.0%) |
| 6 or 7 Rooms | 63 (25.5%) | 0 (0.0%) |
| 8 or more Rooms | 14 (5.7%) | 0 (0.0%) |
| Total | 247 (100.0%) | 177 (100.0%) |
Housing Structure by Heating Type in Fuig
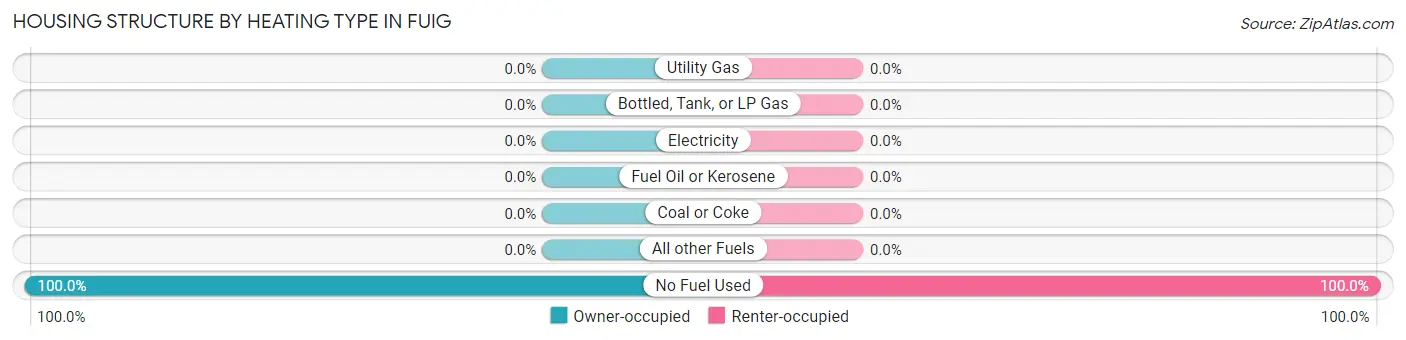
| Heating Type | Owner-occupied | Renter-occupied |
| Utility Gas | 0 (0.0%) | 0 (0.0%) |
| Bottled, Tank, or LP Gas | 0 (0.0%) | 0 (0.0%) |
| Electricity | 0 (0.0%) | 0 (0.0%) |
| Fuel Oil or Kerosene | 0 (0.0%) | 0 (0.0%) |
| Coal or Coke | 0 (0.0%) | 0 (0.0%) |
| All other Fuels | 0 (0.0%) | 0 (0.0%) |
| No Fuel Used | 247 (100.0%) | 177 (100.0%) |
| Total | 247 (100.0%) | 177 (100.0%) |
Household Vehicle Usage in Fuig
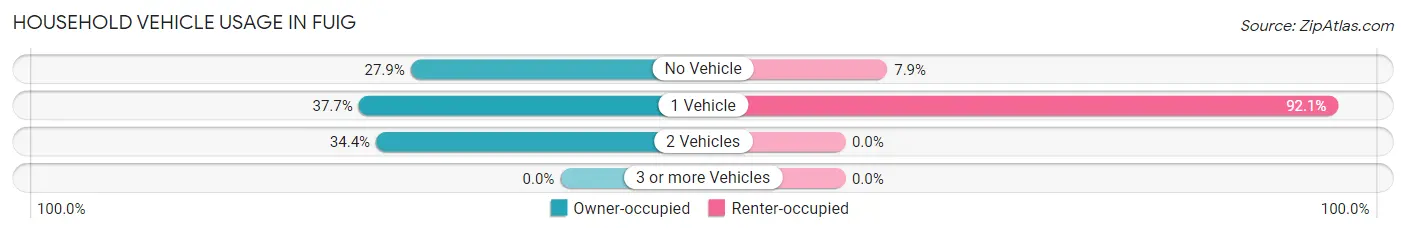
| Vehicles per Household | Owner-occupied | Renter-occupied |
| No Vehicle | 69 (27.9%) | 14 (7.9%) |
| 1 Vehicle | 93 (37.7%) | 163 (92.1%) |
| 2 Vehicles | 85 (34.4%) | 0 (0.0%) |
| 3 or more Vehicles | 0 (0.0%) | 0 (0.0%) |
| Total | 247 (100.0%) | 177 (100.0%) |
Real Estate & Mortgages in Fuig
Real Estate and Mortgage Overview in Fuig
| Characteristic | Without Mortgage | With Mortgage |
| Housing Units | 235 | 12 |
| Median Property Value | $81,500 | $0 |
| Median Household Income | $11,124 | $0 |
| Monthly Housing Costs | $118 | $0 |
| Real Estate Taxes | - | - |
Property Value by Mortgage Status in Fuig
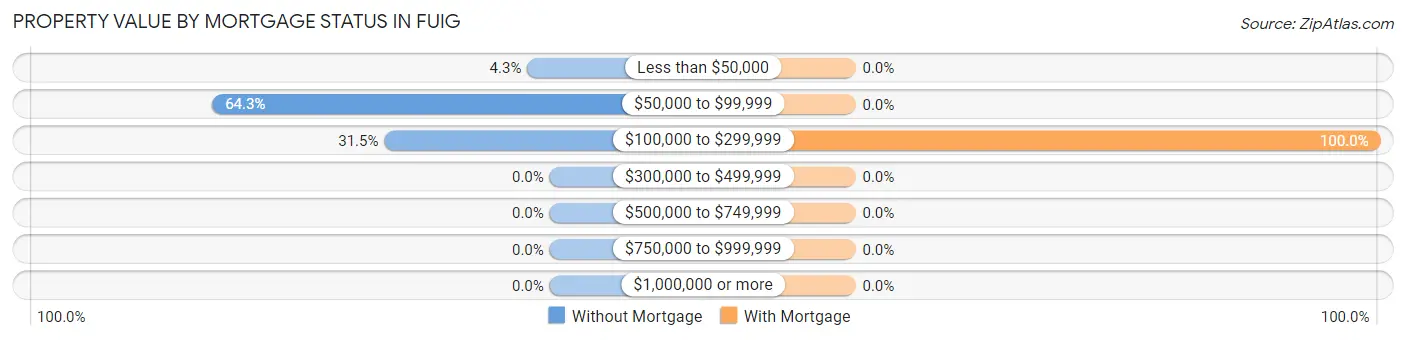
| Property Value | Without Mortgage | With Mortgage |
| Less than $50,000 | 10 (4.3%) | 0 (0.0%) |
| $50,000 to $99,999 | 151 (64.3%) | 0 (0.0%) |
| $100,000 to $299,999 | 74 (31.5%) | 12 (100.0%) |
| $300,000 to $499,999 | 0 (0.0%) | 0 (0.0%) |
| $500,000 to $749,999 | 0 (0.0%) | 0 (0.0%) |
| $750,000 to $999,999 | 0 (0.0%) | 0 (0.0%) |
| $1,000,000 or more | 0 (0.0%) | 0 (0.0%) |
| Total | 235 (100.0%) | 12 (100.0%) |
Household Income by Mortgage Status in Fuig
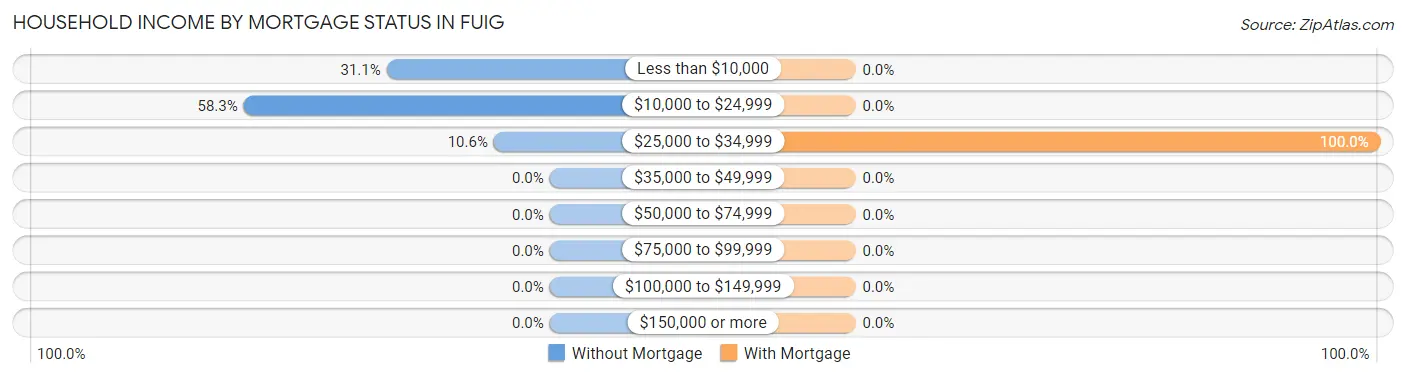
| Household Income | Without Mortgage | With Mortgage |
| Less than $10,000 | 73 (31.1%) | 0 (0.0%) |
| $10,000 to $24,999 | 137 (58.3%) | 0 (0.0%) |
| $25,000 to $34,999 | 25 (10.6%) | 12 (100.0%) |
| $35,000 to $49,999 | 0 (0.0%) | 0 (0.0%) |
| $50,000 to $74,999 | 0 (0.0%) | 0 (0.0%) |
| $75,000 to $99,999 | 0 (0.0%) | 0 (0.0%) |
| $100,000 to $149,999 | 0 (0.0%) | 0 (0.0%) |
| $150,000 or more | 0 (0.0%) | 0 (0.0%) |
| Total | 235 (100.0%) | 12 (100.0%) |
Property Value to Household Income Ratio in Fuig
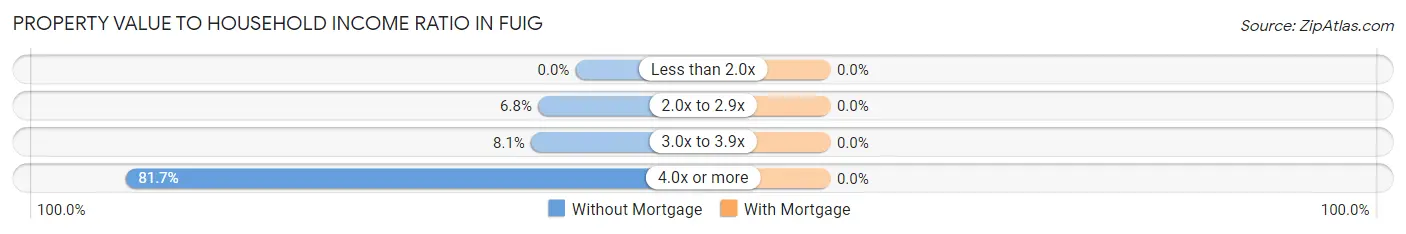
| Value-to-Income Ratio | Without Mortgage | With Mortgage |
| Less than 2.0x | 0 (0.0%) | 0 (0.0%) |
| 2.0x to 2.9x | 16 (6.8%) | 0 (0.0%) |
| 3.0x to 3.9x | 19 (8.1%) | 0 (0.0%) |
| 4.0x or more | 192 (81.7%) | 0 (0.0%) |
| Total | 235 (100.0%) | 12 (100.0%) |
Real Estate Taxes by Mortgage Status in Fuig
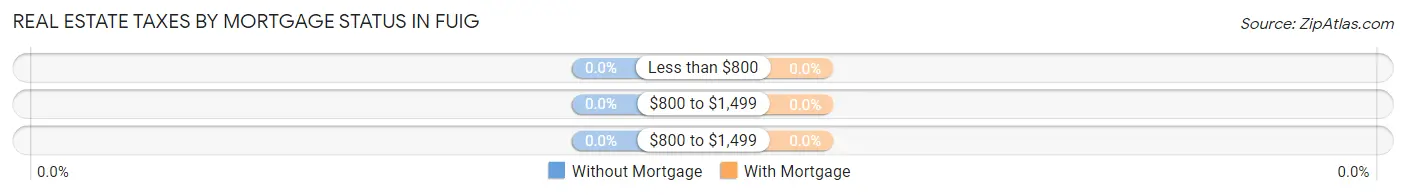
| Property Taxes | Without Mortgage | With Mortgage |
| Less than $800 | 0 (0.0%) | 0 (0.0%) |
| $800 to $1,499 | 0 (0.0%) | 0 (0.0%) |
| $800 to $1,499 | 0 (0.0%) | 0 (0.0%) |
| Total | 235 (100.0%) | 12 (100.0%) |
Health & Disability in Fuig
Health Insurance Coverage by Age in Fuig
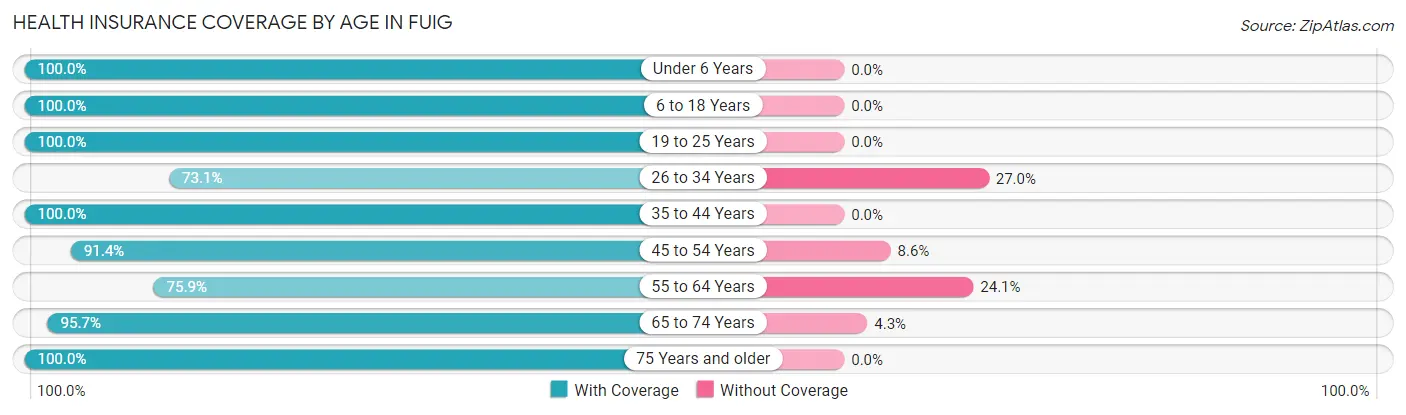
| Age Bracket | With Coverage | Without Coverage |
| Under 6 Years | 120 (100.0%) | 0 (0.0%) |
| 6 to 18 Years | 120 (100.0%) | 0 (0.0%) |
| 19 to 25 Years | 131 (100.0%) | 0 (0.0%) |
| 26 to 34 Years | 103 (73.1%) | 38 (27.0%) |
| 35 to 44 Years | 33 (100.0%) | 0 (0.0%) |
| 45 to 54 Years | 74 (91.4%) | 7 (8.6%) |
| 55 to 64 Years | 82 (75.9%) | 26 (24.1%) |
| 65 to 74 Years | 178 (95.7%) | 8 (4.3%) |
| 75 Years and older | 90 (100.0%) | 0 (0.0%) |
| Total | 931 (92.2%) | 79 (7.8%) |
Health Insurance Coverage by Citizenship Status in Fuig
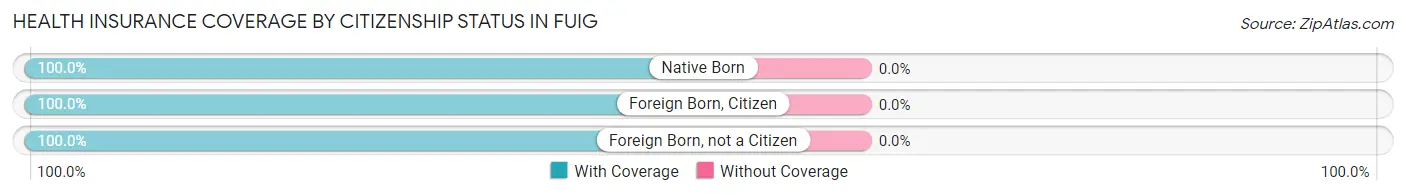
| Citizenship Status | With Coverage | Without Coverage |
| Native Born | 120 (100.0%) | 0 (0.0%) |
| Foreign Born, Citizen | 120 (100.0%) | 0 (0.0%) |
| Foreign Born, not a Citizen | 131 (100.0%) | 0 (0.0%) |
Health Insurance Coverage by Household Income in Fuig
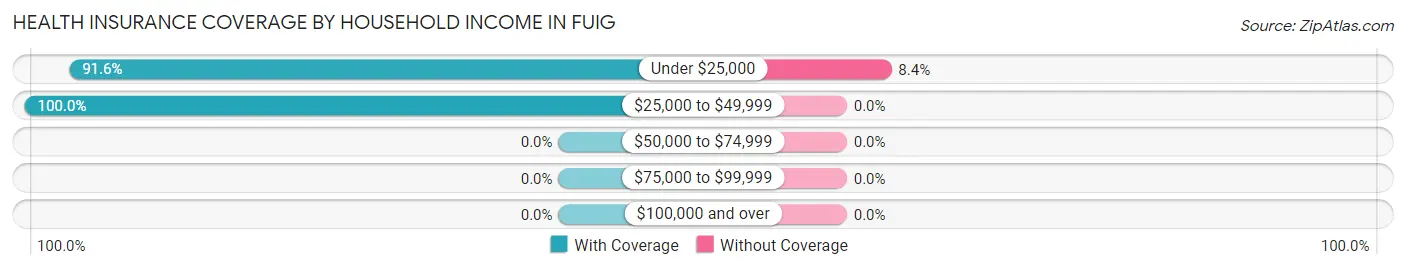
| Household Income | With Coverage | Without Coverage |
| Under $25,000 | 866 (91.6%) | 79 (8.4%) |
| $25,000 to $49,999 | 51 (100.0%) | 0 (0.0%) |
| $50,000 to $74,999 | 0 (0.0%) | 0 (0.0%) |
| $75,000 to $99,999 | 0 (0.0%) | 0 (0.0%) |
| $100,000 and over | 0 (0.0%) | 0 (0.0%) |
Public vs Private Health Insurance Coverage by Age in Fuig
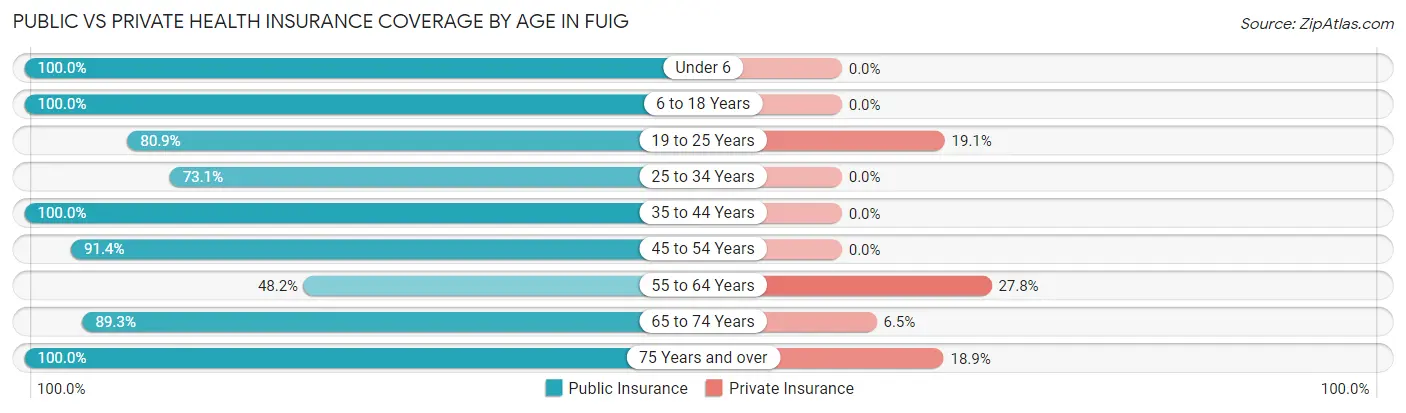
| Age Bracket | Public Insurance | Private Insurance |
| Under 6 | 120 (100.0%) | 0 (0.0%) |
| 6 to 18 Years | 120 (100.0%) | 0 (0.0%) |
| 19 to 25 Years | 106 (80.9%) | 25 (19.1%) |
| 25 to 34 Years | 103 (73.1%) | 0 (0.0%) |
| 35 to 44 Years | 33 (100.0%) | 0 (0.0%) |
| 45 to 54 Years | 74 (91.4%) | 0 (0.0%) |
| 55 to 64 Years | 52 (48.1%) | 30 (27.8%) |
| 65 to 74 Years | 166 (89.2%) | 12 (6.5%) |
| 75 Years and over | 90 (100.0%) | 17 (18.9%) |
| Total | 864 (85.5%) | 84 (8.3%) |
Disability Status by Sex by Age in Fuig
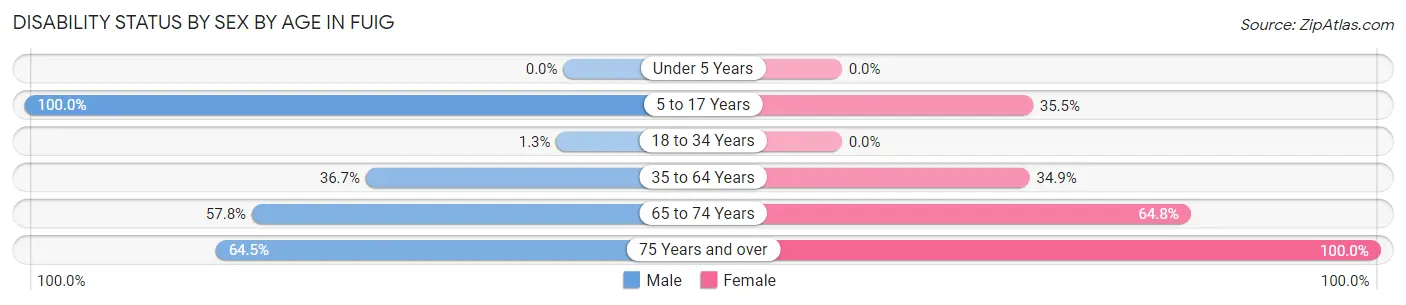
| Age Bracket | Male | Female |
| Under 5 Years | 0 (0.0%) | 0 (0.0%) |
| 5 to 17 Years | 10 (100.0%) | 39 (35.4%) |
| 18 to 34 Years | 2 (1.3%) | 0 (0.0%) |
| 35 to 64 Years | 33 (36.7%) | 46 (34.8%) |
| 65 to 74 Years | 37 (57.8%) | 79 (64.7%) |
| 75 Years and over | 20 (64.5%) | 59 (100.0%) |
Disability Class by Sex by Age in Fuig
Disability Class: Hearing Difficulty
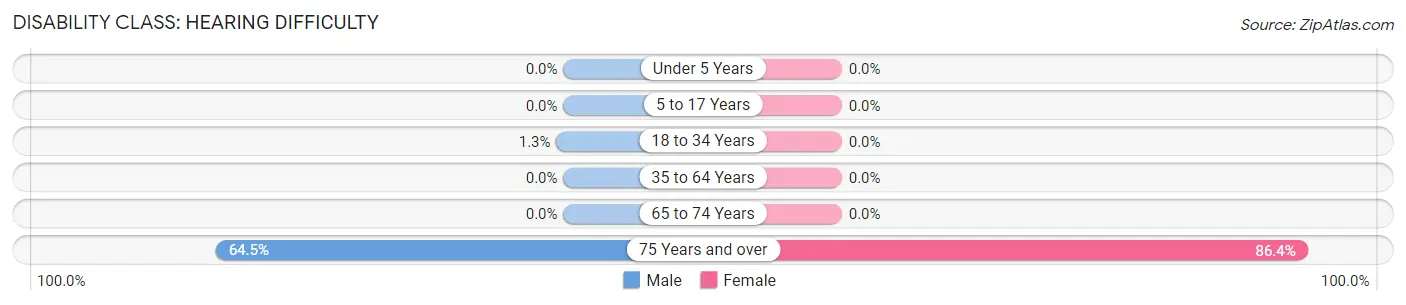
| Age Bracket | Male | Female |
| Under 5 Years | 0 (0.0%) | 0 (0.0%) |
| 5 to 17 Years | 0 (0.0%) | 0 (0.0%) |
| 18 to 34 Years | 2 (1.3%) | 0 (0.0%) |
| 35 to 64 Years | 0 (0.0%) | 0 (0.0%) |
| 65 to 74 Years | 0 (0.0%) | 0 (0.0%) |
| 75 Years and over | 20 (64.5%) | 51 (86.4%) |
Disability Class: Vision Difficulty
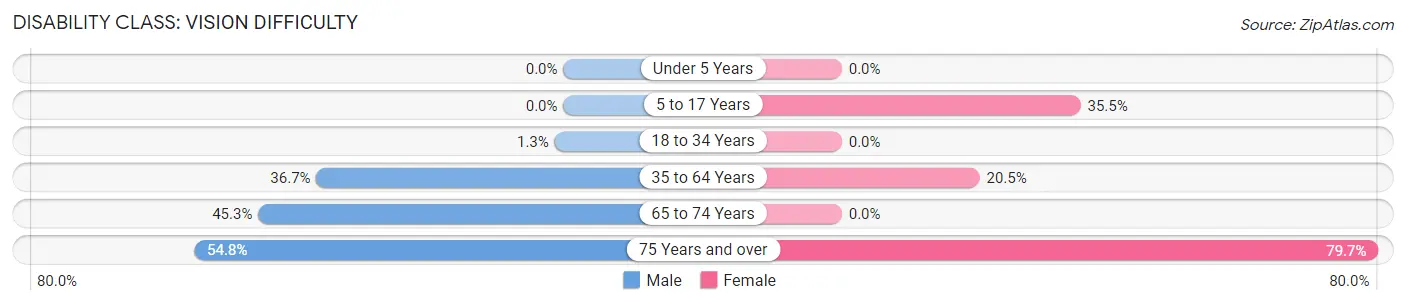
| Age Bracket | Male | Female |
| Under 5 Years | 0 (0.0%) | 0 (0.0%) |
| 5 to 17 Years | 0 (0.0%) | 39 (35.4%) |
| 18 to 34 Years | 2 (1.3%) | 0 (0.0%) |
| 35 to 64 Years | 33 (36.7%) | 27 (20.4%) |
| 65 to 74 Years | 29 (45.3%) | 0 (0.0%) |
| 75 Years and over | 17 (54.8%) | 47 (79.7%) |
Disability Class: Cognitive Difficulty
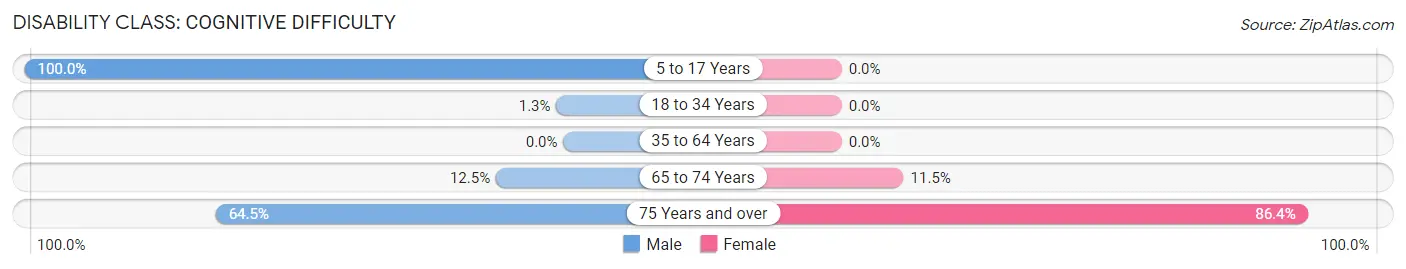
| Age Bracket | Male | Female |
| 5 to 17 Years | 10 (100.0%) | 0 (0.0%) |
| 18 to 34 Years | 2 (1.3%) | 0 (0.0%) |
| 35 to 64 Years | 0 (0.0%) | 0 (0.0%) |
| 65 to 74 Years | 8 (12.5%) | 14 (11.5%) |
| 75 Years and over | 20 (64.5%) | 51 (86.4%) |
Disability Class: Ambulatory Difficulty
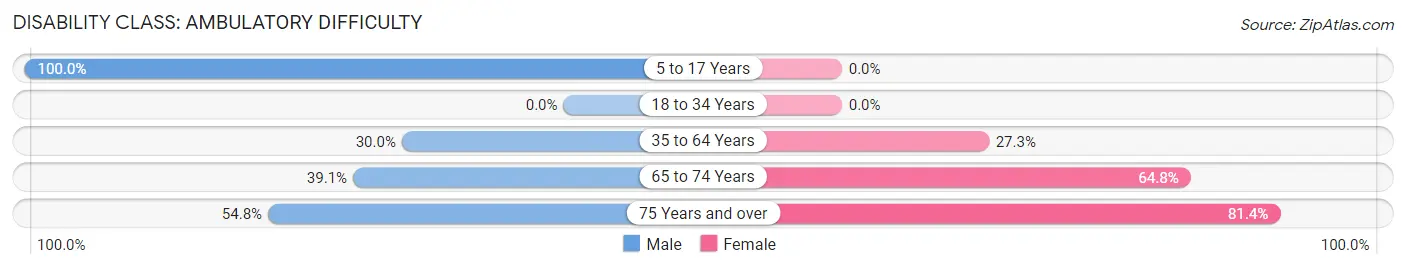
| Age Bracket | Male | Female |
| 5 to 17 Years | 10 (100.0%) | 0 (0.0%) |
| 18 to 34 Years | 0 (0.0%) | 0 (0.0%) |
| 35 to 64 Years | 27 (30.0%) | 36 (27.3%) |
| 65 to 74 Years | 25 (39.1%) | 79 (64.7%) |
| 75 Years and over | 17 (54.8%) | 48 (81.4%) |
Disability Class: Self-Care Difficulty
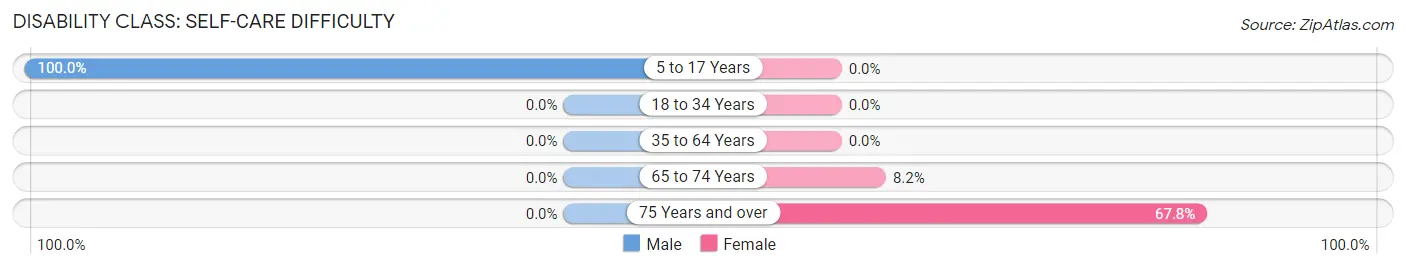
| Age Bracket | Male | Female |
| 5 to 17 Years | 10 (100.0%) | 0 (0.0%) |
| 18 to 34 Years | 0 (0.0%) | 0 (0.0%) |
| 35 to 64 Years | 0 (0.0%) | 0 (0.0%) |
| 65 to 74 Years | 0 (0.0%) | 10 (8.2%) |
| 75 Years and over | 0 (0.0%) | 40 (67.8%) |
Technology Access in Fuig
Computing Device Access in Fuig
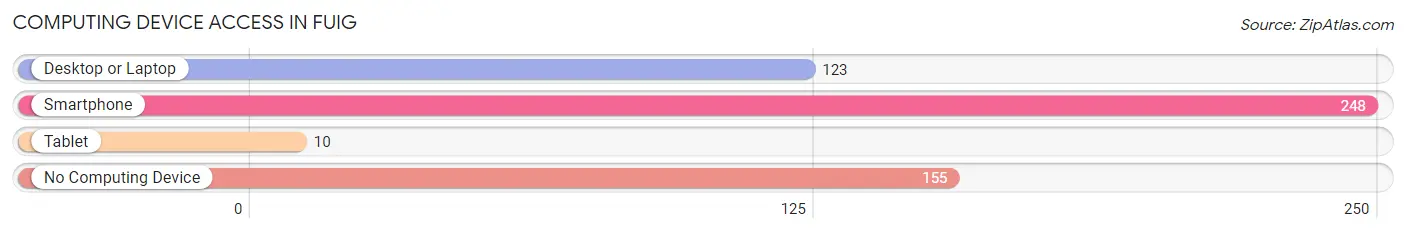
| Device Type | # Households | % Households |
| Desktop or Laptop | 123 | 29.0% |
| Smartphone | 248 | 58.5% |
| Tablet | 10 | 2.4% |
| No Computing Device | 155 | 36.6% |
| Total | 424 | 100.0% |
Internet Access in Fuig
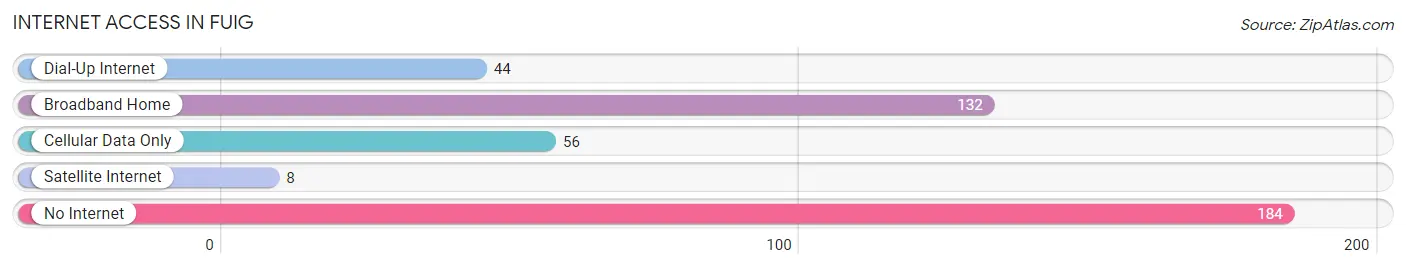
| Internet Type | # Households | % Households |
| Dial-Up Internet | 44 | 10.4% |
| Broadband Home | 132 | 31.1% |
| Cellular Data Only | 56 | 13.2% |
| Satellite Internet | 8 | 1.9% |
| No Internet | 184 | 43.4% |
| Total | 424 | 100.0% |
Fuig Summary
Puerto Rico is an unincorporated territory of the United States located in the Caribbean Sea. It is the easternmost and smallest of the Greater Antilles, and is composed of the main island of Puerto Rico and several smaller islands. The archipelago is located between the Caribbean Sea and the North Atlantic Ocean, east of the Dominican Republic and west of the Virgin Islands. The capital and largest city is San Juan.
History
The history of Puerto Rico dates back to the early 16th century when it was colonized by the Spanish. The island was originally inhabited by the Taíno people, who were displaced by the Spanish. The Spanish established a settlement in 1508 and named it San Juan Bautista. The island was ceded to the United States in 1898 following the Spanish-American War.
In 1917, the Jones-Shafroth Act granted U.S. citizenship to Puerto Ricans, and in 1952, Puerto Rico became a self-governing commonwealth of the United States. In the late 20th century, Puerto Rico experienced a period of rapid economic growth and industrialization, which led to a large influx of immigrants from other Caribbean islands and Latin America.
Geography
Puerto Rico is located in the Caribbean Sea, east of the Dominican Republic and west of the Virgin Islands. It is composed of the main island of Puerto Rico and several smaller islands, including Vieques, Culebra, Mona, and Desecheo. The main island is approximately 100 miles long and 35 miles wide, and is divided into 78 municipalities. The terrain is mostly mountainous, with the highest point being Cerro de Punta at 4,390 feet. The climate is tropical, with temperatures ranging from 70 to 90 degrees Fahrenheit.
Economy
Puerto Rico has a mixed economy, with a large public sector and a smaller private sector. The main industries are tourism, pharmaceuticals, electronics, and manufacturing. The government is the largest employer, followed by the tourism industry. The main exports are pharmaceuticals, electronics, and apparel. The main imports are food, machinery, and chemicals.
Demographics
As of 2019, the population of Puerto Rico was estimated to be 3.2 million. The majority of the population is of mixed European and African descent, with smaller numbers of Native American, Asian, and Middle Eastern descent. Spanish is the official language, although English is widely spoken. The majority of the population is Roman Catholic, with smaller numbers of Protestant and other Christian denominations.
Common Questions
What is Per Capita Income in Fuig?
Per Capita income in Fuig is $4,925.
What is the Median Family Income in Fuig?
Median Family Income in Fuig is $10,045.
What is the Median Household income in Fuig?
Median Household Income in Fuig is $10,940.
What is Family Income Deficit in Fuig?
Family Income Deficit in Fuig is $12,546.
Families that are below poverty line in Fuig earn $12,546 less on average than the poverty threshold level.
What is Inequality or Gini Index in Fuig?
Inequality or Gini Index in Fuig is 0.40.
What is the Total Population of Fuig?
Total Population of Fuig is 1,010.
What is the Total Male Population of Fuig?
Total Male Population of Fuig is 349.
What is the Total Female Population of Fuig?
Total Female Population of Fuig is 661.
What is the Ratio of Males per 100 Females in Fuig?
There are 52.80 Males per 100 Females in Fuig.
What is the Ratio of Females per 100 Males in Fuig?
There are 189.40 Females per 100 Males in Fuig.
What is the Median Population Age in Fuig?
Median Population Age in Fuig is 28.9 Years.
What is the Average Family Size in Fuig
Average Family Size in Fuig is 2.5 People.
What is the Average Household Size in Fuig
Average Household Size in Fuig is 2.4 People.
How Large is the Labor Force in Fuig?
There are 235 People in the Labor Forcein in Fuig.
What is the Percentage of People in the Labor Force in Fuig?
30.5% of People are in the Labor Force in Fuig.
What is the Unemployment Rate in Fuig?
Unemployment Rate in Fuig is 48.5%.