Playita comunidad Yabucoa Municipio, PR Map & Demographics
Playita comunidad Yabucoa Municipio Overview
$10,346
PER CAPITA INCOME
$20,139
AVG FAMILY INCOME
$17,321
AVG HOUSEHOLD INCOME
9.0%
WAGE / INCOME GAP [ % ]
91.0¢/ $1
WAGE / INCOME GAP [ $ ]
0.36
INEQUALITY / GINI INDEX
1,493
TOTAL POPULATION
638
MALE POPULATION
855
FEMALE POPULATION
74.62
MALES / 100 FEMALES
134.01
FEMALES / 100 MALES
48.5
MEDIAN AGE
3.2
AVG FAMILY SIZE
2.5
AVG HOUSEHOLD SIZE
374
LABOR FORCE [ PEOPLE ]
29.9%
PERCENT IN LABOR FORCE
11.0%
UNEMPLOYMENT RATE
Income in Playita comunidad Yabucoa Municipio
Income Overview in Playita comunidad Yabucoa Municipio
Per Capita Income in Playita comunidad Yabucoa Municipio is $10,346, while median incomes of families and households are $20,139 and $17,321 respectively.
| Characteristic | Number | Measure |
| Per Capita Income | 1,493 | $10,346 |
| Median Family Income | 364 | $20,139 |
| Mean Family Income | 364 | $25,895 |
| Median Household Income | 591 | $17,321 |
| Mean Household Income | 591 | $21,905 |
| Income Deficit | 364 | $0 |
| Wage / Income Gap (%) | 1,493 | 9.04% |
| Wage / Income Gap ($) | 1,493 | 90.96¢ per $1 |
| Gini / Inequality Index | 1,493 | 0.36 |
Earnings by Sex in Playita comunidad Yabucoa Municipio
Average Earnings in Playita comunidad Yabucoa Municipio are $18,542, $19,125 for men and $17,396 for women, a difference of 9.0%.
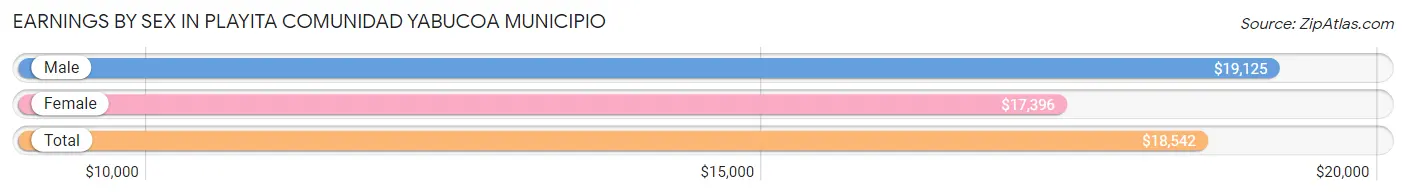
| Sex | Number | Average Earnings |
| Male | 224 (52.8%) | $19,125 |
| Female | 200 (47.2%) | $17,396 |
| Total | 424 (100.0%) | $18,542 |
Earnings by Sex by Income Bracket in Playita comunidad Yabucoa Municipio
The most common earnings brackets in Playita comunidad Yabucoa Municipio are $25,000 to $29,999 for men (78 | 34.8%) and $25,000 to $29,999 for women (48 | 24.0%).
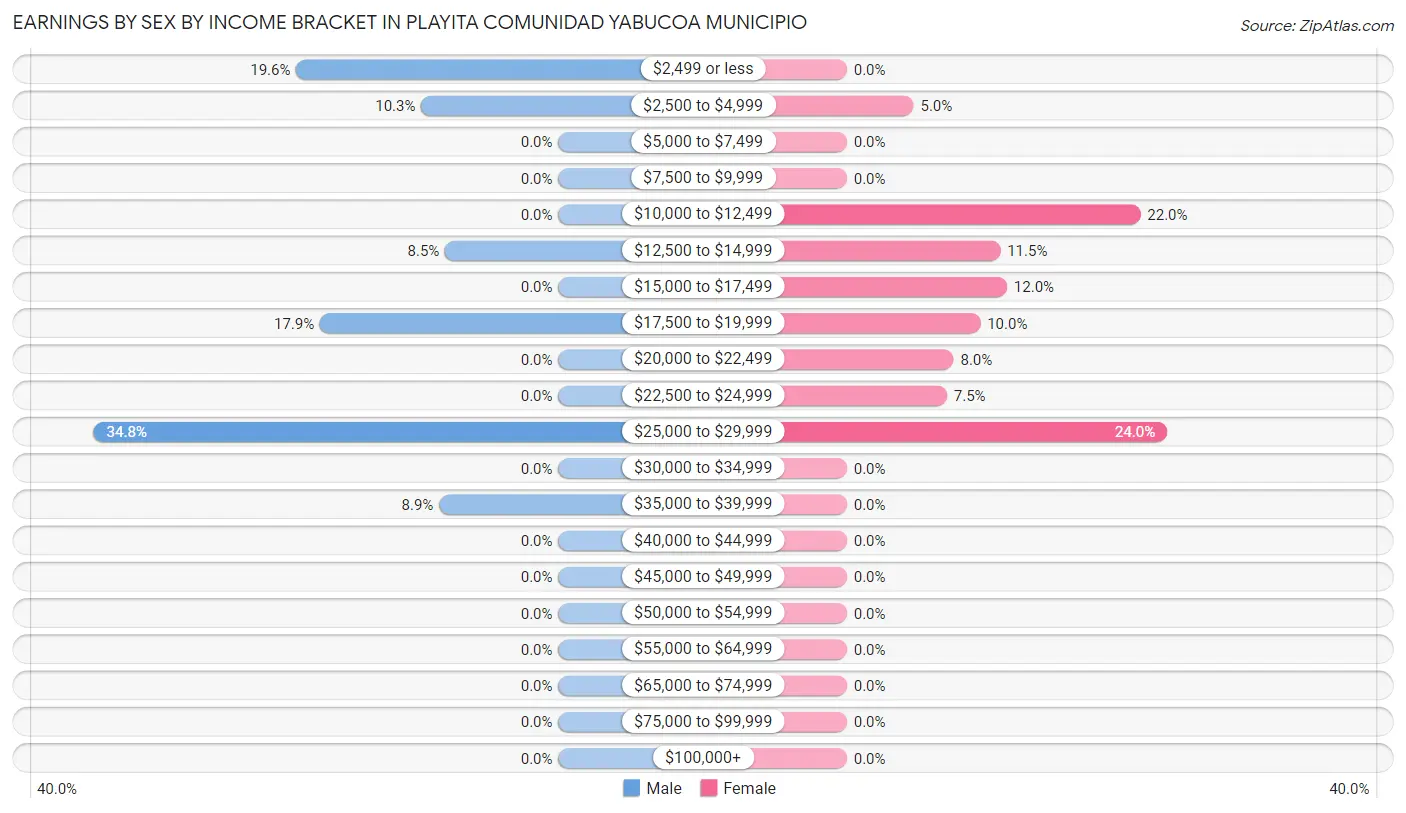
| Income | Male | Female |
| $2,499 or less | 44 (19.6%) | 0 (0.0%) |
| $2,500 to $4,999 | 23 (10.3%) | 10 (5.0%) |
| $5,000 to $7,499 | 0 (0.0%) | 0 (0.0%) |
| $7,500 to $9,999 | 0 (0.0%) | 0 (0.0%) |
| $10,000 to $12,499 | 0 (0.0%) | 44 (22.0%) |
| $12,500 to $14,999 | 19 (8.5%) | 23 (11.5%) |
| $15,000 to $17,499 | 0 (0.0%) | 24 (12.0%) |
| $17,500 to $19,999 | 40 (17.9%) | 20 (10.0%) |
| $20,000 to $22,499 | 0 (0.0%) | 16 (8.0%) |
| $22,500 to $24,999 | 0 (0.0%) | 15 (7.5%) |
| $25,000 to $29,999 | 78 (34.8%) | 48 (24.0%) |
| $30,000 to $34,999 | 0 (0.0%) | 0 (0.0%) |
| $35,000 to $39,999 | 20 (8.9%) | 0 (0.0%) |
| $40,000 to $44,999 | 0 (0.0%) | 0 (0.0%) |
| $45,000 to $49,999 | 0 (0.0%) | 0 (0.0%) |
| $50,000 to $54,999 | 0 (0.0%) | 0 (0.0%) |
| $55,000 to $64,999 | 0 (0.0%) | 0 (0.0%) |
| $65,000 to $74,999 | 0 (0.0%) | 0 (0.0%) |
| $75,000 to $99,999 | 0 (0.0%) | 0 (0.0%) |
| $100,000+ | 0 (0.0%) | 0 (0.0%) |
| Total | 224 (100.0%) | 200 (100.0%) |
Earnings by Sex by Educational Attainment in Playita comunidad Yabucoa Municipio
Average earnings in Playita comunidad Yabucoa Municipio are $19,125 for men and $18,000 for women, a difference of 5.9%. Men with an educational attainment of college or associate's degree enjoy the highest average annual earnings of $25,817, while those with college or associate's degree education earn the least with $25,817. Women with an educational attainment of bachelor's degree earn the most with the average annual earnings of $24,000, while those with college or associate's degree education have the smallest earnings of $14,022.
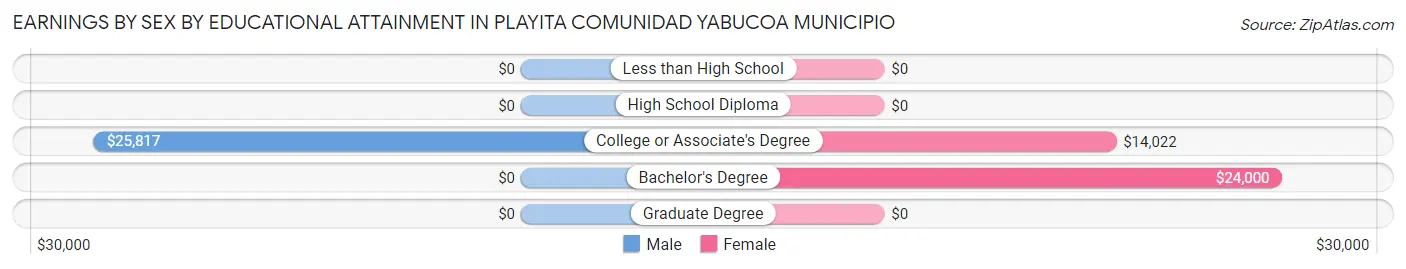
| Educational Attainment | Male Income | Female Income |
| Less than High School | - | - |
| High School Diploma | - | - |
| College or Associate's Degree | $25,817 | $14,022 |
| Bachelor's Degree | - | - |
| Graduate Degree | - | - |
| Total | $19,125 | $18,000 |
Family Income in Playita comunidad Yabucoa Municipio
Family Income Brackets in Playita comunidad Yabucoa Municipio
According to the Playita comunidad Yabucoa Municipio family income data, there are 112 families falling into the $15,000 to $24,999 income range, which is the most common income bracket and makes up 30.8% of all families.
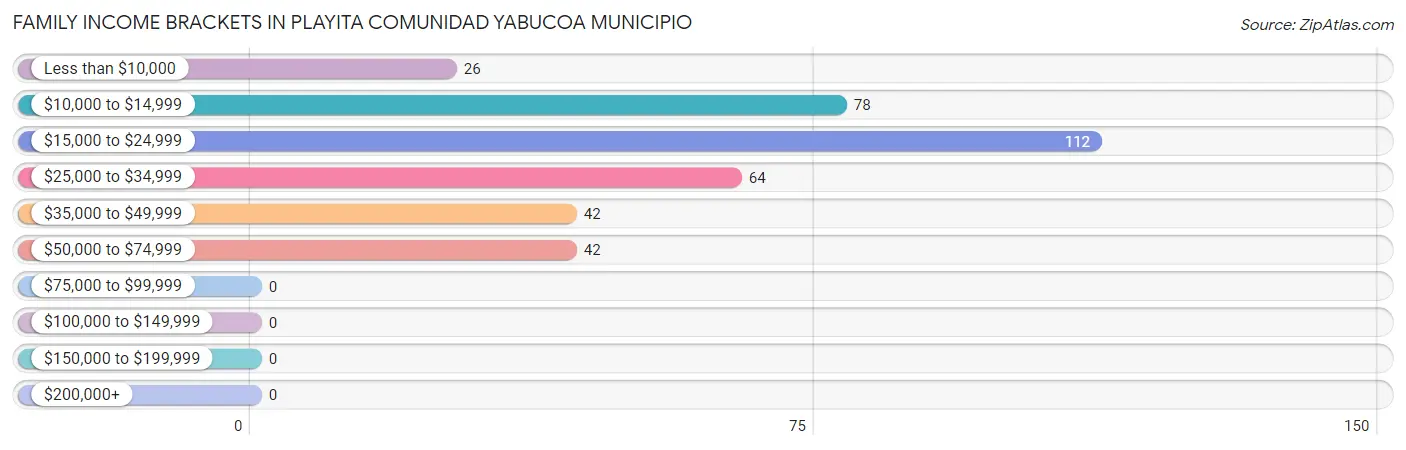
| Income Bracket | # Families | % Families |
| Less than $10,000 | 26 | 7.1% |
| $10,000 to $14,999 | 78 | 21.4% |
| $15,000 to $24,999 | 112 | 30.8% |
| $25,000 to $34,999 | 64 | 17.6% |
| $35,000 to $49,999 | 42 | 11.5% |
| $50,000 to $74,999 | 42 | 11.5% |
| $75,000 to $99,999 | 0 | 0.0% |
| $100,000 to $149,999 | 0 | 0.0% |
| $150,000 to $199,999 | 0 | 0.0% |
| $200,000+ | 0 | 0.0% |
Family Income by Famaliy Size in Playita comunidad Yabucoa Municipio
3-person families (63 | 17.3%) account for the highest median family income in Playita comunidad Yabucoa Municipio with $48,313 per family, while 3-person families (63 | 17.3%) have the highest median income of $16,104 per family member.
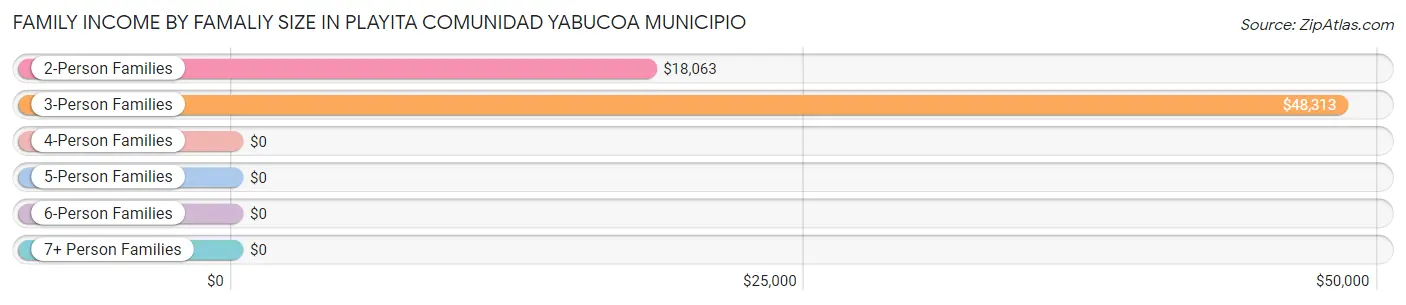
| Income Bracket | # Families | Median Income |
| 2-Person Families | 195 (53.6%) | $18,063 |
| 3-Person Families | 63 (17.3%) | $48,313 |
| 4-Person Families | 92 (25.3%) | $0 |
| 5-Person Families | 0 (0.0%) | $0 |
| 6-Person Families | 14 (3.8%) | $0 |
| 7+ Person Families | 0 (0.0%) | $0 |
| Total | 364 (100.0%) | $20,139 |
Family Income by Number of Earners in Playita comunidad Yabucoa Municipio
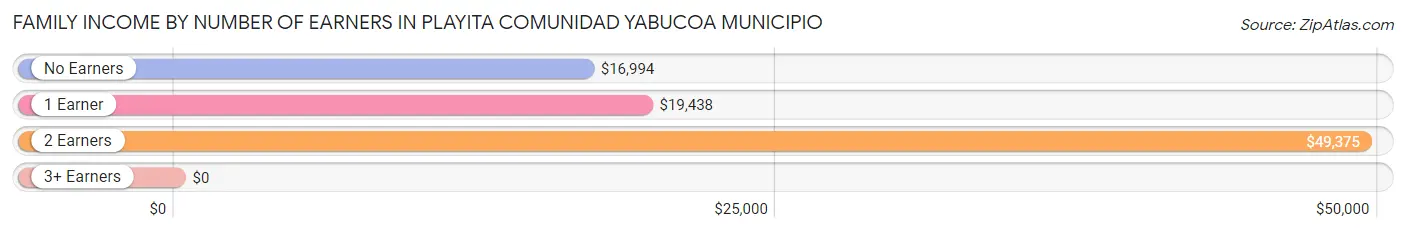
| Number of Earners | # Families | Median Income |
| No Earners | 237 (65.1%) | $16,994 |
| 1 Earner | 69 (19.0%) | $19,438 |
| 2 Earners | 58 (15.9%) | $49,375 |
| 3+ Earners | 0 (0.0%) | $0 |
| Total | 364 (100.0%) | $20,139 |
Household Income in Playita comunidad Yabucoa Municipio
Household Income Brackets in Playita comunidad Yabucoa Municipio
With 177 households falling in the category, the $15,000 to $24,999 income range is the most frequent in Playita comunidad Yabucoa Municipio, accounting for 29.9% of all households.
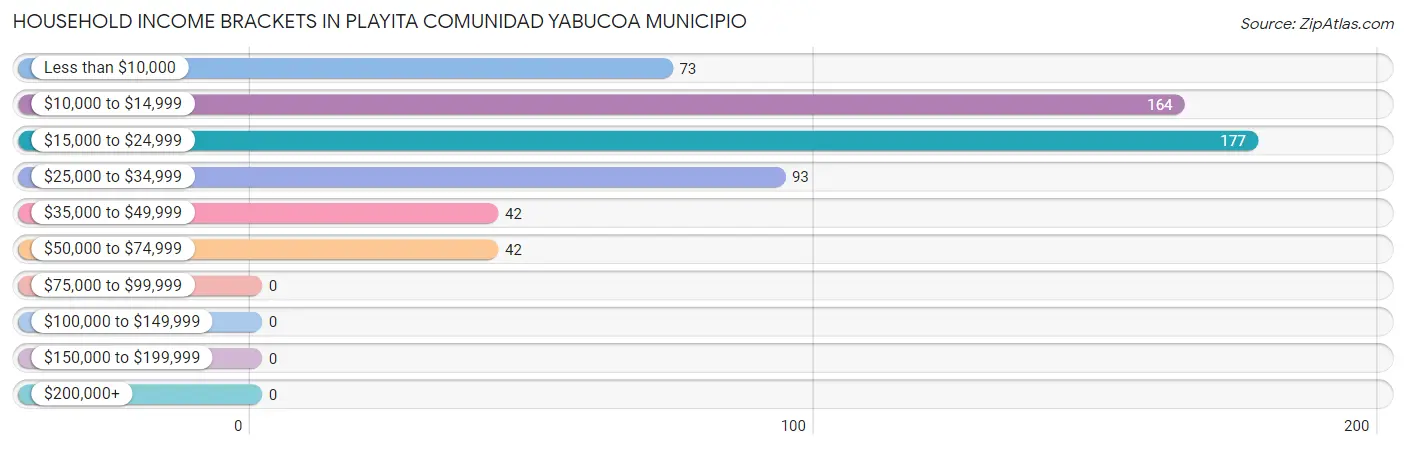
| Income Bracket | # Households | % Households |
| Less than $10,000 | 73 | 12.4% |
| $10,000 to $14,999 | 164 | 27.7% |
| $15,000 to $24,999 | 177 | 29.9% |
| $25,000 to $34,999 | 93 | 15.7% |
| $35,000 to $49,999 | 42 | 7.1% |
| $50,000 to $74,999 | 42 | 7.1% |
| $75,000 to $99,999 | 0 | 0.0% |
| $100,000 to $149,999 | 0 | 0.0% |
| $150,000 to $199,999 | 0 | 0.0% |
| $200,000+ | 0 | 0.0% |
Household Income by Householder Age in Playita comunidad Yabucoa Municipio
The median household income in Playita comunidad Yabucoa Municipio is $17,321, with the highest median household income of $24,583 found in the 25 to 44 years age bracket for the primary householder. A total of 113 households (19.1%) fall into this category.
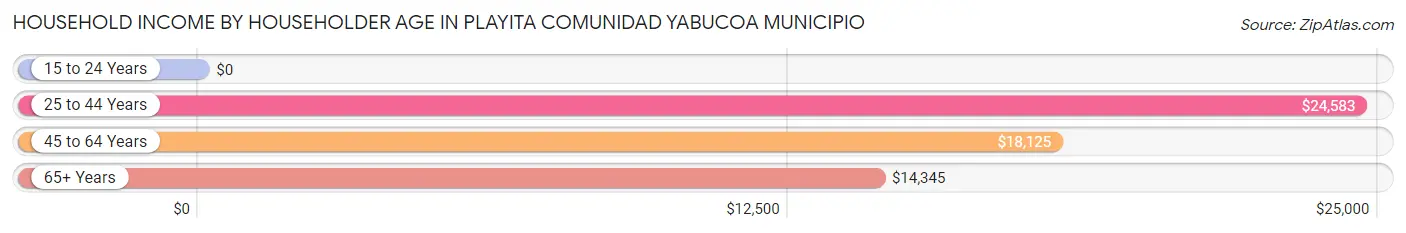
| Income Bracket | # Households | Median Income |
| 15 to 24 Years | 0 (0.0%) | $0 |
| 25 to 44 Years | 113 (19.1%) | $24,583 |
| 45 to 64 Years | 219 (37.1%) | $18,125 |
| 65+ Years | 259 (43.8%) | $14,345 |
| Total | 591 (100.0%) | $17,321 |
Poverty in Playita comunidad Yabucoa Municipio
Income Below Poverty by Sex and Age in Playita comunidad Yabucoa Municipio
With 48.1% poverty level for males and 59.3% for females among the residents of Playita comunidad Yabucoa Municipio, 6 to 11 year old males and 6 to 11 year old females are the most vulnerable to poverty, with 26 males (100.0%) and 56 females (100.0%) in their respective age groups living below the poverty level.
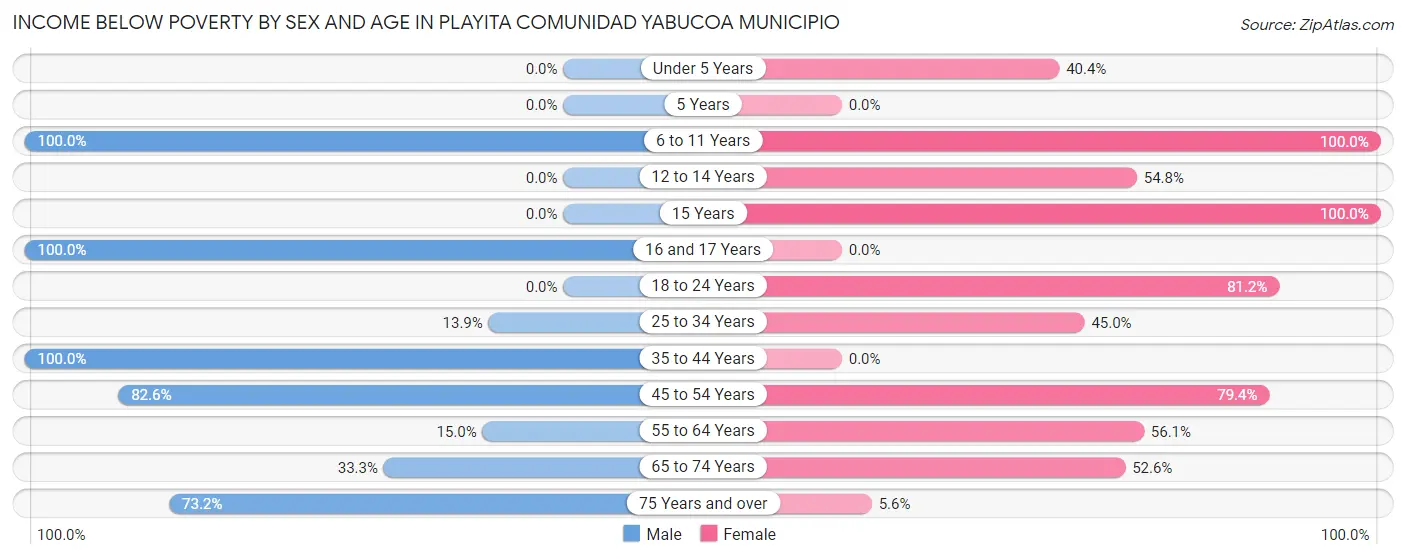
| Age Bracket | Male | Female |
| Under 5 Years | 0 (0.0%) | 23 (40.4%) |
| 5 Years | 0 (0.0%) | 0 (0.0%) |
| 6 to 11 Years | 26 (100.0%) | 56 (100.0%) |
| 12 to 14 Years | 0 (0.0%) | 23 (54.8%) |
| 15 Years | 0 (0.0%) | 42 (100.0%) |
| 16 and 17 Years | 12 (100.0%) | 0 (0.0%) |
| 18 to 24 Years | 0 (0.0%) | 69 (81.2%) |
| 25 to 34 Years | 19 (13.9%) | 59 (45.0%) |
| 35 to 44 Years | 46 (100.0%) | 0 (0.0%) |
| 45 to 54 Years | 95 (82.6%) | 73 (79.3%) |
| 55 to 64 Years | 15 (15.0%) | 60 (56.1%) |
| 65 to 74 Years | 34 (33.3%) | 101 (52.6%) |
| 75 Years and over | 60 (73.2%) | 1 (5.6%) |
| Total | 307 (48.1%) | 507 (59.3%) |
Income Above Poverty by Sex and Age in Playita comunidad Yabucoa Municipio
According to the poverty statistics in Playita comunidad Yabucoa Municipio, males aged under 5 years and females aged 35 to 44 years are the age groups that are most secure financially, with 100.0% of males and 100.0% of females in these age groups living above the poverty line.
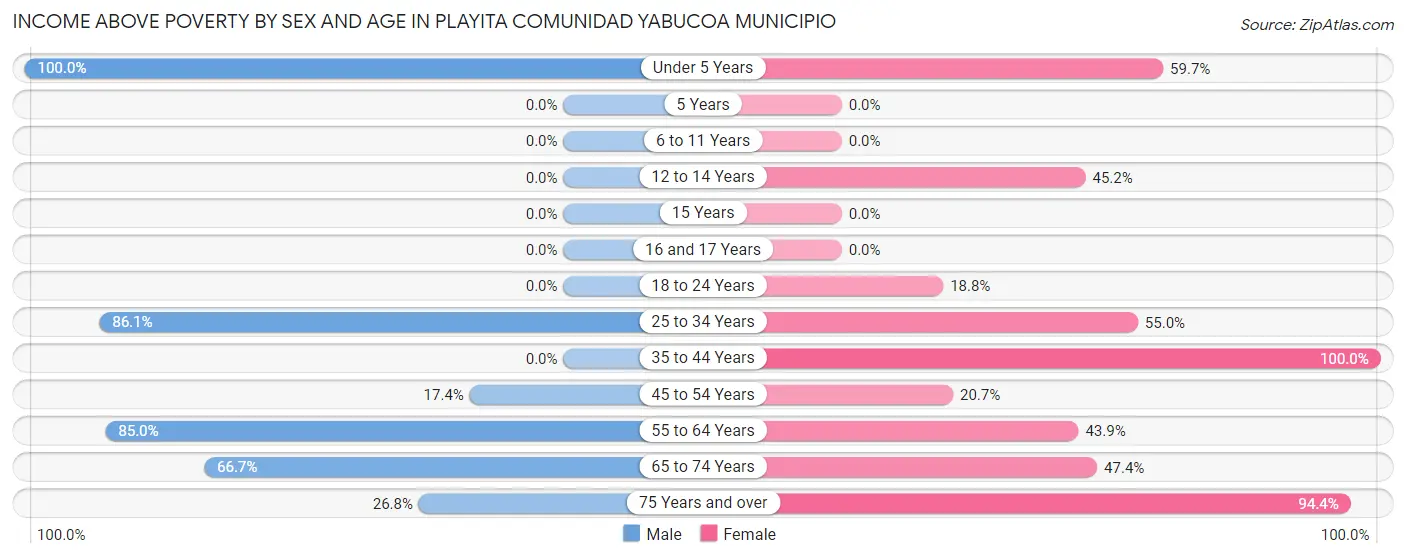
| Age Bracket | Male | Female |
| Under 5 Years | 18 (100.0%) | 34 (59.7%) |
| 5 Years | 0 (0.0%) | 0 (0.0%) |
| 6 to 11 Years | 0 (0.0%) | 0 (0.0%) |
| 12 to 14 Years | 0 (0.0%) | 19 (45.2%) |
| 15 Years | 0 (0.0%) | 0 (0.0%) |
| 16 and 17 Years | 0 (0.0%) | 0 (0.0%) |
| 18 to 24 Years | 0 (0.0%) | 16 (18.8%) |
| 25 to 34 Years | 118 (86.1%) | 72 (55.0%) |
| 35 to 44 Years | 0 (0.0%) | 33 (100.0%) |
| 45 to 54 Years | 20 (17.4%) | 19 (20.6%) |
| 55 to 64 Years | 85 (85.0%) | 47 (43.9%) |
| 65 to 74 Years | 68 (66.7%) | 91 (47.4%) |
| 75 Years and over | 22 (26.8%) | 17 (94.4%) |
| Total | 331 (51.9%) | 348 (40.7%) |
Income Below Poverty Among Married-Couple Families in Playita comunidad Yabucoa Municipio
The poverty statistics for married-couple families in Playita comunidad Yabucoa Municipio show that 33.2% or 63 of the total 190 families live below the poverty line. Families with 1 or 2 children have the highest poverty rate of 37.5%, comprising of 15 families. On the other hand, families with no children have the lowest poverty rate of 32.0%, which includes 48 families.
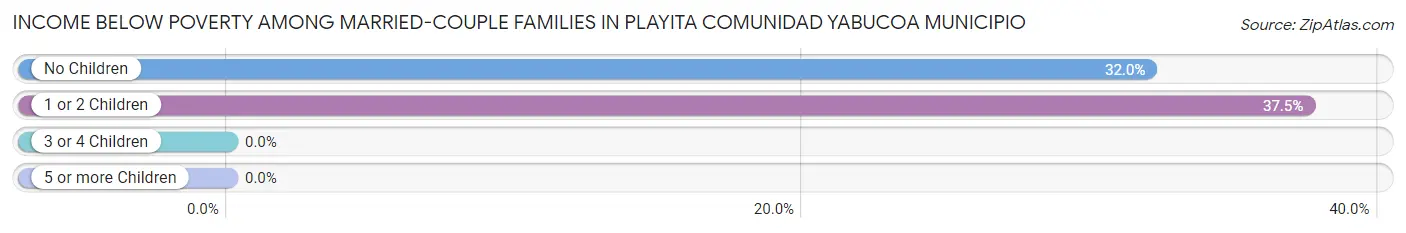
| Children | Above Poverty | Below Poverty |
| No Children | 102 (68.0%) | 48 (32.0%) |
| 1 or 2 Children | 25 (62.5%) | 15 (37.5%) |
| 3 or 4 Children | 0 (0.0%) | 0 (0.0%) |
| 5 or more Children | 0 (0.0%) | 0 (0.0%) |
| Total | 127 (66.8%) | 63 (33.2%) |
Income Below Poverty Among Single-Parent Households in Playita comunidad Yabucoa Municipio
According to the poverty data in Playita comunidad Yabucoa Municipio, 100.0% or 42 single-father households and 68.2% or 90 single-mother households are living below the poverty line. Among single-father households, those with no children have the highest poverty rate, with 23 households (100.0%) experiencing poverty. Likewise, among single-mother households, those with no children have the highest poverty rate, with 42 households (100.0%) falling below the poverty line.
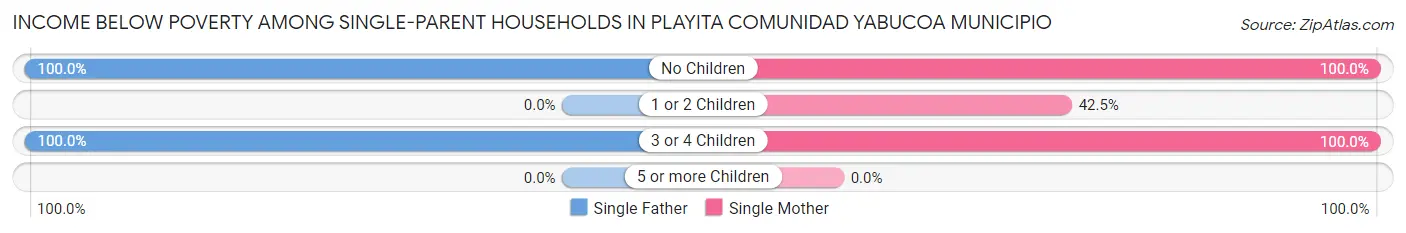
| Children | Single Father | Single Mother |
| No Children | 23 (100.0%) | 42 (100.0%) |
| 1 or 2 Children | 0 (0.0%) | 31 (42.5%) |
| 3 or 4 Children | 19 (100.0%) | 17 (100.0%) |
| 5 or more Children | 0 (0.0%) | 0 (0.0%) |
| Total | 42 (100.0%) | 90 (68.2%) |
Income Below Poverty Among Married-Couple vs Single-Parent Households in Playita comunidad Yabucoa Municipio
The poverty data for Playita comunidad Yabucoa Municipio shows that 63 of the married-couple family households (33.2%) and 132 of the single-parent households (75.9%) are living below the poverty level. Within the married-couple family households, those with 1 or 2 children have the highest poverty rate, with 15 households (37.5%) falling below the poverty line. Among the single-parent households, those with no children have the highest poverty rate, with 65 household (100.0%) living below poverty.
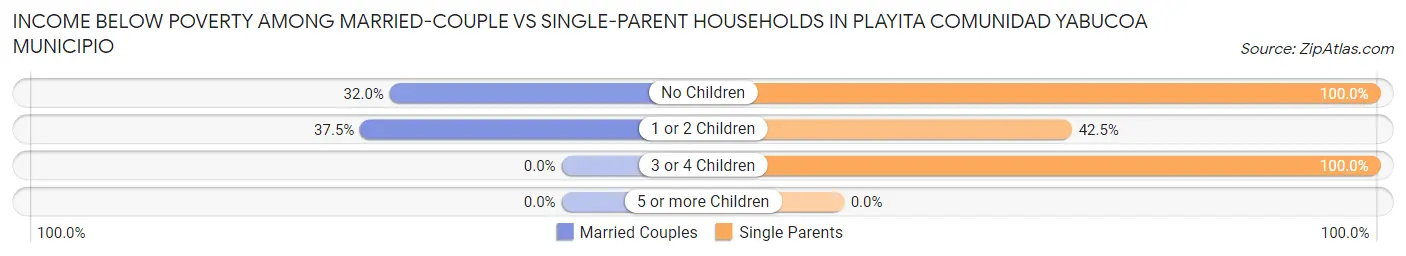
| Children | Married-Couple Families | Single-Parent Households |
| No Children | 48 (32.0%) | 65 (100.0%) |
| 1 or 2 Children | 15 (37.5%) | 31 (42.5%) |
| 3 or 4 Children | 0 (0.0%) | 36 (100.0%) |
| 5 or more Children | 0 (0.0%) | 0 (0.0%) |
| Total | 63 (33.2%) | 132 (75.9%) |
Race in Playita comunidad Yabucoa Municipio
The most populous races in Playita comunidad Yabucoa Municipio are Hispanic or Latino (1,493 | 100.0%), Some other Race (784 | 52.5%), and Black / African American (562 | 37.6%).
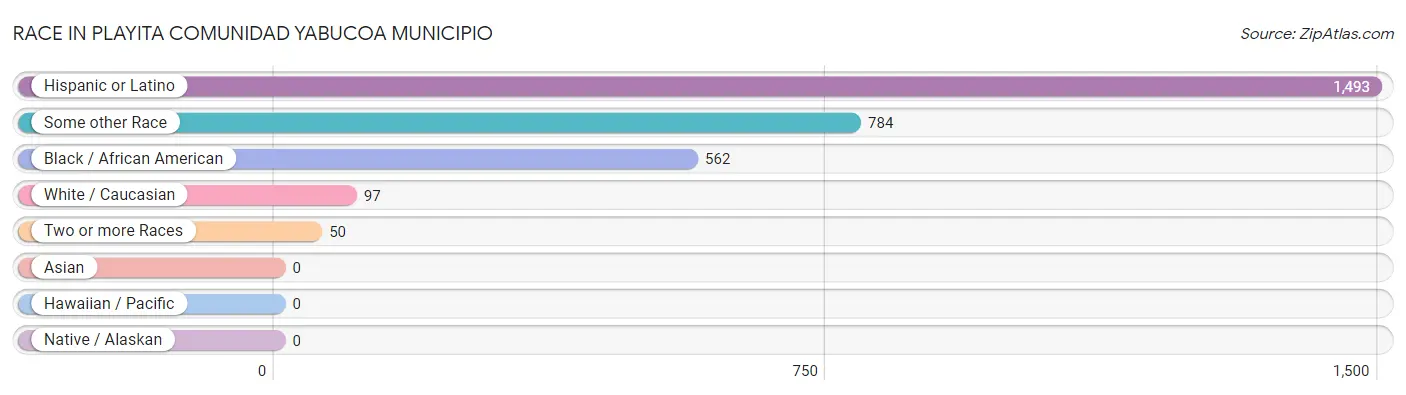
| Race | # Population | % Population |
| Asian | 0 | 0.0% |
| Black / African American | 562 | 37.6% |
| Hawaiian / Pacific | 0 | 0.0% |
| Hispanic or Latino | 1,493 | 100.0% |
| Native / Alaskan | 0 | 0.0% |
| White / Caucasian | 97 | 6.5% |
| Two or more Races | 50 | 3.4% |
| Some other Race | 784 | 52.5% |
| Total | 1,493 | 100.0% |
Ancestry in Playita comunidad Yabucoa Municipio
The most populous ancestries reported in Playita comunidad Yabucoa Municipio are Puerto Rican (1,473 | 98.7%), and Mexican (20 | 1.3%), together accounting for 100.0% of all Playita comunidad Yabucoa Municipio residents.
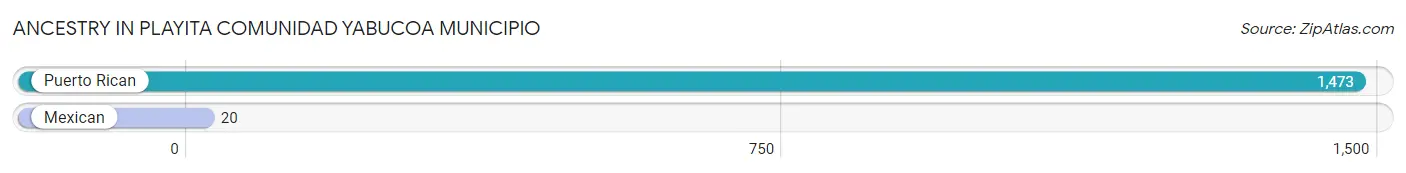
| Ancestry | # Population | % Population |
| Mexican | 20 | 1.3% |
| Puerto Rican | 1,473 | 98.7% | View All 2 Rows |
Immigrants in Playita comunidad Yabucoa Municipio

| Immigration Origin | # Population | % Population | View All 0 Rows |
Sex and Age in Playita comunidad Yabucoa Municipio
Sex and Age in Playita comunidad Yabucoa Municipio
The most populous age groups in Playita comunidad Yabucoa Municipio are 25 to 29 Years (105 | 16.5%) for men and 65 to 69 Years (117 | 13.7%) for women.
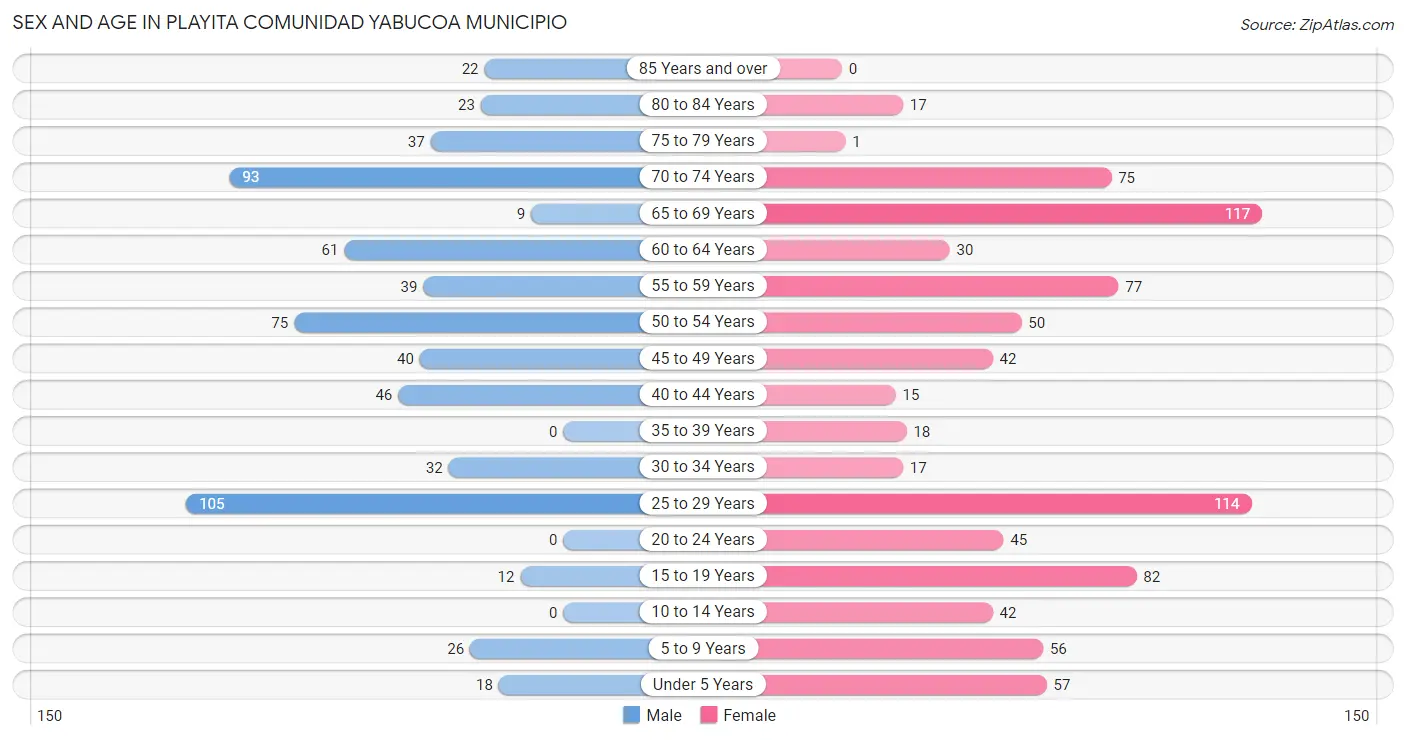
| Age Bracket | Male | Female |
| Under 5 Years | 18 (2.8%) | 57 (6.7%) |
| 5 to 9 Years | 26 (4.1%) | 56 (6.6%) |
| 10 to 14 Years | 0 (0.0%) | 42 (4.9%) |
| 15 to 19 Years | 12 (1.9%) | 82 (9.6%) |
| 20 to 24 Years | 0 (0.0%) | 45 (5.3%) |
| 25 to 29 Years | 105 (16.5%) | 114 (13.3%) |
| 30 to 34 Years | 32 (5.0%) | 17 (2.0%) |
| 35 to 39 Years | 0 (0.0%) | 18 (2.1%) |
| 40 to 44 Years | 46 (7.2%) | 15 (1.8%) |
| 45 to 49 Years | 40 (6.3%) | 42 (4.9%) |
| 50 to 54 Years | 75 (11.8%) | 50 (5.9%) |
| 55 to 59 Years | 39 (6.1%) | 77 (9.0%) |
| 60 to 64 Years | 61 (9.6%) | 30 (3.5%) |
| 65 to 69 Years | 9 (1.4%) | 117 (13.7%) |
| 70 to 74 Years | 93 (14.6%) | 75 (8.8%) |
| 75 to 79 Years | 37 (5.8%) | 1 (0.1%) |
| 80 to 84 Years | 23 (3.6%) | 17 (2.0%) |
| 85 Years and over | 22 (3.5%) | 0 (0.0%) |
| Total | 638 (100.0%) | 855 (100.0%) |
Families and Households in Playita comunidad Yabucoa Municipio
Median Family Size in Playita comunidad Yabucoa Municipio
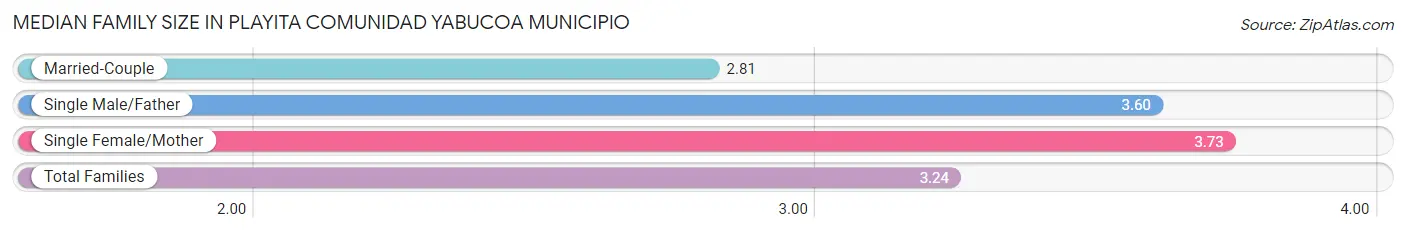
The median family size in Playita comunidad Yabucoa Municipio is 3.24 persons per family, with single female/mother families (132 | 36.3%) accounting for the largest median family size of 3.73 persons per family. On the other hand, married-couple families (190 | 52.2%) represent the smallest median family size with 2.81 persons per family.
| Family Type | # Families | Family Size |
| Married-Couple | 190 (52.2%) | 2.81 |
| Single Male/Father | 42 (11.5%) | 3.60 |
| Single Female/Mother | 132 (36.3%) | 3.73 |
| Total Families | 364 (100.0%) | 3.24 |
Median Household Size in Playita comunidad Yabucoa Municipio
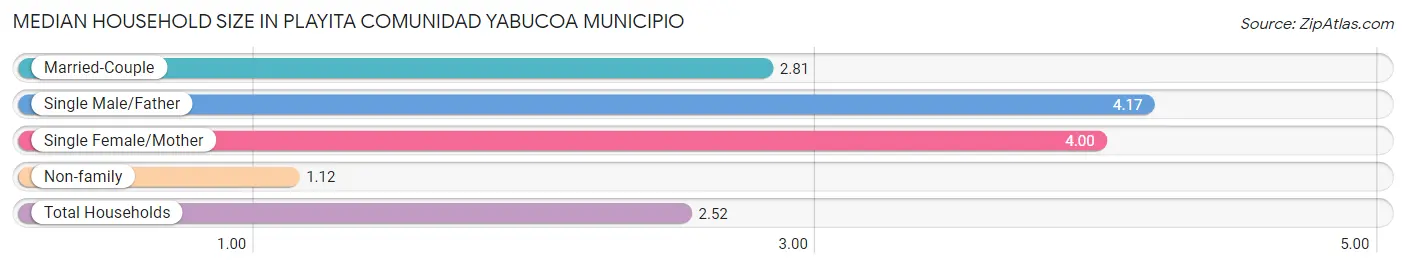
The median household size in Playita comunidad Yabucoa Municipio is 2.52 persons per household, with single male/father households (42 | 7.1%) accounting for the largest median household size of 4.17 persons per household. non-family households (227 | 38.4%) represent the smallest median household size with 1.12 persons per household.
| Household Type | # Households | Household Size |
| Married-Couple | 190 (32.2%) | 2.81 |
| Single Male/Father | 42 (7.1%) | 4.17 |
| Single Female/Mother | 132 (22.3%) | 4.00 |
| Non-family | 227 (38.4%) | 1.12 |
| Total Households | 591 (100.0%) | 2.52 |
Household Size by Marriage Status in Playita comunidad Yabucoa Municipio
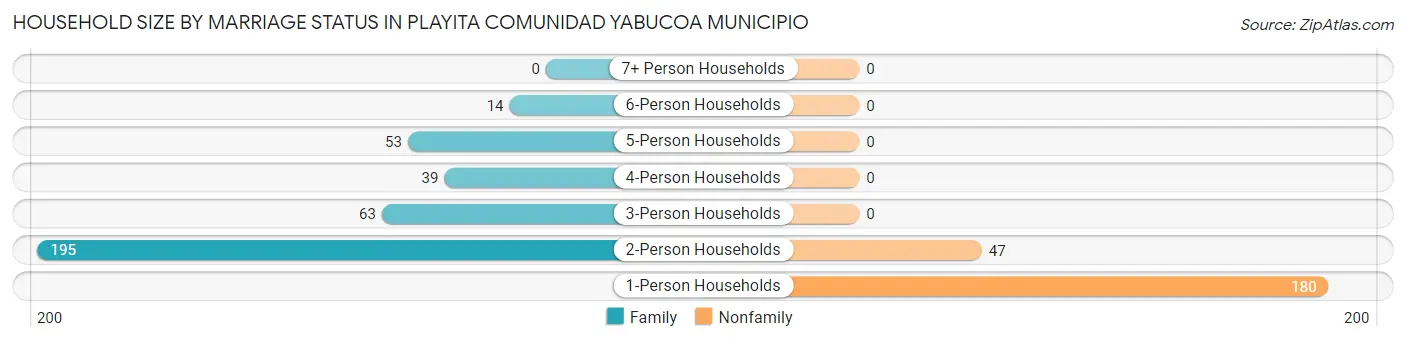
Out of a total of 591 households in Playita comunidad Yabucoa Municipio, 364 (61.6%) are family households, while 227 (38.4%) are nonfamily households. The most numerous type of family households are 2-person households, comprising 195, and the most common type of nonfamily households are 1-person households, comprising 180.
| Household Size | Family Households | Nonfamily Households |
| 1-Person Households | - | 180 (30.5%) |
| 2-Person Households | 195 (33.0%) | 47 (8.0%) |
| 3-Person Households | 63 (10.7%) | 0 (0.0%) |
| 4-Person Households | 39 (6.6%) | 0 (0.0%) |
| 5-Person Households | 53 (9.0%) | 0 (0.0%) |
| 6-Person Households | 14 (2.4%) | 0 (0.0%) |
| 7+ Person Households | 0 (0.0%) | 0 (0.0%) |
| Total | 364 (61.6%) | 227 (38.4%) |
Female Fertility in Playita comunidad Yabucoa Municipio
Fertility by Age in Playita comunidad Yabucoa Municipio
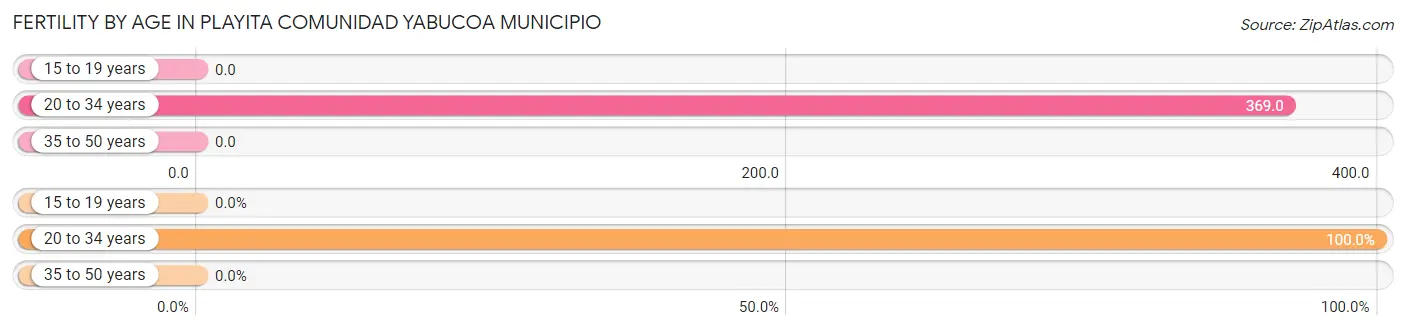
Average fertility rate in Playita comunidad Yabucoa Municipio is 195.0 births per 1,000 women. Women in the age bracket of 20 to 34 years have the highest fertility rate with 369.0 births per 1,000 women. Women in the age bracket of 20 to 34 years acount for 100.0% of all women with births.
| Age Bracket | Women with Births | Births / 1,000 Women |
| 15 to 19 years | 0 (0.0%) | 0.0 |
| 20 to 34 years | 65 (100.0%) | 369.0 |
| 35 to 50 years | 0 (0.0%) | 0.0 |
| Total | 65 (100.0%) | 195.0 |
Fertility by Age by Marriage Status in Playita comunidad Yabucoa Municipio
73.8% of women with births (65) in Playita comunidad Yabucoa Municipio are married. The highest percentage of unmarried women with births falls into 20 to 34 years age bracket with 26.2% of them unmarried at the time of birth, while the lowest percentage of unmarried women with births belong to 20 to 34 years age bracket with 26.1% of them unmarried.
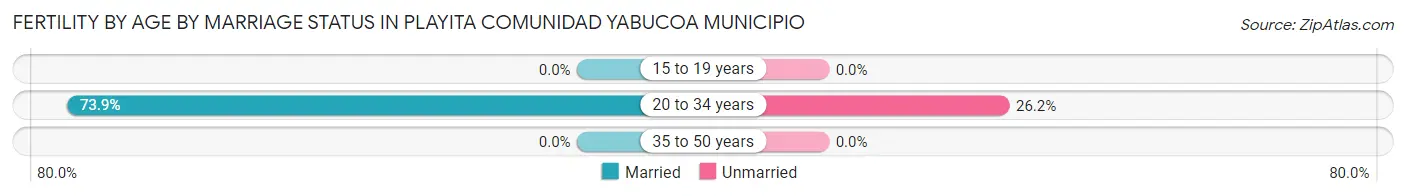
| Age Bracket | Married | Unmarried |
| 15 to 19 years | 0 (0.0%) | 0 (0.0%) |
| 20 to 34 years | 48 (73.9%) | 17 (26.2%) |
| 35 to 50 years | 0 (0.0%) | 0 (0.0%) |
| Total | 48 (73.9%) | 17 (26.2%) |
Fertility by Education in Playita comunidad Yabucoa Municipio
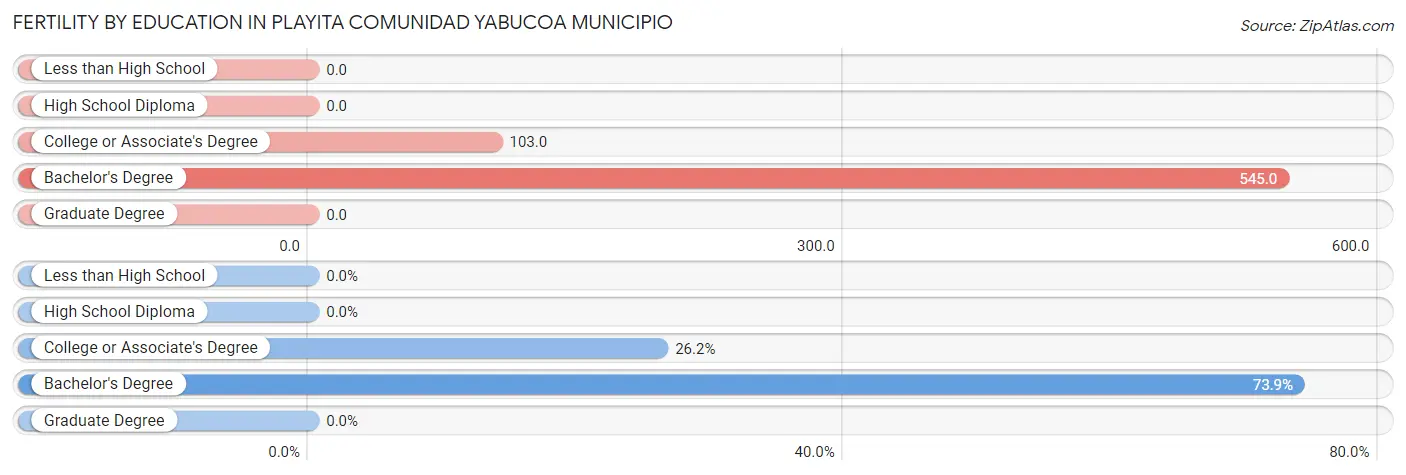
| Educational Attainment | Women with Births | Births / 1,000 Women |
| Less than High School | 0 (0.0%) | 0.0 |
| High School Diploma | 0 (0.0%) | 0.0 |
| College or Associate's Degree | 17 (26.2%) | 103.0 |
| Bachelor's Degree | 48 (73.9%) | 545.0 |
| Graduate Degree | 0 (0.0%) | 0.0 |
| Total | 65 (100.0%) | 195.0 |
Fertility by Education by Marriage Status in Playita comunidad Yabucoa Municipio
26.2% of women with births in Playita comunidad Yabucoa Municipio are unmarried. Women with the educational attainment of bachelor's degree are most likely to be married with 100.0% of them married at childbirth, while women with the educational attainment of college or associate's degree are least likely to be married with 100.0% of them unmarried at childbirth.
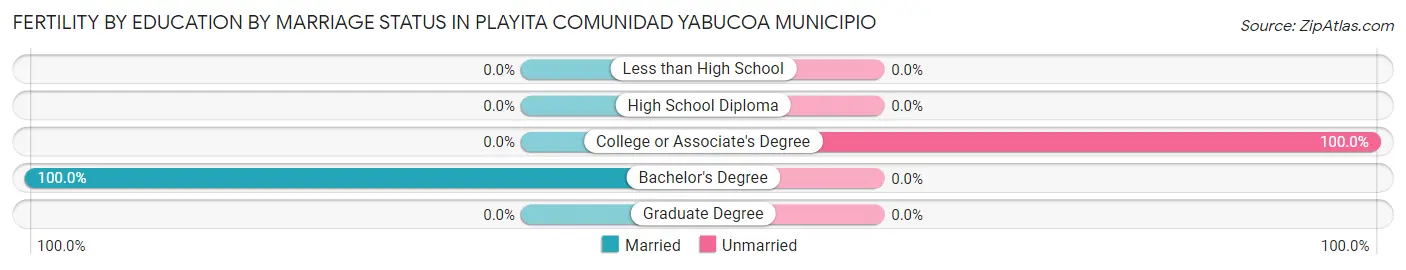
| Educational Attainment | Married | Unmarried |
| Less than High School | 0 (0.0%) | 0 (0.0%) |
| High School Diploma | 0 (0.0%) | 0 (0.0%) |
| College or Associate's Degree | 0 (0.0%) | 17 (100.0%) |
| Bachelor's Degree | 48 (100.0%) | 0 (0.0%) |
| Graduate Degree | 0 (0.0%) | 0 (0.0%) |
| Total | 48 (73.9%) | 17 (26.2%) |
Employment Characteristics in Playita comunidad Yabucoa Municipio
Employment by Class of Employer in Playita comunidad Yabucoa Municipio
Among the 285 employed individuals in Playita comunidad Yabucoa Municipio, private company employees (187 | 65.6%), not-for-profit organizations (58 | 20.3%), and self-employed (not incorporated) (25 | 8.8%) make up the most common classes of employment.
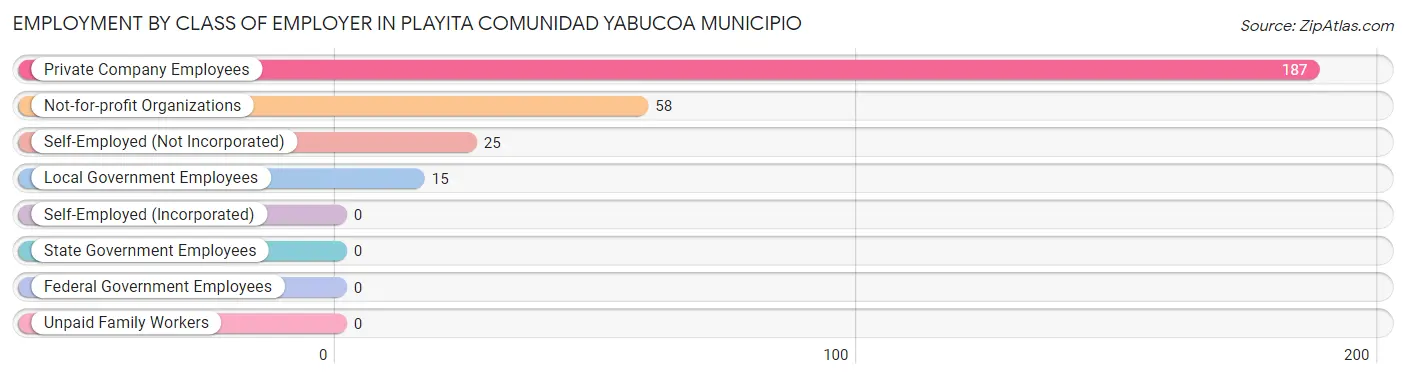
| Employer Class | # Employees | % Employees |
| Private Company Employees | 187 | 65.6% |
| Self-Employed (Incorporated) | 0 | 0.0% |
| Self-Employed (Not Incorporated) | 25 | 8.8% |
| Not-for-profit Organizations | 58 | 20.3% |
| Local Government Employees | 15 | 5.3% |
| State Government Employees | 0 | 0.0% |
| Federal Government Employees | 0 | 0.0% |
| Unpaid Family Workers | 0 | 0.0% |
| Total | 285 | 100.0% |
Employment Status by Age in Playita comunidad Yabucoa Municipio
According to the labor force statistics for Playita comunidad Yabucoa Municipio, out of the total population over 16 years of age (1,252), 29.9% or 374 individuals are in the labor force, with 11.0% or 41 of them unemployed. The age group with the highest labor force participation rate is 25 to 29 years, with 89.0% or 195 individuals in the labor force. Within the labor force, the 35 to 44 years age range has the highest percentage of unemployed individuals, with 61.5% or 24 of them being unemployed.
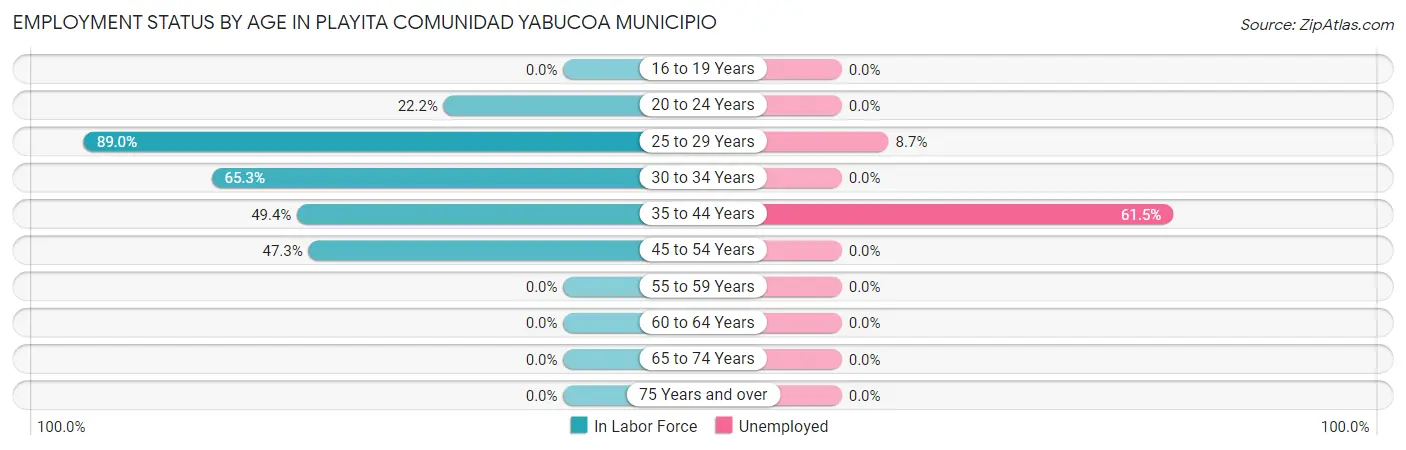
| Age Bracket | In Labor Force | Unemployed |
| 16 to 19 Years | 0 (0.0%) | 0 (0.0%) |
| 20 to 24 Years | 10 (22.2%) | 0 (0.0%) |
| 25 to 29 Years | 195 (89.0%) | 17 (8.7%) |
| 30 to 34 Years | 32 (65.3%) | 0 (0.0%) |
| 35 to 44 Years | 39 (49.4%) | 24 (61.5%) |
| 45 to 54 Years | 98 (47.3%) | 0 (0.0%) |
| 55 to 59 Years | 0 (0.0%) | 0 (0.0%) |
| 60 to 64 Years | 0 (0.0%) | 0 (0.0%) |
| 65 to 74 Years | 0 (0.0%) | 0 (0.0%) |
| 75 Years and over | 0 (0.0%) | 0 (0.0%) |
| Total | 374 (29.9%) | 41 (11.0%) |
Employment Status by Educational Attainment in Playita comunidad Yabucoa Municipio
According to labor force statistics for Playita comunidad Yabucoa Municipio, 47.8% of individuals (364) out of the total population between 25 and 64 years of age (761) are in the labor force, with 11.3% or 41 of them being unemployed. The group with the highest labor force participation rate are those with the educational attainment of bachelor's degree or higher, with 69.7% or 108 individuals in the labor force. Within the labor force, individuals with high school diploma education have the highest percentage of unemployment, with 33.3% or 24 of them being unemployed.
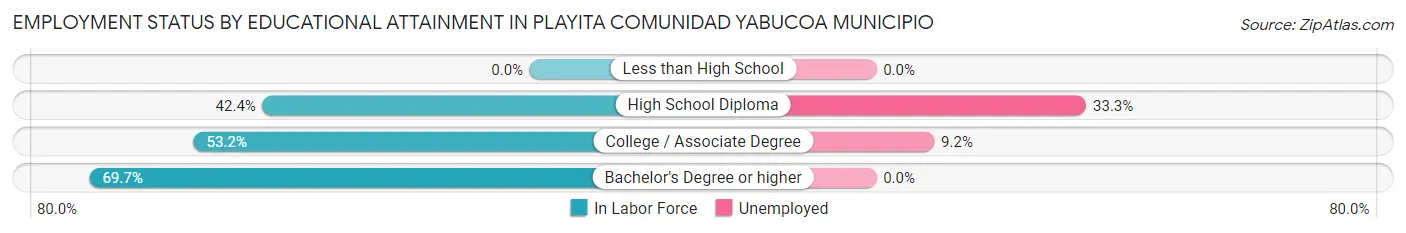
| Educational Attainment | In Labor Force | Unemployed |
| Less than High School | 0 (0.0%) | 0 (0.0%) |
| High School Diploma | 72 (42.4%) | 57 (33.3%) |
| College / Associate Degree | 184 (53.2%) | 32 (9.2%) |
| Bachelor's Degree or higher | 108 (69.7%) | 0 (0.0%) |
| Total | 364 (47.8%) | 86 (11.3%) |
Employment Occupations by Sex in Playita comunidad Yabucoa Municipio
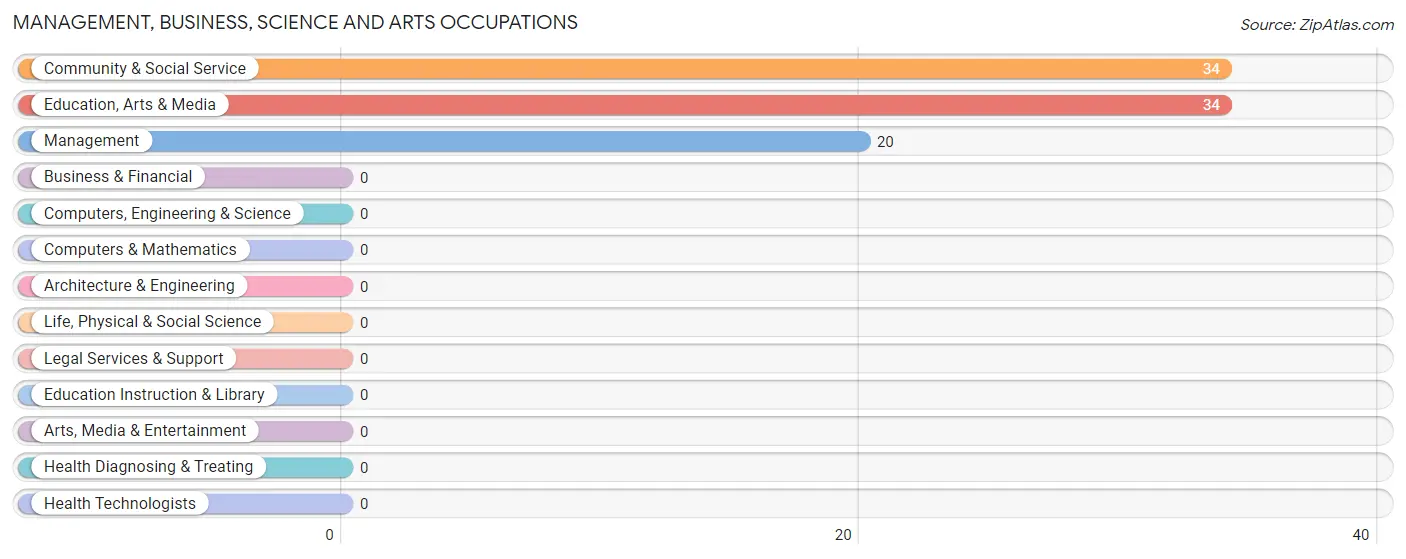
Management, Business, Science and Arts Occupations
The most common Management, Business, Science and Arts occupations in Playita comunidad Yabucoa Municipio are Community & Social Service (34 | 10.2%), Education, Arts & Media (34 | 10.2%), and Management (20 | 6.0%).
Management, Business, Science and Arts Occupations by Sex
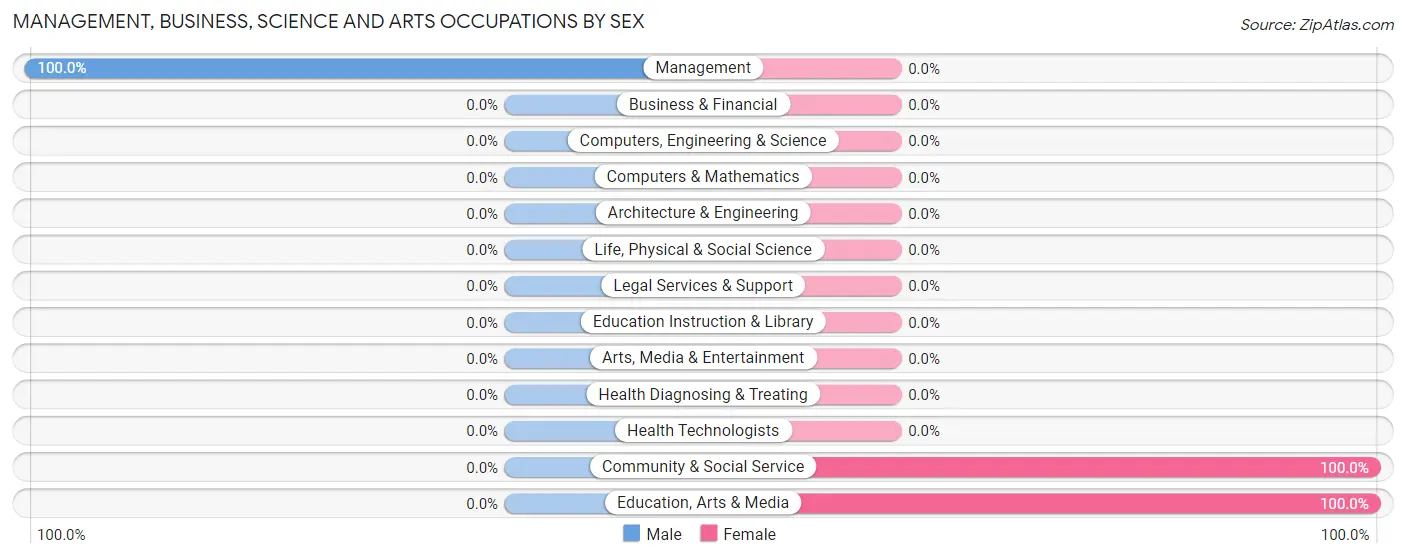
| Occupation | Male | Female |
| Management | 20 (100.0%) | 0 (0.0%) |
| Business & Financial | 0 (0.0%) | 0 (0.0%) |
| Computers, Engineering & Science | 0 (0.0%) | 0 (0.0%) |
| Computers & Mathematics | 0 (0.0%) | 0 (0.0%) |
| Architecture & Engineering | 0 (0.0%) | 0 (0.0%) |
| Life, Physical & Social Science | 0 (0.0%) | 0 (0.0%) |
| Community & Social Service | 0 (0.0%) | 34 (100.0%) |
| Education, Arts & Media | 0 (0.0%) | 34 (100.0%) |
| Legal Services & Support | 0 (0.0%) | 0 (0.0%) |
| Education Instruction & Library | 0 (0.0%) | 0 (0.0%) |
| Arts, Media & Entertainment | 0 (0.0%) | 0 (0.0%) |
| Health Diagnosing & Treating | 0 (0.0%) | 0 (0.0%) |
| Health Technologists | 0 (0.0%) | 0 (0.0%) |
| Total (Category) | 20 (37.0%) | 34 (63.0%) |
| Total (Overall) | 157 (47.1%) | 176 (52.8%) |
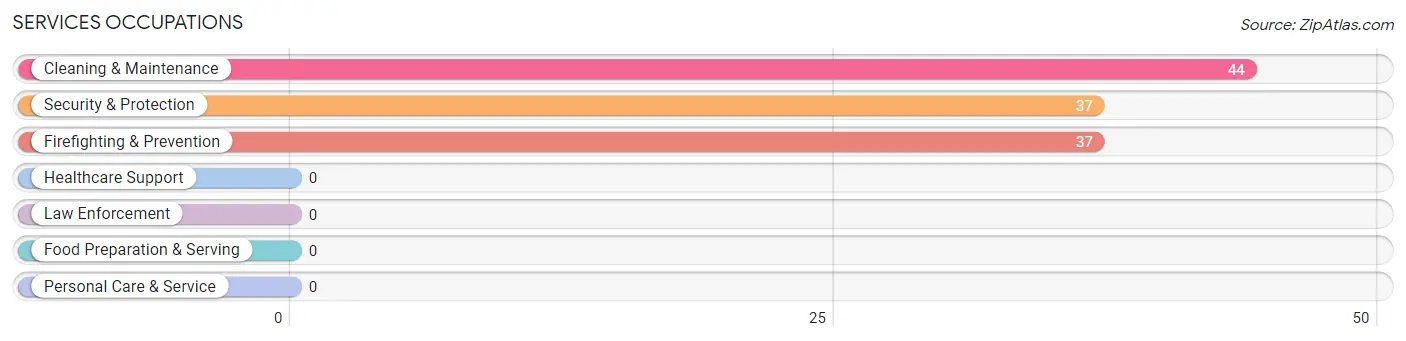
Services Occupations
The most common Services occupations in Playita comunidad Yabucoa Municipio are Cleaning & Maintenance (44 | 13.2%), Security & Protection (37 | 11.1%), and Firefighting & Prevention (37 | 11.1%).
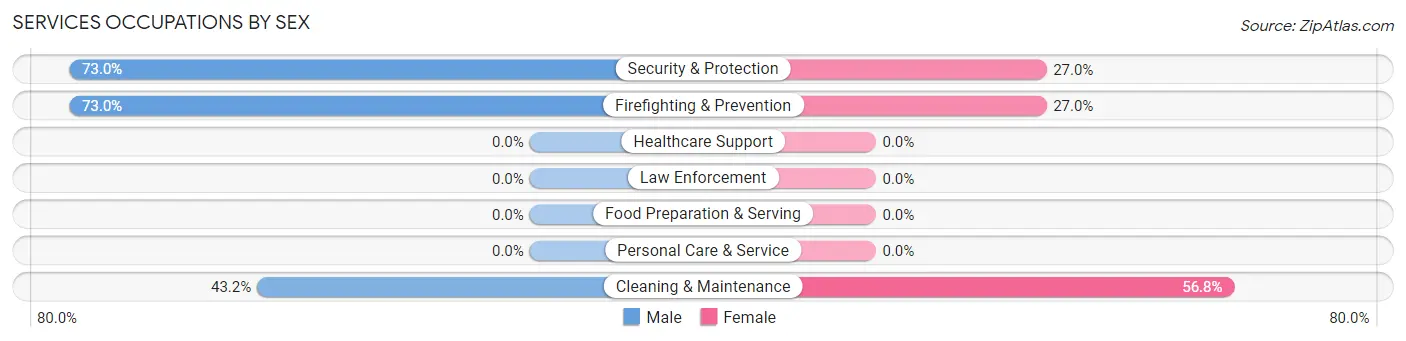
Services Occupations by Sex
Within the Services occupations in Playita comunidad Yabucoa Municipio, the most male-oriented occupations are Security & Protection (73.0%), Firefighting & Prevention (73.0%), and Cleaning & Maintenance (43.2%), while the most female-oriented occupations are Cleaning & Maintenance (56.8%), Security & Protection (27.0%), and Firefighting & Prevention (27.0%).
| Occupation | Male | Female |
| Healthcare Support | 0 (0.0%) | 0 (0.0%) |
| Security & Protection | 27 (73.0%) | 10 (27.0%) |
| Firefighting & Prevention | 27 (73.0%) | 10 (27.0%) |
| Law Enforcement | 0 (0.0%) | 0 (0.0%) |
| Food Preparation & Serving | 0 (0.0%) | 0 (0.0%) |
| Cleaning & Maintenance | 19 (43.2%) | 25 (56.8%) |
| Personal Care & Service | 0 (0.0%) | 0 (0.0%) |
| Total (Category) | 46 (56.8%) | 35 (43.2%) |
| Total (Overall) | 157 (47.1%) | 176 (52.8%) |
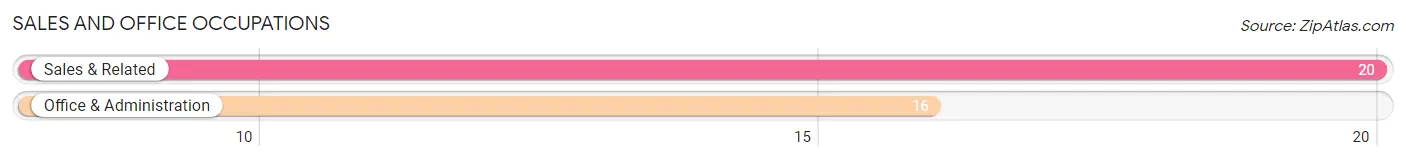
Sales and Office Occupations
The most common Sales and Office occupations in Playita comunidad Yabucoa Municipio are Sales & Related (20 | 6.0%), and Office & Administration (16 | 4.8%).
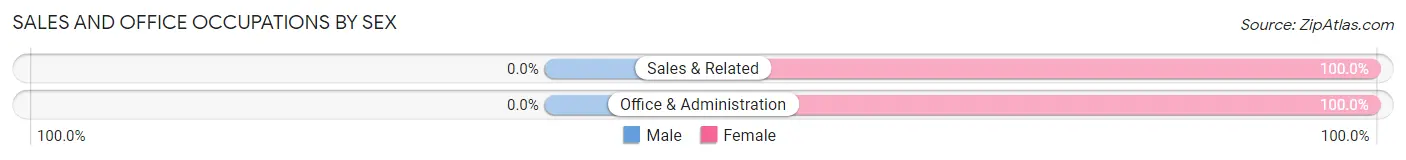
Sales and Office Occupations by Sex
| Occupation | Male | Female |
| Sales & Related | 0 (0.0%) | 20 (100.0%) |
| Office & Administration | 0 (0.0%) | 16 (100.0%) |
| Total (Category) | 0 (0.0%) | 36 (100.0%) |
| Total (Overall) | 157 (47.1%) | 176 (52.8%) |
Natural Resources, Construction and Maintenance Occupations
The most common Natural Resources, Construction and Maintenance occupations in Playita comunidad Yabucoa Municipio are , and Construction & Extraction (13 | 3.9%).
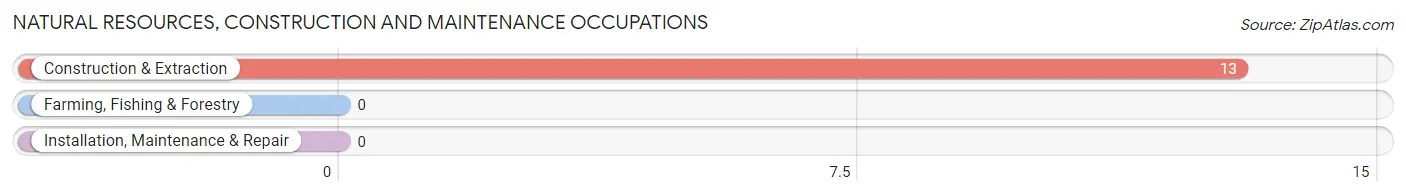
Natural Resources, Construction and Maintenance Occupations by Sex
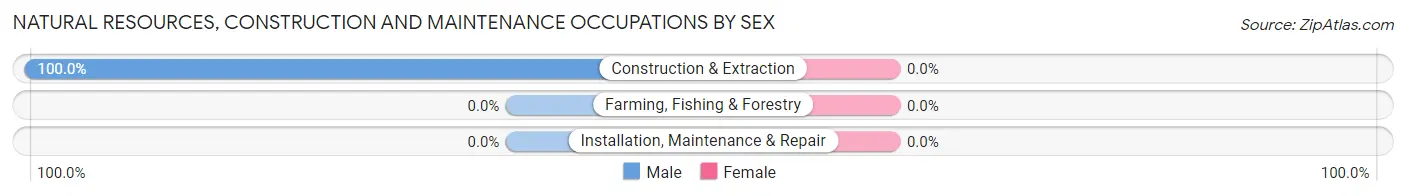
| Occupation | Male | Female |
| Farming, Fishing & Forestry | 0 (0.0%) | 0 (0.0%) |
| Construction & Extraction | 13 (100.0%) | 0 (0.0%) |
| Installation, Maintenance & Repair | 0 (0.0%) | 0 (0.0%) |
| Total (Category) | 13 (100.0%) | 0 (0.0%) |
| Total (Overall) | 157 (47.1%) | 176 (52.8%) |
Production, Transportation and Moving Occupations
The most common Production, Transportation and Moving occupations in Playita comunidad Yabucoa Municipio are Production (126 | 37.8%), and Material Moving (23 | 6.9%).
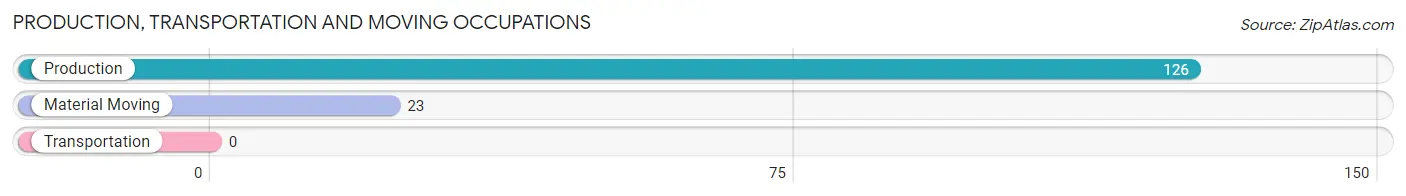
Production, Transportation and Moving Occupations by Sex
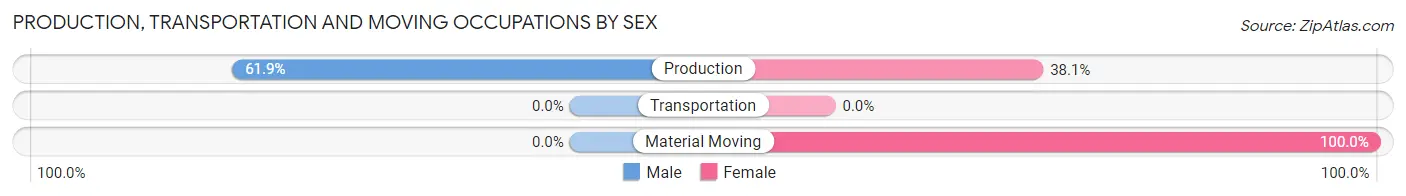
| Occupation | Male | Female |
| Production | 78 (61.9%) | 48 (38.1%) |
| Transportation | 0 (0.0%) | 0 (0.0%) |
| Material Moving | 0 (0.0%) | 23 (100.0%) |
| Total (Category) | 78 (52.3%) | 71 (47.6%) |
| Total (Overall) | 157 (47.1%) | 176 (52.8%) |
Employment Industries by Sex in Playita comunidad Yabucoa Municipio
Employment Industries in Playita comunidad Yabucoa Municipio
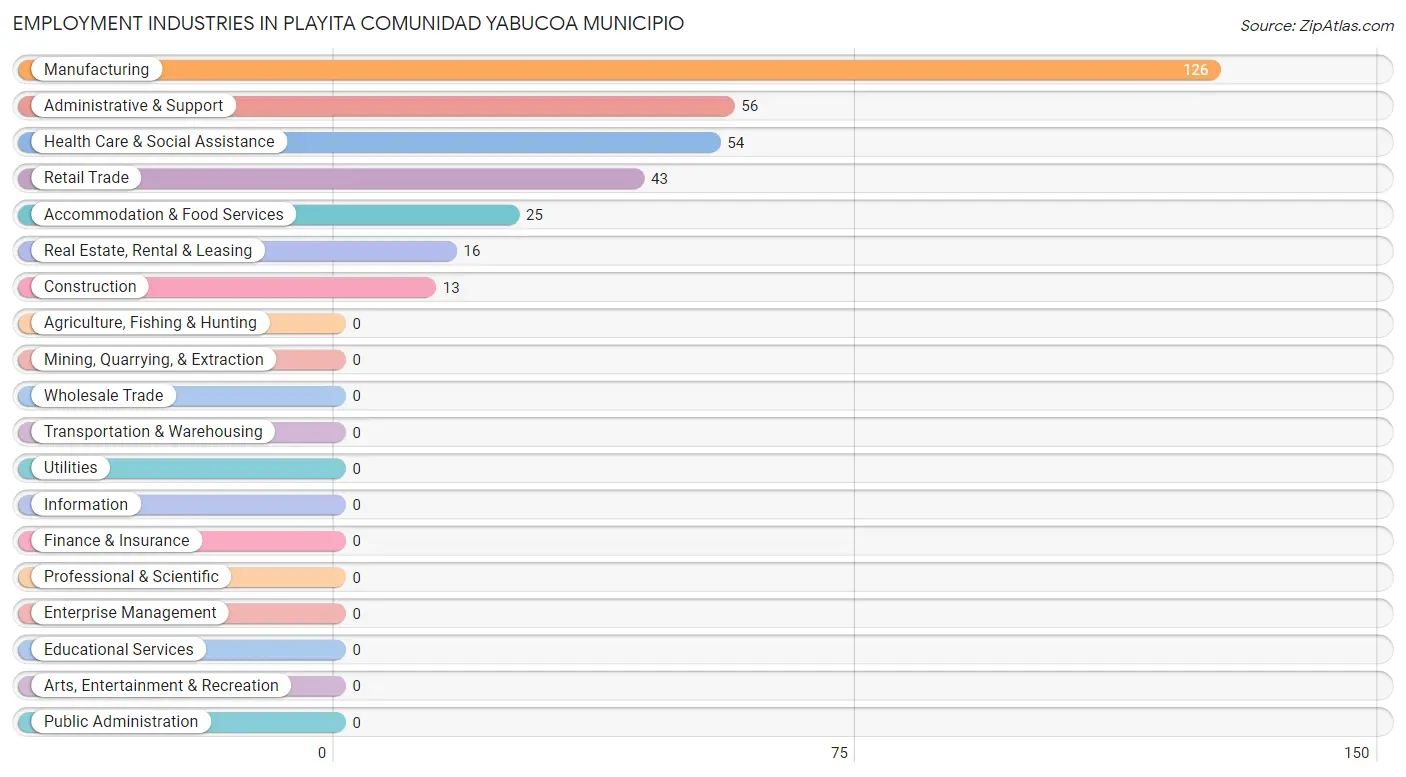
The major employment industries in Playita comunidad Yabucoa Municipio include Manufacturing (126 | 37.8%), Administrative & Support (56 | 16.8%), Health Care & Social Assistance (54 | 16.2%), Retail Trade (43 | 12.9%), and Accommodation & Food Services (25 | 7.5%).
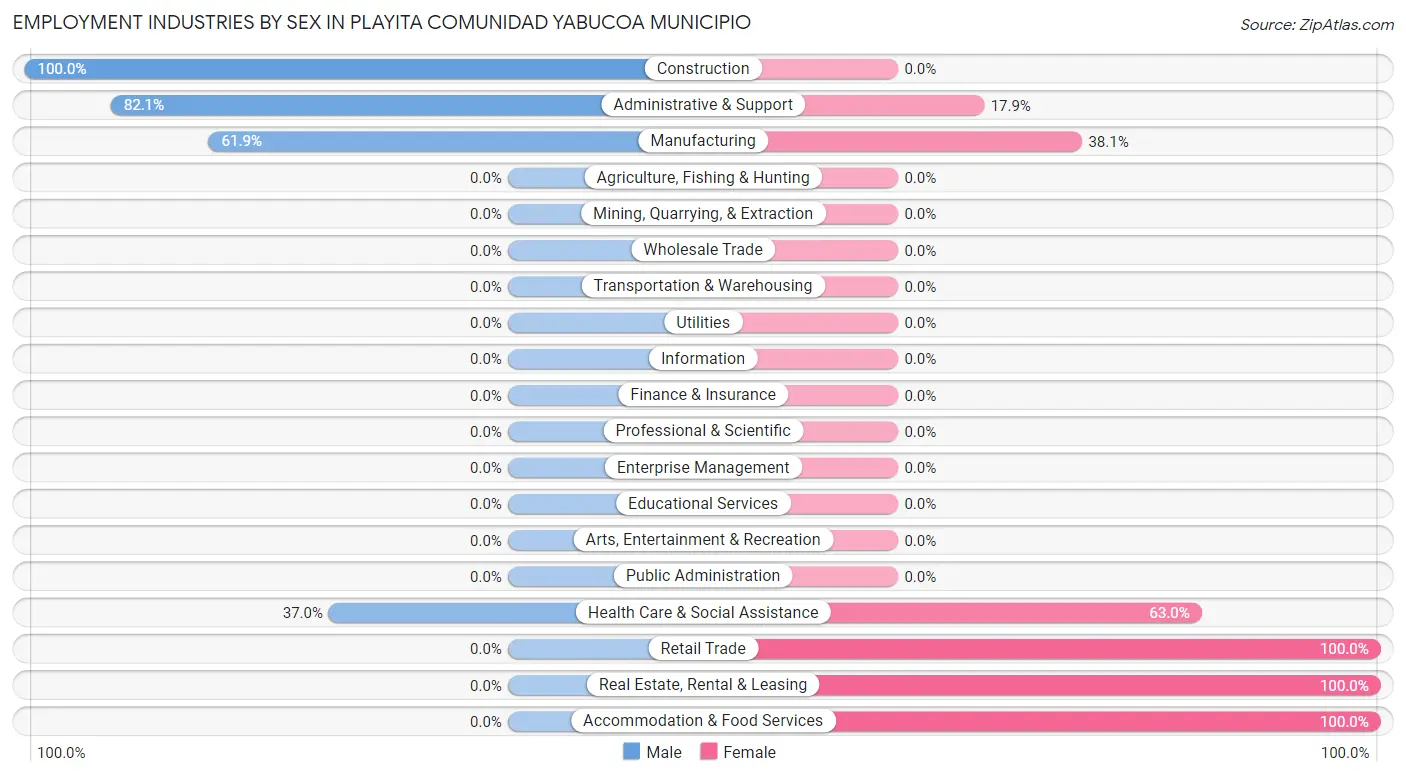
Employment Industries by Sex in Playita comunidad Yabucoa Municipio
The Playita comunidad Yabucoa Municipio industries that see more men than women are Construction (100.0%), Administrative & Support (82.1%), and Manufacturing (61.9%), whereas the industries that tend to have a higher number of women are Retail Trade (100.0%), Real Estate, Rental & Leasing (100.0%), and Accommodation & Food Services (100.0%).
| Industry | Male | Female |
| Agriculture, Fishing & Hunting | 0 (0.0%) | 0 (0.0%) |
| Mining, Quarrying, & Extraction | 0 (0.0%) | 0 (0.0%) |
| Construction | 13 (100.0%) | 0 (0.0%) |
| Manufacturing | 78 (61.9%) | 48 (38.1%) |
| Wholesale Trade | 0 (0.0%) | 0 (0.0%) |
| Retail Trade | 0 (0.0%) | 43 (100.0%) |
| Transportation & Warehousing | 0 (0.0%) | 0 (0.0%) |
| Utilities | 0 (0.0%) | 0 (0.0%) |
| Information | 0 (0.0%) | 0 (0.0%) |
| Finance & Insurance | 0 (0.0%) | 0 (0.0%) |
| Real Estate, Rental & Leasing | 0 (0.0%) | 16 (100.0%) |
| Professional & Scientific | 0 (0.0%) | 0 (0.0%) |
| Enterprise Management | 0 (0.0%) | 0 (0.0%) |
| Administrative & Support | 46 (82.1%) | 10 (17.9%) |
| Educational Services | 0 (0.0%) | 0 (0.0%) |
| Health Care & Social Assistance | 20 (37.0%) | 34 (63.0%) |
| Arts, Entertainment & Recreation | 0 (0.0%) | 0 (0.0%) |
| Accommodation & Food Services | 0 (0.0%) | 25 (100.0%) |
| Public Administration | 0 (0.0%) | 0 (0.0%) |
| Total | 157 (47.1%) | 176 (52.8%) |
Education in Playita comunidad Yabucoa Municipio
School Enrollment in Playita comunidad Yabucoa Municipio
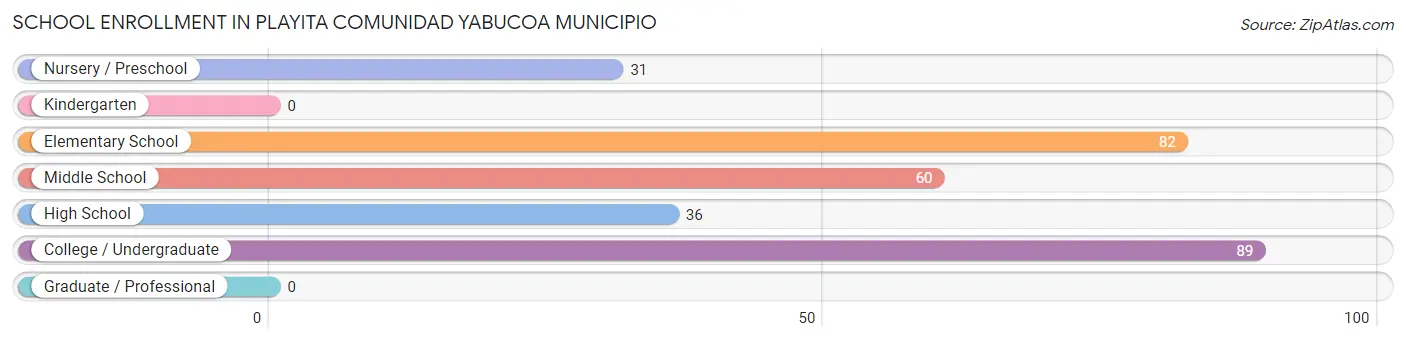
The most common levels of schooling among the 298 students in Playita comunidad Yabucoa Municipio are college / undergraduate (89 | 29.9%), elementary school (82 | 27.5%), and middle school (60 | 20.1%).
| School Level | # Students | % Students |
| Nursery / Preschool | 31 | 10.4% |
| Kindergarten | 0 | 0.0% |
| Elementary School | 82 | 27.5% |
| Middle School | 60 | 20.1% |
| High School | 36 | 12.1% |
| College / Undergraduate | 89 | 29.9% |
| Graduate / Professional | 0 | 0.0% |
| Total | 298 | 100.0% |
School Enrollment by Age by Funding Source in Playita comunidad Yabucoa Municipio
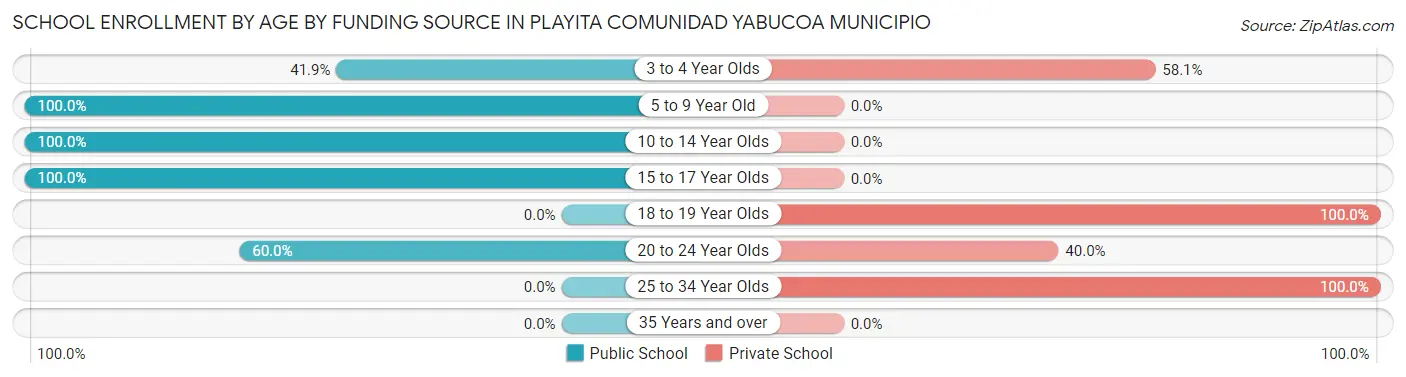
Out of a total of 298 students who are enrolled in schools in Playita comunidad Yabucoa Municipio, 86 (28.9%) attend a private institution, while the remaining 212 (71.1%) are enrolled in public schools. The age group of 18 to 19 year olds has the highest likelihood of being enrolled in private schools, with 29 (100.0% in the age bracket) enrolled. Conversely, the age group of 5 to 9 year old has the lowest likelihood of being enrolled in a private school, with 82 (100.0% in the age bracket) attending a public institution.
| Age Bracket | Public School | Private School |
| 3 to 4 Year Olds | 13 (41.9%) | 18 (58.1%) |
| 5 to 9 Year Old | 82 (100.0%) | 0 (0.0%) |
| 10 to 14 Year Olds | 42 (100.0%) | 0 (0.0%) |
| 15 to 17 Year Olds | 54 (100.0%) | 0 (0.0%) |
| 18 to 19 Year Olds | 0 (0.0%) | 29 (100.0%) |
| 20 to 24 Year Olds | 21 (60.0%) | 14 (40.0%) |
| 25 to 34 Year Olds | 0 (0.0%) | 25 (100.0%) |
| 35 Years and over | 0 (0.0%) | 0 (0.0%) |
| Total | 212 (71.1%) | 86 (28.9%) |
Educational Attainment by Field of Study in Playita comunidad Yabucoa Municipio
Business (78 | 47.3%), bio, nature & agricultural (48 | 29.1%), science & technology (24 | 14.5%), and psychology (15 | 9.1%) are the most common fields of study among 165 individuals in Playita comunidad Yabucoa Municipio who have obtained a bachelor's degree or higher.
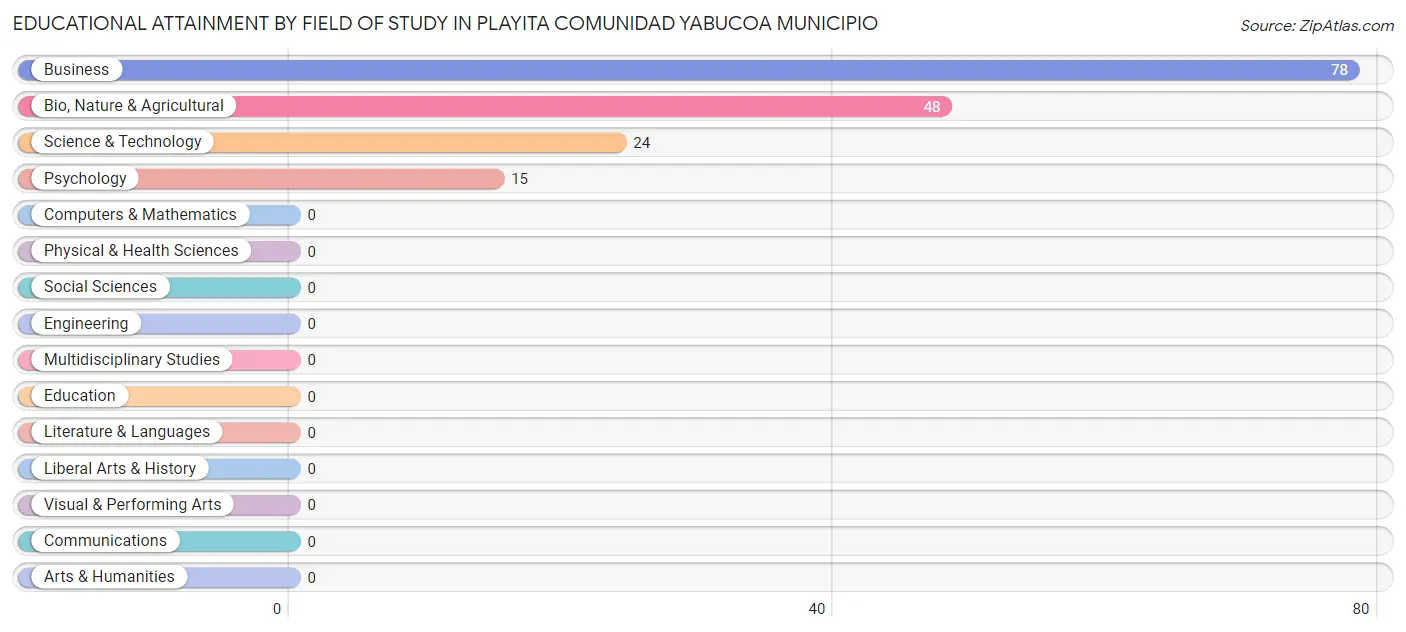
| Field of Study | # Graduates | % Graduates |
| Computers & Mathematics | 0 | 0.0% |
| Bio, Nature & Agricultural | 48 | 29.1% |
| Physical & Health Sciences | 0 | 0.0% |
| Psychology | 15 | 9.1% |
| Social Sciences | 0 | 0.0% |
| Engineering | 0 | 0.0% |
| Multidisciplinary Studies | 0 | 0.0% |
| Science & Technology | 24 | 14.5% |
| Business | 78 | 47.3% |
| Education | 0 | 0.0% |
| Literature & Languages | 0 | 0.0% |
| Liberal Arts & History | 0 | 0.0% |
| Visual & Performing Arts | 0 | 0.0% |
| Communications | 0 | 0.0% |
| Arts & Humanities | 0 | 0.0% |
| Total | 165 | 100.0% |
Transportation & Commute in Playita comunidad Yabucoa Municipio
Vehicle Availability by Sex in Playita comunidad Yabucoa Municipio
The most prevalent vehicle ownership categories in Playita comunidad Yabucoa Municipio are males with 2 vehicles (79, accounting for 50.3%) and females with 2 vehicles (49, making up 61.7%).
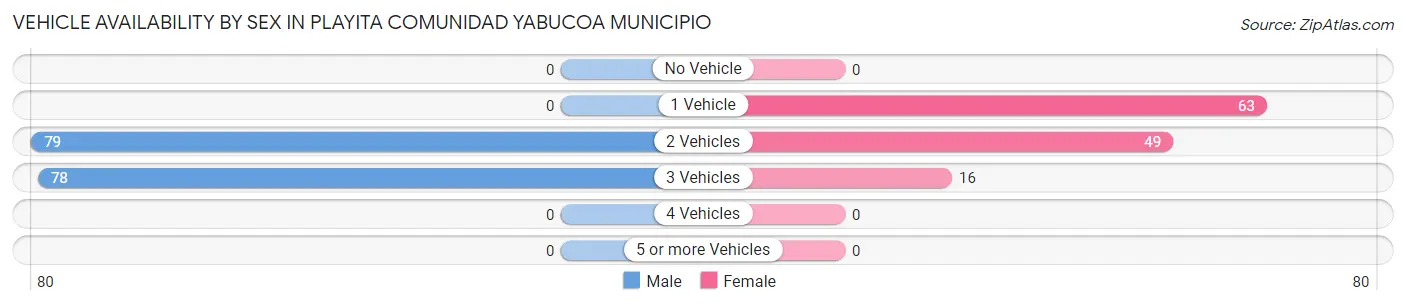
| Vehicles Available | Male | Female |
| No Vehicle | 0 (0.0%) | 0 (0.0%) |
| 1 Vehicle | 0 (0.0%) | 63 (49.2%) |
| 2 Vehicles | 79 (50.3%) | 49 (38.3%) |
| 3 Vehicles | 78 (49.7%) | 16 (12.5%) |
| 4 Vehicles | 0 (0.0%) | 0 (0.0%) |
| 5 or more Vehicles | 0 (0.0%) | 0 (0.0%) |
| Total | 157 (100.0%) | 128 (100.0%) |
Commute Time in Playita comunidad Yabucoa Municipio
The most frequently occuring commute durations in Playita comunidad Yabucoa Municipio are 30 to 34 minutes (144 commuters, 50.5%), 10 to 14 minutes (58 commuters, 20.3%), and 20 to 24 minutes (25 commuters, 8.8%).
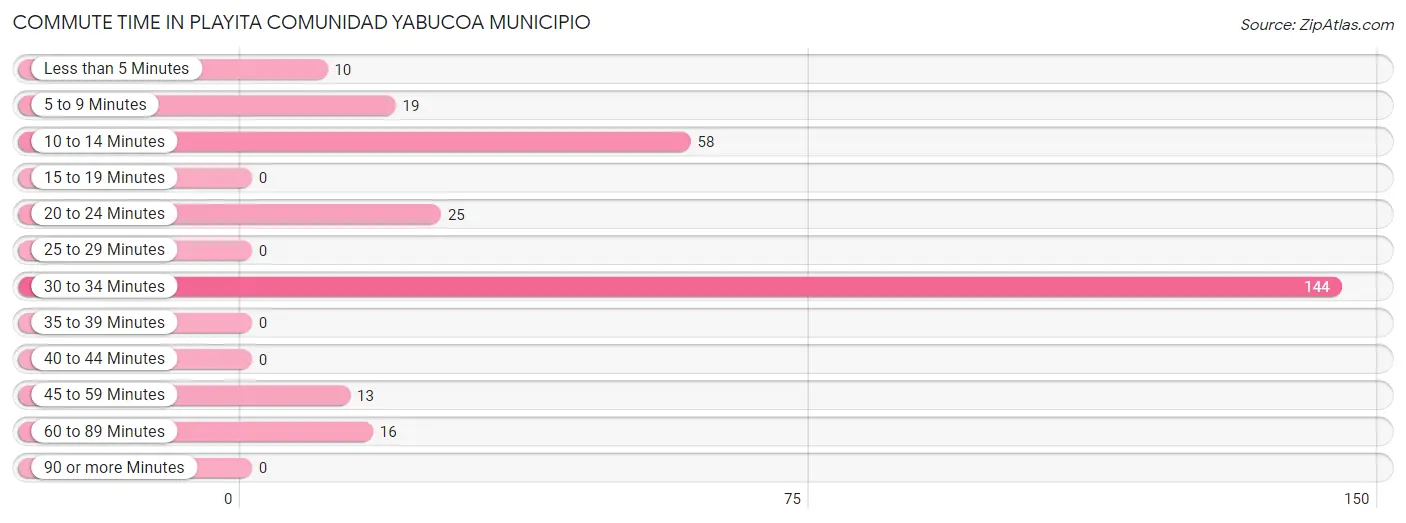
| Commute Time | # Commuters | % Commuters |
| Less than 5 Minutes | 10 | 3.5% |
| 5 to 9 Minutes | 19 | 6.7% |
| 10 to 14 Minutes | 58 | 20.3% |
| 15 to 19 Minutes | 0 | 0.0% |
| 20 to 24 Minutes | 25 | 8.8% |
| 25 to 29 Minutes | 0 | 0.0% |
| 30 to 34 Minutes | 144 | 50.5% |
| 35 to 39 Minutes | 0 | 0.0% |
| 40 to 44 Minutes | 0 | 0.0% |
| 45 to 59 Minutes | 13 | 4.6% |
| 60 to 89 Minutes | 16 | 5.6% |
| 90 or more Minutes | 0 | 0.0% |
Commute Time by Sex in Playita comunidad Yabucoa Municipio
The most common commute times in Playita comunidad Yabucoa Municipio are 30 to 34 minutes (125 commuters, 79.6%) for males and 10 to 14 minutes (58 commuters, 45.3%) for females.
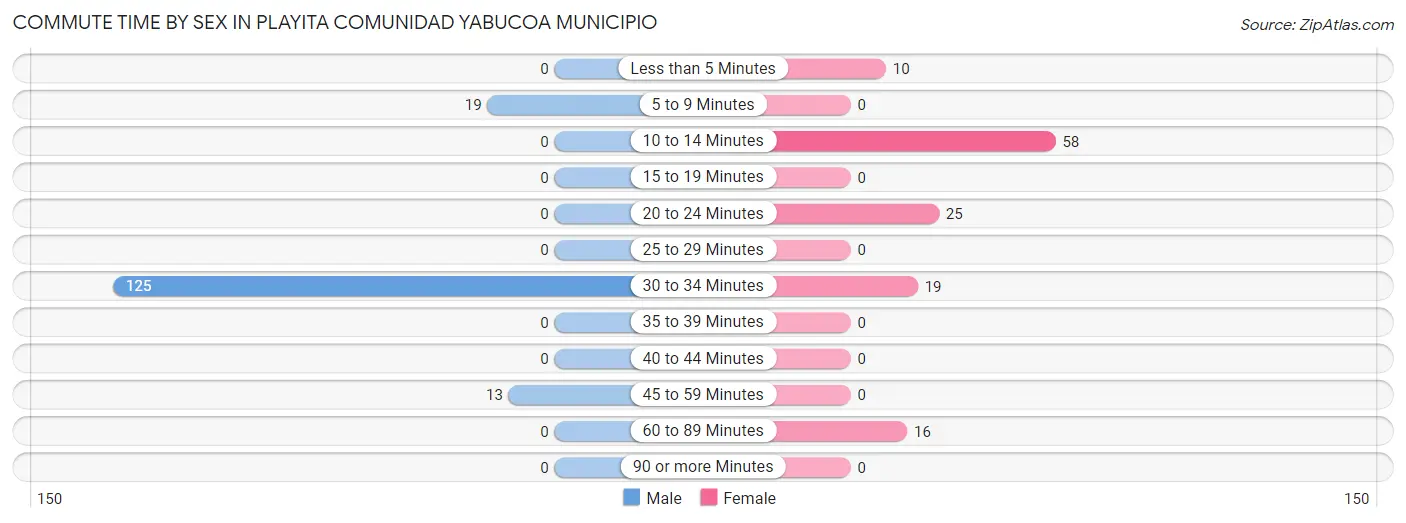
| Commute Time | Male | Female |
| Less than 5 Minutes | 0 (0.0%) | 10 (7.8%) |
| 5 to 9 Minutes | 19 (12.1%) | 0 (0.0%) |
| 10 to 14 Minutes | 0 (0.0%) | 58 (45.3%) |
| 15 to 19 Minutes | 0 (0.0%) | 0 (0.0%) |
| 20 to 24 Minutes | 0 (0.0%) | 25 (19.5%) |
| 25 to 29 Minutes | 0 (0.0%) | 0 (0.0%) |
| 30 to 34 Minutes | 125 (79.6%) | 19 (14.8%) |
| 35 to 39 Minutes | 0 (0.0%) | 0 (0.0%) |
| 40 to 44 Minutes | 0 (0.0%) | 0 (0.0%) |
| 45 to 59 Minutes | 13 (8.3%) | 0 (0.0%) |
| 60 to 89 Minutes | 0 (0.0%) | 16 (12.5%) |
| 90 or more Minutes | 0 (0.0%) | 0 (0.0%) |
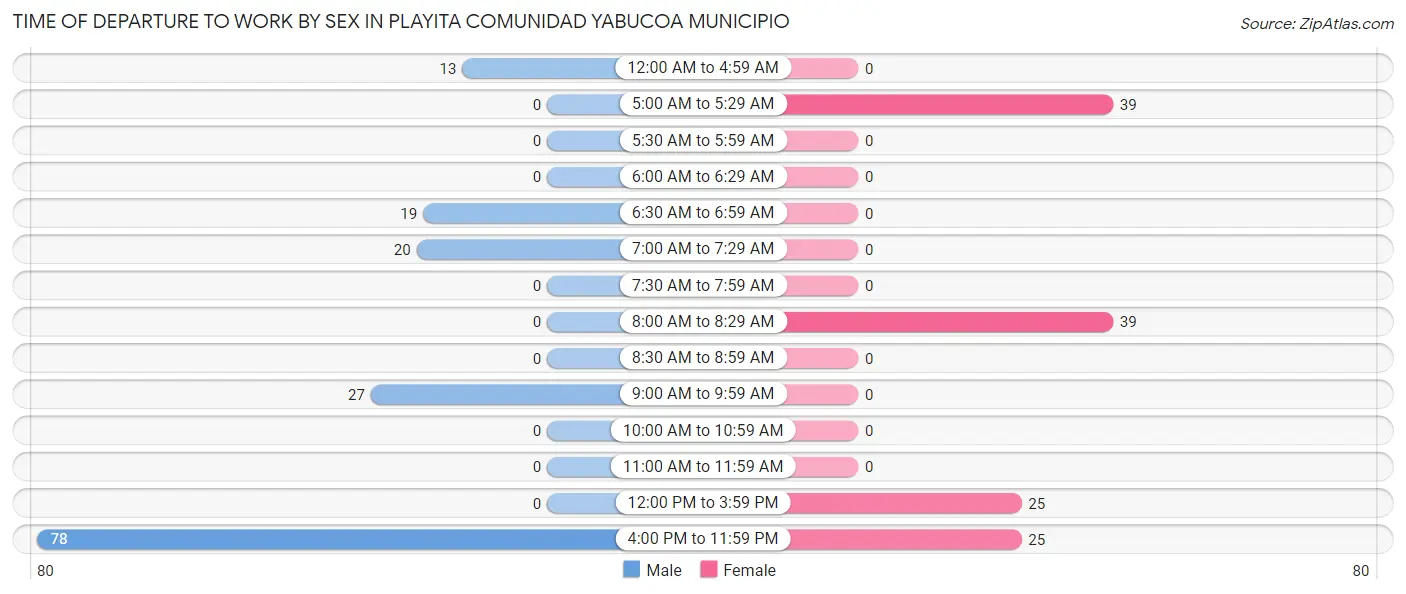
Time of Departure to Work by Sex in Playita comunidad Yabucoa Municipio
The most frequent times of departure to work in Playita comunidad Yabucoa Municipio are 4:00 PM to 11:59 PM (78, 49.7%) for males and 5:00 AM to 5:29 AM (39, 30.5%) for females.
| Time of Departure | Male | Female |
| 12:00 AM to 4:59 AM | 13 (8.3%) | 0 (0.0%) |
| 5:00 AM to 5:29 AM | 0 (0.0%) | 39 (30.5%) |
| 5:30 AM to 5:59 AM | 0 (0.0%) | 0 (0.0%) |
| 6:00 AM to 6:29 AM | 0 (0.0%) | 0 (0.0%) |
| 6:30 AM to 6:59 AM | 19 (12.1%) | 0 (0.0%) |
| 7:00 AM to 7:29 AM | 20 (12.7%) | 0 (0.0%) |
| 7:30 AM to 7:59 AM | 0 (0.0%) | 0 (0.0%) |
| 8:00 AM to 8:29 AM | 0 (0.0%) | 39 (30.5%) |
| 8:30 AM to 8:59 AM | 0 (0.0%) | 0 (0.0%) |
| 9:00 AM to 9:59 AM | 27 (17.2%) | 0 (0.0%) |
| 10:00 AM to 10:59 AM | 0 (0.0%) | 0 (0.0%) |
| 11:00 AM to 11:59 AM | 0 (0.0%) | 0 (0.0%) |
| 12:00 PM to 3:59 PM | 0 (0.0%) | 25 (19.5%) |
| 4:00 PM to 11:59 PM | 78 (49.7%) | 25 (19.5%) |
| Total | 157 (100.0%) | 128 (100.0%) |
Housing Occupancy in Playita comunidad Yabucoa Municipio
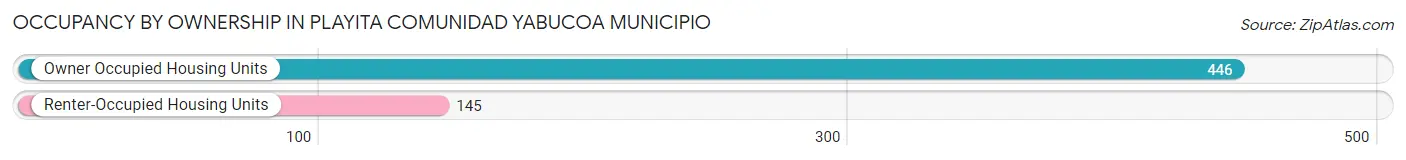
Occupancy by Ownership in Playita comunidad Yabucoa Municipio
Of the total 591 dwellings in Playita comunidad Yabucoa Municipio, owner-occupied units account for 446 (75.5%), while renter-occupied units make up 145 (24.5%).
| Occupancy | # Housing Units | % Housing Units |
| Owner Occupied Housing Units | 446 | 75.5% |
| Renter-Occupied Housing Units | 145 | 24.5% |
| Total Occupied Housing Units | 591 | 100.0% |
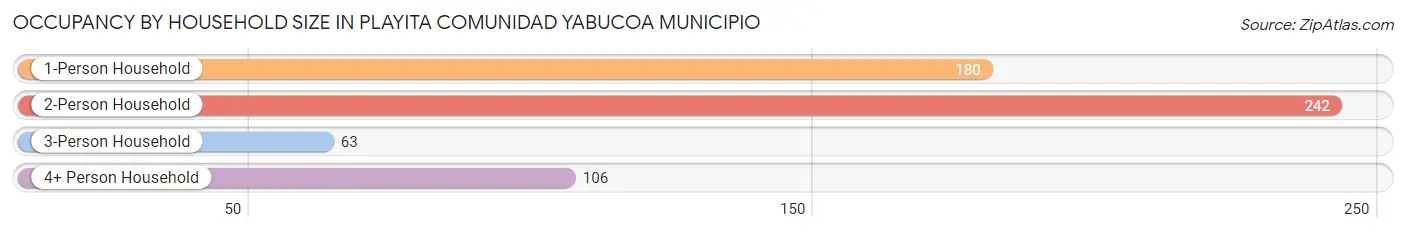
Occupancy by Household Size in Playita comunidad Yabucoa Municipio
| Household Size | # Housing Units | % Housing Units |
| 1-Person Household | 180 | 30.5% |
| 2-Person Household | 242 | 40.9% |
| 3-Person Household | 63 | 10.7% |
| 4+ Person Household | 106 | 17.9% |
| Total Housing Units | 591 | 100.0% |
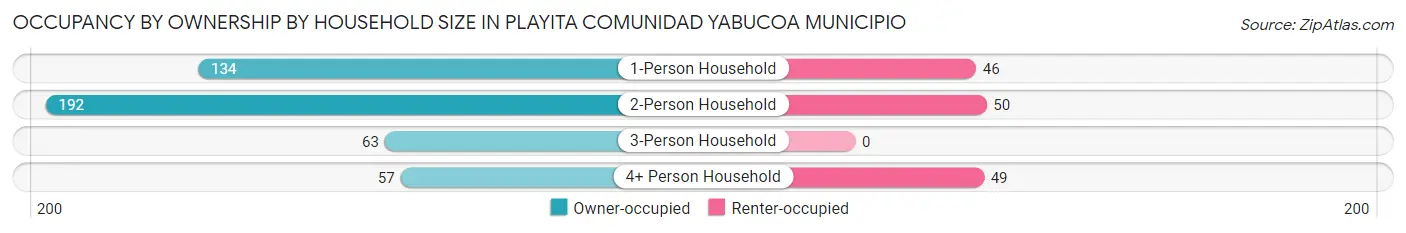
Occupancy by Ownership by Household Size in Playita comunidad Yabucoa Municipio
| Household Size | Owner-occupied | Renter-occupied |
| 1-Person Household | 134 (74.4%) | 46 (25.6%) |
| 2-Person Household | 192 (79.3%) | 50 (20.7%) |
| 3-Person Household | 63 (100.0%) | 0 (0.0%) |
| 4+ Person Household | 57 (53.8%) | 49 (46.2%) |
| Total Housing Units | 446 (75.5%) | 145 (24.5%) |
Occupancy by Educational Attainment in Playita comunidad Yabucoa Municipio
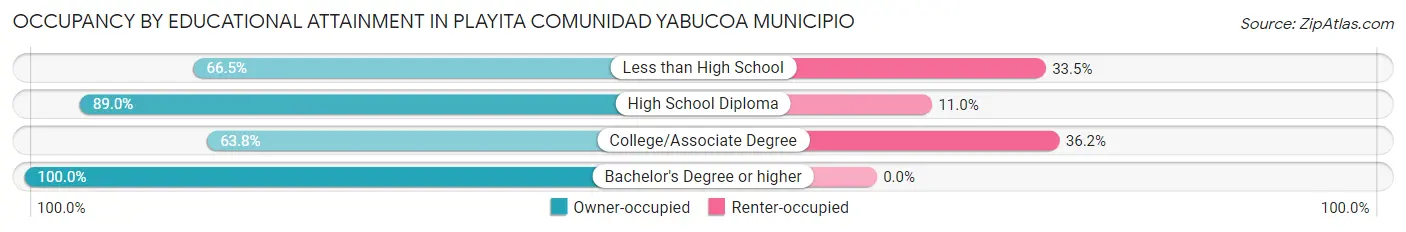
| Household Size | Owner-occupied | Renter-occupied |
| Less than High School | 121 (66.5%) | 61 (33.5%) |
| High School Diploma | 138 (89.0%) | 17 (11.0%) |
| College/Associate Degree | 118 (63.8%) | 67 (36.2%) |
| Bachelor's Degree or higher | 69 (100.0%) | 0 (0.0%) |
Occupancy by Age of Householder in Playita comunidad Yabucoa Municipio
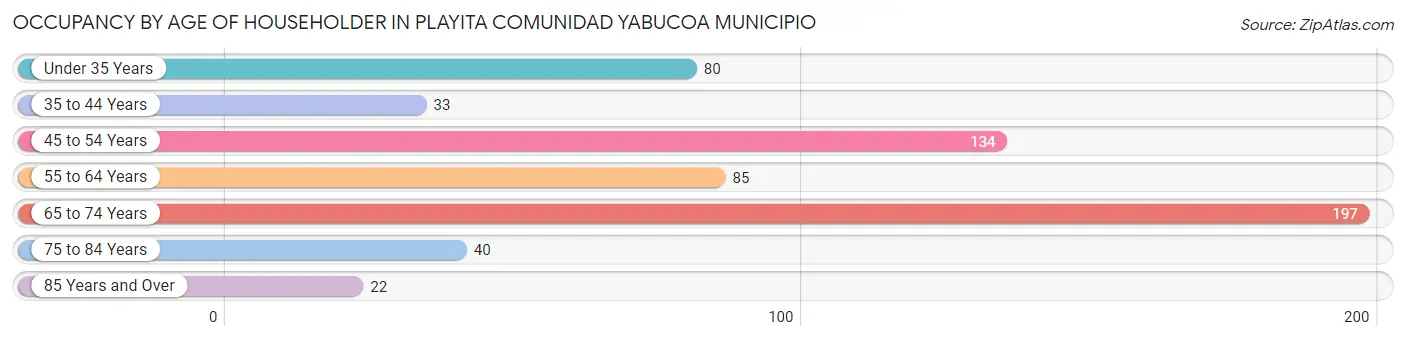
| Age Bracket | # Households | % Households |
| Under 35 Years | 80 | 13.5% |
| 35 to 44 Years | 33 | 5.6% |
| 45 to 54 Years | 134 | 22.7% |
| 55 to 64 Years | 85 | 14.4% |
| 65 to 74 Years | 197 | 33.3% |
| 75 to 84 Years | 40 | 6.8% |
| 85 Years and Over | 22 | 3.7% |
| Total | 591 | 100.0% |
Housing Finances in Playita comunidad Yabucoa Municipio
Median Income by Occupancy in Playita comunidad Yabucoa Municipio
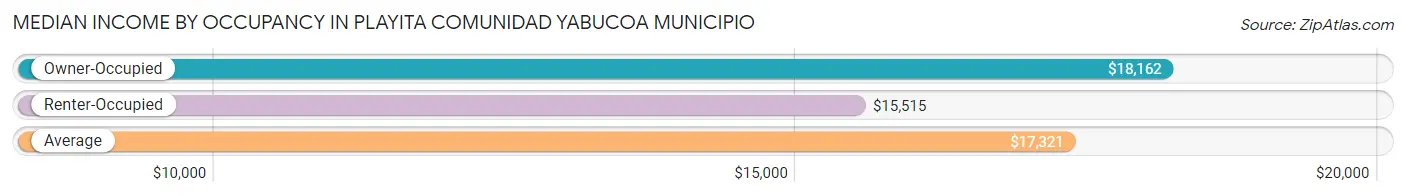
| Occupancy Type | # Households | Median Income |
| Owner-Occupied | 446 (75.5%) | $18,162 |
| Renter-Occupied | 145 (24.5%) | $15,515 |
| Average | 591 (100.0%) | $17,321 |
Occupancy by Householder Income Bracket in Playita comunidad Yabucoa Municipio
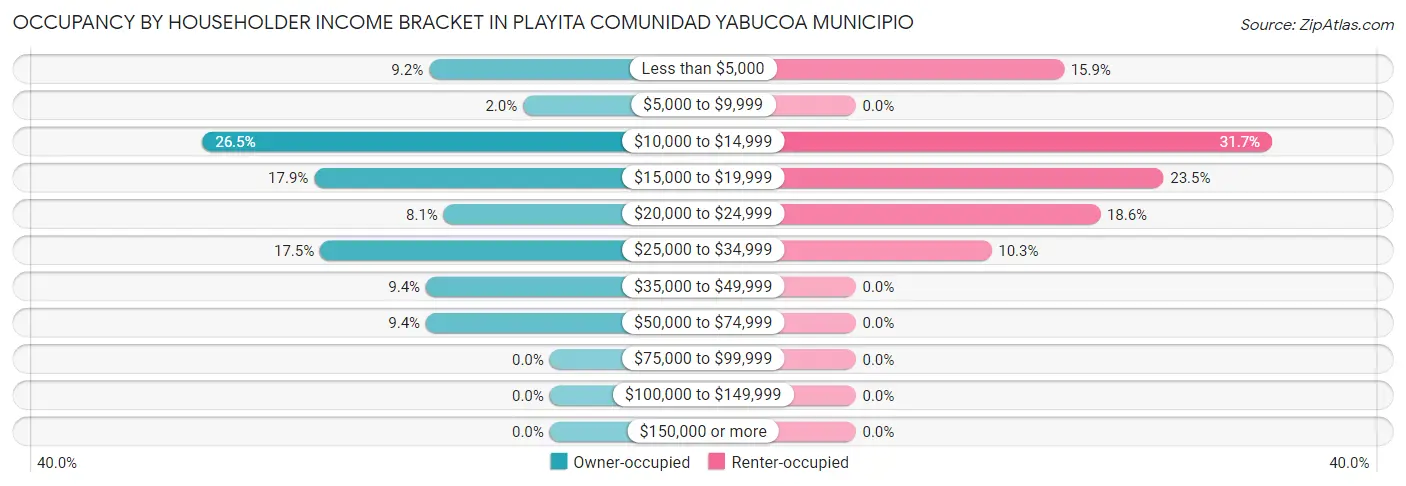
| Income Bracket | Owner-occupied | Renter-occupied |
| Less than $5,000 | 41 (9.2%) | 23 (15.9%) |
| $5,000 to $9,999 | 9 (2.0%) | 0 (0.0%) |
| $10,000 to $14,999 | 118 (26.5%) | 46 (31.7%) |
| $15,000 to $19,999 | 80 (17.9%) | 34 (23.4%) |
| $20,000 to $24,999 | 36 (8.1%) | 27 (18.6%) |
| $25,000 to $34,999 | 78 (17.5%) | 15 (10.3%) |
| $35,000 to $49,999 | 42 (9.4%) | 0 (0.0%) |
| $50,000 to $74,999 | 42 (9.4%) | 0 (0.0%) |
| $75,000 to $99,999 | 0 (0.0%) | 0 (0.0%) |
| $100,000 to $149,999 | 0 (0.0%) | 0 (0.0%) |
| $150,000 or more | 0 (0.0%) | 0 (0.0%) |
| Total | 446 (100.0%) | 145 (100.0%) |
Monthly Housing Cost Tiers in Playita comunidad Yabucoa Municipio
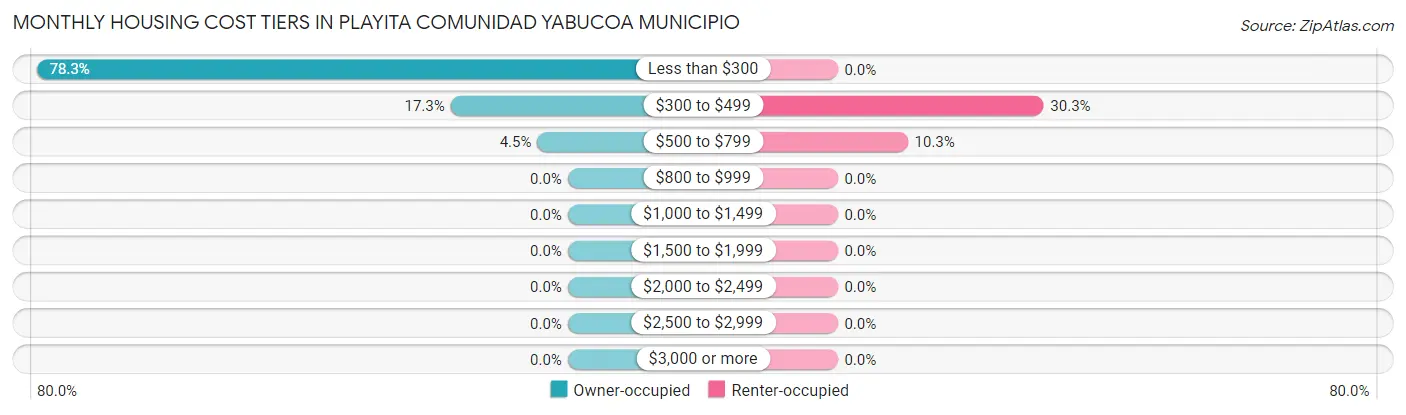
| Monthly Cost | Owner-occupied | Renter-occupied |
| Less than $300 | 349 (78.2%) | 0 (0.0%) |
| $300 to $499 | 77 (17.3%) | 44 (30.3%) |
| $500 to $799 | 20 (4.5%) | 15 (10.3%) |
| $800 to $999 | 0 (0.0%) | 0 (0.0%) |
| $1,000 to $1,499 | 0 (0.0%) | 0 (0.0%) |
| $1,500 to $1,999 | 0 (0.0%) | 0 (0.0%) |
| $2,000 to $2,499 | 0 (0.0%) | 0 (0.0%) |
| $2,500 to $2,999 | 0 (0.0%) | 0 (0.0%) |
| $3,000 or more | 0 (0.0%) | 0 (0.0%) |
| Total | 446 (100.0%) | 145 (100.0%) |
Physical Housing Characteristics in Playita comunidad Yabucoa Municipio
Housing Structures in Playita comunidad Yabucoa Municipio
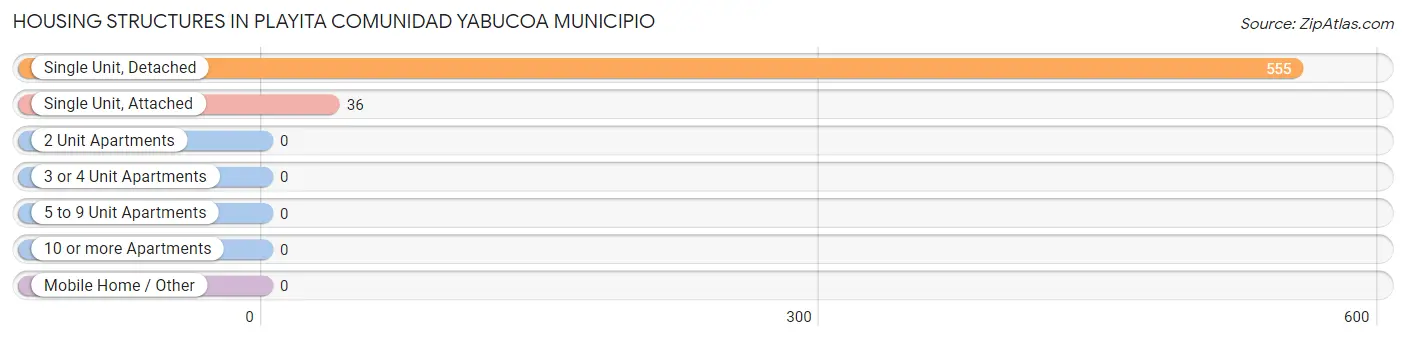
| Structure Type | # Housing Units | % Housing Units |
| Single Unit, Detached | 555 | 93.9% |
| Single Unit, Attached | 36 | 6.1% |
| 2 Unit Apartments | 0 | 0.0% |
| 3 or 4 Unit Apartments | 0 | 0.0% |
| 5 to 9 Unit Apartments | 0 | 0.0% |
| 10 or more Apartments | 0 | 0.0% |
| Mobile Home / Other | 0 | 0.0% |
| Total | 591 | 100.0% |
Housing Structures by Occupancy in Playita comunidad Yabucoa Municipio
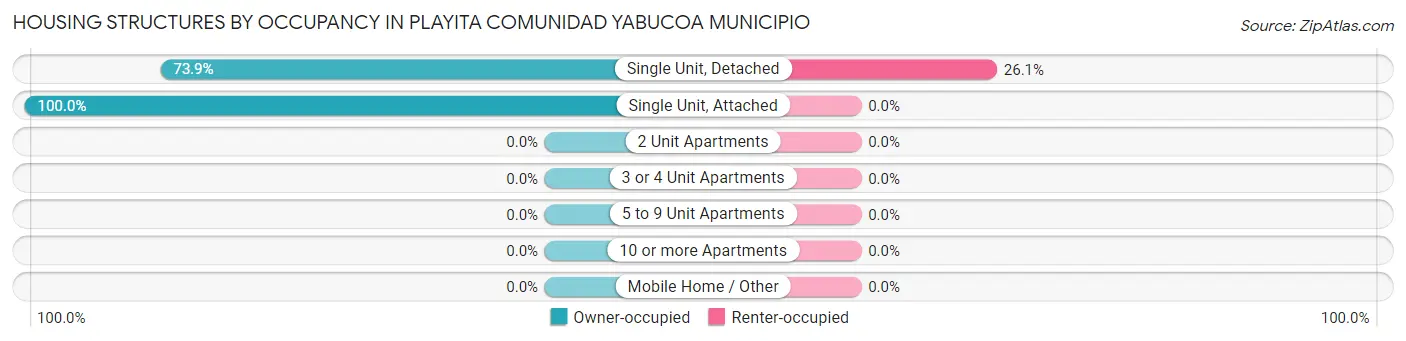
| Structure Type | Owner-occupied | Renter-occupied |
| Single Unit, Detached | 410 (73.9%) | 145 (26.1%) |
| Single Unit, Attached | 36 (100.0%) | 0 (0.0%) |
| 2 Unit Apartments | 0 (0.0%) | 0 (0.0%) |
| 3 or 4 Unit Apartments | 0 (0.0%) | 0 (0.0%) |
| 5 to 9 Unit Apartments | 0 (0.0%) | 0 (0.0%) |
| 10 or more Apartments | 0 (0.0%) | 0 (0.0%) |
| Mobile Home / Other | 0 (0.0%) | 0 (0.0%) |
| Total | 446 (75.5%) | 145 (24.5%) |
Housing Structures by Number of Rooms in Playita comunidad Yabucoa Municipio
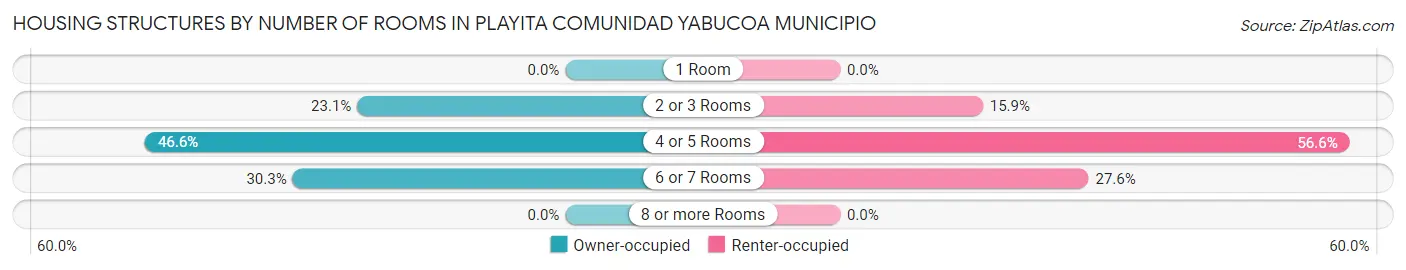
| Number of Rooms | Owner-occupied | Renter-occupied |
| 1 Room | 0 (0.0%) | 0 (0.0%) |
| 2 or 3 Rooms | 103 (23.1%) | 23 (15.9%) |
| 4 or 5 Rooms | 208 (46.6%) | 82 (56.6%) |
| 6 or 7 Rooms | 135 (30.3%) | 40 (27.6%) |
| 8 or more Rooms | 0 (0.0%) | 0 (0.0%) |
| Total | 446 (100.0%) | 145 (100.0%) |
Housing Structure by Heating Type in Playita comunidad Yabucoa Municipio
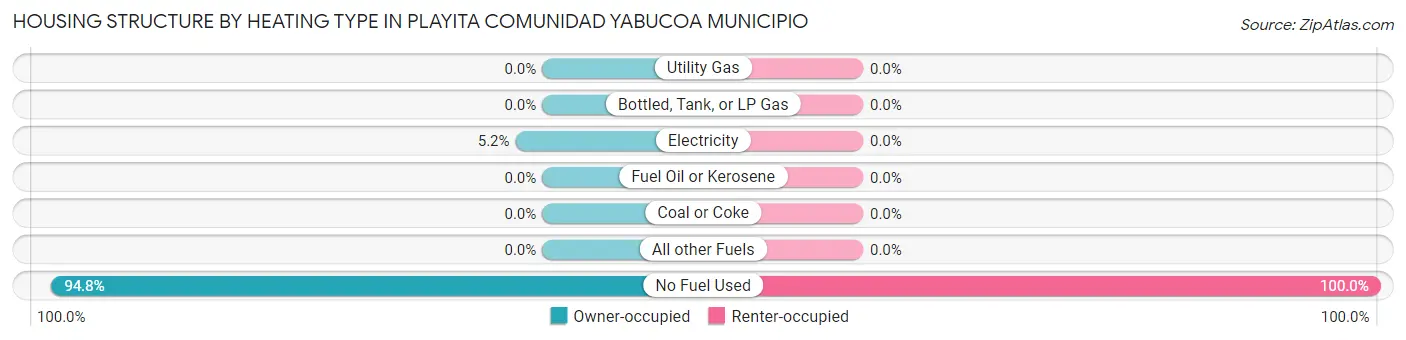
| Heating Type | Owner-occupied | Renter-occupied |
| Utility Gas | 0 (0.0%) | 0 (0.0%) |
| Bottled, Tank, or LP Gas | 0 (0.0%) | 0 (0.0%) |
| Electricity | 23 (5.2%) | 0 (0.0%) |
| Fuel Oil or Kerosene | 0 (0.0%) | 0 (0.0%) |
| Coal or Coke | 0 (0.0%) | 0 (0.0%) |
| All other Fuels | 0 (0.0%) | 0 (0.0%) |
| No Fuel Used | 423 (94.8%) | 145 (100.0%) |
| Total | 446 (100.0%) | 145 (100.0%) |
Household Vehicle Usage in Playita comunidad Yabucoa Municipio
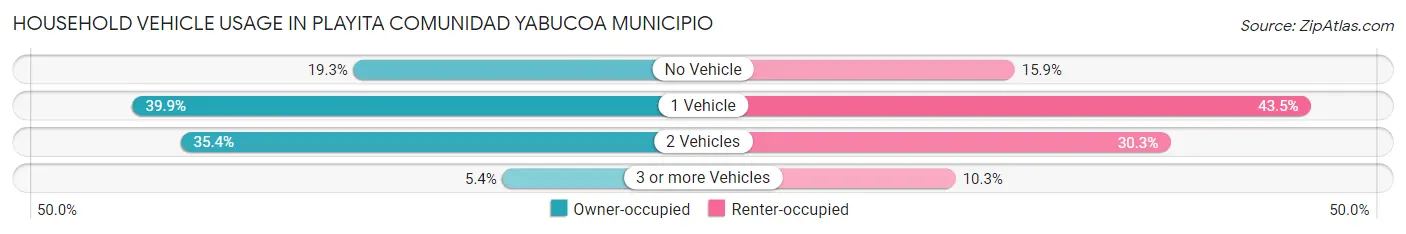
| Vehicles per Household | Owner-occupied | Renter-occupied |
| No Vehicle | 86 (19.3%) | 23 (15.9%) |
| 1 Vehicle | 178 (39.9%) | 63 (43.4%) |
| 2 Vehicles | 158 (35.4%) | 44 (30.3%) |
| 3 or more Vehicles | 24 (5.4%) | 15 (10.3%) |
| Total | 446 (100.0%) | 145 (100.0%) |
Real Estate & Mortgages in Playita comunidad Yabucoa Municipio
Real Estate and Mortgage Overview in Playita comunidad Yabucoa Municipio
| Characteristic | Without Mortgage | With Mortgage |
| Housing Units | 406 | 40 |
| Median Property Value | $79,100 | $0 |
| Median Household Income | $18,162 | $0 |
| Monthly Housing Costs | $124 | $0 |
| Real Estate Taxes | - | - |
Property Value by Mortgage Status in Playita comunidad Yabucoa Municipio
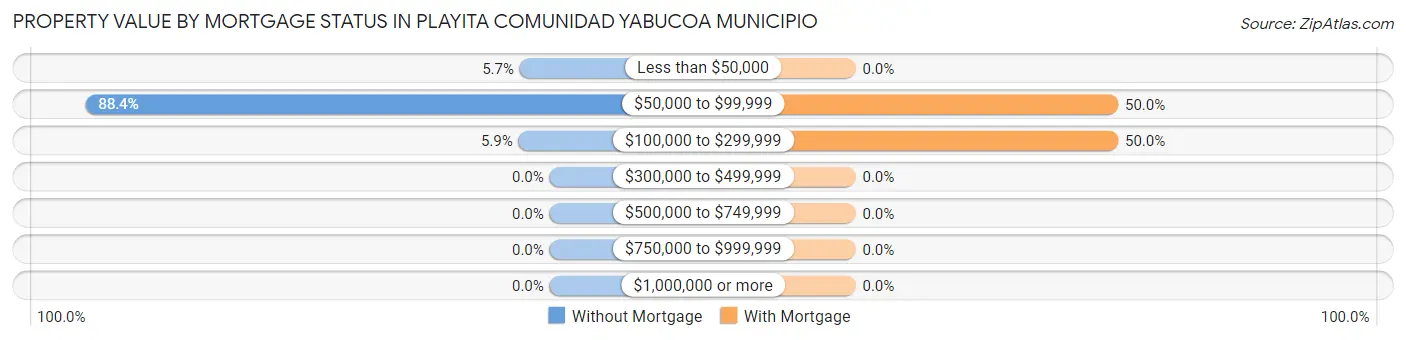
| Property Value | Without Mortgage | With Mortgage |
| Less than $50,000 | 23 (5.7%) | 0 (0.0%) |
| $50,000 to $99,999 | 359 (88.4%) | 20 (50.0%) |
| $100,000 to $299,999 | 24 (5.9%) | 20 (50.0%) |
| $300,000 to $499,999 | 0 (0.0%) | 0 (0.0%) |
| $500,000 to $749,999 | 0 (0.0%) | 0 (0.0%) |
| $750,000 to $999,999 | 0 (0.0%) | 0 (0.0%) |
| $1,000,000 or more | 0 (0.0%) | 0 (0.0%) |
| Total | 406 (100.0%) | 40 (100.0%) |
Household Income by Mortgage Status in Playita comunidad Yabucoa Municipio
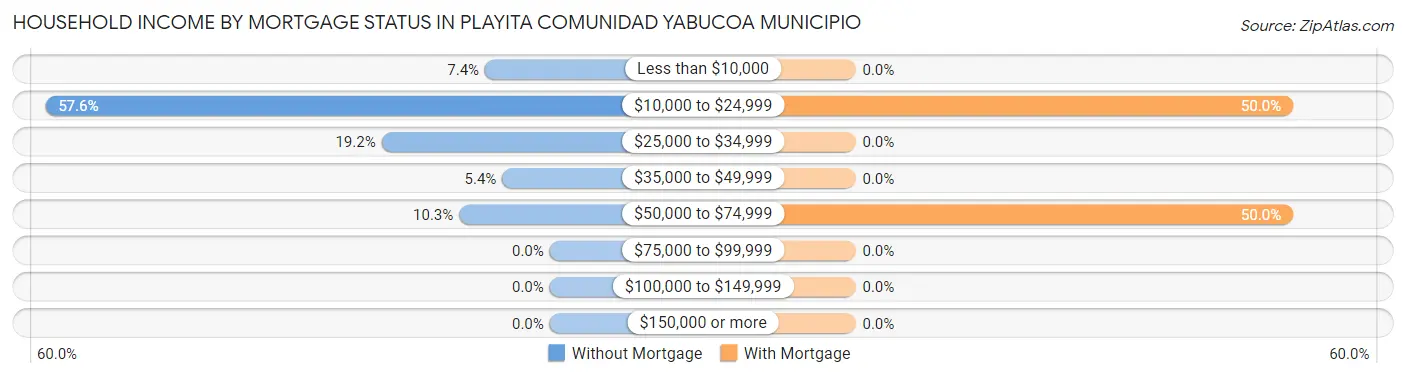
| Household Income | Without Mortgage | With Mortgage |
| Less than $10,000 | 30 (7.4%) | 0 (0.0%) |
| $10,000 to $24,999 | 234 (57.6%) | 20 (50.0%) |
| $25,000 to $34,999 | 78 (19.2%) | 0 (0.0%) |
| $35,000 to $49,999 | 22 (5.4%) | 0 (0.0%) |
| $50,000 to $74,999 | 42 (10.3%) | 20 (50.0%) |
| $75,000 to $99,999 | 0 (0.0%) | 0 (0.0%) |
| $100,000 to $149,999 | 0 (0.0%) | 0 (0.0%) |
| $150,000 or more | 0 (0.0%) | 0 (0.0%) |
| Total | 406 (100.0%) | 40 (100.0%) |
Property Value to Household Income Ratio in Playita comunidad Yabucoa Municipio
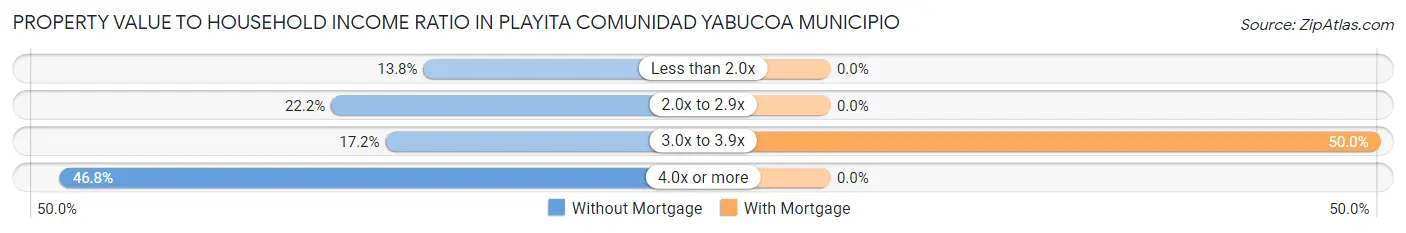
| Value-to-Income Ratio | Without Mortgage | With Mortgage |
| Less than 2.0x | 56 (13.8%) | 0 (0.0%) |
| 2.0x to 2.9x | 90 (22.2%) | 0 (0.0%) |
| 3.0x to 3.9x | 70 (17.2%) | 20 (50.0%) |
| 4.0x or more | 190 (46.8%) | 0 (0.0%) |
| Total | 406 (100.0%) | 40 (100.0%) |
Real Estate Taxes by Mortgage Status in Playita comunidad Yabucoa Municipio
| Property Taxes | Without Mortgage | With Mortgage |
| Less than $800 | 0 (0.0%) | 0 (0.0%) |
| $800 to $1,499 | 0 (0.0%) | 0 (0.0%) |
| $800 to $1,499 | 0 (0.0%) | 0 (0.0%) |
| Total | 406 (100.0%) | 40 (100.0%) |
Health & Disability in Playita comunidad Yabucoa Municipio
Health Insurance Coverage by Age in Playita comunidad Yabucoa Municipio
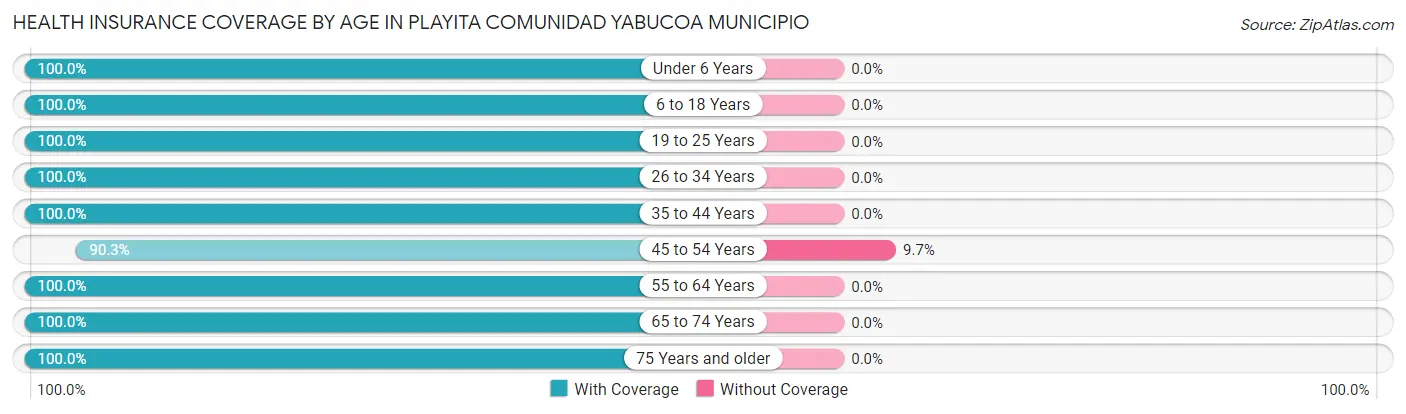
| Age Bracket | With Coverage | Without Coverage |
| Under 6 Years | 75 (100.0%) | 0 (0.0%) |
| 6 to 18 Years | 191 (100.0%) | 0 (0.0%) |
| 19 to 25 Years | 99 (100.0%) | 0 (0.0%) |
| 26 to 34 Years | 241 (100.0%) | 0 (0.0%) |
| 35 to 44 Years | 79 (100.0%) | 0 (0.0%) |
| 45 to 54 Years | 187 (90.3%) | 20 (9.7%) |
| 55 to 64 Years | 207 (100.0%) | 0 (0.0%) |
| 65 to 74 Years | 294 (100.0%) | 0 (0.0%) |
| 75 Years and older | 100 (100.0%) | 0 (0.0%) |
| Total | 1,473 (98.7%) | 20 (1.3%) |
Health Insurance Coverage by Citizenship Status in Playita comunidad Yabucoa Municipio
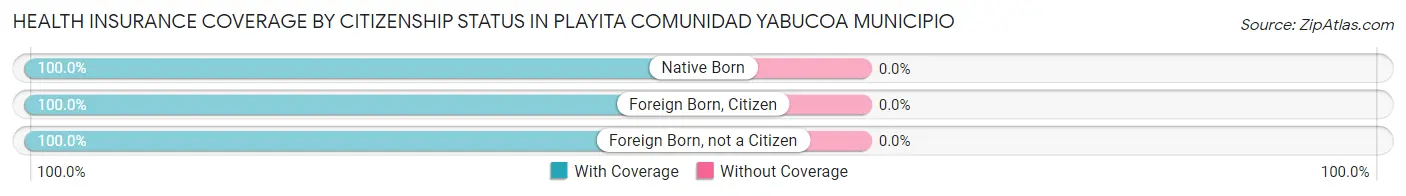
| Citizenship Status | With Coverage | Without Coverage |
| Native Born | 75 (100.0%) | 0 (0.0%) |
| Foreign Born, Citizen | 191 (100.0%) | 0 (0.0%) |
| Foreign Born, not a Citizen | 99 (100.0%) | 0 (0.0%) |
Health Insurance Coverage by Household Income in Playita comunidad Yabucoa Municipio
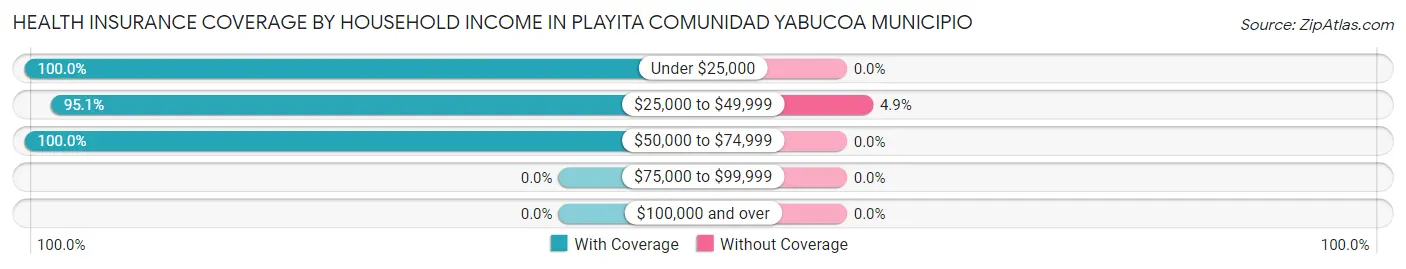
| Household Income | With Coverage | Without Coverage |
| Under $25,000 | 863 (100.0%) | 0 (0.0%) |
| $25,000 to $49,999 | 387 (95.1%) | 20 (4.9%) |
| $50,000 to $74,999 | 222 (100.0%) | 0 (0.0%) |
| $75,000 to $99,999 | 0 (0.0%) | 0 (0.0%) |
| $100,000 and over | 0 (0.0%) | 0 (0.0%) |
Public vs Private Health Insurance Coverage by Age in Playita comunidad Yabucoa Municipio
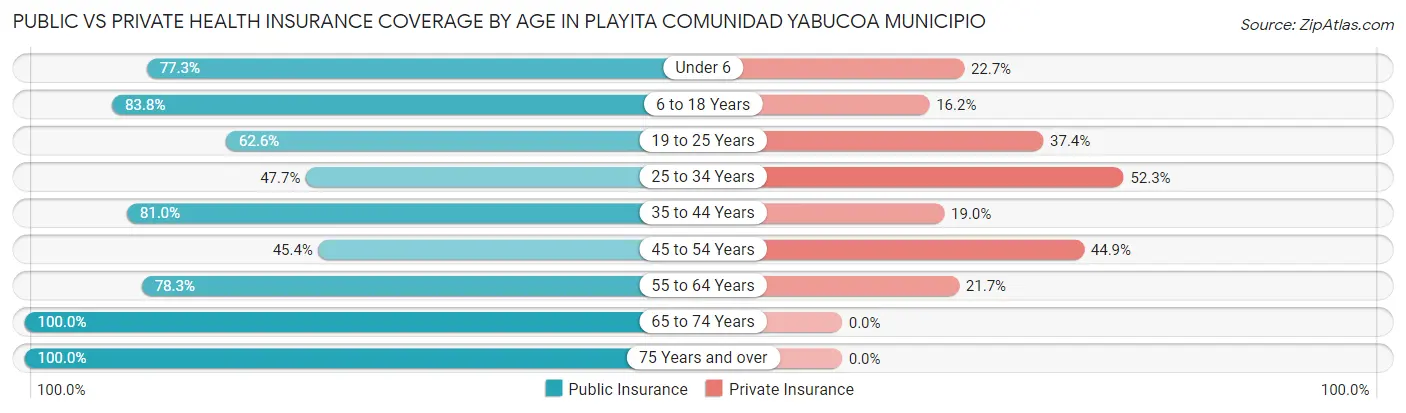
| Age Bracket | Public Insurance | Private Insurance |
| Under 6 | 58 (77.3%) | 17 (22.7%) |
| 6 to 18 Years | 160 (83.8%) | 31 (16.2%) |
| 19 to 25 Years | 62 (62.6%) | 37 (37.4%) |
| 25 to 34 Years | 115 (47.7%) | 126 (52.3%) |
| 35 to 44 Years | 64 (81.0%) | 15 (19.0%) |
| 45 to 54 Years | 94 (45.4%) | 93 (44.9%) |
| 55 to 64 Years | 162 (78.3%) | 45 (21.7%) |
| 65 to 74 Years | 294 (100.0%) | 0 (0.0%) |
| 75 Years and over | 100 (100.0%) | 0 (0.0%) |
| Total | 1,109 (74.3%) | 364 (24.4%) |
Disability Status by Sex by Age in Playita comunidad Yabucoa Municipio
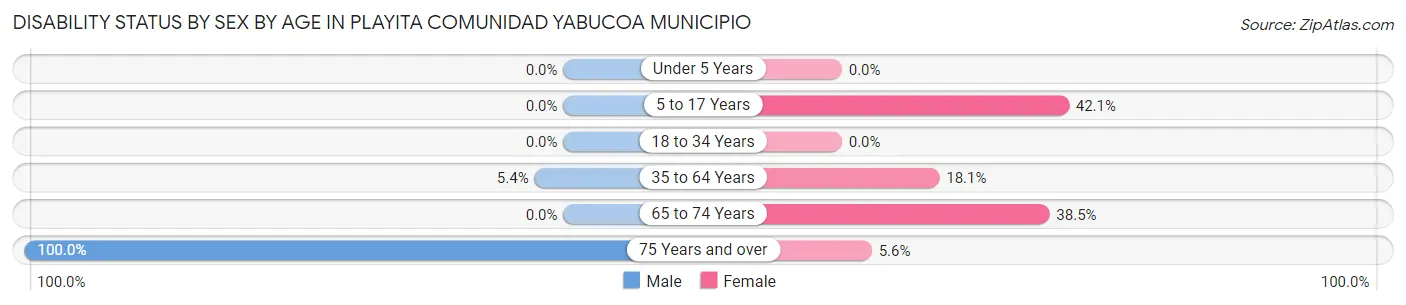
| Age Bracket | Male | Female |
| Under 5 Years | 0 (0.0%) | 0 (0.0%) |
| 5 to 17 Years | 0 (0.0%) | 59 (42.1%) |
| 18 to 34 Years | 0 (0.0%) | 0 (0.0%) |
| 35 to 64 Years | 14 (5.4%) | 42 (18.1%) |
| 65 to 74 Years | 0 (0.0%) | 74 (38.5%) |
| 75 Years and over | 82 (100.0%) | 1 (5.6%) |
Disability Class by Sex by Age in Playita comunidad Yabucoa Municipio
Disability Class: Hearing Difficulty
| Age Bracket | Male | Female |
| Under 5 Years | 0 (0.0%) | 0 (0.0%) |
| 5 to 17 Years | 0 (0.0%) | 0 (0.0%) |
| 18 to 34 Years | 0 (0.0%) | 0 (0.0%) |
| 35 to 64 Years | 0 (0.0%) | 0 (0.0%) |
| 65 to 74 Years | 0 (0.0%) | 0 (0.0%) |
| 75 Years and over | 0 (0.0%) | 0 (0.0%) |
Disability Class: Vision Difficulty
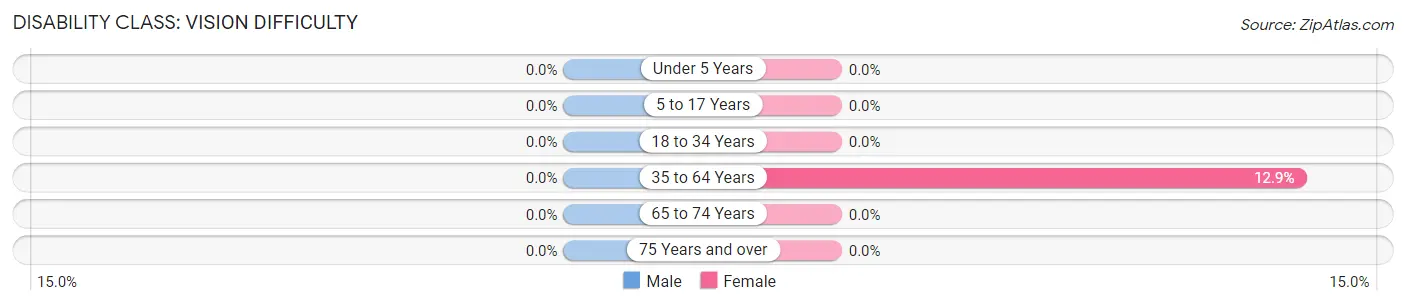
| Age Bracket | Male | Female |
| Under 5 Years | 0 (0.0%) | 0 (0.0%) |
| 5 to 17 Years | 0 (0.0%) | 0 (0.0%) |
| 18 to 34 Years | 0 (0.0%) | 0 (0.0%) |
| 35 to 64 Years | 0 (0.0%) | 30 (12.9%) |
| 65 to 74 Years | 0 (0.0%) | 0 (0.0%) |
| 75 Years and over | 0 (0.0%) | 0 (0.0%) |
Disability Class: Cognitive Difficulty
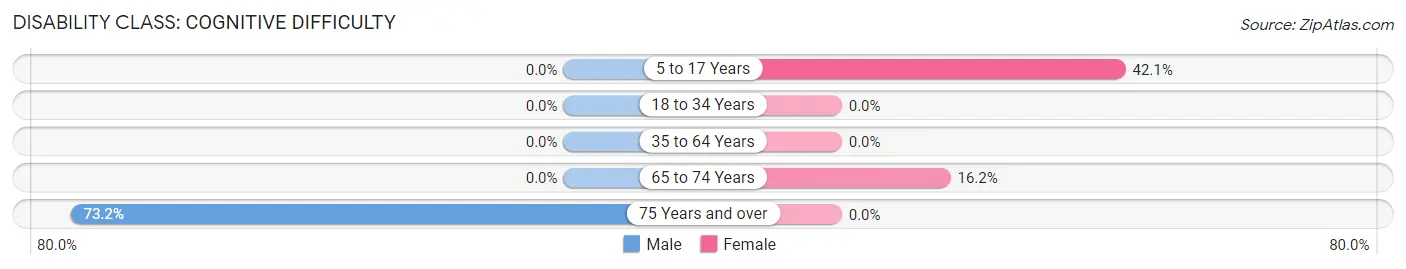
| Age Bracket | Male | Female |
| 5 to 17 Years | 0 (0.0%) | 59 (42.1%) |
| 18 to 34 Years | 0 (0.0%) | 0 (0.0%) |
| 35 to 64 Years | 0 (0.0%) | 0 (0.0%) |
| 65 to 74 Years | 0 (0.0%) | 31 (16.2%) |
| 75 Years and over | 60 (73.2%) | 0 (0.0%) |
Disability Class: Ambulatory Difficulty
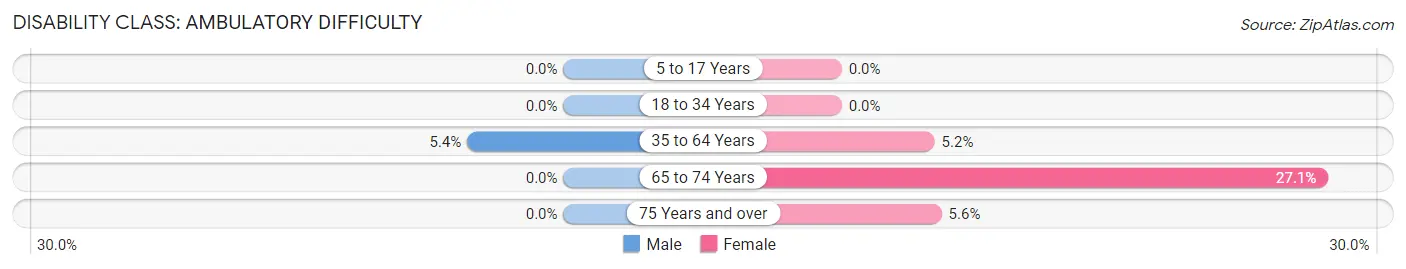
| Age Bracket | Male | Female |
| 5 to 17 Years | 0 (0.0%) | 0 (0.0%) |
| 18 to 34 Years | 0 (0.0%) | 0 (0.0%) |
| 35 to 64 Years | 14 (5.4%) | 12 (5.2%) |
| 65 to 74 Years | 0 (0.0%) | 52 (27.1%) |
| 75 Years and over | 0 (0.0%) | 1 (5.6%) |
Disability Class: Self-Care Difficulty
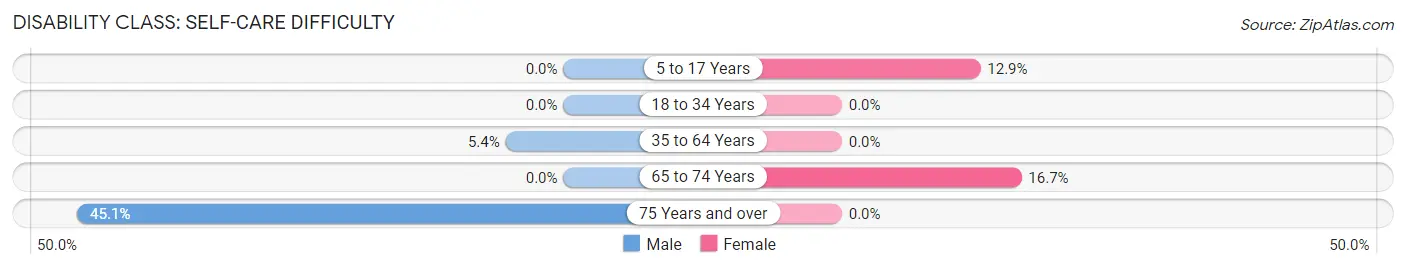
| Age Bracket | Male | Female |
| 5 to 17 Years | 0 (0.0%) | 18 (12.9%) |
| 18 to 34 Years | 0 (0.0%) | 0 (0.0%) |
| 35 to 64 Years | 14 (5.4%) | 0 (0.0%) |
| 65 to 74 Years | 0 (0.0%) | 32 (16.7%) |
| 75 Years and over | 37 (45.1%) | 0 (0.0%) |
Technology Access in Playita comunidad Yabucoa Municipio
Computing Device Access in Playita comunidad Yabucoa Municipio
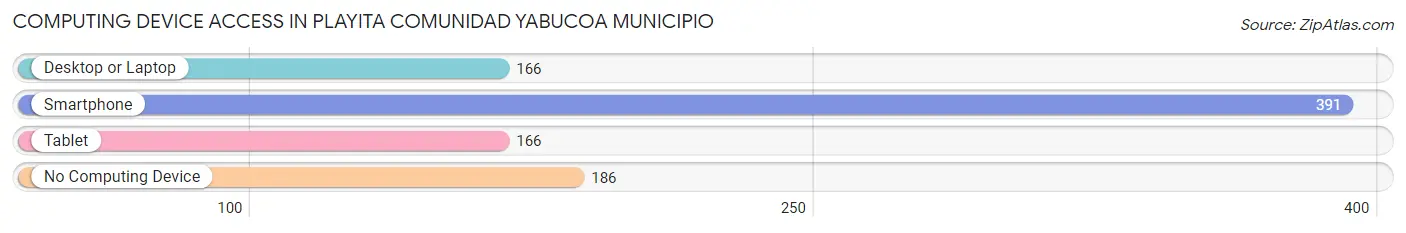
| Device Type | # Households | % Households |
| Desktop or Laptop | 166 | 28.1% |
| Smartphone | 391 | 66.2% |
| Tablet | 166 | 28.1% |
| No Computing Device | 186 | 31.5% |
| Total | 591 | 100.0% |
Internet Access in Playita comunidad Yabucoa Municipio
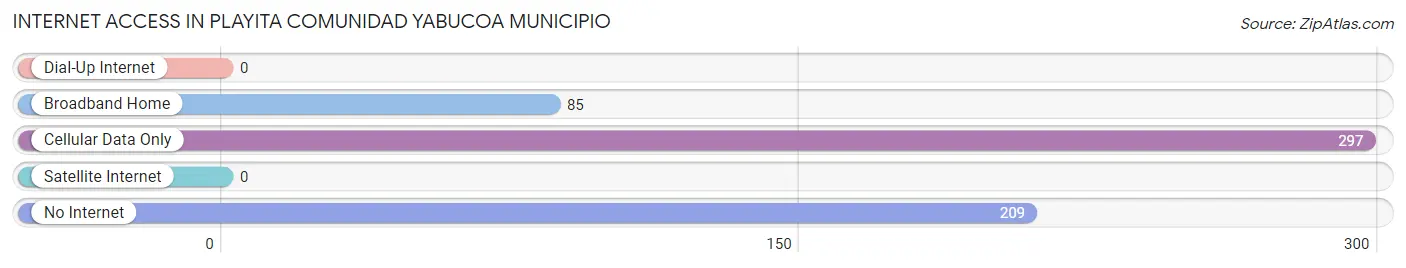
| Internet Type | # Households | % Households |
| Dial-Up Internet | 0 | 0.0% |
| Broadband Home | 85 | 14.4% |
| Cellular Data Only | 297 | 50.2% |
| Satellite Internet | 0 | 0.0% |
| No Internet | 209 | 35.4% |
| Total | 591 | 100.0% |
Playita comunidad Yabucoa Municipio Summary
Playita Comunidad Yabucoa Municipio is a municipality located in the southeastern region of Puerto Rico. It is part of the Yabucoa-Humacao Metropolitan Statistical Area. The municipality is bordered by the municipalities of Humacao, Naguabo, and Maunabo. As of the 2010 census, the population of Playita Comunidad Yabucoa Municipio was 8,845.
History
The area that is now Playita Comunidad Yabucoa Municipio was originally inhabited by the Taíno people. The Taíno were the indigenous people of the Caribbean and were the first to inhabit the island of Puerto Rico. The Taíno were a peaceful people who lived off the land and were skilled fishermen and farmers.
In 1493, Christopher Columbus arrived in Puerto Rico and claimed the island for Spain. The Spanish began to colonize the island and the Taíno population began to decline due to disease and warfare. By the mid-16th century, the Taíno population had been decimated and the Spanish had established a number of settlements in the area.
In 1776, the area that is now Playita Comunidad Yabucoa Municipio was part of the municipality of Humacao. In 1831, the area was separated from Humacao and became its own municipality. The municipality was named after the nearby Yabucoa River.
Geography
Playita Comunidad Yabucoa Municipio is located in the southeastern region of Puerto Rico. It is bordered by the municipalities of Humacao, Naguabo, and Maunabo. The municipality covers an area of 24.7 square miles and is located at an elevation of 545 feet above sea level.
The municipality is located in a tropical climate and has an average temperature of 79°F. The average annual rainfall is 64 inches.
Economy
The economy of Playita Comunidad Yabucoa Municipio is largely based on agriculture. The main crops grown in the area are sugarcane, bananas, and coffee. The municipality also has a number of small businesses, including restaurants, shops, and hotels.
Demographics
As of the 2010 census, the population of Playita Comunidad Yabucoa Municipio was 8,845. The population is largely of Hispanic descent, with a small percentage of African and Taíno ancestry. The median household income in the municipality is $17,845. The unemployment rate is 11.3%.
The majority of the population is Roman Catholic (90.3%). Other religious affiliations include Protestant (4.2%), Jehovah’s Witnesses (2.2%), and other (3.3%). The literacy rate in the municipality is 87.3%.
Conclusion
Playita Comunidad Yabucoa Municipio is a municipality located in the southeastern region of Puerto Rico. It is part of the Yabucoa-Humacao Metropolitan Statistical Area. The municipality was originally inhabited by the Taíno people and was later colonized by the Spanish. The economy of the municipality is largely based on agriculture and small businesses. As of the 2010 census, the population of Playita Comunidad Yabucoa Municipio was 8,845. The population is largely of Hispanic descent, with a small percentage of African and Taíno ancestry. The majority of the population is Roman Catholic.
Common Questions
What is Per Capita Income in Playita comunidad Yabucoa Municipio?
Per Capita income in Playita comunidad Yabucoa Municipio is $10,346.
What is the Median Family Income in Playita comunidad Yabucoa Municipio?
Median Family Income in Playita comunidad Yabucoa Municipio is $20,139.
What is the Median Household income in Playita comunidad Yabucoa Municipio?
Median Household Income in Playita comunidad Yabucoa Municipio is $17,321.
What is Income or Wage Gap in Playita comunidad Yabucoa Municipio?
Income or Wage Gap in Playita comunidad Yabucoa Municipio is 9.0%.
Women in Playita comunidad Yabucoa Municipio earn 91.0 cents for every dollar earned by a man.
What is Inequality or Gini Index in Playita comunidad Yabucoa Municipio?
Inequality or Gini Index in Playita comunidad Yabucoa Municipio is 0.36.
What is the Total Population of Playita comunidad Yabucoa Municipio?
Total Population of Playita comunidad Yabucoa Municipio is 1,493.
What is the Total Male Population of Playita comunidad Yabucoa Municipio?
Total Male Population of Playita comunidad Yabucoa Municipio is 638.
What is the Total Female Population of Playita comunidad Yabucoa Municipio?
Total Female Population of Playita comunidad Yabucoa Municipio is 855.
What is the Ratio of Males per 100 Females in Playita comunidad Yabucoa Municipio?
There are 74.62 Males per 100 Females in Playita comunidad Yabucoa Municipio.
What is the Ratio of Females per 100 Males in Playita comunidad Yabucoa Municipio?
There are 134.01 Females per 100 Males in Playita comunidad Yabucoa Municipio.
What is the Median Population Age in Playita comunidad Yabucoa Municipio?
Median Population Age in Playita comunidad Yabucoa Municipio is 48.5 Years.
What is the Average Family Size in Playita comunidad Yabucoa Municipio
Average Family Size in Playita comunidad Yabucoa Municipio is 3.2 People.
What is the Average Household Size in Playita comunidad Yabucoa Municipio
Average Household Size in Playita comunidad Yabucoa Municipio is 2.5 People.
How Large is the Labor Force in Playita comunidad Yabucoa Municipio?
There are 374 People in the Labor Forcein in Playita comunidad Yabucoa Municipio.
What is the Percentage of People in the Labor Force in Playita comunidad Yabucoa Municipio?
29.9% of People are in the Labor Force in Playita comunidad Yabucoa Municipio.
What is the Unemployment Rate in Playita comunidad Yabucoa Municipio?
Unemployment Rate in Playita comunidad Yabucoa Municipio is 11.0%.