Santa Isabel, PR Map & Demographics
Santa Isabel Map
Santa Isabel Overview
$10,119
PER CAPITA INCOME
$20,833
AVG FAMILY INCOME
$15,165
AVG HOUSEHOLD INCOME
27.7%
WAGE / INCOME GAP [ % ]
72.3¢/ $1
WAGE / INCOME GAP [ $ ]
0.53
INEQUALITY / GINI INDEX
5,133
TOTAL POPULATION
2,391
MALE POPULATION
2,742
FEMALE POPULATION
87.20
MALES / 100 FEMALES
114.68
FEMALES / 100 MALES
42.5
MEDIAN AGE
3.4
AVG FAMILY SIZE
2.6
AVG HOUSEHOLD SIZE
1,550
LABOR FORCE [ PEOPLE ]
36.7%
PERCENT IN LABOR FORCE
11.2%
UNEMPLOYMENT RATE
Santa Isabel Zip Codes
Santa Isabel Area Codes
Income in Santa Isabel
Income Overview in Santa Isabel
Per Capita Income in Santa Isabel is $10,119, while median incomes of families and households are $20,833 and $15,165 respectively.
| Characteristic | Number | Measure |
| Per Capita Income | 5,133 | $10,119 |
| Median Family Income | 1,170 | $20,833 |
| Mean Family Income | 1,170 | $26,978 |
| Median Household Income | 2,009 | $15,165 |
| Mean Household Income | 2,009 | $23,059 |
| Income Deficit | 1,170 | $0 |
| Wage / Income Gap (%) | 5,133 | 27.66% |
| Wage / Income Gap ($) | 5,133 | 72.34¢ per $1 |
| Gini / Inequality Index | 5,133 | 0.53 |
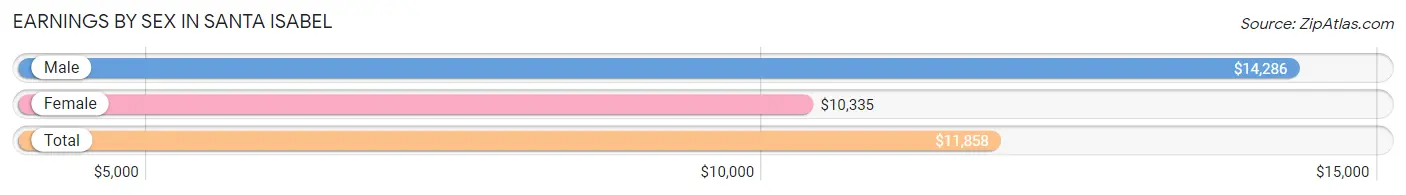
Earnings by Sex in Santa Isabel
Average Earnings in Santa Isabel are $11,858, $14,286 for men and $10,335 for women, a difference of 27.7%.
| Sex | Number | Average Earnings |
| Male | 830 (52.3%) | $14,286 |
| Female | 757 (47.7%) | $10,335 |
| Total | 1,587 (100.0%) | $11,858 |
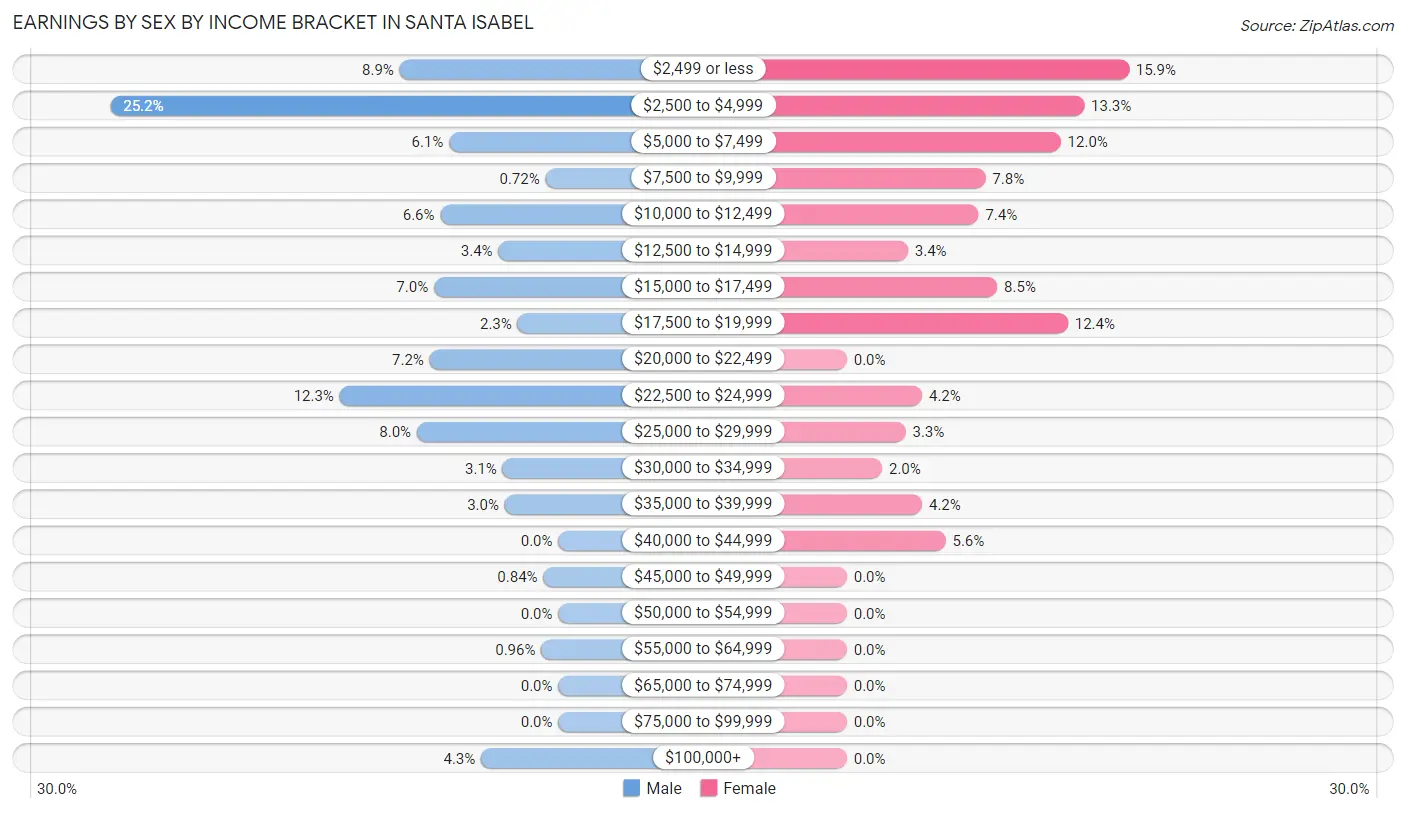
Earnings by Sex by Income Bracket in Santa Isabel
The most common earnings brackets in Santa Isabel are $2,500 to $4,999 for men (209 | 25.2%) and $2,499 or less for women (120 | 15.9%).
| Income | Male | Female |
| $2,499 or less | 74 (8.9%) | 120 (15.9%) |
| $2,500 to $4,999 | 209 (25.2%) | 101 (13.3%) |
| $5,000 to $7,499 | 51 (6.1%) | 91 (12.0%) |
| $7,500 to $9,999 | 6 (0.7%) | 59 (7.8%) |
| $10,000 to $12,499 | 55 (6.6%) | 56 (7.4%) |
| $12,500 to $14,999 | 28 (3.4%) | 26 (3.4%) |
| $15,000 to $17,499 | 58 (7.0%) | 64 (8.5%) |
| $17,500 to $19,999 | 19 (2.3%) | 94 (12.4%) |
| $20,000 to $22,499 | 60 (7.2%) | 0 (0.0%) |
| $22,500 to $24,999 | 102 (12.3%) | 32 (4.2%) |
| $25,000 to $29,999 | 66 (8.0%) | 25 (3.3%) |
| $30,000 to $34,999 | 26 (3.1%) | 15 (2.0%) |
| $35,000 to $39,999 | 25 (3.0%) | 32 (4.2%) |
| $40,000 to $44,999 | 0 (0.0%) | 42 (5.6%) |
| $45,000 to $49,999 | 7 (0.8%) | 0 (0.0%) |
| $50,000 to $54,999 | 0 (0.0%) | 0 (0.0%) |
| $55,000 to $64,999 | 8 (1.0%) | 0 (0.0%) |
| $65,000 to $74,999 | 0 (0.0%) | 0 (0.0%) |
| $75,000 to $99,999 | 0 (0.0%) | 0 (0.0%) |
| $100,000+ | 36 (4.3%) | 0 (0.0%) |
| Total | 830 (100.0%) | 757 (100.0%) |
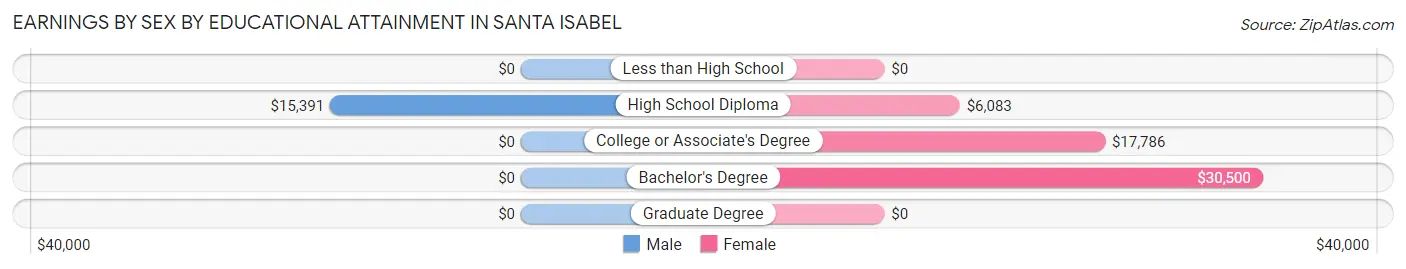
Earnings by Sex by Educational Attainment in Santa Isabel
Average earnings in Santa Isabel are $15,889 for men and $11,429 for women, a difference of 28.1%. Men with an educational attainment of high school diploma enjoy the highest average annual earnings of $15,391, while those with high school diploma education earn the least with $15,391. Women with an educational attainment of bachelor's degree earn the most with the average annual earnings of $30,500, while those with high school diploma education have the smallest earnings of $6,083.
| Educational Attainment | Male Income | Female Income |
| Less than High School | - | - |
| High School Diploma | $15,391 | $6,083 |
| College or Associate's Degree | - | - |
| Bachelor's Degree | - | - |
| Graduate Degree | - | - |
| Total | $15,889 | $11,429 |
Family Income in Santa Isabel
Family Income Brackets in Santa Isabel
According to the Santa Isabel family income data, there are 289 families falling into the less than $10,000 income range, which is the most common income bracket and makes up 24.7% of all families.
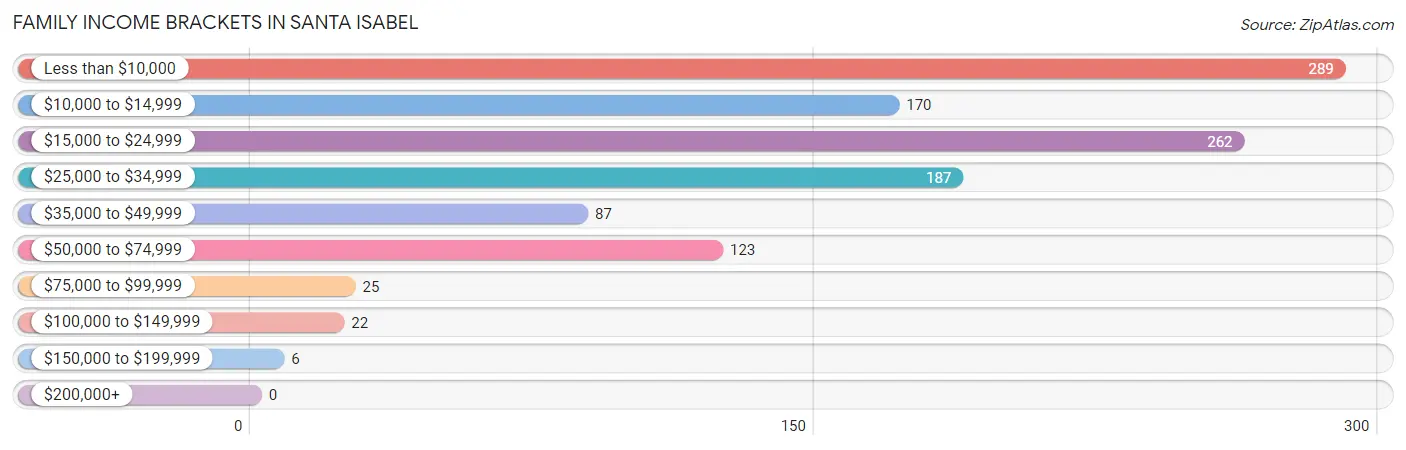
| Income Bracket | # Families | % Families |
| Less than $10,000 | 289 | 24.7% |
| $10,000 to $14,999 | 170 | 14.5% |
| $15,000 to $24,999 | 262 | 22.4% |
| $25,000 to $34,999 | 187 | 16.0% |
| $35,000 to $49,999 | 87 | 7.4% |
| $50,000 to $74,999 | 123 | 10.5% |
| $75,000 to $99,999 | 25 | 2.1% |
| $100,000 to $149,999 | 22 | 1.9% |
| $150,000 to $199,999 | 6 | 0.5% |
| $200,000+ | 0 | 0.0% |
Family Income by Famaliy Size in Santa Isabel
4-person families (299 | 25.6%) account for the highest median family income in Santa Isabel with $22,934 per family, while 2-person families (472 | 40.3%) have the highest median income of $10,000 per family member.
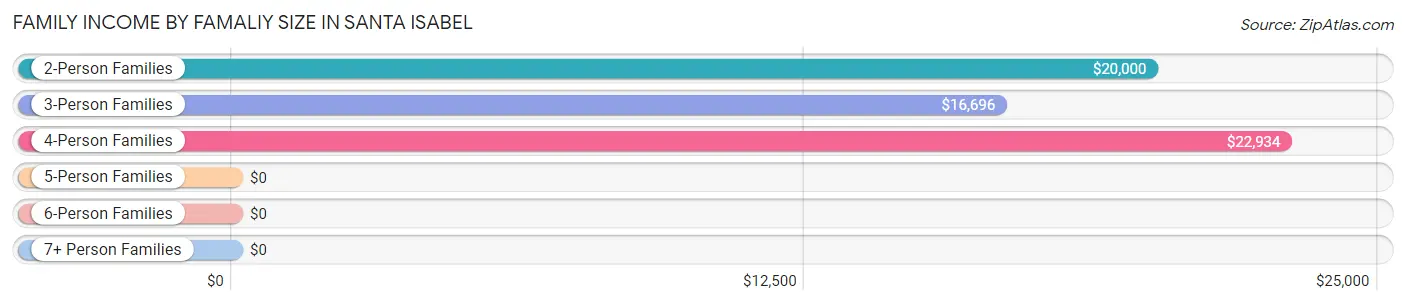
| Income Bracket | # Families | Median Income |
| 2-Person Families | 472 (40.3%) | $20,000 |
| 3-Person Families | 371 (31.7%) | $16,696 |
| 4-Person Families | 299 (25.6%) | $22,934 |
| 5-Person Families | 15 (1.3%) | $0 |
| 6-Person Families | 13 (1.1%) | $0 |
| 7+ Person Families | 0 (0.0%) | $0 |
| Total | 1,170 (100.0%) | $20,833 |
Family Income by Number of Earners in Santa Isabel
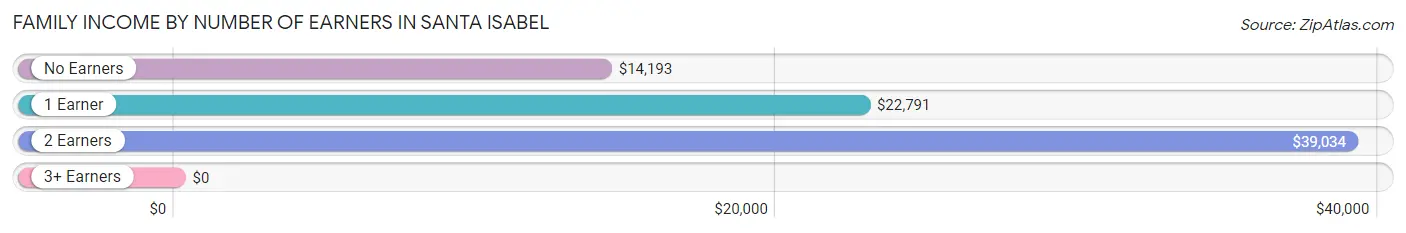
| Number of Earners | # Families | Median Income |
| No Earners | 407 (34.8%) | $14,193 |
| 1 Earner | 590 (50.4%) | $22,791 |
| 2 Earners | 139 (11.9%) | $39,034 |
| 3+ Earners | 34 (2.9%) | $0 |
| Total | 1,170 (100.0%) | $20,833 |
Household Income in Santa Isabel
Household Income Brackets in Santa Isabel
With 677 households falling in the category, the less than $10,000 income range is the most frequent in Santa Isabel, accounting for 33.7% of all households.
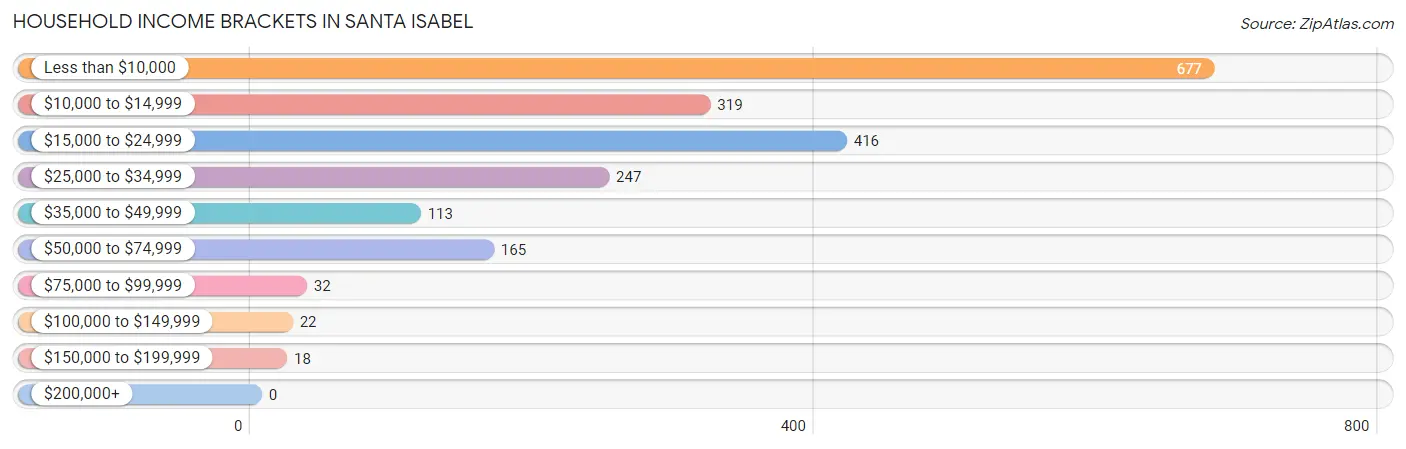
| Income Bracket | # Households | % Households |
| Less than $10,000 | 677 | 33.7% |
| $10,000 to $14,999 | 319 | 15.9% |
| $15,000 to $24,999 | 416 | 20.7% |
| $25,000 to $34,999 | 247 | 12.3% |
| $35,000 to $49,999 | 113 | 5.6% |
| $50,000 to $74,999 | 165 | 8.2% |
| $75,000 to $99,999 | 32 | 1.6% |
| $100,000 to $149,999 | 22 | 1.1% |
| $150,000 to $199,999 | 18 | 0.9% |
| $200,000+ | 0 | 0.0% |
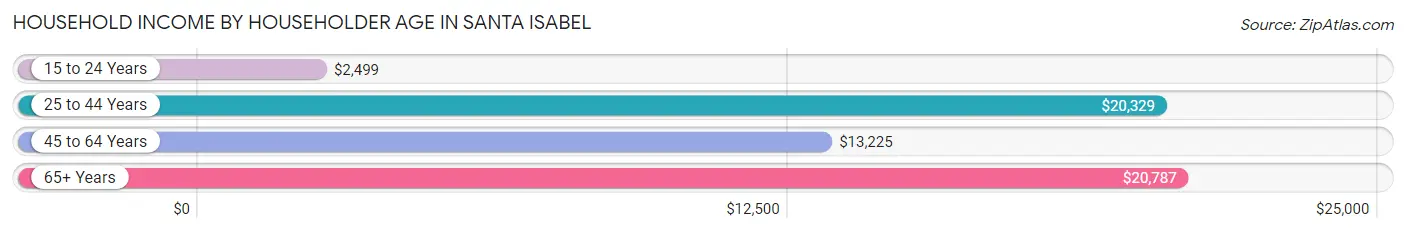
Household Income by Householder Age in Santa Isabel
The median household income in Santa Isabel is $15,165, with the highest median household income of $20,787 found in the 65+ years age bracket for the primary householder. A total of 794 households (39.5%) fall into this category. Meanwhile, the 15 to 24 years age bracket for the primary householder has the lowest median household income of $2,499, with 86 households (4.3%) in this group.
| Income Bracket | # Households | Median Income |
| 15 to 24 Years | 86 (4.3%) | $2,499 |
| 25 to 44 Years | 455 (22.7%) | $20,329 |
| 45 to 64 Years | 674 (33.6%) | $13,225 |
| 65+ Years | 794 (39.5%) | $20,787 |
| Total | 2,009 (100.0%) | $15,165 |
Poverty in Santa Isabel
Income Below Poverty by Sex and Age in Santa Isabel
With 57.3% poverty level for males and 67.7% for females among the residents of Santa Isabel, 5 year old males and under 5 year old females are the most vulnerable to poverty, with 51 males (100.0%) and 175 females (100.0%) in their respective age groups living below the poverty level.
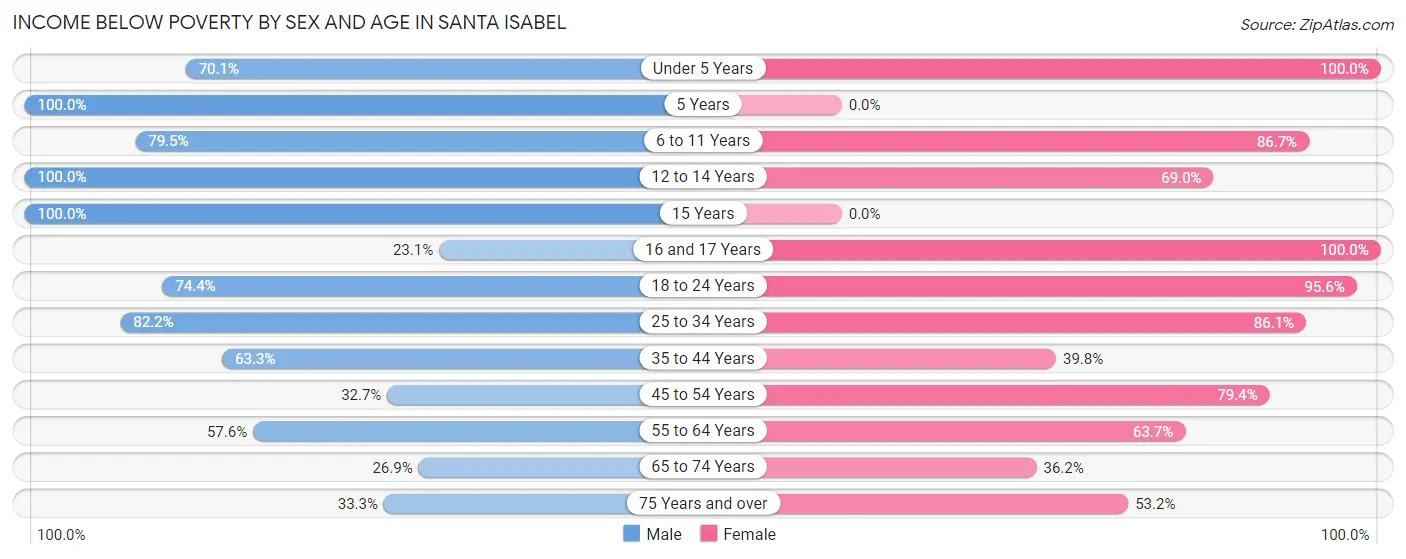
| Age Bracket | Male | Female |
| Under 5 Years | 75 (70.1%) | 175 (100.0%) |
| 5 Years | 51 (100.0%) | 0 (0.0%) |
| 6 to 11 Years | 201 (79.4%) | 202 (86.7%) |
| 12 to 14 Years | 27 (100.0%) | 20 (69.0%) |
| 15 Years | 21 (100.0%) | 0 (0.0%) |
| 16 and 17 Years | 12 (23.1%) | 92 (100.0%) |
| 18 to 24 Years | 221 (74.4%) | 172 (95.6%) |
| 25 to 34 Years | 148 (82.2%) | 292 (86.1%) |
| 35 to 44 Years | 235 (63.3%) | 138 (39.8%) |
| 45 to 54 Years | 86 (32.7%) | 254 (79.4%) |
| 55 to 64 Years | 140 (57.6%) | 223 (63.7%) |
| 65 to 74 Years | 89 (26.9%) | 137 (36.1%) |
| 75 Years and over | 65 (33.3%) | 151 (53.2%) |
| Total | 1,371 (57.3%) | 1,856 (67.7%) |
Income Above Poverty by Sex and Age in Santa Isabel
According to the poverty statistics in Santa Isabel, males aged 16 and 17 years and females aged 15 years are the age groups that are most secure financially, with 76.9% of males and 100.0% of females in these age groups living above the poverty line.
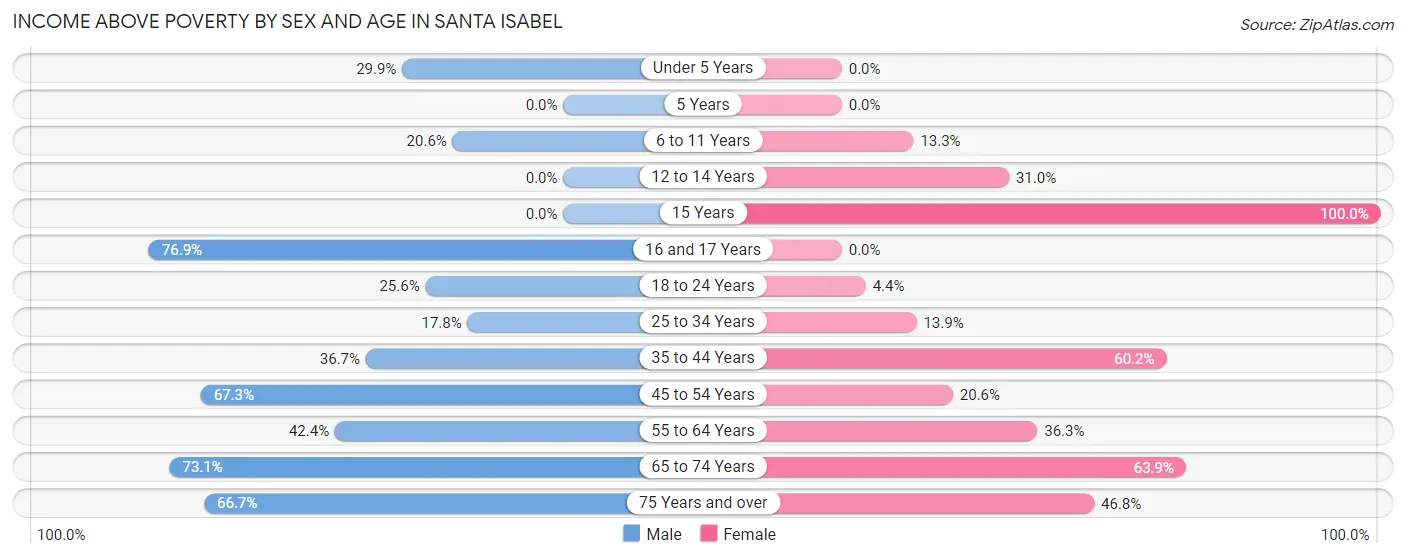
| Age Bracket | Male | Female |
| Under 5 Years | 32 (29.9%) | 0 (0.0%) |
| 5 Years | 0 (0.0%) | 0 (0.0%) |
| 6 to 11 Years | 52 (20.5%) | 31 (13.3%) |
| 12 to 14 Years | 0 (0.0%) | 9 (31.0%) |
| 15 Years | 0 (0.0%) | 14 (100.0%) |
| 16 and 17 Years | 40 (76.9%) | 0 (0.0%) |
| 18 to 24 Years | 76 (25.6%) | 8 (4.4%) |
| 25 to 34 Years | 32 (17.8%) | 47 (13.9%) |
| 35 to 44 Years | 136 (36.7%) | 209 (60.2%) |
| 45 to 54 Years | 177 (67.3%) | 66 (20.6%) |
| 55 to 64 Years | 103 (42.4%) | 127 (36.3%) |
| 65 to 74 Years | 242 (73.1%) | 242 (63.8%) |
| 75 Years and over | 130 (66.7%) | 133 (46.8%) |
| Total | 1,020 (42.7%) | 886 (32.3%) |
Income Below Poverty Among Married-Couple Families in Santa Isabel
The poverty statistics for married-couple families in Santa Isabel show that 36.0% or 217 of the total 603 families live below the poverty line. Families with 1 or 2 children have the highest poverty rate of 60.5%, comprising of 81 families. On the other hand, families with no children have the lowest poverty rate of 29.0%, which includes 136 families.
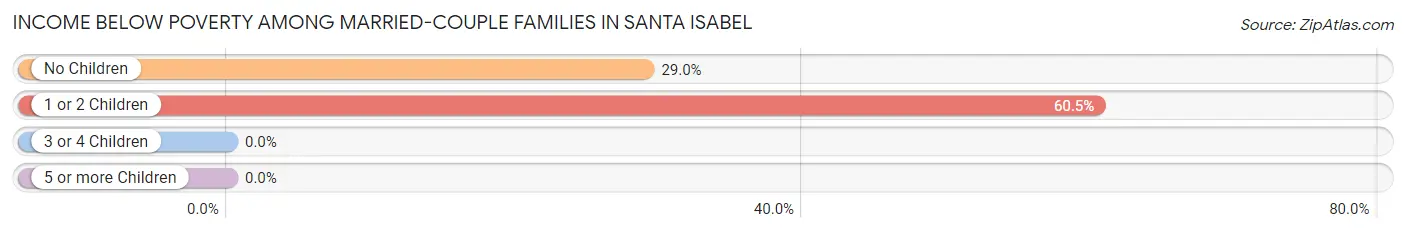
| Children | Above Poverty | Below Poverty |
| No Children | 333 (71.0%) | 136 (29.0%) |
| 1 or 2 Children | 53 (39.6%) | 81 (60.5%) |
| 3 or 4 Children | 0 (0.0%) | 0 (0.0%) |
| 5 or more Children | 0 (0.0%) | 0 (0.0%) |
| Total | 386 (64.0%) | 217 (36.0%) |
Income Below Poverty Among Single-Parent Households in Santa Isabel
According to the poverty data in Santa Isabel, 49.1% or 26 single-father households and 85.2% or 438 single-mother households are living below the poverty line. Among single-father households, those with 1 or 2 children have the highest poverty rate, with 14 households (100.0%) experiencing poverty. Likewise, among single-mother households, those with 3 or 4 children have the highest poverty rate, with 87 households (100.0%) falling below the poverty line.
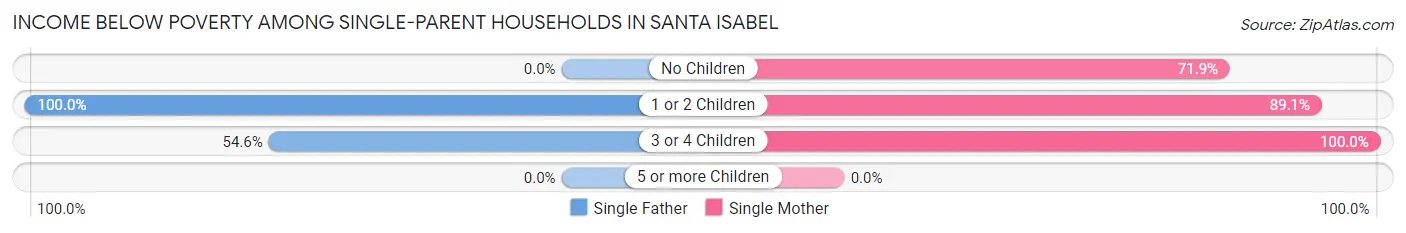
| Children | Single Father | Single Mother |
| No Children | 0 (0.0%) | 123 (71.9%) |
| 1 or 2 Children | 14 (100.0%) | 228 (89.1%) |
| 3 or 4 Children | 12 (54.5%) | 87 (100.0%) |
| 5 or more Children | 0 (0.0%) | 0 (0.0%) |
| Total | 26 (49.1%) | 438 (85.2%) |
Income Below Poverty Among Married-Couple vs Single-Parent Households in Santa Isabel
The poverty data for Santa Isabel shows that 217 of the married-couple family households (36.0%) and 464 of the single-parent households (81.8%) are living below the poverty level. Within the married-couple family households, those with 1 or 2 children have the highest poverty rate, with 81 households (60.5%) falling below the poverty line. Among the single-parent households, those with 3 or 4 children have the highest poverty rate, with 99 household (90.8%) living below poverty.
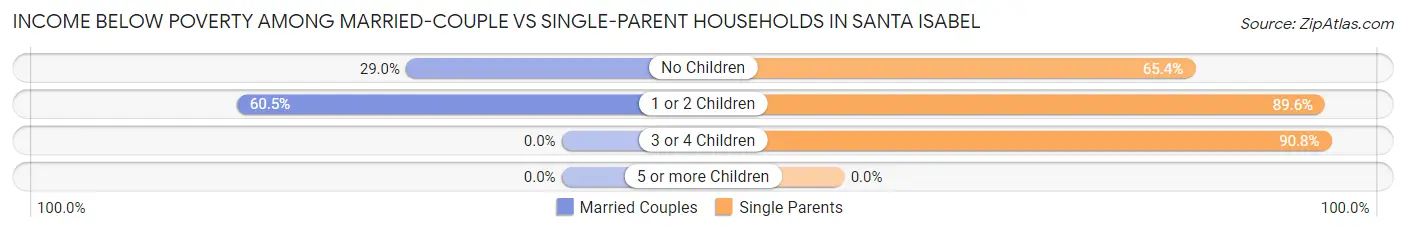
| Children | Married-Couple Families | Single-Parent Households |
| No Children | 136 (29.0%) | 123 (65.4%) |
| 1 or 2 Children | 81 (60.5%) | 242 (89.6%) |
| 3 or 4 Children | 0 (0.0%) | 99 (90.8%) |
| 5 or more Children | 0 (0.0%) | 0 (0.0%) |
| Total | 217 (36.0%) | 464 (81.8%) |
Race in Santa Isabel
The most populous races in Santa Isabel are Hispanic or Latino (5,133 | 100.0%), Two or more Races (2,573 | 50.1%), and White / Caucasian (1,428 | 27.8%).
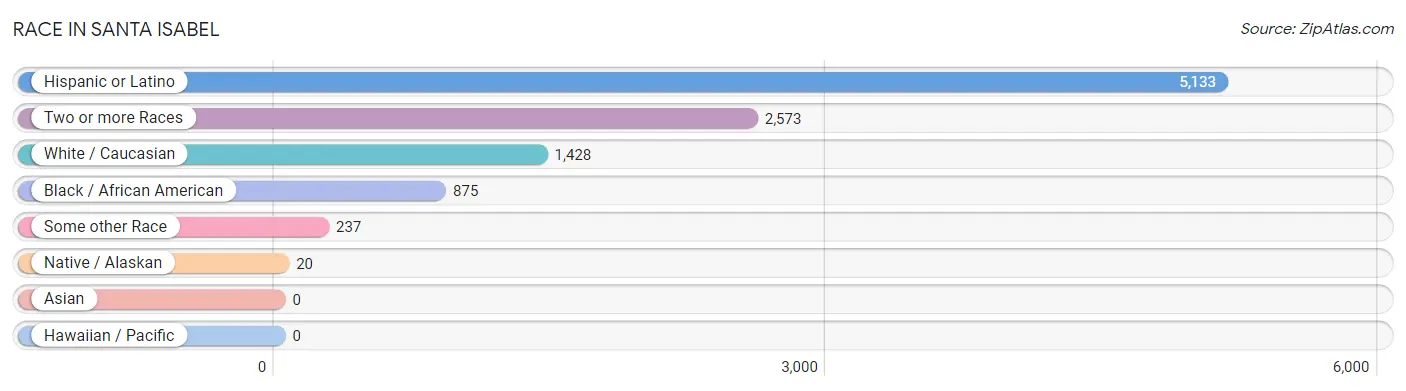
| Race | # Population | % Population |
| Asian | 0 | 0.0% |
| Black / African American | 875 | 17.1% |
| Hawaiian / Pacific | 0 | 0.0% |
| Hispanic or Latino | 5,133 | 100.0% |
| Native / Alaskan | 20 | 0.4% |
| White / Caucasian | 1,428 | 27.8% |
| Two or more Races | 2,573 | 50.1% |
| Some other Race | 237 | 4.6% |
| Total | 5,133 | 100.0% |
Ancestry in Santa Isabel
The most populous ancestries reported in Santa Isabel are Puerto Rican (5,100 | 99.4%), Dominican (13 | 0.3%), American (12 | 0.2%), British West Indian (12 | 0.2%), and Cuban (9 | 0.2%), together accounting for 100.2% of all Santa Isabel residents.
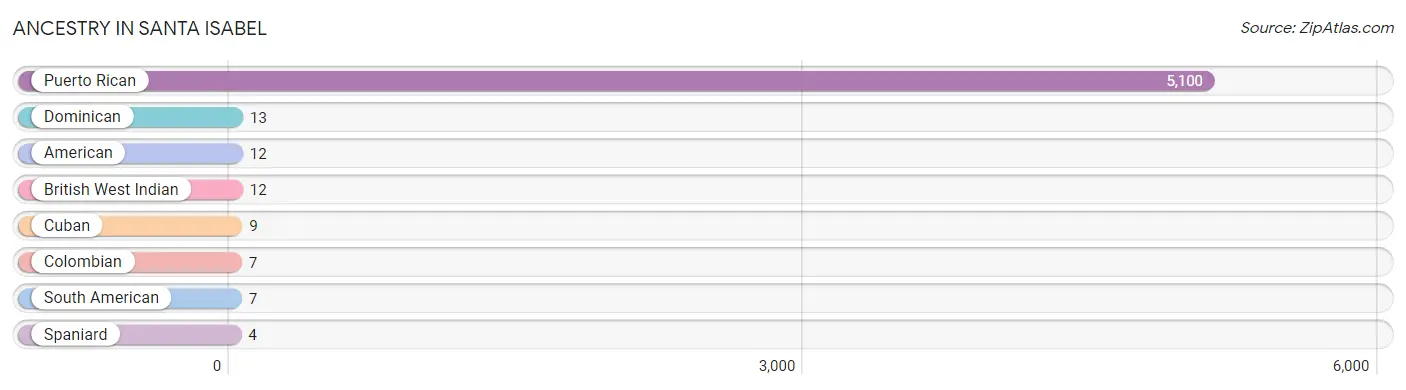
| Ancestry | # Population | % Population |
| American | 12 | 0.2% |
| British West Indian | 12 | 0.2% |
| Colombian | 7 | 0.1% |
| Cuban | 9 | 0.2% |
| Dominican | 13 | 0.3% |
| Puerto Rican | 5,100 | 99.4% |
| South American | 7 | 0.1% |
| Spaniard | 4 | 0.1% | View All 8 Rows |
Immigrants in Santa Isabel

| Immigration Origin | # Population | % Population | View All 0 Rows |
Sex and Age in Santa Isabel
Sex and Age in Santa Isabel
The most populous age groups in Santa Isabel are 40 to 44 Years (232 | 9.7%) for men and 40 to 44 Years (249 | 9.1%) for women.
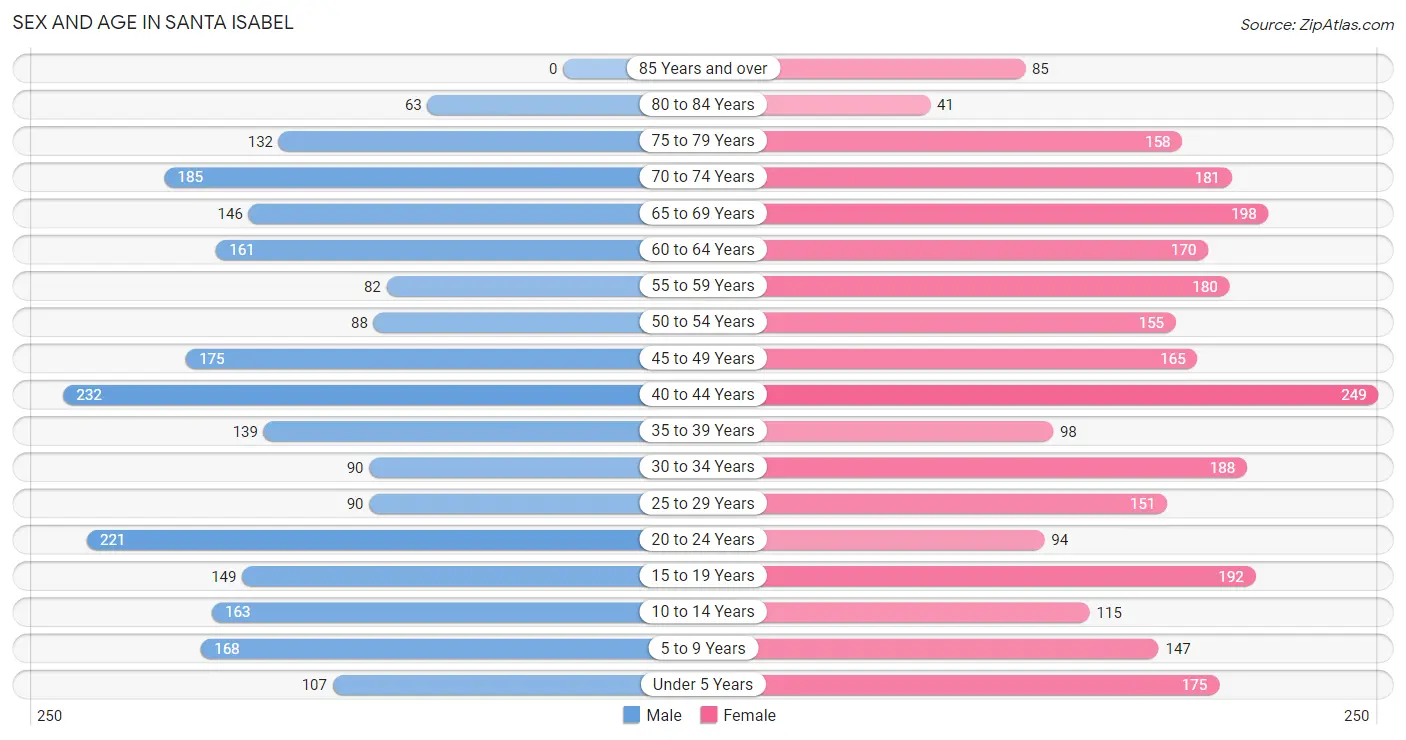
| Age Bracket | Male | Female |
| Under 5 Years | 107 (4.5%) | 175 (6.4%) |
| 5 to 9 Years | 168 (7.0%) | 147 (5.4%) |
| 10 to 14 Years | 163 (6.8%) | 115 (4.2%) |
| 15 to 19 Years | 149 (6.2%) | 192 (7.0%) |
| 20 to 24 Years | 221 (9.2%) | 94 (3.4%) |
| 25 to 29 Years | 90 (3.8%) | 151 (5.5%) |
| 30 to 34 Years | 90 (3.8%) | 188 (6.9%) |
| 35 to 39 Years | 139 (5.8%) | 98 (3.6%) |
| 40 to 44 Years | 232 (9.7%) | 249 (9.1%) |
| 45 to 49 Years | 175 (7.3%) | 165 (6.0%) |
| 50 to 54 Years | 88 (3.7%) | 155 (5.7%) |
| 55 to 59 Years | 82 (3.4%) | 180 (6.6%) |
| 60 to 64 Years | 161 (6.7%) | 170 (6.2%) |
| 65 to 69 Years | 146 (6.1%) | 198 (7.2%) |
| 70 to 74 Years | 185 (7.7%) | 181 (6.6%) |
| 75 to 79 Years | 132 (5.5%) | 158 (5.8%) |
| 80 to 84 Years | 63 (2.6%) | 41 (1.5%) |
| 85 Years and over | 0 (0.0%) | 85 (3.1%) |
| Total | 2,391 (100.0%) | 2,742 (100.0%) |
Families and Households in Santa Isabel
Median Family Size in Santa Isabel
The median family size in Santa Isabel is 3.44 persons per family, with single male/father families (53 | 4.5%) accounting for the largest median family size of 4.6 persons per family. On the other hand, married-couple families (603 | 51.5%) represent the smallest median family size with 3.18 persons per family.
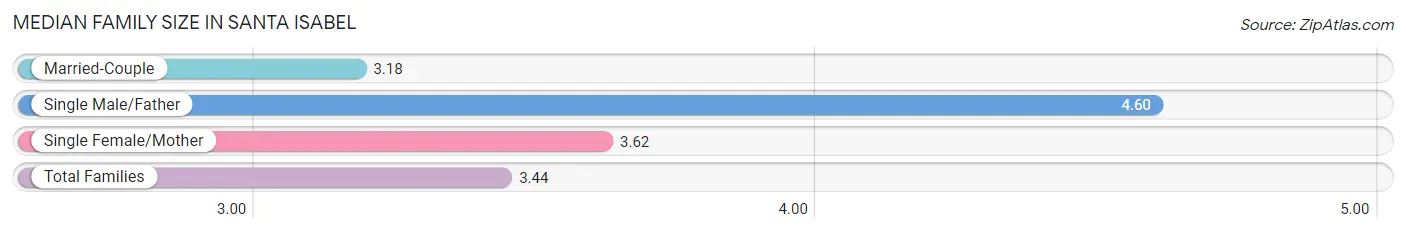
| Family Type | # Families | Family Size |
| Married-Couple | 603 (51.5%) | 3.18 |
| Single Male/Father | 53 (4.5%) | 4.60 |
| Single Female/Mother | 514 (43.9%) | 3.62 |
| Total Families | 1,170 (100.0%) | 3.44 |
Median Household Size in Santa Isabel
The median household size in Santa Isabel is 2.56 persons per household, with single male/father households (53 | 2.6%) accounting for the largest median household size of 5.58 persons per household. non-family households (839 | 41.8%) represent the smallest median household size with 1.13 persons per household.
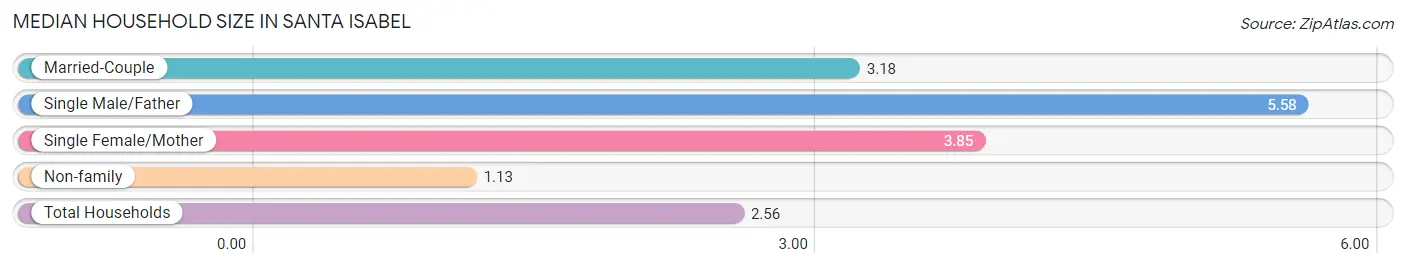
| Household Type | # Households | Household Size |
| Married-Couple | 603 (30.0%) | 3.18 |
| Single Male/Father | 53 (2.6%) | 5.58 |
| Single Female/Mother | 514 (25.6%) | 3.85 |
| Non-family | 839 (41.8%) | 1.13 |
| Total Households | 2,009 (100.0%) | 2.56 |
Household Size by Marriage Status in Santa Isabel
Out of a total of 2,009 households in Santa Isabel, 1,170 (58.2%) are family households, while 839 (41.8%) are nonfamily households. The most numerous type of family households are 2-person households, comprising 472, and the most common type of nonfamily households are 1-person households, comprising 743.
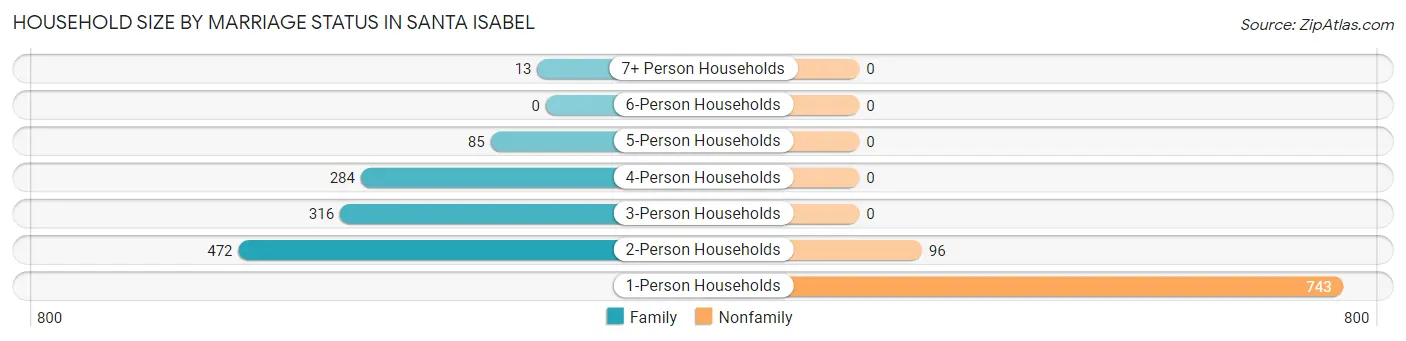
| Household Size | Family Households | Nonfamily Households |
| 1-Person Households | - | 743 (37.0%) |
| 2-Person Households | 472 (23.5%) | 96 (4.8%) |
| 3-Person Households | 316 (15.7%) | 0 (0.0%) |
| 4-Person Households | 284 (14.1%) | 0 (0.0%) |
| 5-Person Households | 85 (4.2%) | 0 (0.0%) |
| 6-Person Households | 0 (0.0%) | 0 (0.0%) |
| 7+ Person Households | 13 (0.6%) | 0 (0.0%) |
| Total | 1,170 (58.2%) | 839 (41.8%) |
Female Fertility in Santa Isabel
Fertility by Age in Santa Isabel
Average fertility rate in Santa Isabel is 22.0 births per 1,000 women. Women in the age bracket of 15 to 19 years have the highest fertility rate with 130.0 births per 1,000 women. Women in the age bracket of 15 to 19 years acount for 100.0% of all women with births.
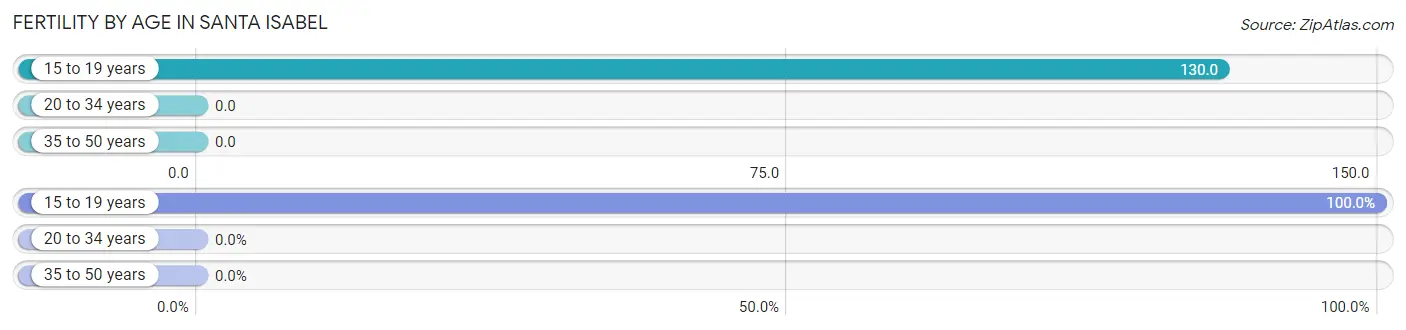
| Age Bracket | Women with Births | Births / 1,000 Women |
| 15 to 19 years | 25 (100.0%) | 130.0 |
| 20 to 34 years | 0 (0.0%) | 0.0 |
| 35 to 50 years | 0 (0.0%) | 0.0 |
| Total | 25 (100.0%) | 22.0 |
Fertility by Age by Marriage Status in Santa Isabel
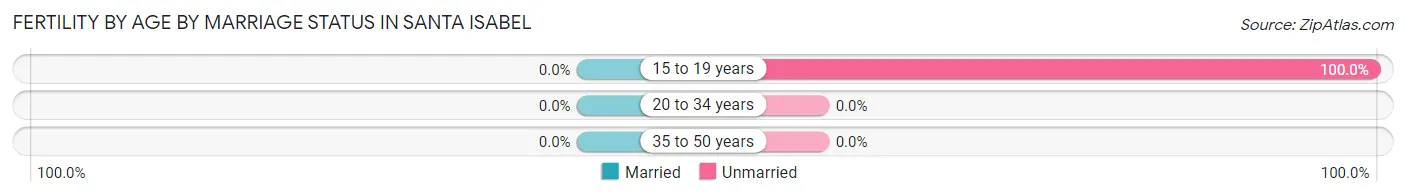
| Age Bracket | Married | Unmarried |
| 15 to 19 years | 0 (0.0%) | 25 (100.0%) |
| 20 to 34 years | 0 (0.0%) | 0 (0.0%) |
| 35 to 50 years | 0 (0.0%) | 0 (0.0%) |
| Total | 0 (0.0%) | 25 (100.0%) |
Fertility by Education in Santa Isabel
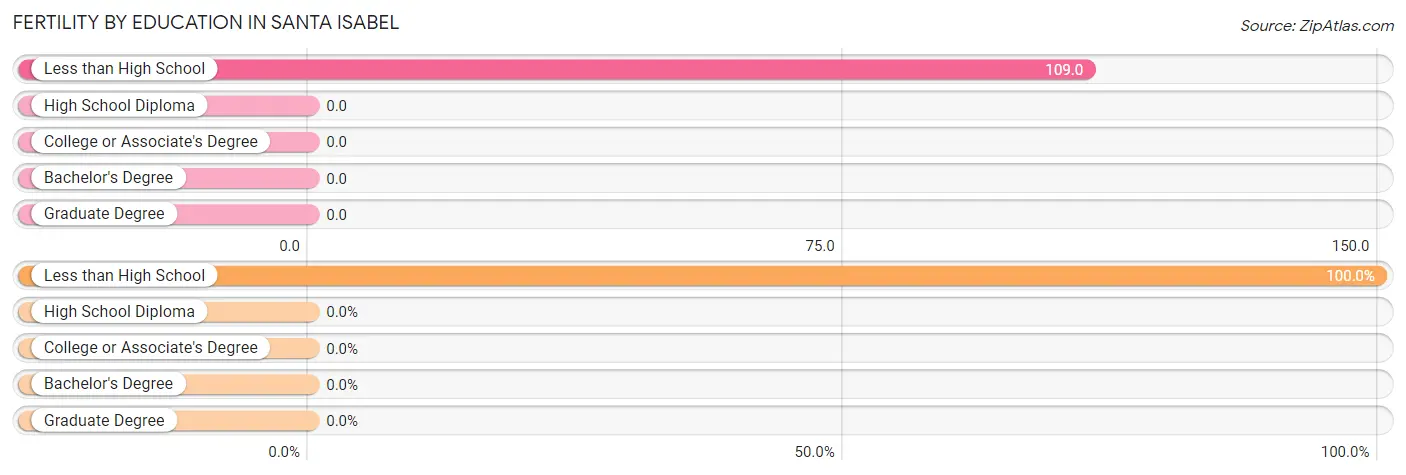
| Educational Attainment | Women with Births | Births / 1,000 Women |
| Less than High School | 25 (100.0%) | 109.0 |
| High School Diploma | 0 (0.0%) | 0.0 |
| College or Associate's Degree | 0 (0.0%) | 0.0 |
| Bachelor's Degree | 0 (0.0%) | 0.0 |
| Graduate Degree | 0 (0.0%) | 0.0 |
| Total | 25 (100.0%) | 22.0 |
Fertility by Education by Marriage Status in Santa Isabel
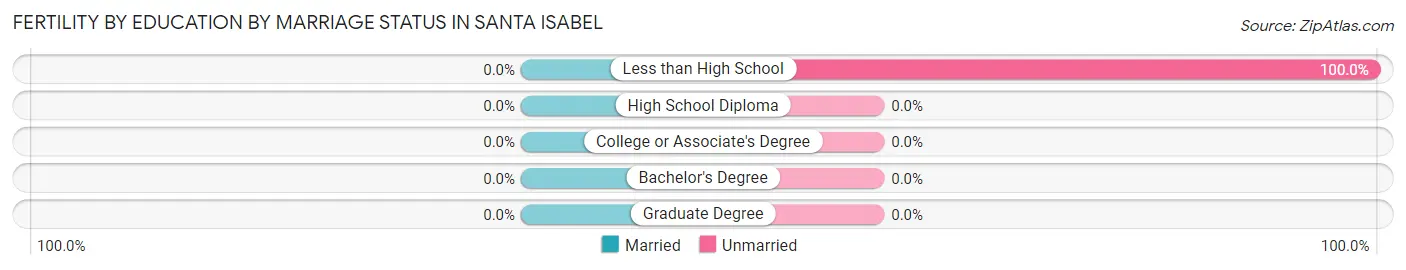
| Educational Attainment | Married | Unmarried |
| Less than High School | 0 (0.0%) | 25 (100.0%) |
| High School Diploma | 0 (0.0%) | 0 (0.0%) |
| College or Associate's Degree | 0 (0.0%) | 0 (0.0%) |
| Bachelor's Degree | 0 (0.0%) | 0 (0.0%) |
| Graduate Degree | 0 (0.0%) | 0 (0.0%) |
| Total | 0 (0.0%) | 25 (100.0%) |
Employment Characteristics in Santa Isabel
Employment by Class of Employer in Santa Isabel
Among the 1,272 employed individuals in Santa Isabel, private company employees (710 | 55.8%), local government employees (193 | 15.2%), and state government employees (183 | 14.4%) make up the most common classes of employment.
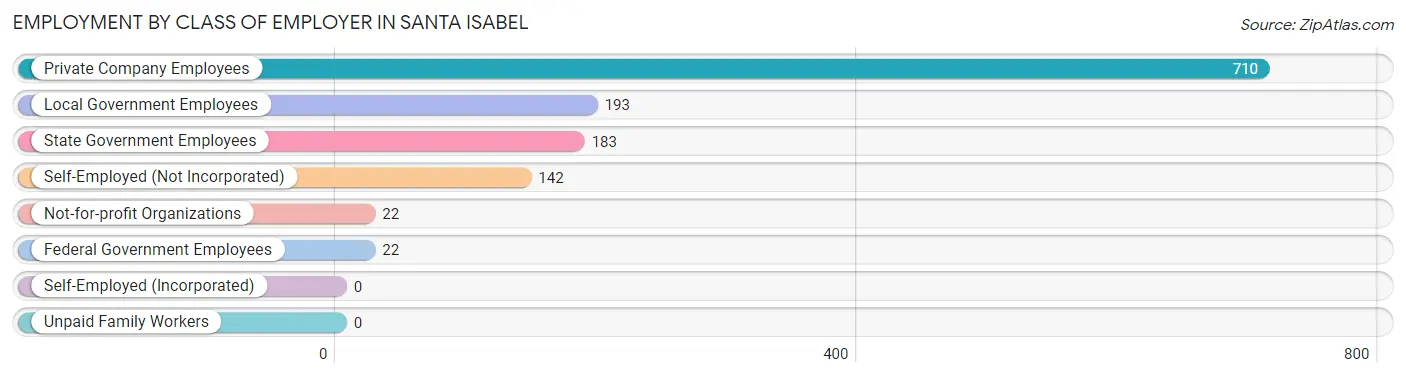
| Employer Class | # Employees | % Employees |
| Private Company Employees | 710 | 55.8% |
| Self-Employed (Incorporated) | 0 | 0.0% |
| Self-Employed (Not Incorporated) | 142 | 11.2% |
| Not-for-profit Organizations | 22 | 1.7% |
| Local Government Employees | 193 | 15.2% |
| State Government Employees | 183 | 14.4% |
| Federal Government Employees | 22 | 1.7% |
| Unpaid Family Workers | 0 | 0.0% |
| Total | 1,272 | 100.0% |
Employment Status by Age in Santa Isabel
According to the labor force statistics for Santa Isabel, out of the total population over 16 years of age (4,223), 36.7% or 1,550 individuals are in the labor force, with 11.2% or 174 of them unemployed. The age group with the highest labor force participation rate is 35 to 44 years, with 74.0% or 531 individuals in the labor force. Within the labor force, the 55 to 59 years age range has the highest percentage of unemployed individuals, with 29.6% or 34 of them being unemployed.
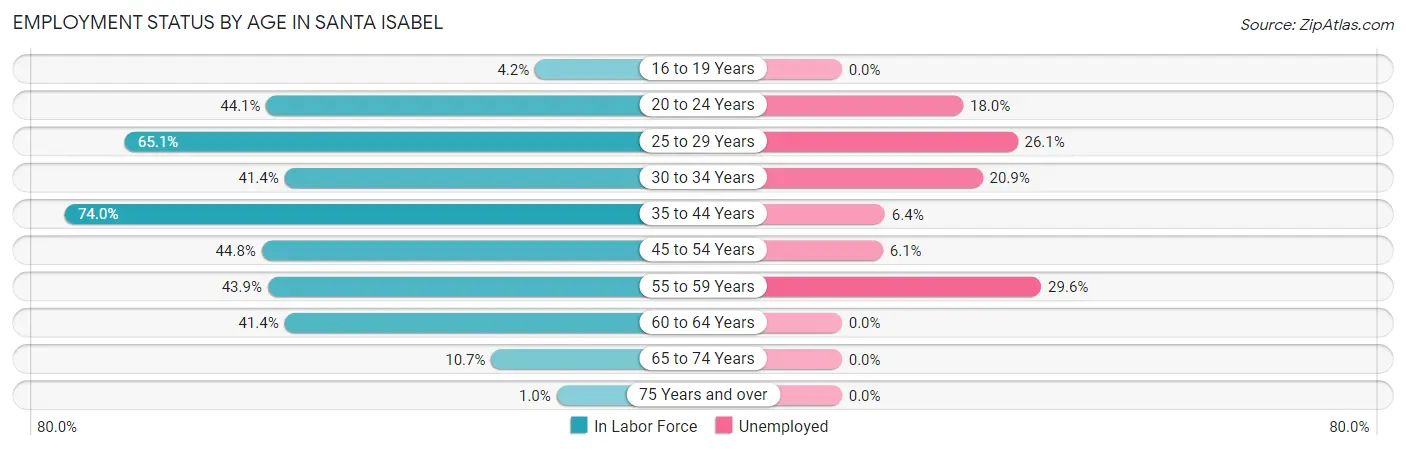
| Age Bracket | In Labor Force | Unemployed |
| 16 to 19 Years | 13 (4.2%) | 0 (0.0%) |
| 20 to 24 Years | 139 (44.1%) | 25 (18.0%) |
| 25 to 29 Years | 157 (65.1%) | 41 (26.1%) |
| 30 to 34 Years | 115 (41.4%) | 24 (20.9%) |
| 35 to 44 Years | 531 (74.0%) | 34 (6.4%) |
| 45 to 54 Years | 261 (44.8%) | 16 (6.1%) |
| 55 to 59 Years | 115 (43.9%) | 34 (29.6%) |
| 60 to 64 Years | 137 (41.4%) | 0 (0.0%) |
| 65 to 74 Years | 76 (10.7%) | 0 (0.0%) |
| 75 Years and over | 5 (1.0%) | 0 (0.0%) |
| Total | 1,550 (36.7%) | 174 (11.2%) |
Employment Status by Educational Attainment in Santa Isabel
According to labor force statistics for Santa Isabel, 54.5% of individuals (1,315) out of the total population between 25 and 64 years of age (2,413) are in the labor force, with 11.3% or 149 of them being unemployed. The group with the highest labor force participation rate are those with the educational attainment of bachelor's degree or higher, with 67.3% or 424 individuals in the labor force. Within the labor force, individuals with less than high school education have the highest percentage of unemployment, with 51.5% or 52 of them being unemployed.
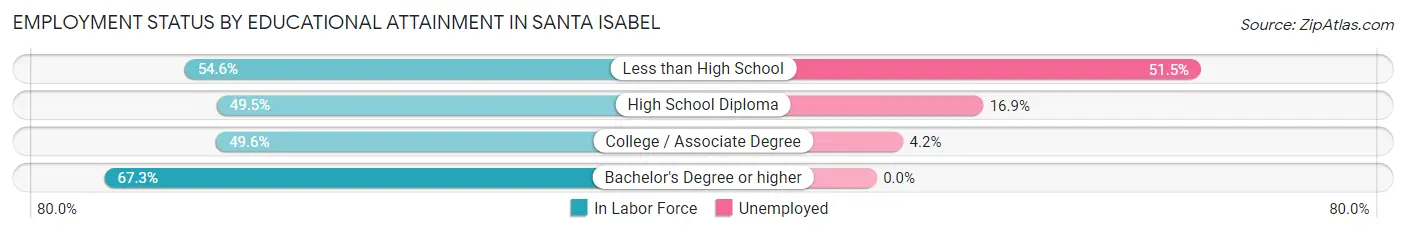
| Educational Attainment | In Labor Force | Unemployed |
| Less than High School | 101 (54.6%) | 95 (51.5%) |
| High School Diploma | 502 (49.5%) | 172 (16.9%) |
| College / Associate Degree | 289 (49.6%) | 24 (4.2%) |
| Bachelor's Degree or higher | 424 (67.3%) | 0 (0.0%) |
| Total | 1,315 (54.5%) | 273 (11.3%) |
Employment Occupations by Sex in Santa Isabel
Management, Business, Science and Arts Occupations
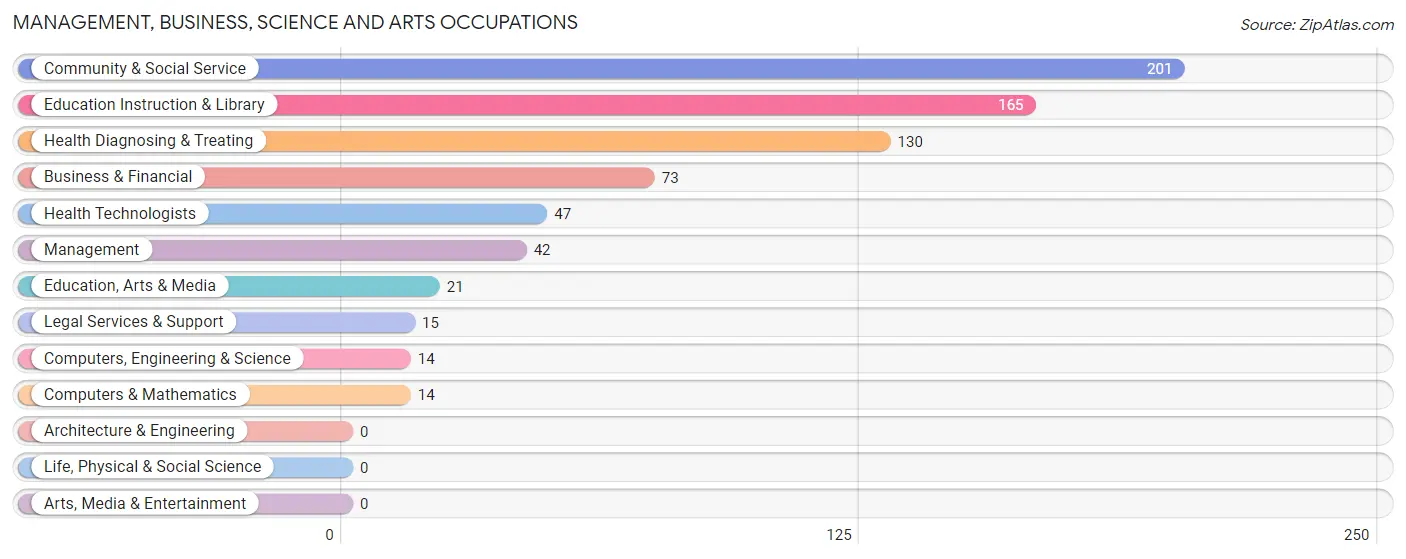
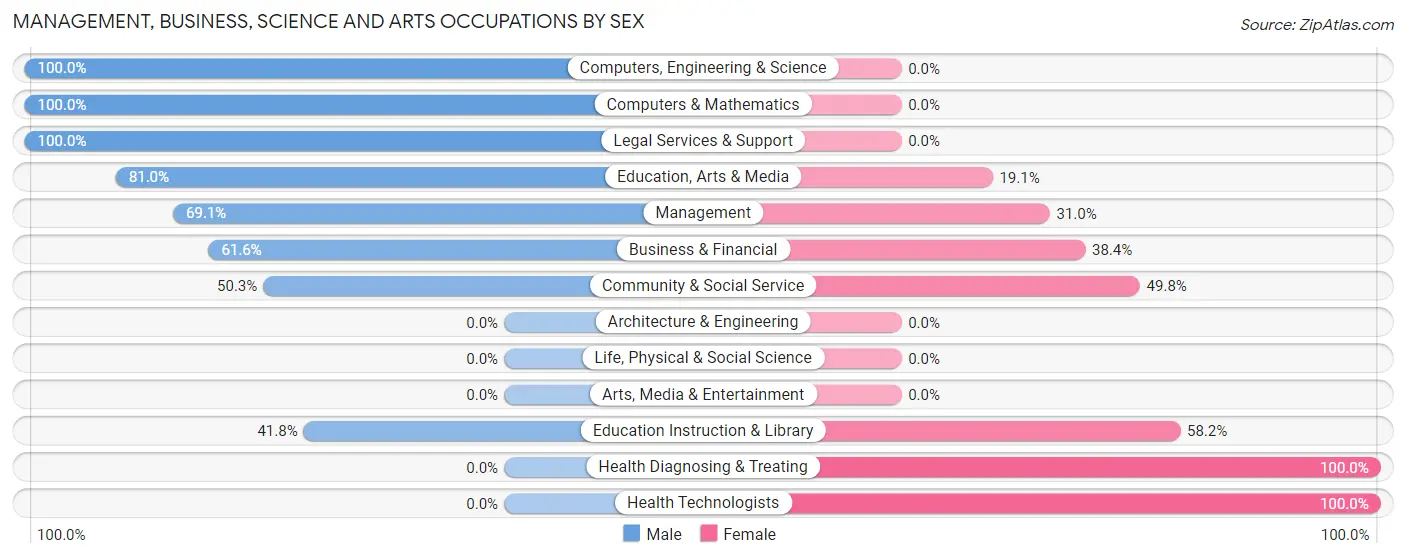
The most common Management, Business, Science and Arts occupations in Santa Isabel are Community & Social Service (201 | 14.6%), Education Instruction & Library (165 | 12.0%), Health Diagnosing & Treating (130 | 9.5%), Business & Financial (73 | 5.3%), and Health Technologists (47 | 3.4%).
Management, Business, Science and Arts Occupations by Sex
Within the Management, Business, Science and Arts occupations in Santa Isabel, the most male-oriented occupations are Computers, Engineering & Science (100.0%), Computers & Mathematics (100.0%), and Legal Services & Support (100.0%), while the most female-oriented occupations are Health Diagnosing & Treating (100.0%), Health Technologists (100.0%), and Education Instruction & Library (58.2%).
| Occupation | Male | Female |
| Management | 29 (69.1%) | 13 (30.9%) |
| Business & Financial | 45 (61.6%) | 28 (38.4%) |
| Computers, Engineering & Science | 14 (100.0%) | 0 (0.0%) |
| Computers & Mathematics | 14 (100.0%) | 0 (0.0%) |
| Architecture & Engineering | 0 (0.0%) | 0 (0.0%) |
| Life, Physical & Social Science | 0 (0.0%) | 0 (0.0%) |
| Community & Social Service | 101 (50.2%) | 100 (49.7%) |
| Education, Arts & Media | 17 (80.9%) | 4 (19.1%) |
| Legal Services & Support | 15 (100.0%) | 0 (0.0%) |
| Education Instruction & Library | 69 (41.8%) | 96 (58.2%) |
| Arts, Media & Entertainment | 0 (0.0%) | 0 (0.0%) |
| Health Diagnosing & Treating | 0 (0.0%) | 130 (100.0%) |
| Health Technologists | 0 (0.0%) | 47 (100.0%) |
| Total (Category) | 189 (41.1%) | 271 (58.9%) |
| Total (Overall) | 725 (52.7%) | 650 (47.3%) |
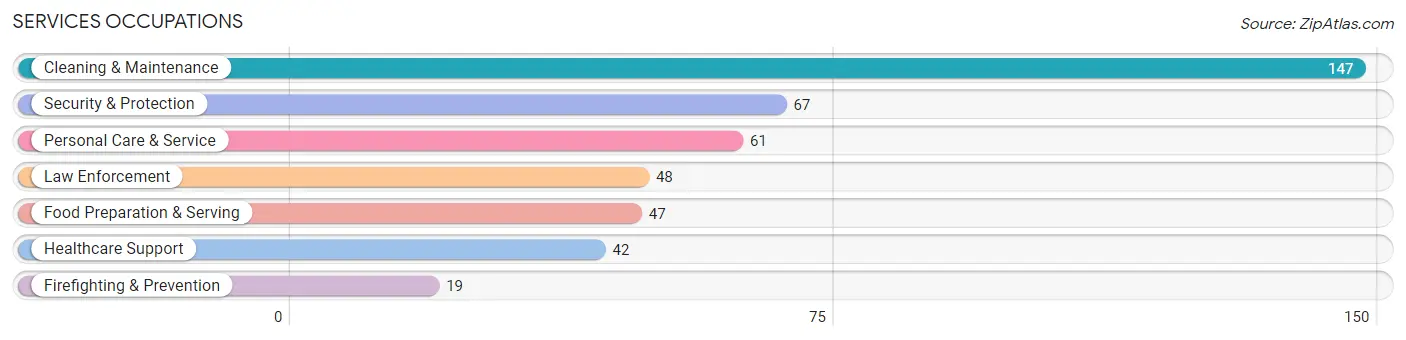
Services Occupations
The most common Services occupations in Santa Isabel are Cleaning & Maintenance (147 | 10.7%), Security & Protection (67 | 4.9%), Personal Care & Service (61 | 4.4%), Law Enforcement (48 | 3.5%), and Food Preparation & Serving (47 | 3.4%).
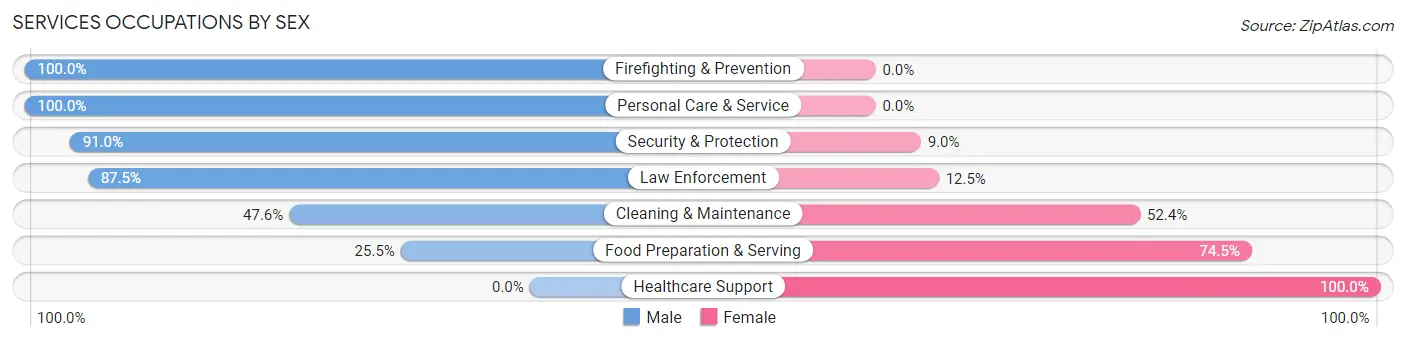
Services Occupations by Sex
Within the Services occupations in Santa Isabel, the most male-oriented occupations are Firefighting & Prevention (100.0%), Personal Care & Service (100.0%), and Security & Protection (91.0%), while the most female-oriented occupations are Healthcare Support (100.0%), Food Preparation & Serving (74.5%), and Cleaning & Maintenance (52.4%).
| Occupation | Male | Female |
| Healthcare Support | 0 (0.0%) | 42 (100.0%) |
| Security & Protection | 61 (91.0%) | 6 (9.0%) |
| Firefighting & Prevention | 19 (100.0%) | 0 (0.0%) |
| Law Enforcement | 42 (87.5%) | 6 (12.5%) |
| Food Preparation & Serving | 12 (25.5%) | 35 (74.5%) |
| Cleaning & Maintenance | 70 (47.6%) | 77 (52.4%) |
| Personal Care & Service | 61 (100.0%) | 0 (0.0%) |
| Total (Category) | 204 (56.0%) | 160 (44.0%) |
| Total (Overall) | 725 (52.7%) | 650 (47.3%) |
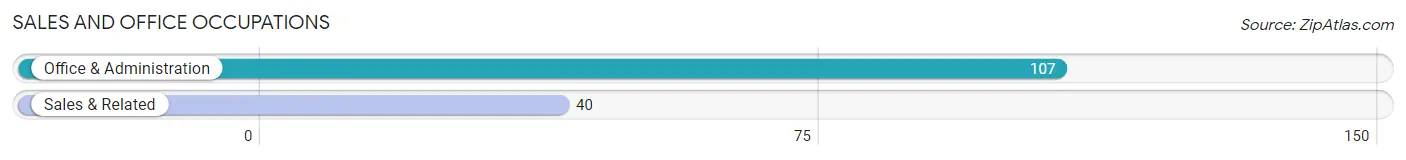
Sales and Office Occupations
The most common Sales and Office occupations in Santa Isabel are Office & Administration (107 | 7.8%), and Sales & Related (40 | 2.9%).
Sales and Office Occupations by Sex
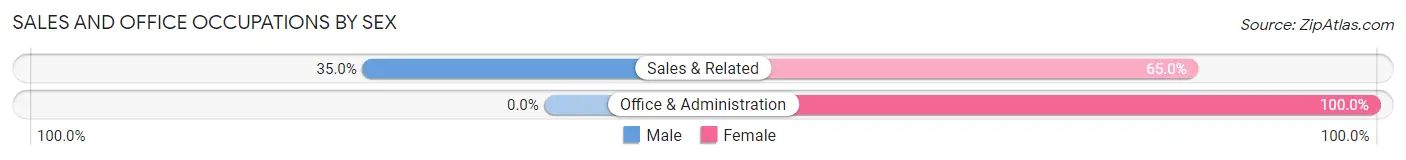
| Occupation | Male | Female |
| Sales & Related | 14 (35.0%) | 26 (65.0%) |
| Office & Administration | 0 (0.0%) | 107 (100.0%) |
| Total (Category) | 14 (9.5%) | 133 (90.5%) |
| Total (Overall) | 725 (52.7%) | 650 (47.3%) |
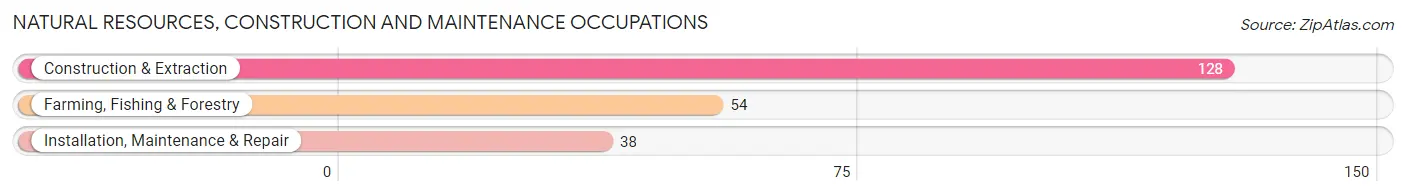
Natural Resources, Construction and Maintenance Occupations
The most common Natural Resources, Construction and Maintenance occupations in Santa Isabel are Construction & Extraction (128 | 9.3%), Farming, Fishing & Forestry (54 | 3.9%), and Installation, Maintenance & Repair (38 | 2.8%).
Natural Resources, Construction and Maintenance Occupations by Sex
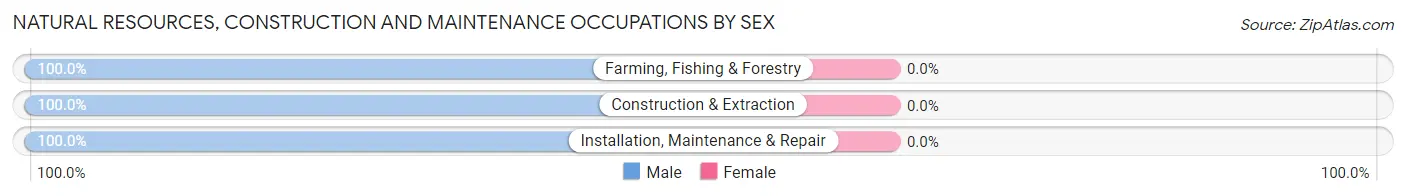
| Occupation | Male | Female |
| Farming, Fishing & Forestry | 54 (100.0%) | 0 (0.0%) |
| Construction & Extraction | 128 (100.0%) | 0 (0.0%) |
| Installation, Maintenance & Repair | 38 (100.0%) | 0 (0.0%) |
| Total (Category) | 220 (100.0%) | 0 (0.0%) |
| Total (Overall) | 725 (52.7%) | 650 (47.3%) |
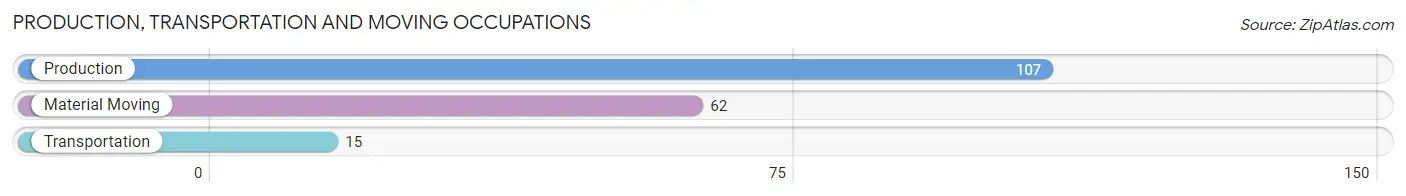
Production, Transportation and Moving Occupations
The most common Production, Transportation and Moving occupations in Santa Isabel are Production (107 | 7.8%), Material Moving (62 | 4.5%), and Transportation (15 | 1.1%).
Production, Transportation and Moving Occupations by Sex
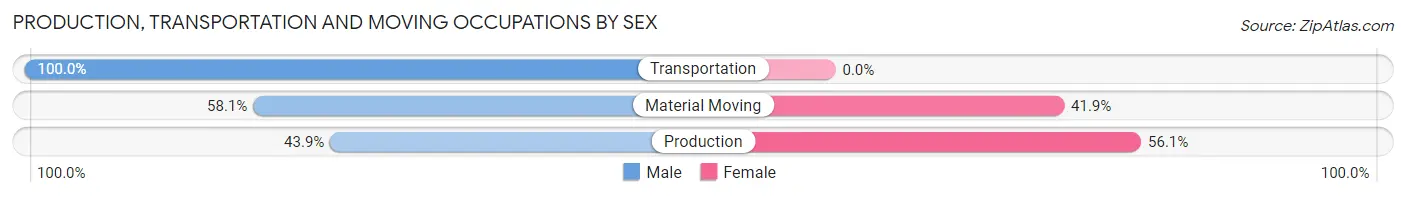
| Occupation | Male | Female |
| Production | 47 (43.9%) | 60 (56.1%) |
| Transportation | 15 (100.0%) | 0 (0.0%) |
| Material Moving | 36 (58.1%) | 26 (41.9%) |
| Total (Category) | 98 (53.3%) | 86 (46.7%) |
| Total (Overall) | 725 (52.7%) | 650 (47.3%) |
Employment Industries by Sex in Santa Isabel
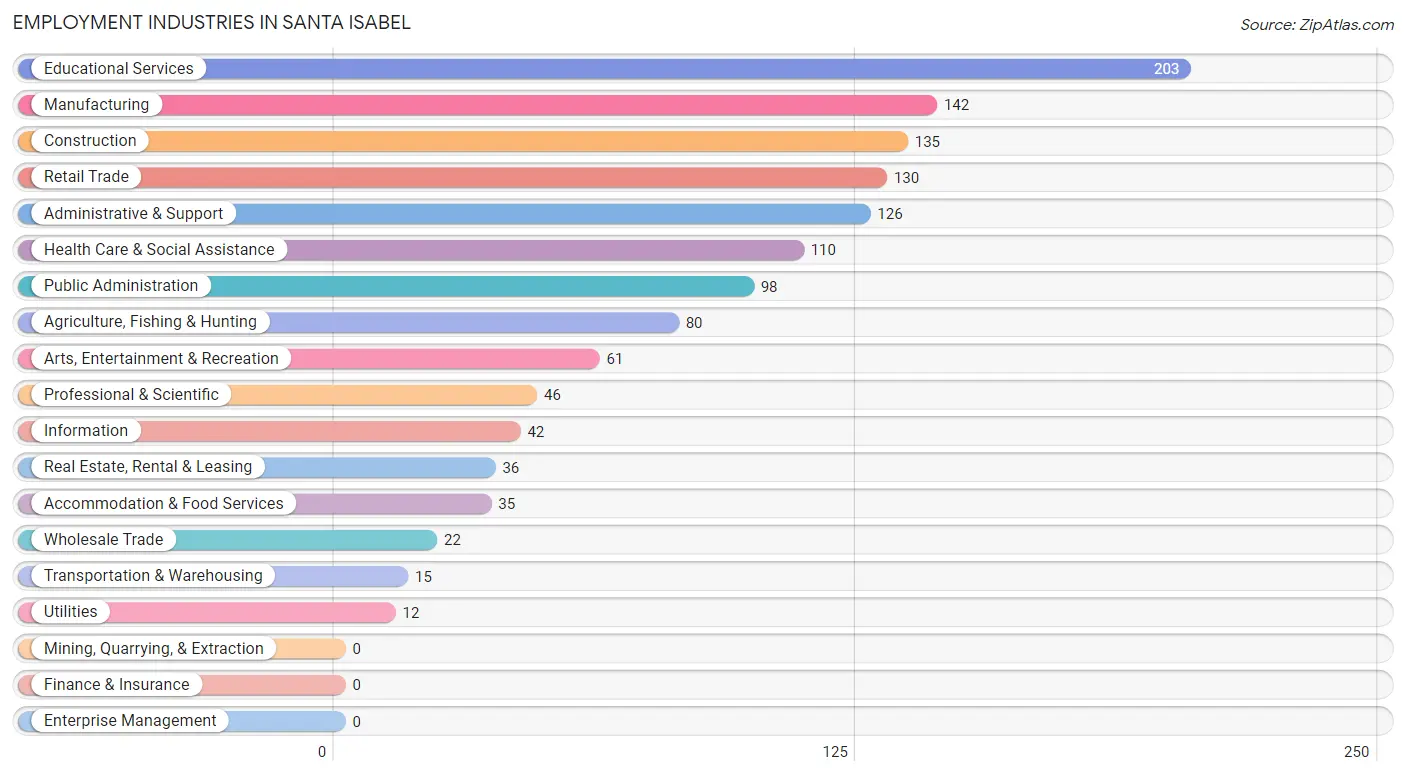
Employment Industries in Santa Isabel
The major employment industries in Santa Isabel include Educational Services (203 | 14.8%), Manufacturing (142 | 10.3%), Construction (135 | 9.8%), Retail Trade (130 | 9.5%), and Administrative & Support (126 | 9.2%).
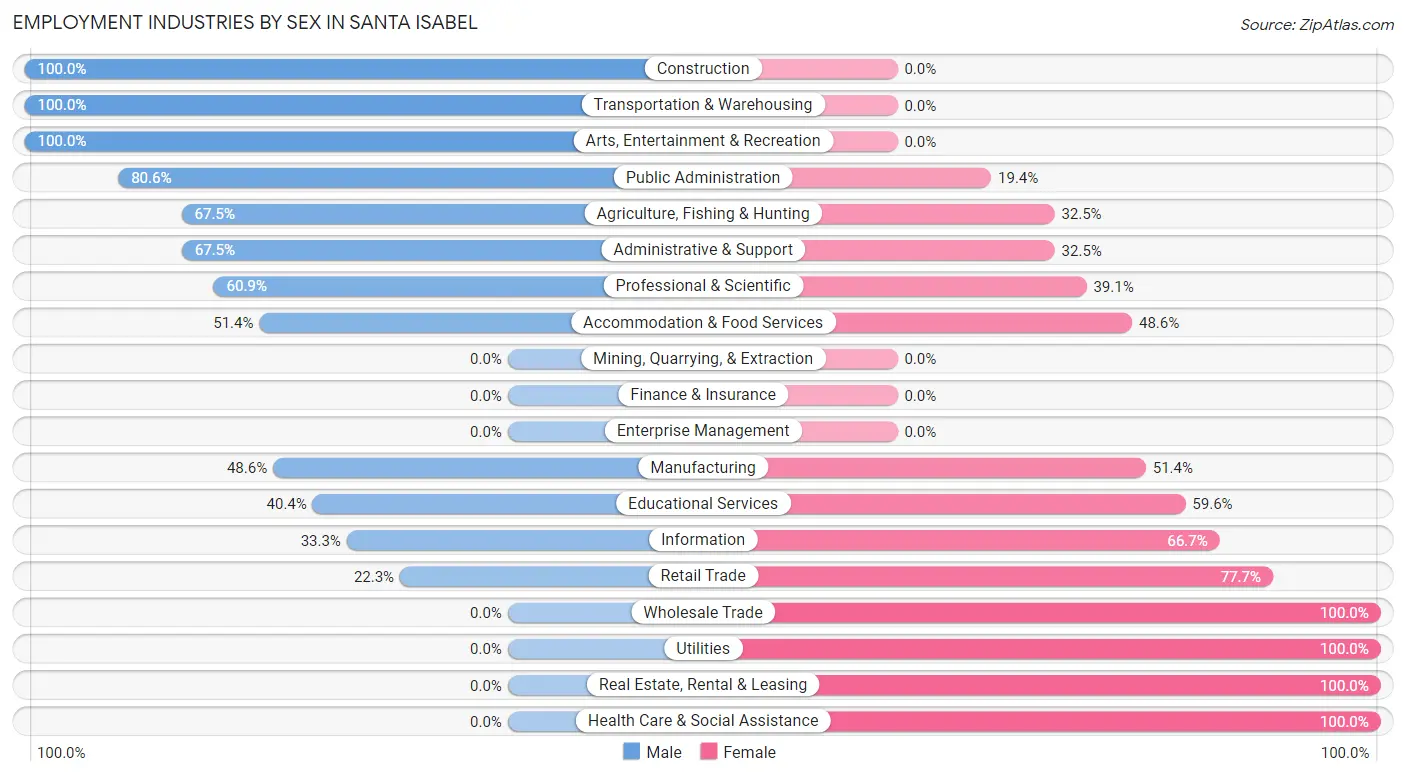
Employment Industries by Sex in Santa Isabel
The Santa Isabel industries that see more men than women are Construction (100.0%), Transportation & Warehousing (100.0%), and Arts, Entertainment & Recreation (100.0%), whereas the industries that tend to have a higher number of women are Wholesale Trade (100.0%), Utilities (100.0%), and Real Estate, Rental & Leasing (100.0%).
| Industry | Male | Female |
| Agriculture, Fishing & Hunting | 54 (67.5%) | 26 (32.5%) |
| Mining, Quarrying, & Extraction | 0 (0.0%) | 0 (0.0%) |
| Construction | 135 (100.0%) | 0 (0.0%) |
| Manufacturing | 69 (48.6%) | 73 (51.4%) |
| Wholesale Trade | 0 (0.0%) | 22 (100.0%) |
| Retail Trade | 29 (22.3%) | 101 (77.7%) |
| Transportation & Warehousing | 15 (100.0%) | 0 (0.0%) |
| Utilities | 0 (0.0%) | 12 (100.0%) |
| Information | 14 (33.3%) | 28 (66.7%) |
| Finance & Insurance | 0 (0.0%) | 0 (0.0%) |
| Real Estate, Rental & Leasing | 0 (0.0%) | 36 (100.0%) |
| Professional & Scientific | 28 (60.9%) | 18 (39.1%) |
| Enterprise Management | 0 (0.0%) | 0 (0.0%) |
| Administrative & Support | 85 (67.5%) | 41 (32.5%) |
| Educational Services | 82 (40.4%) | 121 (59.6%) |
| Health Care & Social Assistance | 0 (0.0%) | 110 (100.0%) |
| Arts, Entertainment & Recreation | 61 (100.0%) | 0 (0.0%) |
| Accommodation & Food Services | 18 (51.4%) | 17 (48.6%) |
| Public Administration | 79 (80.6%) | 19 (19.4%) |
| Total | 725 (52.7%) | 650 (47.3%) |
Education in Santa Isabel
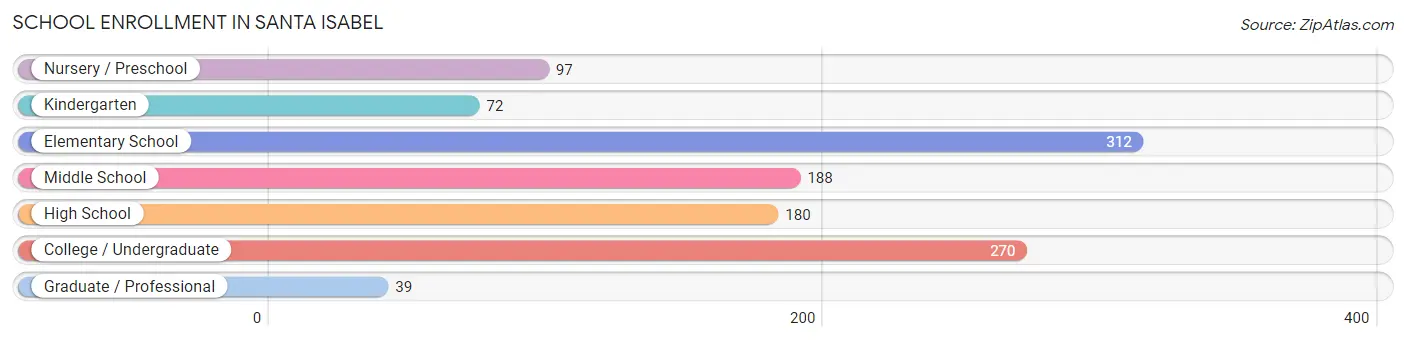
School Enrollment in Santa Isabel
The most common levels of schooling among the 1,158 students in Santa Isabel are elementary school (312 | 26.9%), college / undergraduate (270 | 23.3%), and middle school (188 | 16.2%).
| School Level | # Students | % Students |
| Nursery / Preschool | 97 | 8.4% |
| Kindergarten | 72 | 6.2% |
| Elementary School | 312 | 26.9% |
| Middle School | 188 | 16.2% |
| High School | 180 | 15.5% |
| College / Undergraduate | 270 | 23.3% |
| Graduate / Professional | 39 | 3.4% |
| Total | 1,158 | 100.0% |
School Enrollment by Age by Funding Source in Santa Isabel
Out of a total of 1,158 students who are enrolled in schools in Santa Isabel, 494 (42.7%) attend a private institution, while the remaining 664 (57.3%) are enrolled in public schools. The age group of 18 to 19 year olds has the highest likelihood of being enrolled in private schools, with 95 (100.0% in the age bracket) enrolled. Conversely, the age group of 3 to 4 year olds has the lowest likelihood of being enrolled in a private school, with 97 (100.0% in the age bracket) attending a public institution.
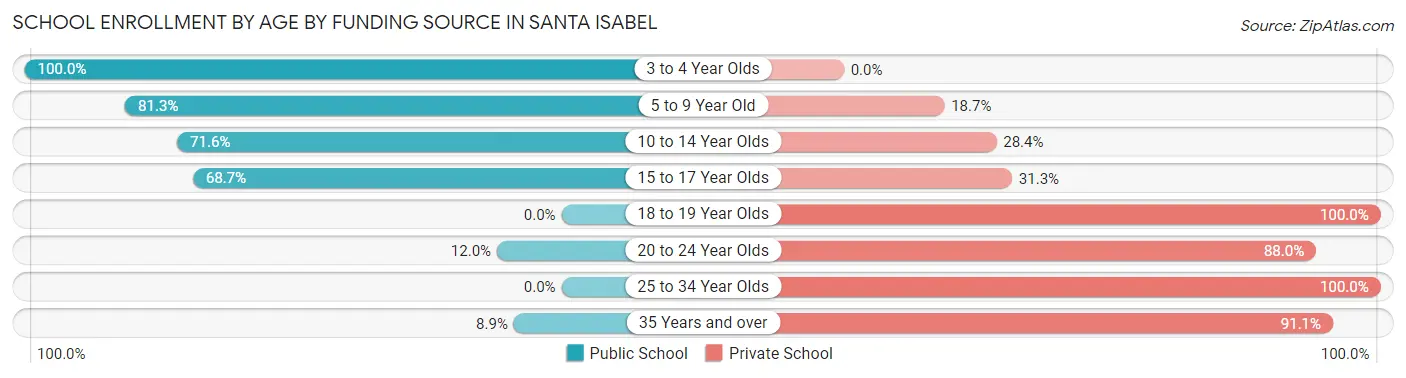
| Age Bracket | Public School | Private School |
| 3 to 4 Year Olds | 97 (100.0%) | 0 (0.0%) |
| 5 to 9 Year Old | 256 (81.3%) | 59 (18.7%) |
| 10 to 14 Year Olds | 199 (71.6%) | 79 (28.4%) |
| 15 to 17 Year Olds | 92 (68.7%) | 42 (31.3%) |
| 18 to 19 Year Olds | 0 (0.0%) | 95 (100.0%) |
| 20 to 24 Year Olds | 16 (12.0%) | 117 (88.0%) |
| 25 to 34 Year Olds | 0 (0.0%) | 61 (100.0%) |
| 35 Years and over | 4 (8.9%) | 41 (91.1%) |
| Total | 664 (57.3%) | 494 (42.7%) |
Educational Attainment by Field of Study in Santa Isabel
Education (226 | 26.2%), business (210 | 24.3%), arts & humanities (105 | 12.1%), physical & health sciences (89 | 10.3%), and communications (65 | 7.5%) are the most common fields of study among 864 individuals in Santa Isabel who have obtained a bachelor's degree or higher.
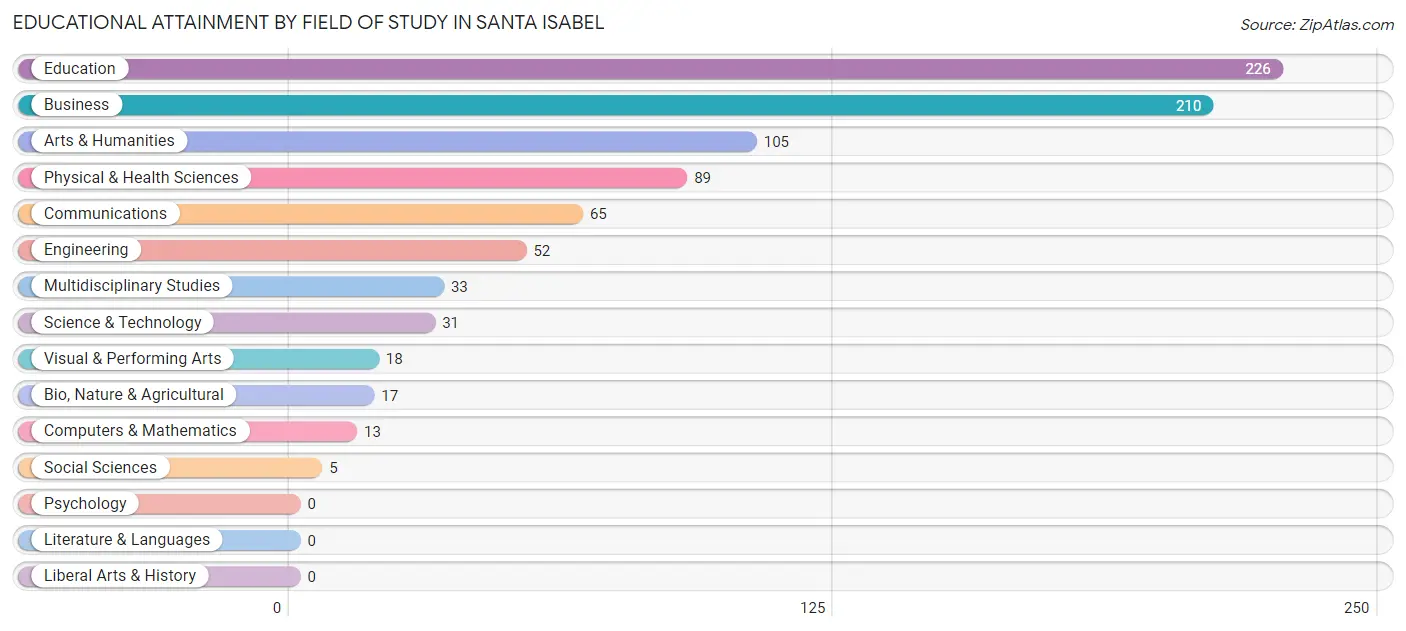
| Field of Study | # Graduates | % Graduates |
| Computers & Mathematics | 13 | 1.5% |
| Bio, Nature & Agricultural | 17 | 2.0% |
| Physical & Health Sciences | 89 | 10.3% |
| Psychology | 0 | 0.0% |
| Social Sciences | 5 | 0.6% |
| Engineering | 52 | 6.0% |
| Multidisciplinary Studies | 33 | 3.8% |
| Science & Technology | 31 | 3.6% |
| Business | 210 | 24.3% |
| Education | 226 | 26.2% |
| Literature & Languages | 0 | 0.0% |
| Liberal Arts & History | 0 | 0.0% |
| Visual & Performing Arts | 18 | 2.1% |
| Communications | 65 | 7.5% |
| Arts & Humanities | 105 | 12.1% |
| Total | 864 | 100.0% |
Transportation & Commute in Santa Isabel
Vehicle Availability by Sex in Santa Isabel
The most prevalent vehicle ownership categories in Santa Isabel are males with 2 vehicles (313, accounting for 48.4%) and females with 2 vehicles (291, making up 50.0%).
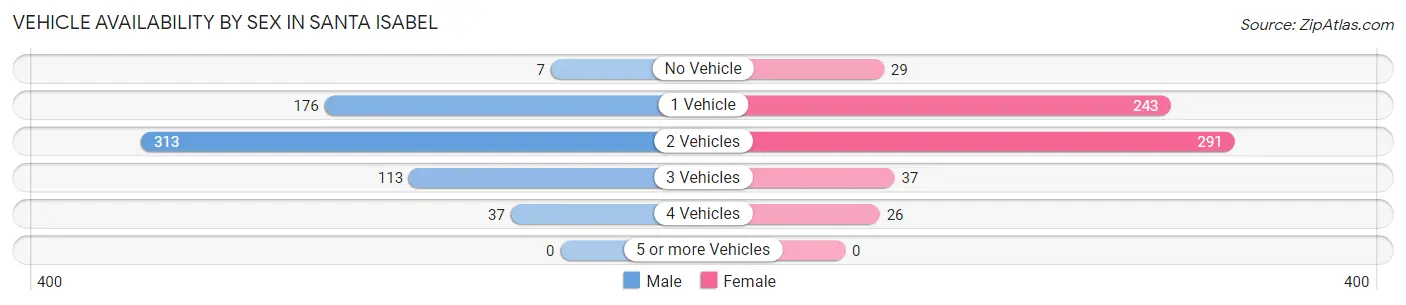
| Vehicles Available | Male | Female |
| No Vehicle | 7 (1.1%) | 29 (4.6%) |
| 1 Vehicle | 176 (27.2%) | 243 (38.8%) |
| 2 Vehicles | 313 (48.4%) | 291 (46.5%) |
| 3 Vehicles | 113 (17.5%) | 37 (5.9%) |
| 4 Vehicles | 37 (5.7%) | 26 (4.2%) |
| 5 or more Vehicles | 0 (0.0%) | 0 (0.0%) |
| Total | 646 (100.0%) | 626 (100.0%) |
Commute Time in Santa Isabel
The most frequently occuring commute durations in Santa Isabel are 5 to 9 minutes (287 commuters, 23.4%), 10 to 14 minutes (250 commuters, 20.4%), and 30 to 34 minutes (188 commuters, 15.4%).
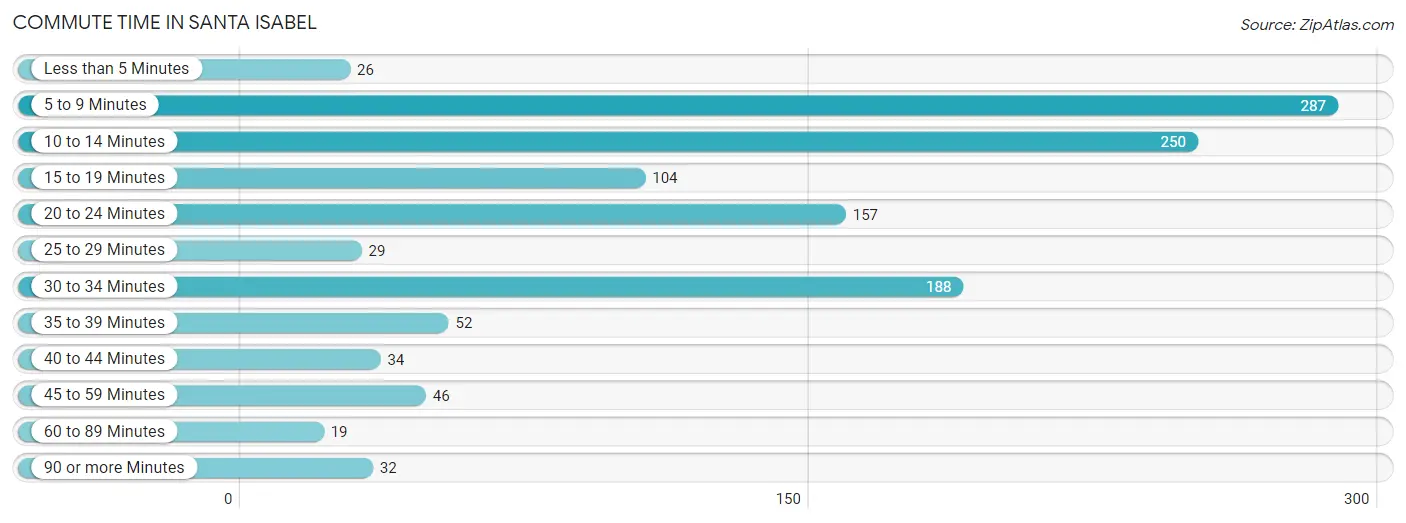
| Commute Time | # Commuters | % Commuters |
| Less than 5 Minutes | 26 | 2.1% |
| 5 to 9 Minutes | 287 | 23.4% |
| 10 to 14 Minutes | 250 | 20.4% |
| 15 to 19 Minutes | 104 | 8.5% |
| 20 to 24 Minutes | 157 | 12.8% |
| 25 to 29 Minutes | 29 | 2.4% |
| 30 to 34 Minutes | 188 | 15.4% |
| 35 to 39 Minutes | 52 | 4.3% |
| 40 to 44 Minutes | 34 | 2.8% |
| 45 to 59 Minutes | 46 | 3.8% |
| 60 to 89 Minutes | 19 | 1.5% |
| 90 or more Minutes | 32 | 2.6% |
Commute Time by Sex in Santa Isabel
The most common commute times in Santa Isabel are 5 to 9 minutes (228 commuters, 36.0%) for males and 20 to 24 minutes (129 commuters, 21.8%) for females.
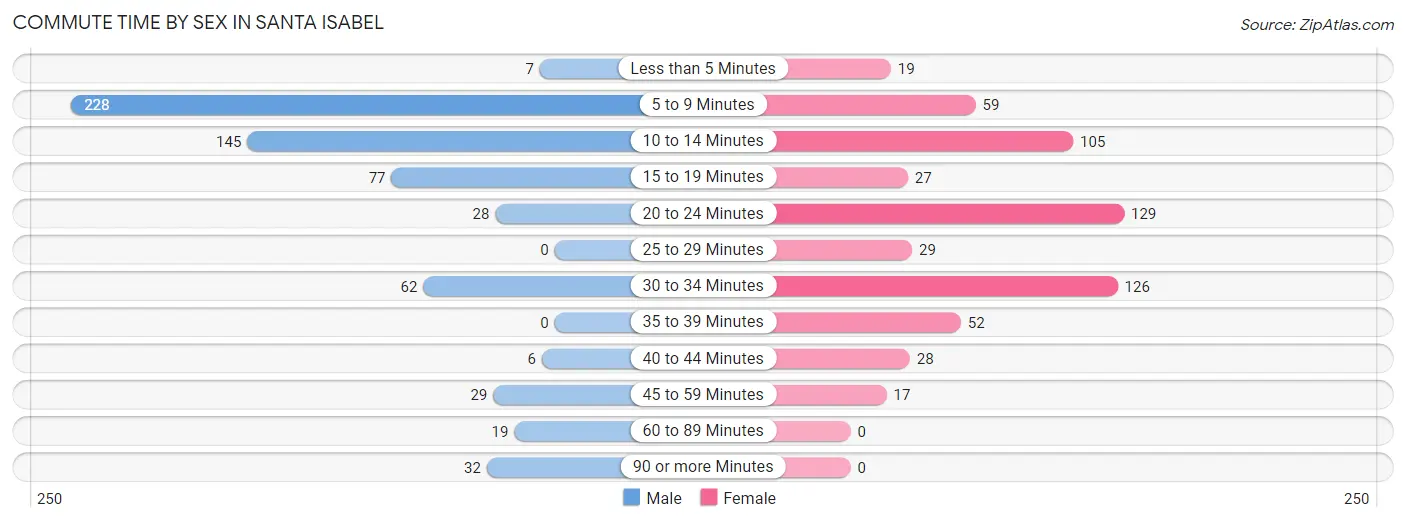
| Commute Time | Male | Female |
| Less than 5 Minutes | 7 (1.1%) | 19 (3.2%) |
| 5 to 9 Minutes | 228 (36.0%) | 59 (10.0%) |
| 10 to 14 Minutes | 145 (22.9%) | 105 (17.8%) |
| 15 to 19 Minutes | 77 (12.2%) | 27 (4.6%) |
| 20 to 24 Minutes | 28 (4.4%) | 129 (21.8%) |
| 25 to 29 Minutes | 0 (0.0%) | 29 (4.9%) |
| 30 to 34 Minutes | 62 (9.8%) | 126 (21.3%) |
| 35 to 39 Minutes | 0 (0.0%) | 52 (8.8%) |
| 40 to 44 Minutes | 6 (0.9%) | 28 (4.7%) |
| 45 to 59 Minutes | 29 (4.6%) | 17 (2.9%) |
| 60 to 89 Minutes | 19 (3.0%) | 0 (0.0%) |
| 90 or more Minutes | 32 (5.1%) | 0 (0.0%) |
Time of Departure to Work by Sex in Santa Isabel
The most frequent times of departure to work in Santa Isabel are 7:30 AM to 7:59 AM (182, 28.7%) for males and 7:30 AM to 7:59 AM (99, 16.8%) for females.
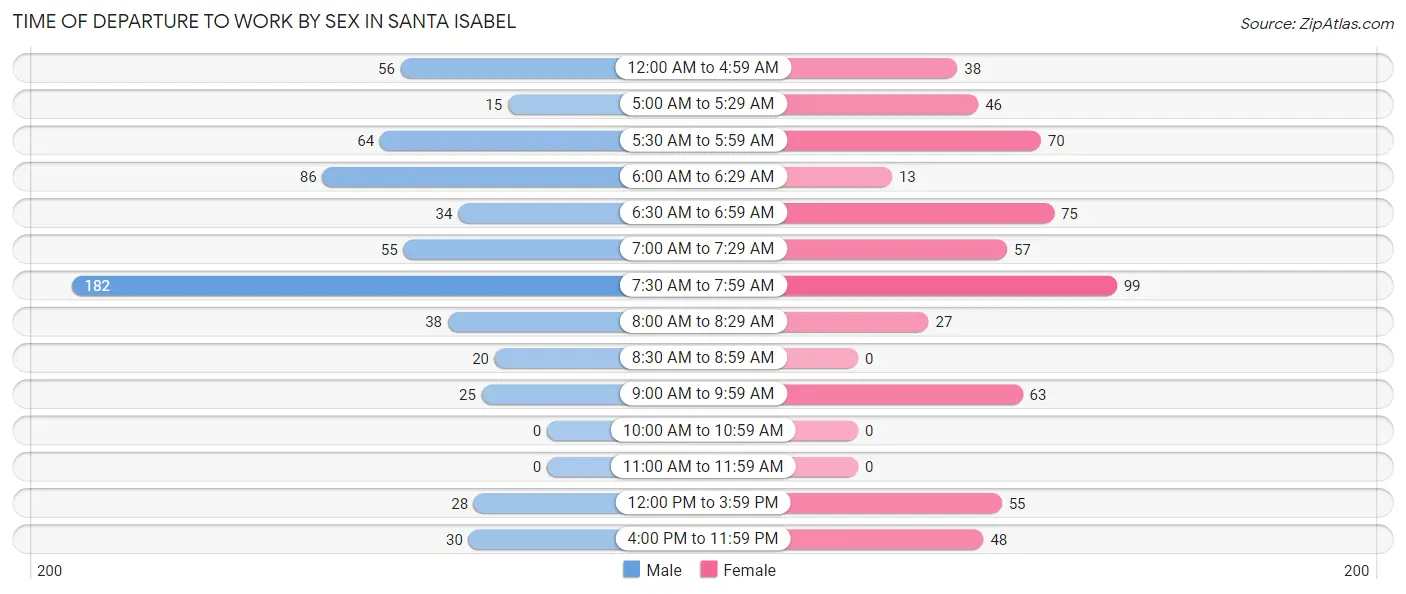
| Time of Departure | Male | Female |
| 12:00 AM to 4:59 AM | 56 (8.8%) | 38 (6.4%) |
| 5:00 AM to 5:29 AM | 15 (2.4%) | 46 (7.8%) |
| 5:30 AM to 5:59 AM | 64 (10.1%) | 70 (11.8%) |
| 6:00 AM to 6:29 AM | 86 (13.6%) | 13 (2.2%) |
| 6:30 AM to 6:59 AM | 34 (5.4%) | 75 (12.7%) |
| 7:00 AM to 7:29 AM | 55 (8.7%) | 57 (9.6%) |
| 7:30 AM to 7:59 AM | 182 (28.7%) | 99 (16.8%) |
| 8:00 AM to 8:29 AM | 38 (6.0%) | 27 (4.6%) |
| 8:30 AM to 8:59 AM | 20 (3.2%) | 0 (0.0%) |
| 9:00 AM to 9:59 AM | 25 (4.0%) | 63 (10.7%) |
| 10:00 AM to 10:59 AM | 0 (0.0%) | 0 (0.0%) |
| 11:00 AM to 11:59 AM | 0 (0.0%) | 0 (0.0%) |
| 12:00 PM to 3:59 PM | 28 (4.4%) | 55 (9.3%) |
| 4:00 PM to 11:59 PM | 30 (4.7%) | 48 (8.1%) |
| Total | 633 (100.0%) | 591 (100.0%) |
Housing Occupancy in Santa Isabel
Occupancy by Ownership in Santa Isabel
Of the total 2,009 dwellings in Santa Isabel, owner-occupied units account for 1,405 (69.9%), while renter-occupied units make up 604 (30.1%).
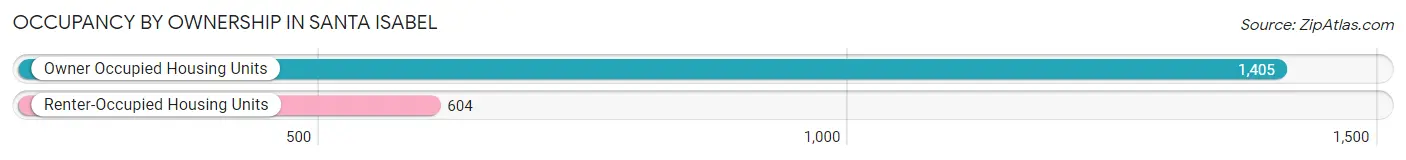
| Occupancy | # Housing Units | % Housing Units |
| Owner Occupied Housing Units | 1,405 | 69.9% |
| Renter-Occupied Housing Units | 604 | 30.1% |
| Total Occupied Housing Units | 2,009 | 100.0% |
Occupancy by Household Size in Santa Isabel
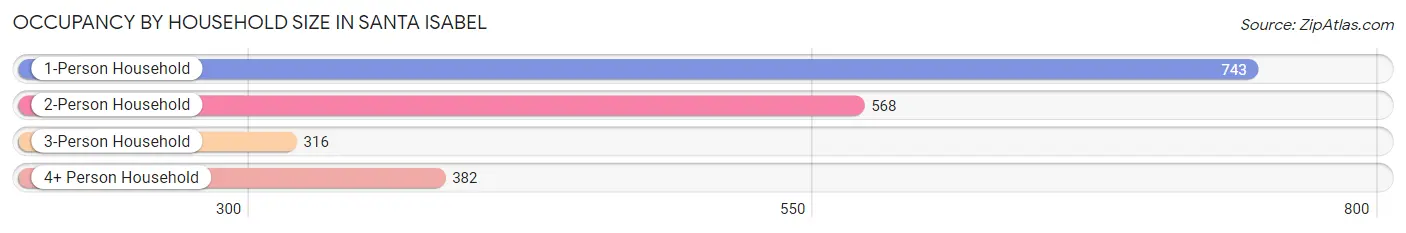
| Household Size | # Housing Units | % Housing Units |
| 1-Person Household | 743 | 37.0% |
| 2-Person Household | 568 | 28.3% |
| 3-Person Household | 316 | 15.7% |
| 4+ Person Household | 382 | 19.0% |
| Total Housing Units | 2,009 | 100.0% |
Occupancy by Ownership by Household Size in Santa Isabel
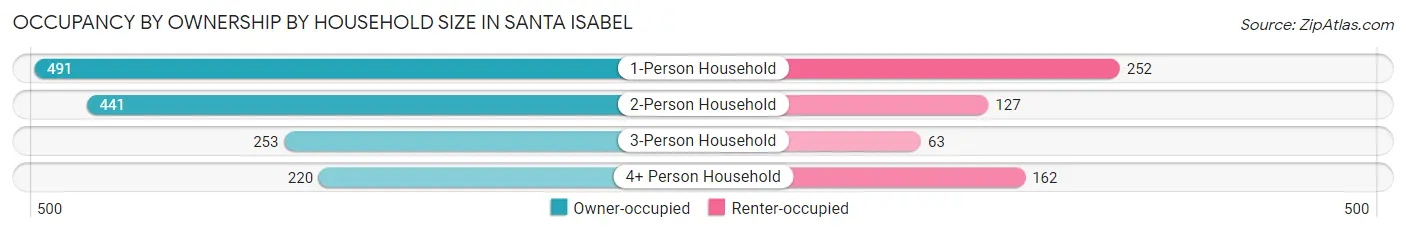
| Household Size | Owner-occupied | Renter-occupied |
| 1-Person Household | 491 (66.1%) | 252 (33.9%) |
| 2-Person Household | 441 (77.6%) | 127 (22.4%) |
| 3-Person Household | 253 (80.1%) | 63 (19.9%) |
| 4+ Person Household | 220 (57.6%) | 162 (42.4%) |
| Total Housing Units | 1,405 (69.9%) | 604 (30.1%) |
Occupancy by Educational Attainment in Santa Isabel
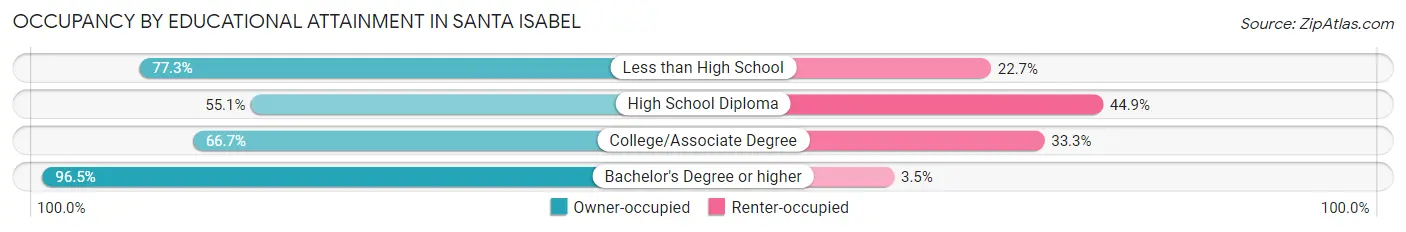
| Household Size | Owner-occupied | Renter-occupied |
| Less than High School | 282 (77.3%) | 83 (22.7%) |
| High School Diploma | 430 (55.1%) | 351 (44.9%) |
| College/Associate Degree | 312 (66.7%) | 156 (33.3%) |
| Bachelor's Degree or higher | 381 (96.5%) | 14 (3.5%) |
Occupancy by Age of Householder in Santa Isabel
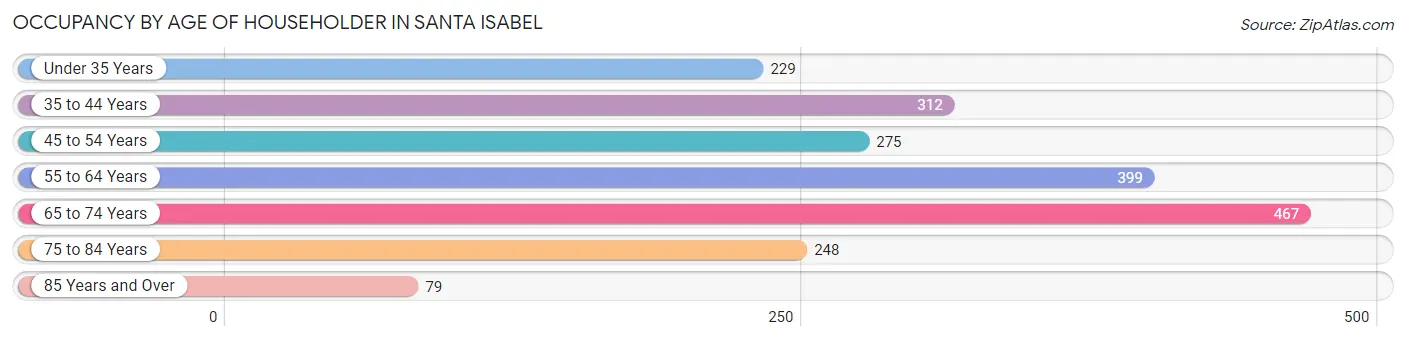
| Age Bracket | # Households | % Households |
| Under 35 Years | 229 | 11.4% |
| 35 to 44 Years | 312 | 15.5% |
| 45 to 54 Years | 275 | 13.7% |
| 55 to 64 Years | 399 | 19.9% |
| 65 to 74 Years | 467 | 23.3% |
| 75 to 84 Years | 248 | 12.3% |
| 85 Years and Over | 79 | 3.9% |
| Total | 2,009 | 100.0% |
Housing Finances in Santa Isabel
Median Income by Occupancy in Santa Isabel
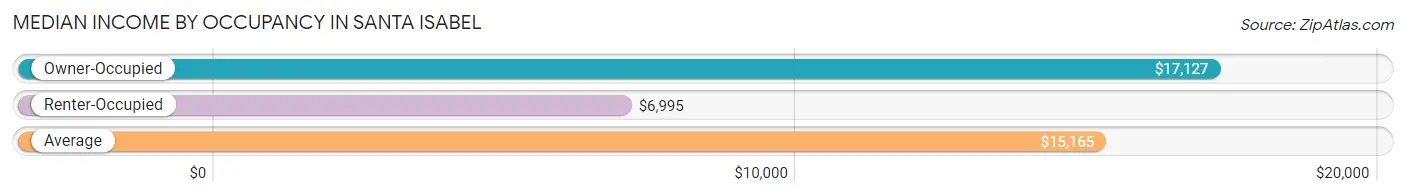
| Occupancy Type | # Households | Median Income |
| Owner-Occupied | 1,405 (69.9%) | $17,127 |
| Renter-Occupied | 604 (30.1%) | $6,995 |
| Average | 2,009 (100.0%) | $15,165 |
Occupancy by Householder Income Bracket in Santa Isabel
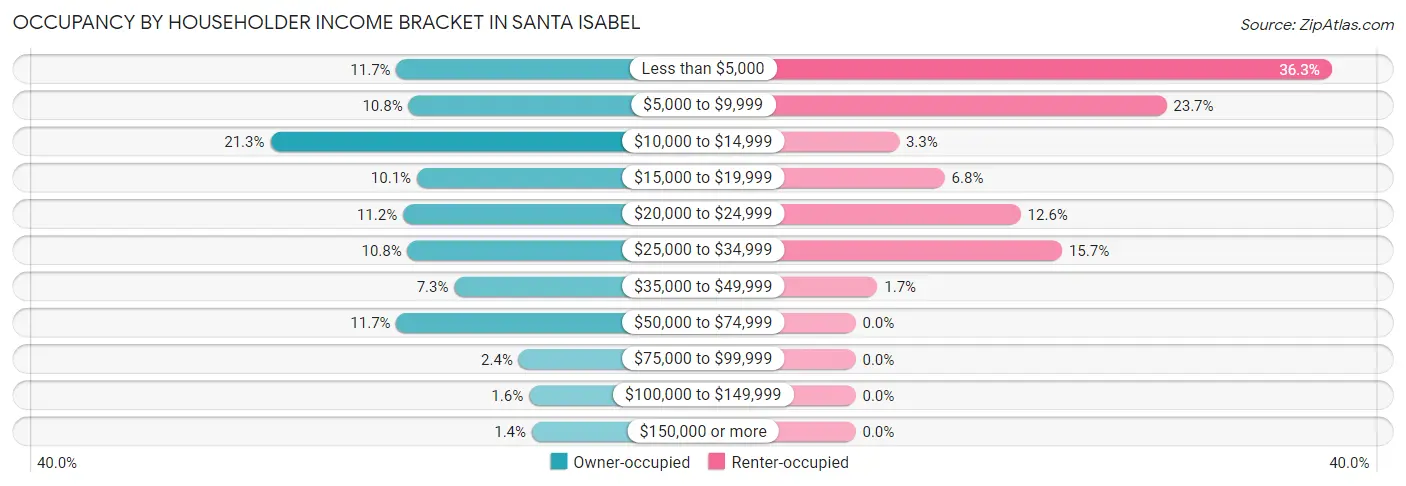
| Income Bracket | Owner-occupied | Renter-occupied |
| Less than $5,000 | 164 (11.7%) | 219 (36.3%) |
| $5,000 to $9,999 | 151 (10.7%) | 143 (23.7%) |
| $10,000 to $14,999 | 299 (21.3%) | 20 (3.3%) |
| $15,000 to $19,999 | 142 (10.1%) | 41 (6.8%) |
| $20,000 to $24,999 | 157 (11.2%) | 76 (12.6%) |
| $25,000 to $34,999 | 152 (10.8%) | 95 (15.7%) |
| $35,000 to $49,999 | 102 (7.3%) | 10 (1.7%) |
| $50,000 to $74,999 | 164 (11.7%) | 0 (0.0%) |
| $75,000 to $99,999 | 33 (2.4%) | 0 (0.0%) |
| $100,000 to $149,999 | 22 (1.6%) | 0 (0.0%) |
| $150,000 or more | 19 (1.3%) | 0 (0.0%) |
| Total | 1,405 (100.0%) | 604 (100.0%) |
Monthly Housing Cost Tiers in Santa Isabel
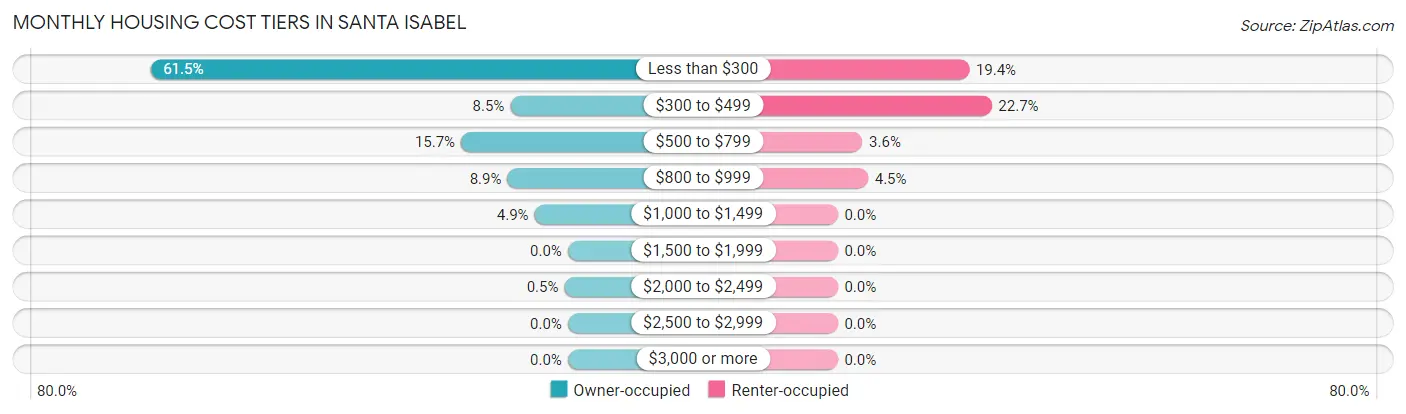
| Monthly Cost | Owner-occupied | Renter-occupied |
| Less than $300 | 864 (61.5%) | 117 (19.4%) |
| $300 to $499 | 119 (8.5%) | 137 (22.7%) |
| $500 to $799 | 221 (15.7%) | 22 (3.6%) |
| $800 to $999 | 125 (8.9%) | 27 (4.5%) |
| $1,000 to $1,499 | 69 (4.9%) | 0 (0.0%) |
| $1,500 to $1,999 | 0 (0.0%) | 0 (0.0%) |
| $2,000 to $2,499 | 7 (0.5%) | 0 (0.0%) |
| $2,500 to $2,999 | 0 (0.0%) | 0 (0.0%) |
| $3,000 or more | 0 (0.0%) | 0 (0.0%) |
| Total | 1,405 (100.0%) | 604 (100.0%) |
Physical Housing Characteristics in Santa Isabel
Housing Structures in Santa Isabel
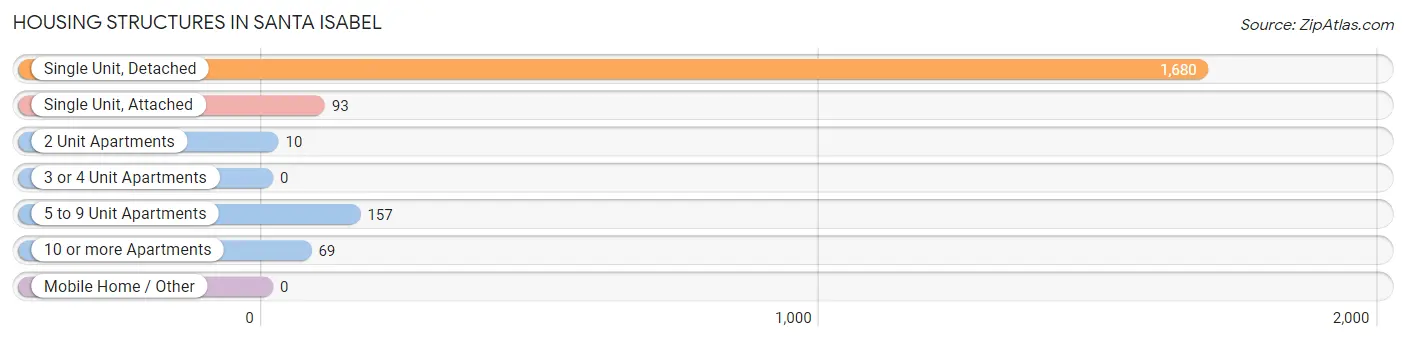
| Structure Type | # Housing Units | % Housing Units |
| Single Unit, Detached | 1,680 | 83.6% |
| Single Unit, Attached | 93 | 4.6% |
| 2 Unit Apartments | 10 | 0.5% |
| 3 or 4 Unit Apartments | 0 | 0.0% |
| 5 to 9 Unit Apartments | 157 | 7.8% |
| 10 or more Apartments | 69 | 3.4% |
| Mobile Home / Other | 0 | 0.0% |
| Total | 2,009 | 100.0% |
Housing Structures by Occupancy in Santa Isabel
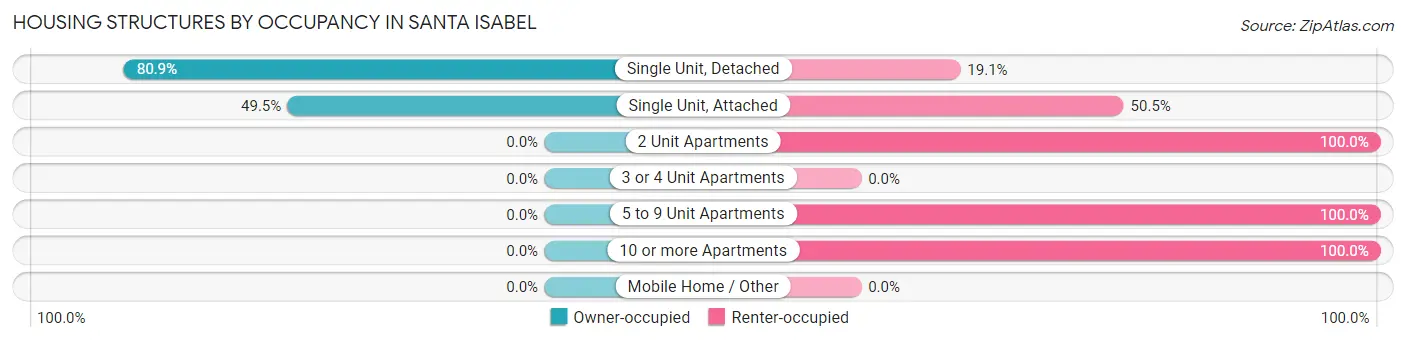
| Structure Type | Owner-occupied | Renter-occupied |
| Single Unit, Detached | 1,359 (80.9%) | 321 (19.1%) |
| Single Unit, Attached | 46 (49.5%) | 47 (50.5%) |
| 2 Unit Apartments | 0 (0.0%) | 10 (100.0%) |
| 3 or 4 Unit Apartments | 0 (0.0%) | 0 (0.0%) |
| 5 to 9 Unit Apartments | 0 (0.0%) | 157 (100.0%) |
| 10 or more Apartments | 0 (0.0%) | 69 (100.0%) |
| Mobile Home / Other | 0 (0.0%) | 0 (0.0%) |
| Total | 1,405 (69.9%) | 604 (30.1%) |
Housing Structures by Number of Rooms in Santa Isabel
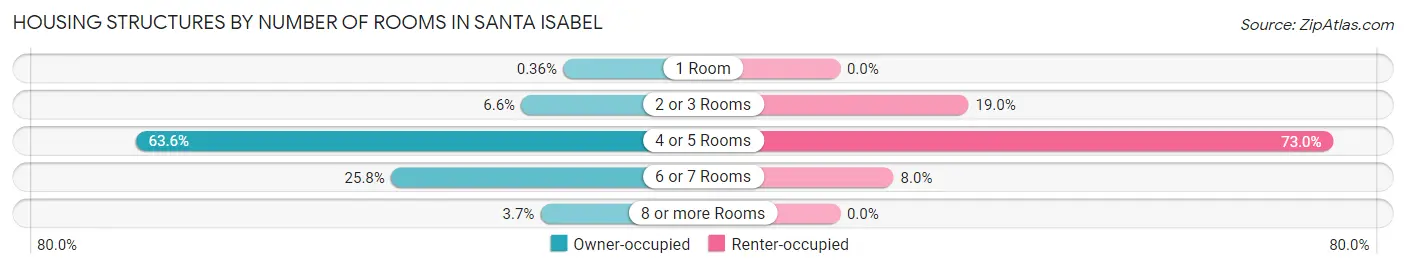
| Number of Rooms | Owner-occupied | Renter-occupied |
| 1 Room | 5 (0.4%) | 0 (0.0%) |
| 2 or 3 Rooms | 92 (6.6%) | 115 (19.0%) |
| 4 or 5 Rooms | 893 (63.6%) | 441 (73.0%) |
| 6 or 7 Rooms | 363 (25.8%) | 48 (8.0%) |
| 8 or more Rooms | 52 (3.7%) | 0 (0.0%) |
| Total | 1,405 (100.0%) | 604 (100.0%) |
Housing Structure by Heating Type in Santa Isabel
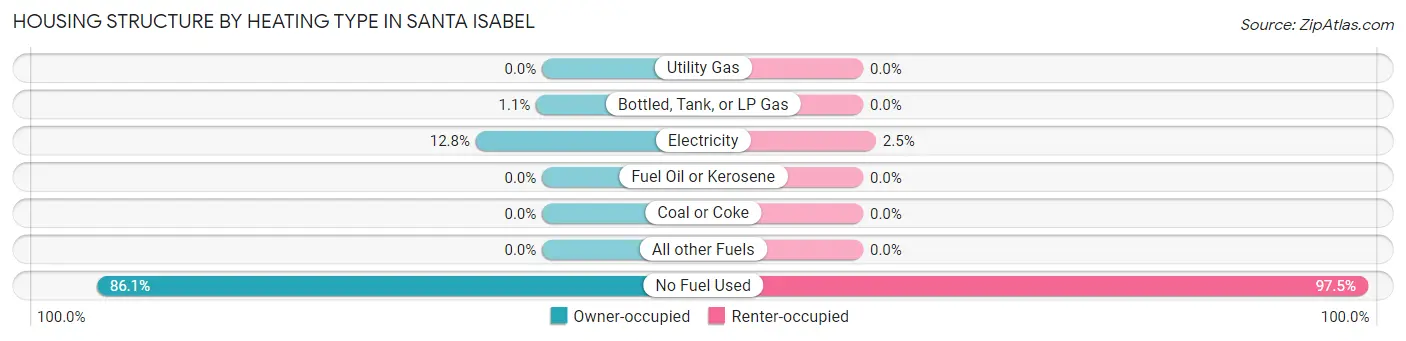
| Heating Type | Owner-occupied | Renter-occupied |
| Utility Gas | 0 (0.0%) | 0 (0.0%) |
| Bottled, Tank, or LP Gas | 16 (1.1%) | 0 (0.0%) |
| Electricity | 180 (12.8%) | 15 (2.5%) |
| Fuel Oil or Kerosene | 0 (0.0%) | 0 (0.0%) |
| Coal or Coke | 0 (0.0%) | 0 (0.0%) |
| All other Fuels | 0 (0.0%) | 0 (0.0%) |
| No Fuel Used | 1,209 (86.1%) | 589 (97.5%) |
| Total | 1,405 (100.0%) | 604 (100.0%) |
Household Vehicle Usage in Santa Isabel
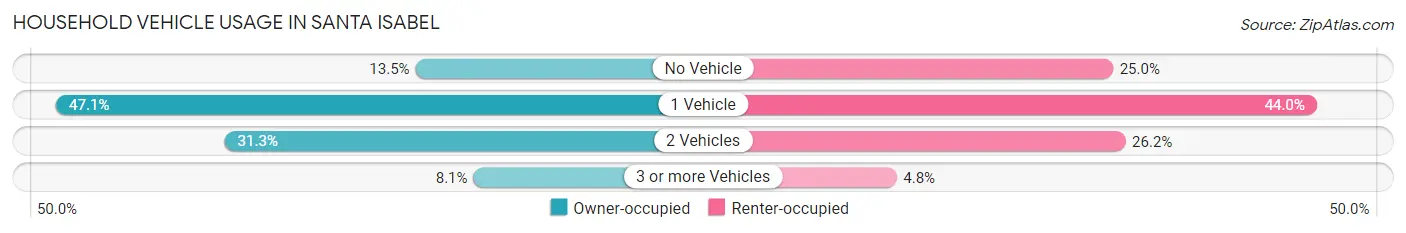
| Vehicles per Household | Owner-occupied | Renter-occupied |
| No Vehicle | 190 (13.5%) | 151 (25.0%) |
| 1 Vehicle | 661 (47.0%) | 266 (44.0%) |
| 2 Vehicles | 440 (31.3%) | 158 (26.2%) |
| 3 or more Vehicles | 114 (8.1%) | 29 (4.8%) |
| Total | 1,405 (100.0%) | 604 (100.0%) |
Real Estate & Mortgages in Santa Isabel
Real Estate and Mortgage Overview in Santa Isabel
| Characteristic | Without Mortgage | With Mortgage |
| Housing Units | 975 | 430 |
| Median Property Value | $95,700 | $108,700 |
| Median Household Income | $14,531 | $19 |
| Monthly Housing Costs | $146 | $0 |
| Real Estate Taxes | $199 | $430 |
Property Value by Mortgage Status in Santa Isabel
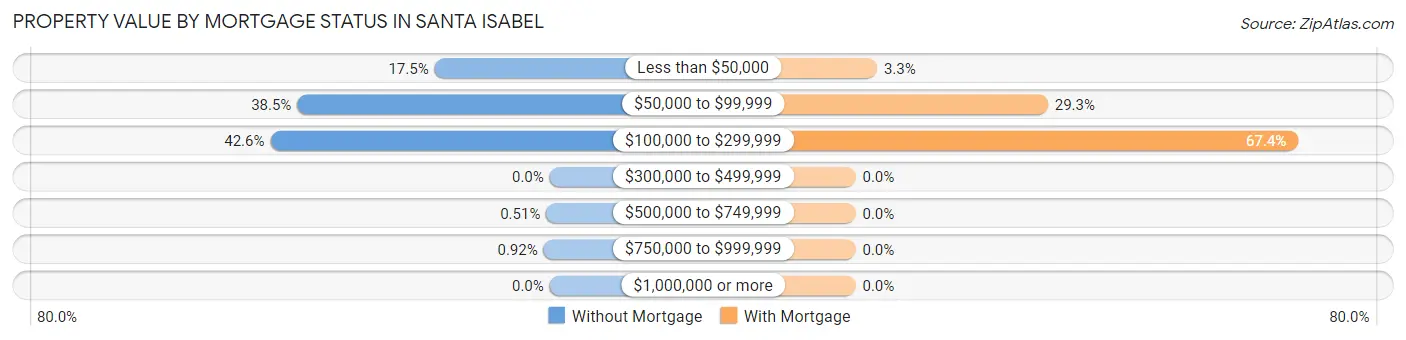
| Property Value | Without Mortgage | With Mortgage |
| Less than $50,000 | 171 (17.5%) | 14 (3.3%) |
| $50,000 to $99,999 | 375 (38.5%) | 126 (29.3%) |
| $100,000 to $299,999 | 415 (42.6%) | 290 (67.4%) |
| $300,000 to $499,999 | 0 (0.0%) | 0 (0.0%) |
| $500,000 to $749,999 | 5 (0.5%) | 0 (0.0%) |
| $750,000 to $999,999 | 9 (0.9%) | 0 (0.0%) |
| $1,000,000 or more | 0 (0.0%) | 0 (0.0%) |
| Total | 975 (100.0%) | 430 (100.0%) |
Household Income by Mortgage Status in Santa Isabel
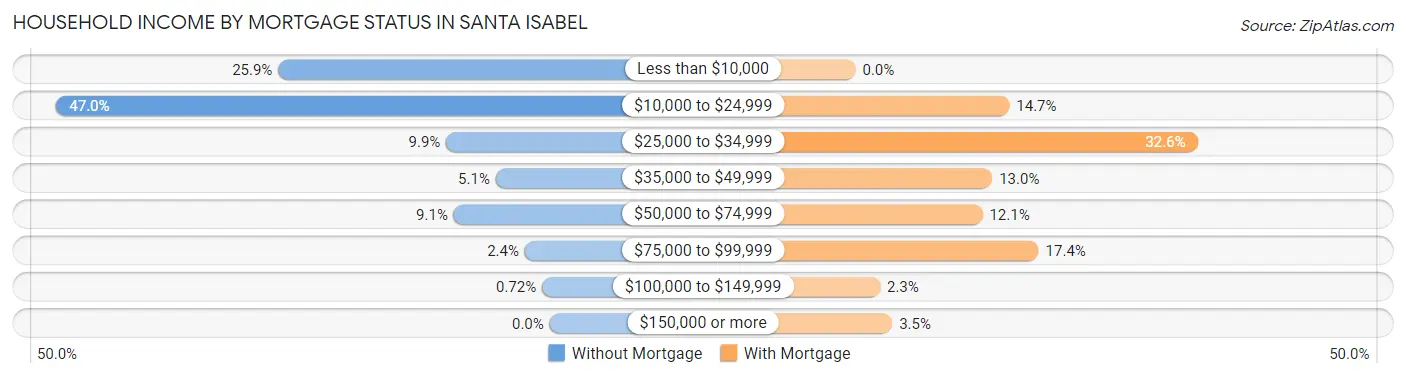
| Household Income | Without Mortgage | With Mortgage |
| Less than $10,000 | 252 (25.9%) | 0 (0.0%) |
| $10,000 to $24,999 | 458 (47.0%) | 63 (14.6%) |
| $25,000 to $34,999 | 96 (9.9%) | 140 (32.6%) |
| $35,000 to $49,999 | 50 (5.1%) | 56 (13.0%) |
| $50,000 to $74,999 | 89 (9.1%) | 52 (12.1%) |
| $75,000 to $99,999 | 23 (2.4%) | 75 (17.4%) |
| $100,000 to $149,999 | 7 (0.7%) | 10 (2.3%) |
| $150,000 or more | 0 (0.0%) | 15 (3.5%) |
| Total | 975 (100.0%) | 430 (100.0%) |
Property Value to Household Income Ratio in Santa Isabel
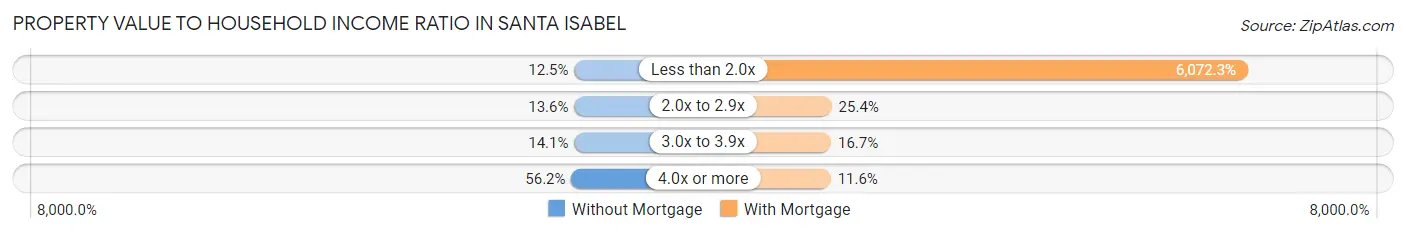
| Value-to-Income Ratio | Without Mortgage | With Mortgage |
| Less than 2.0x | 122 (12.5%) | 26,111 (6,072.3%) |
| 2.0x to 2.9x | 133 (13.6%) | 109 (25.4%) |
| 3.0x to 3.9x | 137 (14.1%) | 72 (16.7%) |
| 4.0x or more | 548 (56.2%) | 50 (11.6%) |
| Total | 975 (100.0%) | 430 (100.0%) |
Real Estate Taxes by Mortgage Status in Santa Isabel
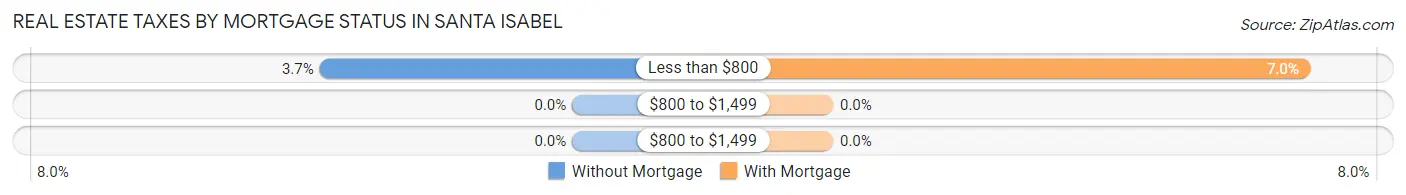
| Property Taxes | Without Mortgage | With Mortgage |
| Less than $800 | 36 (3.7%) | 30 (7.0%) |
| $800 to $1,499 | 0 (0.0%) | 0 (0.0%) |
| $800 to $1,499 | 0 (0.0%) | 0 (0.0%) |
| Total | 975 (100.0%) | 430 (100.0%) |
Health & Disability in Santa Isabel
Health Insurance Coverage by Age in Santa Isabel

| Age Bracket | With Coverage | Without Coverage |
| Under 6 Years | 314 (94.3%) | 19 (5.7%) |
| 6 to 18 Years | 798 (98.4%) | 13 (1.6%) |
| 19 to 25 Years | 411 (90.9%) | 41 (9.1%) |
| 26 to 34 Years | 448 (98.7%) | 6 (1.3%) |
| 35 to 44 Years | 662 (92.2%) | 56 (7.8%) |
| 45 to 54 Years | 578 (99.1%) | 5 (0.9%) |
| 55 to 64 Years | 550 (92.7%) | 43 (7.2%) |
| 65 to 74 Years | 699 (98.5%) | 11 (1.5%) |
| 75 Years and older | 479 (100.0%) | 0 (0.0%) |
| Total | 4,939 (96.2%) | 194 (3.8%) |
Health Insurance Coverage by Citizenship Status in Santa Isabel
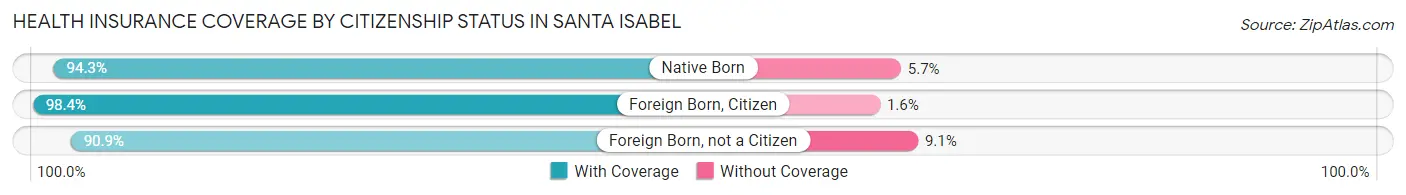
| Citizenship Status | With Coverage | Without Coverage |
| Native Born | 314 (94.3%) | 19 (5.7%) |
| Foreign Born, Citizen | 798 (98.4%) | 13 (1.6%) |
| Foreign Born, not a Citizen | 411 (90.9%) | 41 (9.1%) |
Health Insurance Coverage by Household Income in Santa Isabel
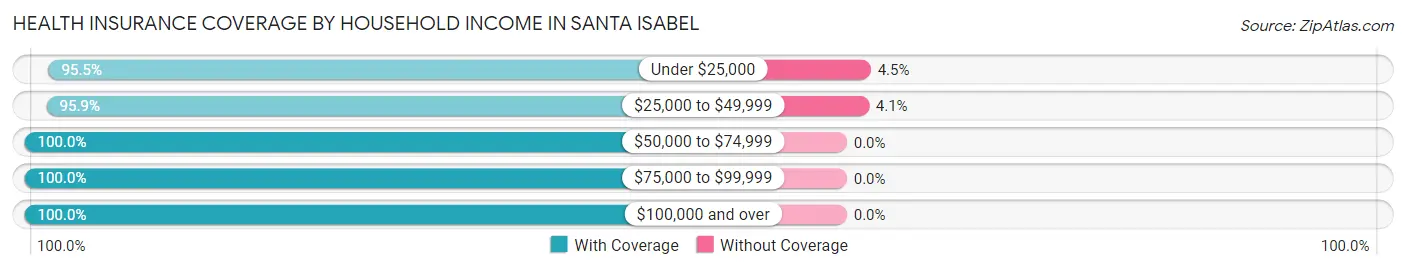
| Household Income | With Coverage | Without Coverage |
| Under $25,000 | 3,238 (95.5%) | 152 (4.5%) |
| $25,000 to $49,999 | 975 (95.9%) | 42 (4.1%) |
| $50,000 to $74,999 | 484 (100.0%) | 0 (0.0%) |
| $75,000 to $99,999 | 116 (100.0%) | 0 (0.0%) |
| $100,000 and over | 126 (100.0%) | 0 (0.0%) |
Public vs Private Health Insurance Coverage by Age in Santa Isabel
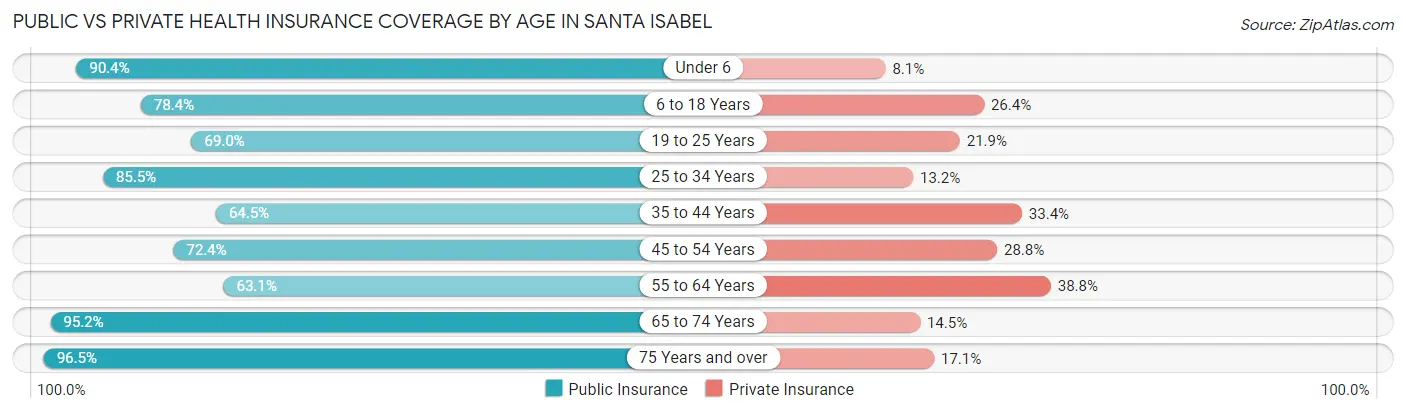
| Age Bracket | Public Insurance | Private Insurance |
| Under 6 | 301 (90.4%) | 27 (8.1%) |
| 6 to 18 Years | 636 (78.4%) | 214 (26.4%) |
| 19 to 25 Years | 312 (69.0%) | 99 (21.9%) |
| 25 to 34 Years | 388 (85.5%) | 60 (13.2%) |
| 35 to 44 Years | 463 (64.5%) | 240 (33.4%) |
| 45 to 54 Years | 422 (72.4%) | 168 (28.8%) |
| 55 to 64 Years | 374 (63.1%) | 230 (38.8%) |
| 65 to 74 Years | 676 (95.2%) | 103 (14.5%) |
| 75 Years and over | 462 (96.5%) | 82 (17.1%) |
| Total | 4,034 (78.6%) | 1,223 (23.8%) |
Disability Status by Sex by Age in Santa Isabel
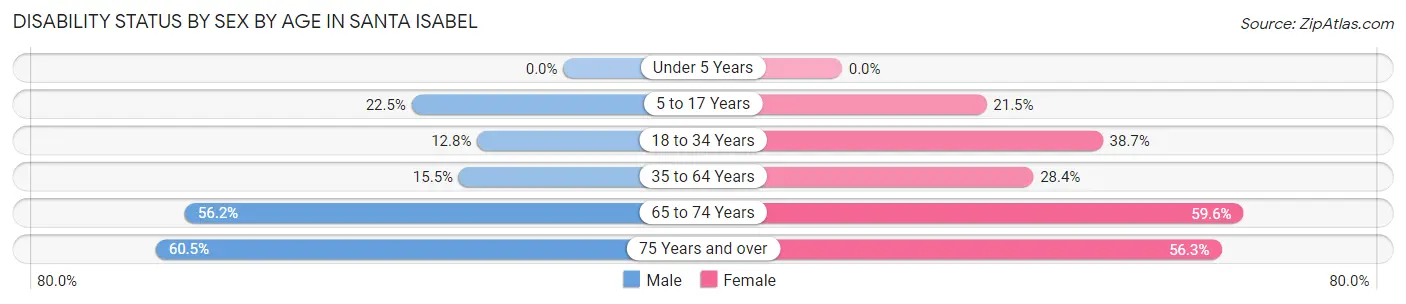
| Age Bracket | Male | Female |
| Under 5 Years | 0 (0.0%) | 0 (0.0%) |
| 5 to 17 Years | 91 (22.5%) | 79 (21.5%) |
| 18 to 34 Years | 61 (12.8%) | 201 (38.7%) |
| 35 to 64 Years | 136 (15.5%) | 289 (28.4%) |
| 65 to 74 Years | 186 (56.2%) | 226 (59.6%) |
| 75 Years and over | 118 (60.5%) | 160 (56.3%) |
Disability Class by Sex by Age in Santa Isabel
Disability Class: Hearing Difficulty
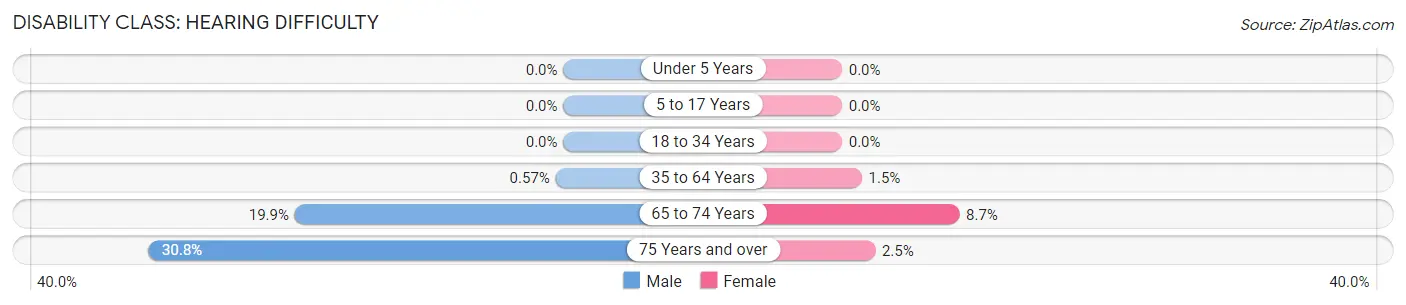
| Age Bracket | Male | Female |
| Under 5 Years | 0 (0.0%) | 0 (0.0%) |
| 5 to 17 Years | 0 (0.0%) | 0 (0.0%) |
| 18 to 34 Years | 0 (0.0%) | 0 (0.0%) |
| 35 to 64 Years | 5 (0.6%) | 15 (1.5%) |
| 65 to 74 Years | 66 (19.9%) | 33 (8.7%) |
| 75 Years and over | 60 (30.8%) | 7 (2.5%) |
Disability Class: Vision Difficulty
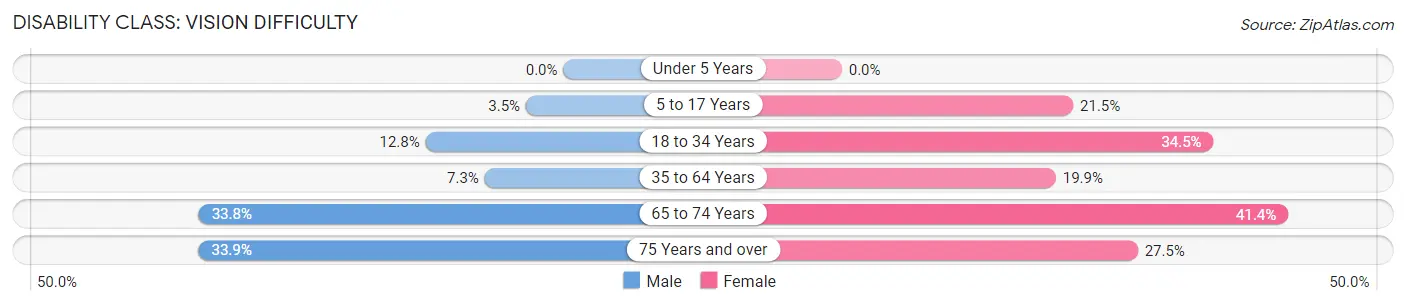
| Age Bracket | Male | Female |
| Under 5 Years | 0 (0.0%) | 0 (0.0%) |
| 5 to 17 Years | 14 (3.5%) | 79 (21.5%) |
| 18 to 34 Years | 61 (12.8%) | 179 (34.5%) |
| 35 to 64 Years | 64 (7.3%) | 202 (19.9%) |
| 65 to 74 Years | 112 (33.8%) | 157 (41.4%) |
| 75 Years and over | 66 (33.9%) | 78 (27.5%) |
Disability Class: Cognitive Difficulty
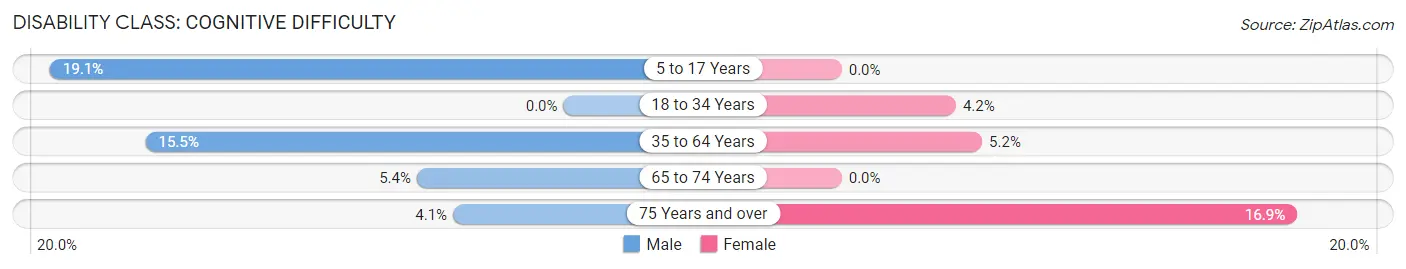
| Age Bracket | Male | Female |
| 5 to 17 Years | 77 (19.1%) | 0 (0.0%) |
| 18 to 34 Years | 0 (0.0%) | 22 (4.2%) |
| 35 to 64 Years | 136 (15.5%) | 53 (5.2%) |
| 65 to 74 Years | 18 (5.4%) | 0 (0.0%) |
| 75 Years and over | 8 (4.1%) | 48 (16.9%) |
Disability Class: Ambulatory Difficulty
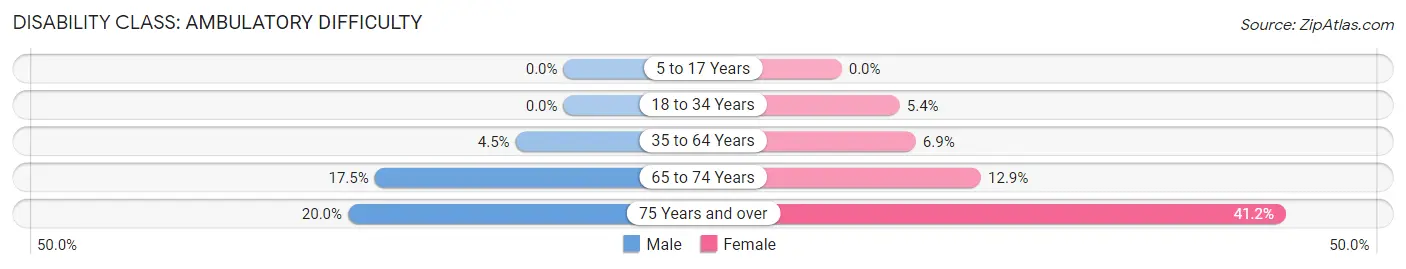
| Age Bracket | Male | Female |
| 5 to 17 Years | 0 (0.0%) | 0 (0.0%) |
| 18 to 34 Years | 0 (0.0%) | 28 (5.4%) |
| 35 to 64 Years | 39 (4.4%) | 70 (6.9%) |
| 65 to 74 Years | 58 (17.5%) | 49 (12.9%) |
| 75 Years and over | 39 (20.0%) | 117 (41.2%) |
Disability Class: Self-Care Difficulty
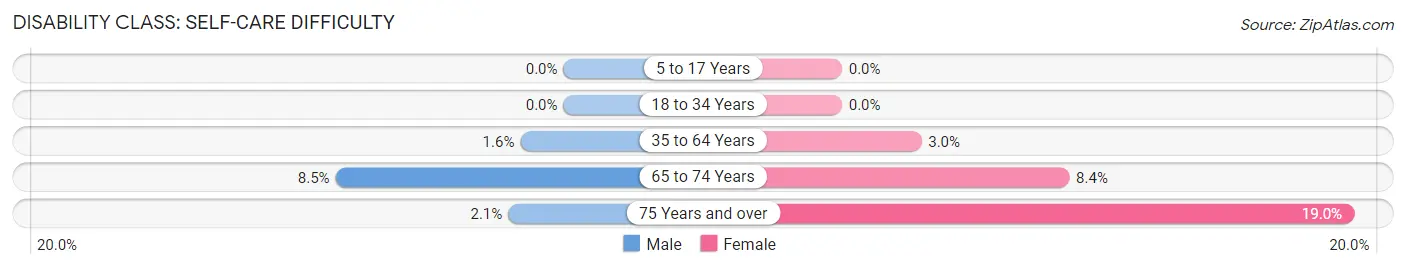
| Age Bracket | Male | Female |
| 5 to 17 Years | 0 (0.0%) | 0 (0.0%) |
| 18 to 34 Years | 0 (0.0%) | 0 (0.0%) |
| 35 to 64 Years | 14 (1.6%) | 30 (2.9%) |
| 65 to 74 Years | 28 (8.5%) | 32 (8.4%) |
| 75 Years and over | 4 (2.1%) | 54 (19.0%) |
Technology Access in Santa Isabel
Computing Device Access in Santa Isabel
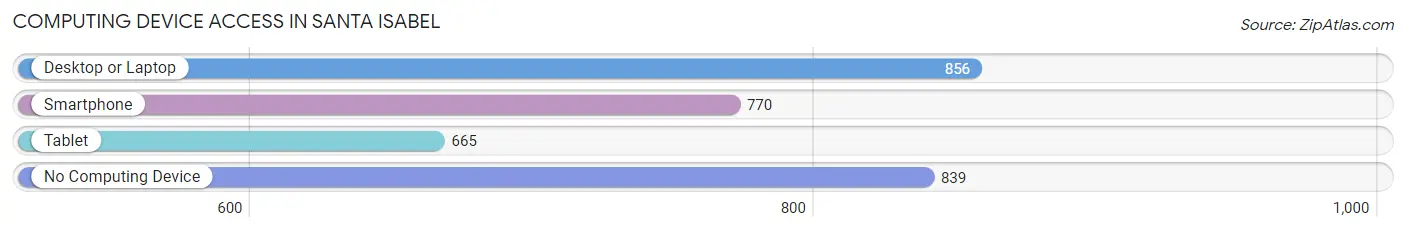
| Device Type | # Households | % Households |
| Desktop or Laptop | 856 | 42.6% |
| Smartphone | 770 | 38.3% |
| Tablet | 665 | 33.1% |
| No Computing Device | 839 | 41.8% |
| Total | 2,009 | 100.0% |
Internet Access in Santa Isabel
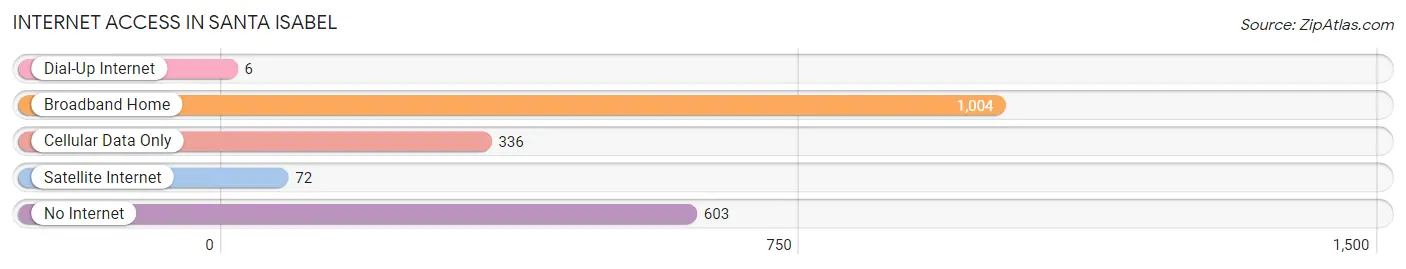
| Internet Type | # Households | % Households |
| Dial-Up Internet | 6 | 0.3% |
| Broadband Home | 1,004 | 50.0% |
| Cellular Data Only | 336 | 16.7% |
| Satellite Internet | 72 | 3.6% |
| No Internet | 603 | 30.0% |
| Total | 2,009 | 100.0% |
Santa Isabel Summary
History
Santa Isabel is a municipality located in the southern coast of Puerto Rico, in the region known as the Southern Coastal Plain. It is bordered by the municipalities of Salinas, Guayama, Patillas, and Arroyo. The municipality was founded in 1813 and is named after Queen Isabella of Castile.
Santa Isabel is known as the “City of the Three Flags” because it has been under the rule of three different countries: Spain, the United States, and Puerto Rico. The first settlers of the area were the Taino Indians, who were the original inhabitants of the island. The Spanish arrived in the 16th century and established a settlement in the area. During the 19th century, the area was part of the municipality of Salinas. In 1813, the area was separated from Salinas and became the municipality of Santa Isabel.
Geography
Santa Isabel is located in the southern coast of Puerto Rico, in the region known as the Southern Coastal Plain. It is bordered by the municipalities of Salinas, Guayama, Patillas, and Arroyo. The municipality covers an area of approximately 40 square miles and has a population of approximately 25,000 people.
The terrain of Santa Isabel is mostly flat, with some hills in the northern part of the municipality. The climate is tropical, with temperatures ranging from the mid-70s to the mid-80s. The average annual rainfall is approximately 60 inches.
Economy
The economy of Santa Isabel is mainly based on agriculture and tourism. The main agricultural products are sugarcane, coffee, and tobacco. The municipality also has a thriving fishing industry, with many of the local fishermen selling their catch in the local markets.
Tourism is also an important part of the economy of Santa Isabel. The municipality is home to several beaches, including Playa Santa Isabel, Playa de la Piedra, and Playa de los Cocos. There are also several historical sites in the area, such as the ruins of the old sugar mill, the old fort, and the old church.
Demographics
As of the 2010 census, the population of Santa Isabel was 24,945. The population is mostly of Hispanic origin, with a small percentage of African-American and other ethnicities. The median age of the population is 38.5 years, and the median household income is $17,845.
The majority of the population is Roman Catholic, with a small percentage of other religious affiliations. The official language of the municipality is Spanish, although English is also spoken.
Conclusion
Santa Isabel is a municipality located in the southern coast of Puerto Rico, in the region known as the Southern Coastal Plain. It is bordered by the municipalities of Salinas, Guayama, Patillas, and Arroyo. The municipality was founded in 1813 and is known as the “City of the Three Flags” because it has been under the rule of three different countries: Spain, the United States, and Puerto Rico. The economy of Santa Isabel is mainly based on agriculture and tourism, and the population is mostly of Hispanic origin. Santa Isabel is a vibrant municipality with a rich history and culture.
Common Questions
What is Per Capita Income in Santa Isabel?
Per Capita income in Santa Isabel is $10,119.
What is the Median Family Income in Santa Isabel?
Median Family Income in Santa Isabel is $20,833.
What is the Median Household income in Santa Isabel?
Median Household Income in Santa Isabel is $15,165.
What is Income or Wage Gap in Santa Isabel?
Income or Wage Gap in Santa Isabel is 27.7%.
Women in Santa Isabel earn 72.3 cents for every dollar earned by a man.
What is Inequality or Gini Index in Santa Isabel?
Inequality or Gini Index in Santa Isabel is 0.53.
What is the Total Population of Santa Isabel?
Total Population of Santa Isabel is 5,133.
What is the Total Male Population of Santa Isabel?
Total Male Population of Santa Isabel is 2,391.
What is the Total Female Population of Santa Isabel?
Total Female Population of Santa Isabel is 2,742.
What is the Ratio of Males per 100 Females in Santa Isabel?
There are 87.20 Males per 100 Females in Santa Isabel.
What is the Ratio of Females per 100 Males in Santa Isabel?
There are 114.68 Females per 100 Males in Santa Isabel.
What is the Median Population Age in Santa Isabel?
Median Population Age in Santa Isabel is 42.5 Years.
What is the Average Family Size in Santa Isabel
Average Family Size in Santa Isabel is 3.4 People.
What is the Average Household Size in Santa Isabel
Average Household Size in Santa Isabel is 2.6 People.
How Large is the Labor Force in Santa Isabel?
There are 1,550 People in the Labor Forcein in Santa Isabel.
What is the Percentage of People in the Labor Force in Santa Isabel?
36.7% of People are in the Labor Force in Santa Isabel.
What is the Unemployment Rate in Santa Isabel?
Unemployment Rate in Santa Isabel is 11.2%.