H Rivera Colon, PR Map & Demographics
H Rivera Colon Overview
$11,305
PER CAPITA INCOME
$28,125
AVG FAMILY INCOME
$15,697
AVG HOUSEHOLD INCOME
22.7%
WAGE / INCOME GAP [ % ]
77.3¢/ $1
WAGE / INCOME GAP [ $ ]
$5,950
FAMILY INCOME DEFICIT
0.48
INEQUALITY / GINI INDEX
1,969
TOTAL POPULATION
1,009
MALE POPULATION
960
FEMALE POPULATION
105.10
MALES / 100 FEMALES
95.14
FEMALES / 100 MALES
56.1
MEDIAN AGE
3.4
AVG FAMILY SIZE
2.3
AVG HOUSEHOLD SIZE
582
LABOR FORCE [ PEOPLE ]
32.5%
PERCENT IN LABOR FORCE
7.1%
UNEMPLOYMENT RATE
Income in H Rivera Colon
Income Overview in H Rivera Colon
Per Capita Income in H Rivera Colon is $11,305, while median incomes of families and households are $28,125 and $15,697 respectively.
| Characteristic | Number | Measure |
| Per Capita Income | 1,969 | $11,305 |
| Median Family Income | 424 | $28,125 |
| Mean Family Income | 424 | $35,159 |
| Median Household Income | 851 | $15,697 |
| Mean Household Income | 851 | $22,574 |
| Income Deficit | 424 | $5,950 |
| Wage / Income Gap (%) | 1,969 | 22.71% |
| Wage / Income Gap ($) | 1,969 | 77.29¢ per $1 |
| Gini / Inequality Index | 1,969 | 0.48 |
Earnings by Sex in H Rivera Colon
Average Earnings in H Rivera Colon are $22,965, $26,184 for men and $20,238 for women, a difference of 22.7%.
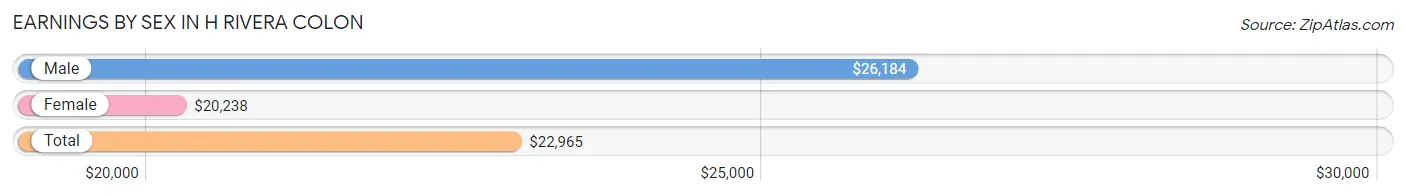
| Sex | Number | Average Earnings |
| Male | 252 (46.7%) | $26,184 |
| Female | 288 (53.3%) | $20,238 |
| Total | 540 (100.0%) | $22,965 |
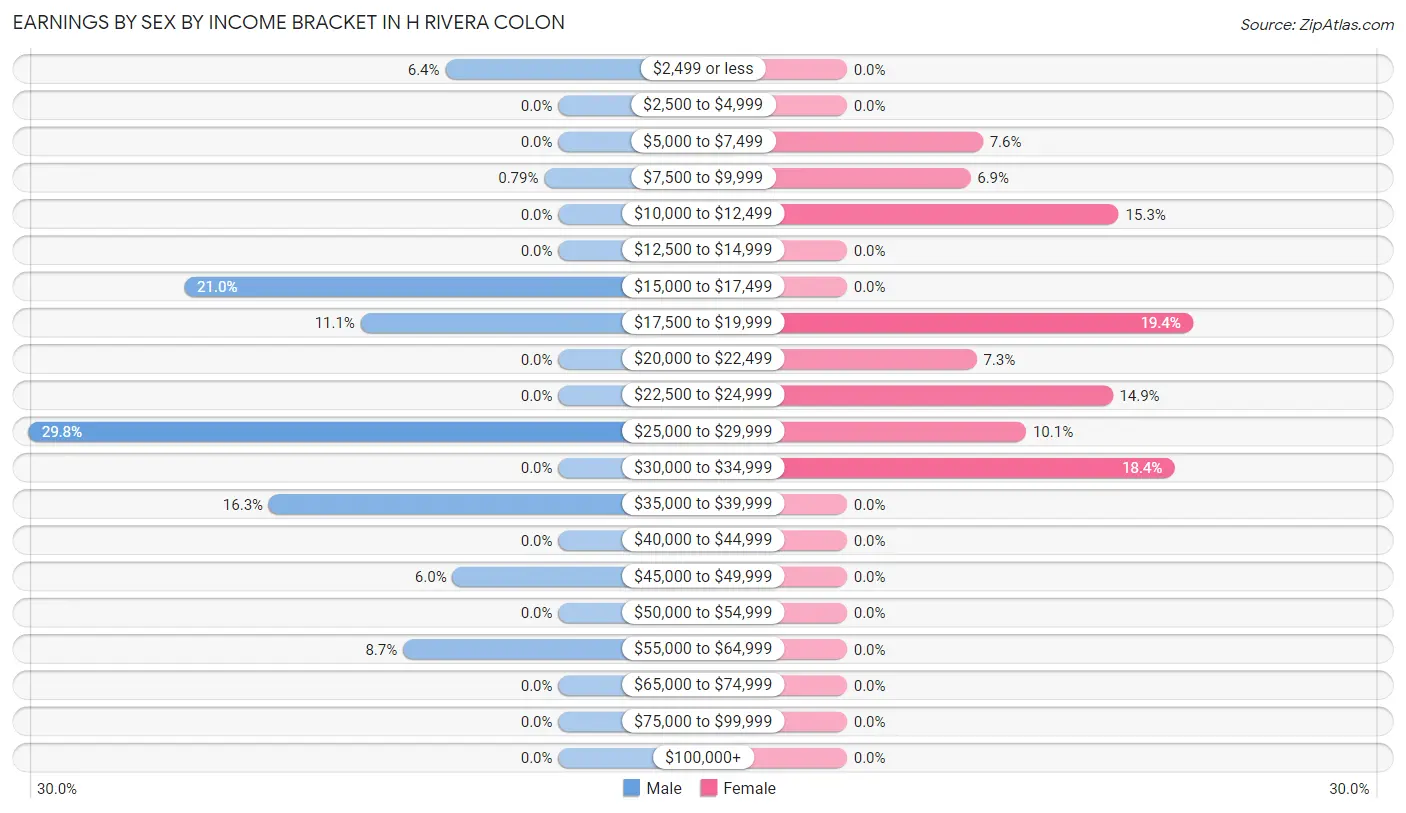
Earnings by Sex by Income Bracket in H Rivera Colon
The most common earnings brackets in H Rivera Colon are $25,000 to $29,999 for men (75 | 29.8%) and $17,500 to $19,999 for women (56 | 19.4%).
| Income | Male | Female |
| $2,499 or less | 16 (6.4%) | 0 (0.0%) |
| $2,500 to $4,999 | 0 (0.0%) | 0 (0.0%) |
| $5,000 to $7,499 | 0 (0.0%) | 22 (7.6%) |
| $7,500 to $9,999 | 2 (0.8%) | 20 (6.9%) |
| $10,000 to $12,499 | 0 (0.0%) | 44 (15.3%) |
| $12,500 to $14,999 | 0 (0.0%) | 0 (0.0%) |
| $15,000 to $17,499 | 53 (21.0%) | 0 (0.0%) |
| $17,500 to $19,999 | 28 (11.1%) | 56 (19.4%) |
| $20,000 to $22,499 | 0 (0.0%) | 21 (7.3%) |
| $22,500 to $24,999 | 0 (0.0%) | 43 (14.9%) |
| $25,000 to $29,999 | 75 (29.8%) | 29 (10.1%) |
| $30,000 to $34,999 | 0 (0.0%) | 53 (18.4%) |
| $35,000 to $39,999 | 41 (16.3%) | 0 (0.0%) |
| $40,000 to $44,999 | 0 (0.0%) | 0 (0.0%) |
| $45,000 to $49,999 | 15 (5.9%) | 0 (0.0%) |
| $50,000 to $54,999 | 0 (0.0%) | 0 (0.0%) |
| $55,000 to $64,999 | 22 (8.7%) | 0 (0.0%) |
| $65,000 to $74,999 | 0 (0.0%) | 0 (0.0%) |
| $75,000 to $99,999 | 0 (0.0%) | 0 (0.0%) |
| $100,000+ | 0 (0.0%) | 0 (0.0%) |
| Total | 252 (100.0%) | 288 (100.0%) |
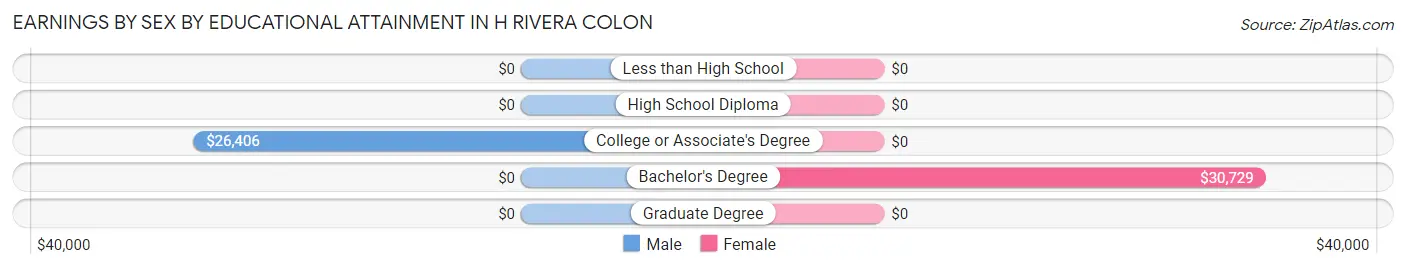
Earnings by Sex by Educational Attainment in H Rivera Colon
Average earnings in H Rivera Colon are $26,228 for men and $19,442 for women, a difference of 25.9%. Men with an educational attainment of college or associate's degree enjoy the highest average annual earnings of $26,406, while those with college or associate's degree education earn the least with $26,406. Women with an educational attainment of bachelor's degree earn the most with the average annual earnings of $30,729, while those with bachelor's degree education have the smallest earnings of $30,729.
| Educational Attainment | Male Income | Female Income |
| Less than High School | - | - |
| High School Diploma | - | - |
| College or Associate's Degree | $26,406 | $0 |
| Bachelor's Degree | - | - |
| Graduate Degree | - | - |
| Total | $26,228 | $19,442 |
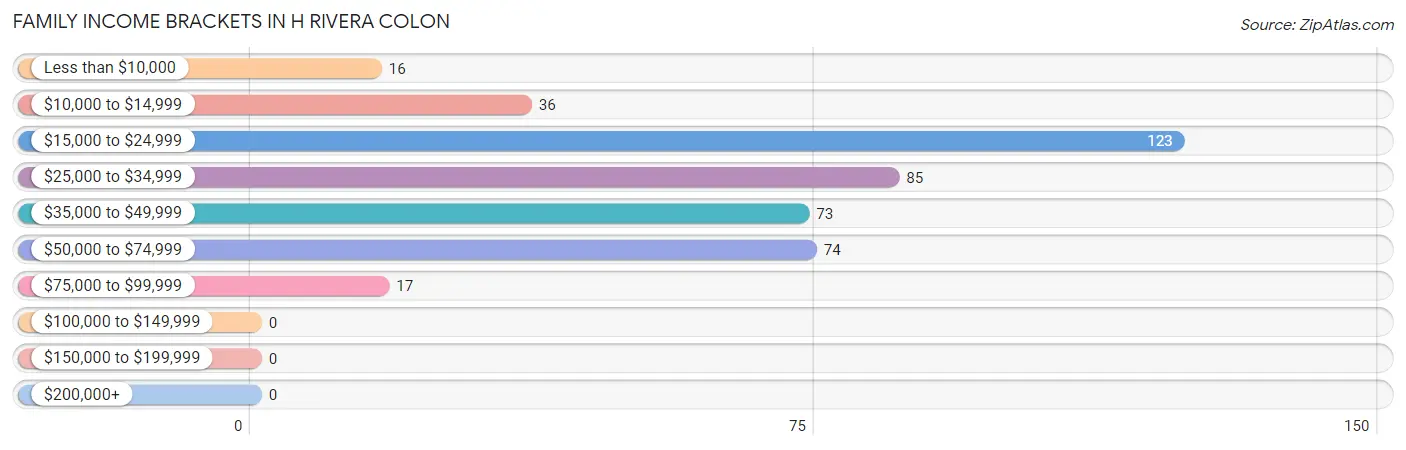
Family Income in H Rivera Colon
Family Income Brackets in H Rivera Colon
According to the H Rivera Colon family income data, there are 123 families falling into the $15,000 to $24,999 income range, which is the most common income bracket and makes up 29.0% of all families.
| Income Bracket | # Families | % Families |
| Less than $10,000 | 16 | 3.8% |
| $10,000 to $14,999 | 36 | 8.5% |
| $15,000 to $24,999 | 123 | 29.0% |
| $25,000 to $34,999 | 85 | 20.0% |
| $35,000 to $49,999 | 73 | 17.2% |
| $50,000 to $74,999 | 74 | 17.5% |
| $75,000 to $99,999 | 17 | 4.0% |
| $100,000 to $149,999 | 0 | 0.0% |
| $150,000 to $199,999 | 0 | 0.0% |
| $200,000+ | 0 | 0.0% |
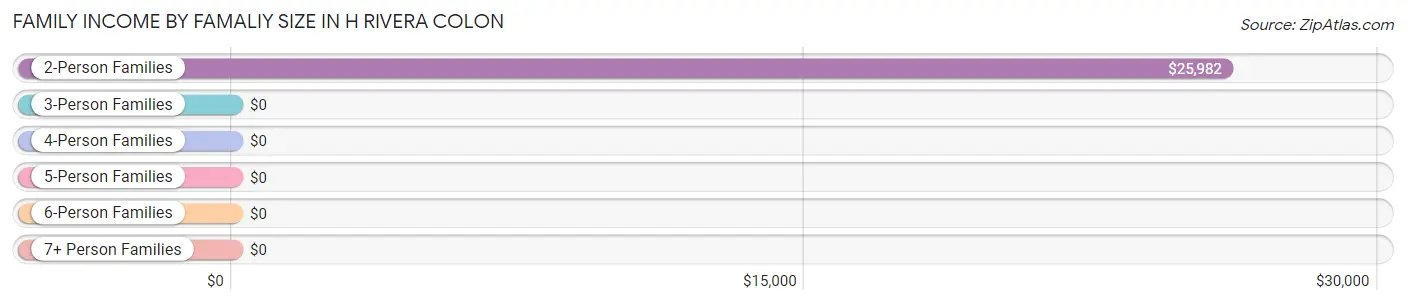
Family Income by Famaliy Size in H Rivera Colon
2-person families (200 | 47.2%) account for the highest median family income in H Rivera Colon with $25,982 per family, while 2-person families (200 | 47.2%) have the highest median income of $12,991 per family member.
| Income Bracket | # Families | Median Income |
| 2-Person Families | 200 (47.2%) | $25,982 |
| 3-Person Families | 148 (34.9%) | $0 |
| 4-Person Families | 30 (7.1%) | $0 |
| 5-Person Families | 46 (10.8%) | $0 |
| 6-Person Families | 0 (0.0%) | $0 |
| 7+ Person Families | 0 (0.0%) | $0 |
| Total | 424 (100.0%) | $28,125 |
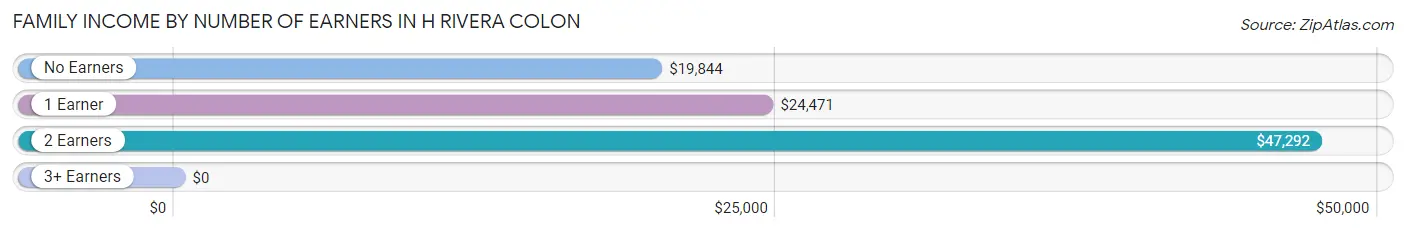
Family Income by Number of Earners in H Rivera Colon
| Number of Earners | # Families | Median Income |
| No Earners | 168 (39.6%) | $19,844 |
| 1 Earner | 117 (27.6%) | $24,471 |
| 2 Earners | 122 (28.8%) | $47,292 |
| 3+ Earners | 17 (4.0%) | $0 |
| Total | 424 (100.0%) | $28,125 |
Household Income in H Rivera Colon
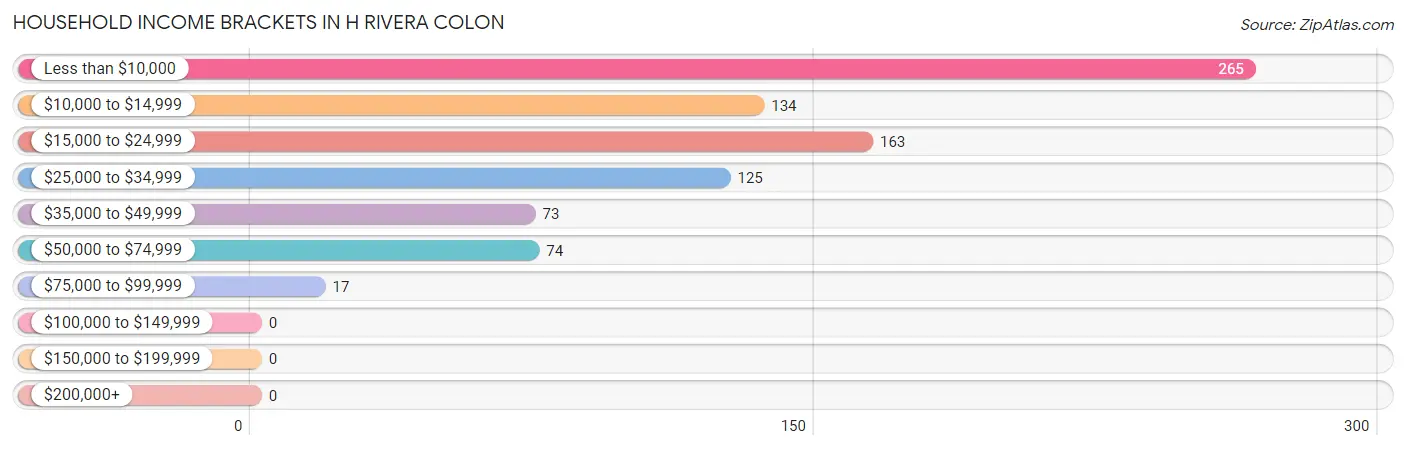
Household Income Brackets in H Rivera Colon
With 265 households falling in the category, the less than $10,000 income range is the most frequent in H Rivera Colon, accounting for 31.1% of all households.
| Income Bracket | # Households | % Households |
| Less than $10,000 | 265 | 31.1% |
| $10,000 to $14,999 | 134 | 15.7% |
| $15,000 to $24,999 | 163 | 19.2% |
| $25,000 to $34,999 | 125 | 14.7% |
| $35,000 to $49,999 | 73 | 8.6% |
| $50,000 to $74,999 | 74 | 8.7% |
| $75,000 to $99,999 | 17 | 2.0% |
| $100,000 to $149,999 | 0 | 0.0% |
| $150,000 to $199,999 | 0 | 0.0% |
| $200,000+ | 0 | 0.0% |
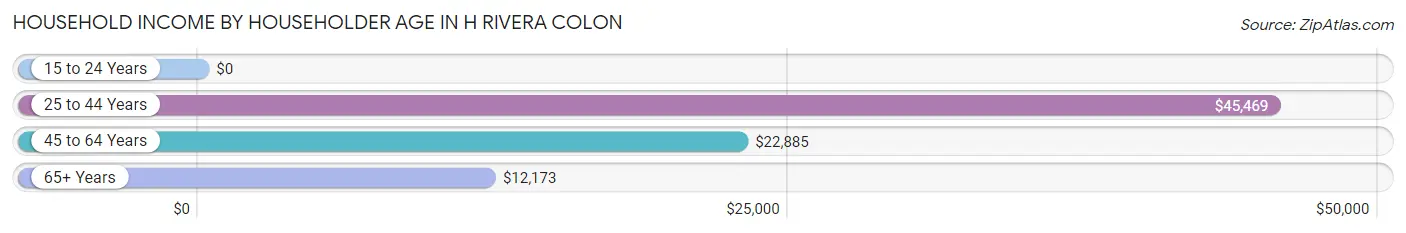
Household Income by Householder Age in H Rivera Colon
The median household income in H Rivera Colon is $15,697, with the highest median household income of $45,469 found in the 25 to 44 years age bracket for the primary householder. A total of 131 households (15.4%) fall into this category.
| Income Bracket | # Households | Median Income |
| 15 to 24 Years | 0 (0.0%) | $0 |
| 25 to 44 Years | 131 (15.4%) | $45,469 |
| 45 to 64 Years | 258 (30.3%) | $22,885 |
| 65+ Years | 462 (54.3%) | $12,173 |
| Total | 851 (100.0%) | $15,697 |
Poverty in H Rivera Colon
Income Below Poverty by Sex and Age in H Rivera Colon
With 53.1% poverty level for males and 54.1% for females among the residents of H Rivera Colon, 75 year old and over males and 6 to 11 year old females are the most vulnerable to poverty, with 203 males (94.0%) and 62 females (100.0%) in their respective age groups living below the poverty level.
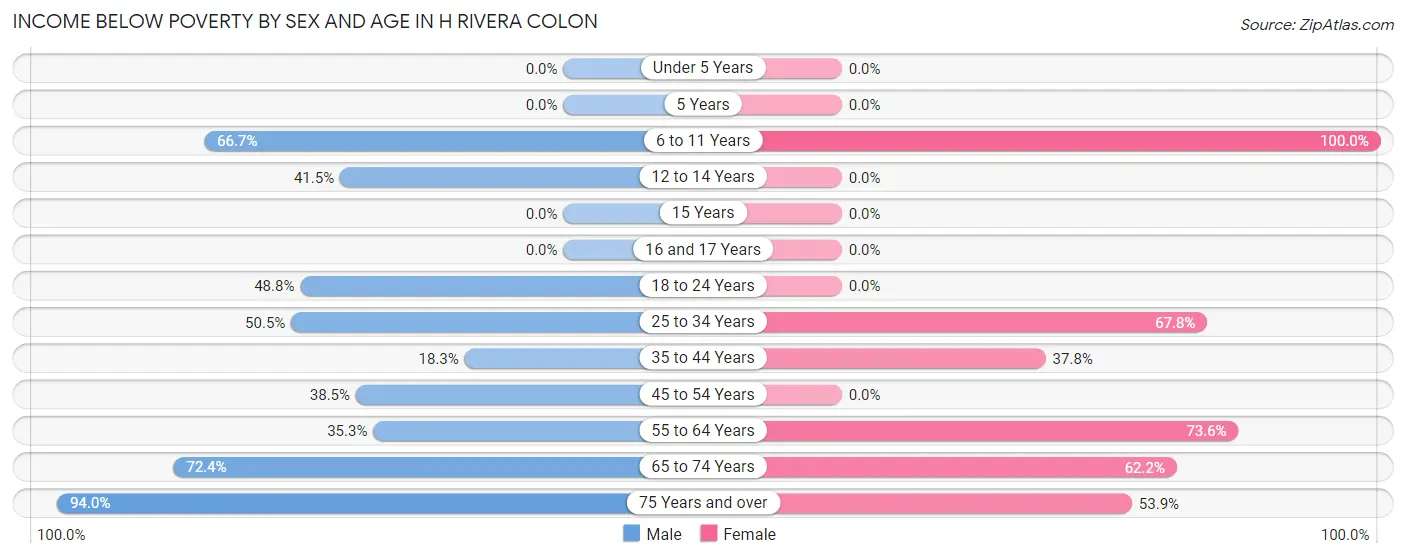
| Age Bracket | Male | Female |
| Under 5 Years | 0 (0.0%) | 0 (0.0%) |
| 5 Years | 0 (0.0%) | 0 (0.0%) |
| 6 to 11 Years | 34 (66.7%) | 62 (100.0%) |
| 12 to 14 Years | 17 (41.5%) | 0 (0.0%) |
| 15 Years | 0 (0.0%) | 0 (0.0%) |
| 16 and 17 Years | 0 (0.0%) | 0 (0.0%) |
| 18 to 24 Years | 21 (48.8%) | 0 (0.0%) |
| 25 to 34 Years | 49 (50.5%) | 78 (67.8%) |
| 35 to 44 Years | 22 (18.3%) | 28 (37.8%) |
| 45 to 54 Years | 57 (38.5%) | 0 (0.0%) |
| 55 to 64 Years | 36 (35.3%) | 173 (73.6%) |
| 65 to 74 Years | 97 (72.4%) | 115 (62.2%) |
| 75 Years and over | 203 (94.0%) | 63 (53.8%) |
| Total | 536 (53.1%) | 519 (54.1%) |
Income Above Poverty by Sex and Age in H Rivera Colon
According to the poverty statistics in H Rivera Colon, males aged under 5 years and females aged 16 and 17 years are the age groups that are most secure financially, with 100.0% of males and 100.0% of females in these age groups living above the poverty line.
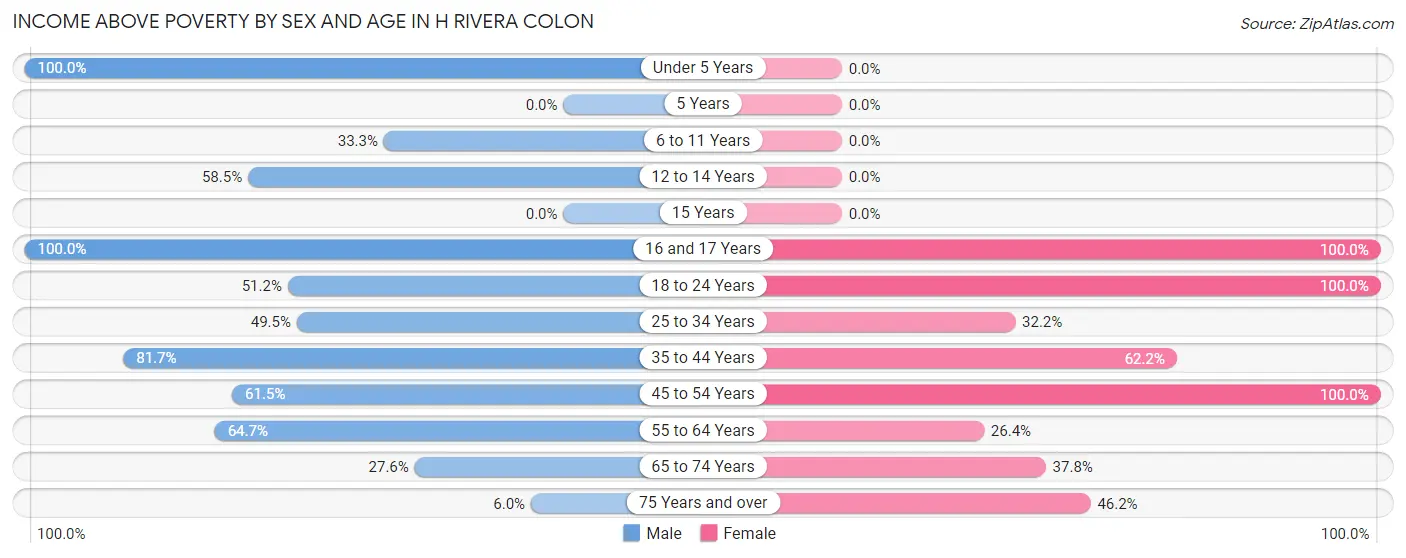
| Age Bracket | Male | Female |
| Under 5 Years | 25 (100.0%) | 0 (0.0%) |
| 5 Years | 0 (0.0%) | 0 (0.0%) |
| 6 to 11 Years | 17 (33.3%) | 0 (0.0%) |
| 12 to 14 Years | 24 (58.5%) | 0 (0.0%) |
| 15 Years | 0 (0.0%) | 0 (0.0%) |
| 16 and 17 Years | 32 (100.0%) | 21 (100.0%) |
| 18 to 24 Years | 22 (51.2%) | 56 (100.0%) |
| 25 to 34 Years | 48 (49.5%) | 37 (32.2%) |
| 35 to 44 Years | 98 (81.7%) | 46 (62.2%) |
| 45 to 54 Years | 91 (61.5%) | 95 (100.0%) |
| 55 to 64 Years | 66 (64.7%) | 62 (26.4%) |
| 65 to 74 Years | 37 (27.6%) | 70 (37.8%) |
| 75 Years and over | 13 (6.0%) | 54 (46.2%) |
| Total | 473 (46.9%) | 441 (45.9%) |
Income Below Poverty Among Married-Couple Families in H Rivera Colon
The poverty statistics for married-couple families in H Rivera Colon show that 21.6% or 50 of the total 231 families live below the poverty line. Families with no children have the highest poverty rate of 30.1%, comprising of 50 families. On the other hand, families with 1 or 2 children have the lowest poverty rate of 0.0%, which includes 0 families.
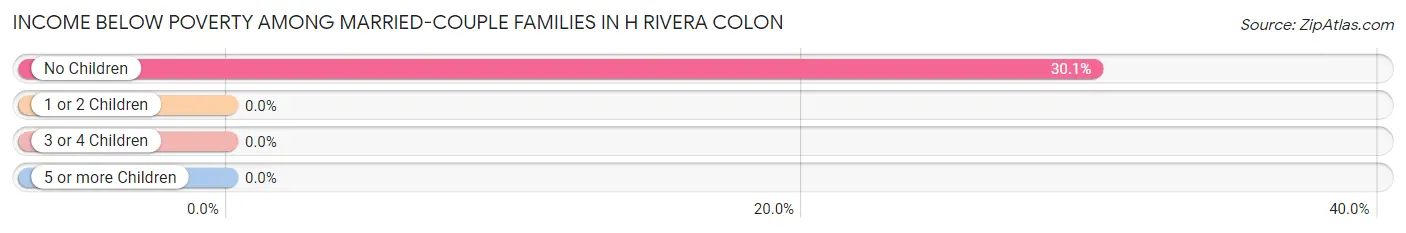
| Children | Above Poverty | Below Poverty |
| No Children | 116 (69.9%) | 50 (30.1%) |
| 1 or 2 Children | 41 (100.0%) | 0 (0.0%) |
| 3 or 4 Children | 24 (100.0%) | 0 (0.0%) |
| 5 or more Children | 0 (0.0%) | 0 (0.0%) |
| Total | 181 (78.3%) | 50 (21.6%) |
Income Below Poverty Among Single-Parent Households in H Rivera Colon
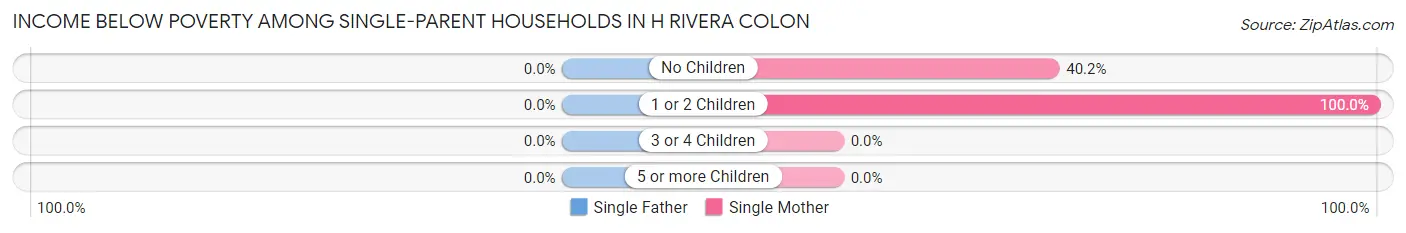
| Children | Single Father | Single Mother |
| No Children | 0 (0.0%) | 51 (40.2%) |
| 1 or 2 Children | 0 (0.0%) | 57 (100.0%) |
| 3 or 4 Children | 0 (0.0%) | 0 (0.0%) |
| 5 or more Children | 0 (0.0%) | 0 (0.0%) |
| Total | 0 (0.0%) | 108 (58.7%) |
Income Below Poverty Among Married-Couple vs Single-Parent Households in H Rivera Colon
The poverty data for H Rivera Colon shows that 50 of the married-couple family households (21.6%) and 108 of the single-parent households (56.0%) are living below the poverty level. Within the married-couple family households, those with no children have the highest poverty rate, with 50 households (30.1%) falling below the poverty line. Among the single-parent households, those with 1 or 2 children have the highest poverty rate, with 57 household (100.0%) living below poverty.
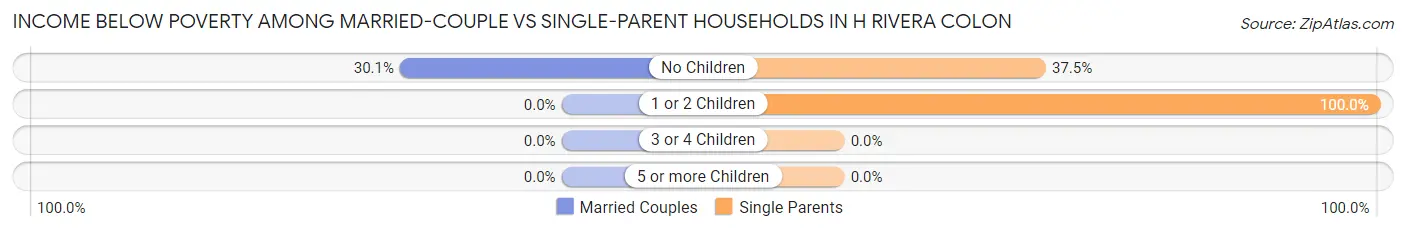
| Children | Married-Couple Families | Single-Parent Households |
| No Children | 50 (30.1%) | 51 (37.5%) |
| 1 or 2 Children | 0 (0.0%) | 57 (100.0%) |
| 3 or 4 Children | 0 (0.0%) | 0 (0.0%) |
| 5 or more Children | 0 (0.0%) | 0 (0.0%) |
| Total | 50 (21.6%) | 108 (56.0%) |
Race in H Rivera Colon
The most populous races in H Rivera Colon are Hispanic or Latino (1,969 | 100.0%), White / Caucasian (1,175 | 59.7%), and Two or more Races (399 | 20.3%).
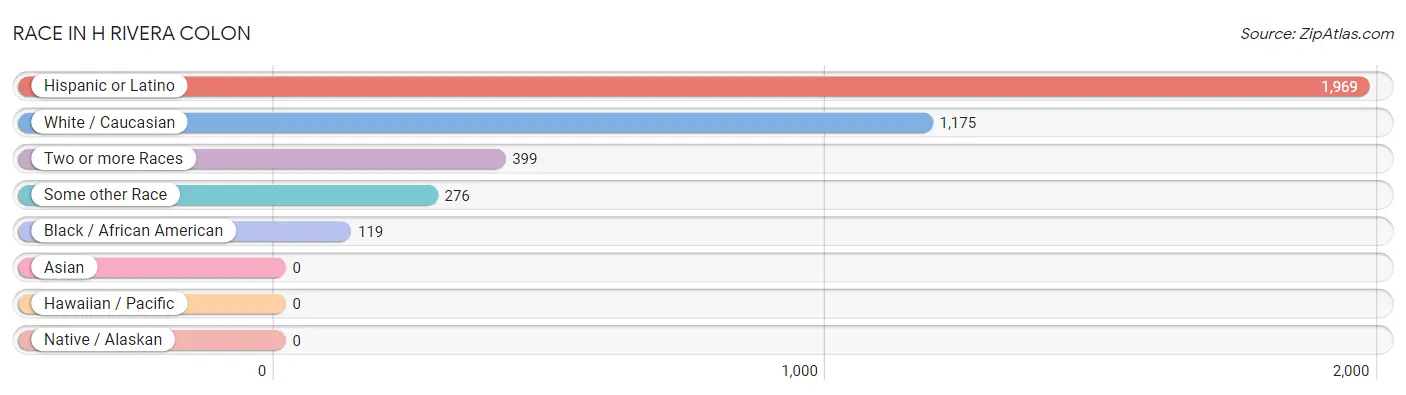
| Race | # Population | % Population |
| Asian | 0 | 0.0% |
| Black / African American | 119 | 6.0% |
| Hawaiian / Pacific | 0 | 0.0% |
| Hispanic or Latino | 1,969 | 100.0% |
| Native / Alaskan | 0 | 0.0% |
| White / Caucasian | 1,175 | 59.7% |
| Two or more Races | 399 | 20.3% |
| Some other Race | 276 | 14.0% |
| Total | 1,969 | 100.0% |
Ancestry in H Rivera Colon
The most populous ancestries reported in H Rivera Colon are , and Puerto Rican (1,969 | 100.0%), together accounting for 100.0% of all H Rivera Colon residents.

| Ancestry | # Population | % Population |
| Puerto Rican | 1,969 | 100.0% | View All 1 Rows |
Immigrants in H Rivera Colon

| Immigration Origin | # Population | % Population | View All 0 Rows |
Sex and Age in H Rivera Colon
Sex and Age in H Rivera Colon
The most populous age groups in H Rivera Colon are 75 to 79 Years (143 | 14.2%) for men and 60 to 64 Years (149 | 15.5%) for women.
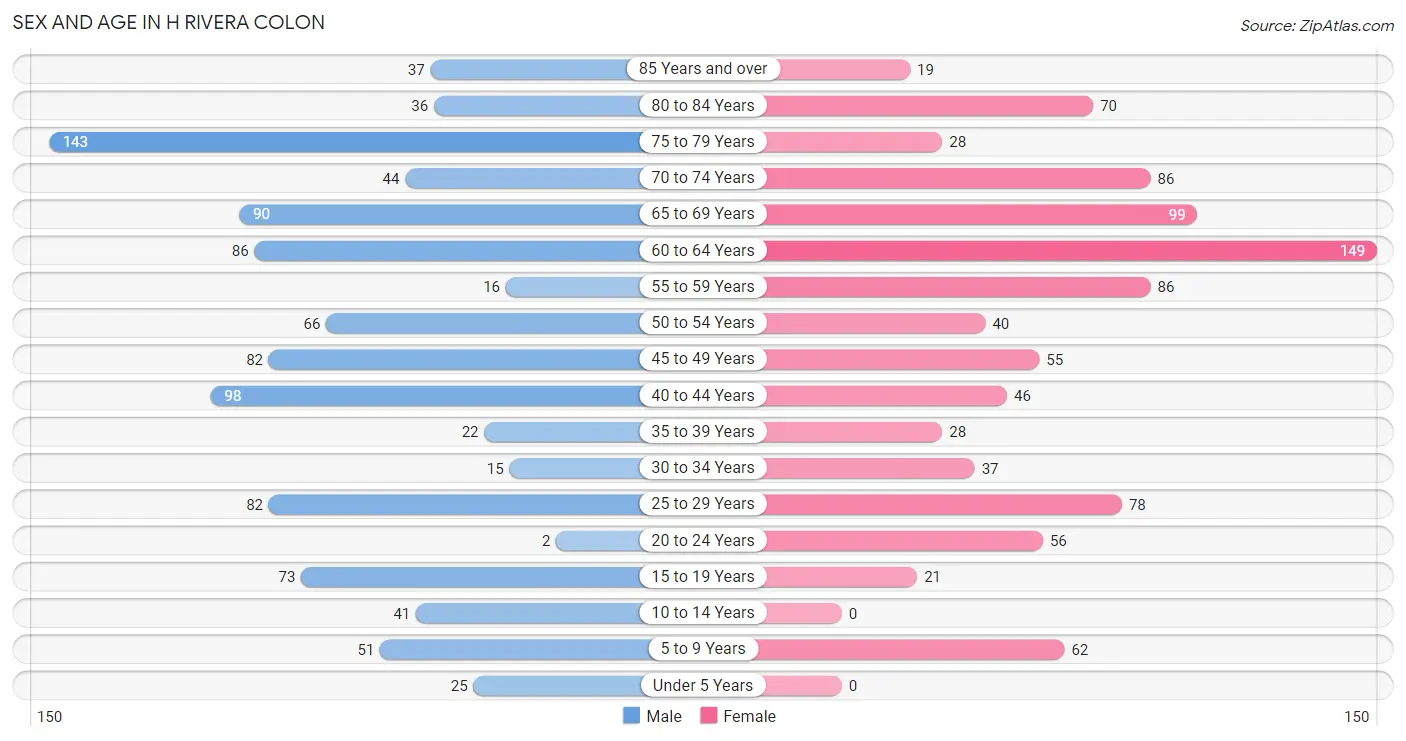
| Age Bracket | Male | Female |
| Under 5 Years | 25 (2.5%) | 0 (0.0%) |
| 5 to 9 Years | 51 (5.1%) | 62 (6.5%) |
| 10 to 14 Years | 41 (4.1%) | 0 (0.0%) |
| 15 to 19 Years | 73 (7.2%) | 21 (2.2%) |
| 20 to 24 Years | 2 (0.2%) | 56 (5.8%) |
| 25 to 29 Years | 82 (8.1%) | 78 (8.1%) |
| 30 to 34 Years | 15 (1.5%) | 37 (3.8%) |
| 35 to 39 Years | 22 (2.2%) | 28 (2.9%) |
| 40 to 44 Years | 98 (9.7%) | 46 (4.8%) |
| 45 to 49 Years | 82 (8.1%) | 55 (5.7%) |
| 50 to 54 Years | 66 (6.5%) | 40 (4.2%) |
| 55 to 59 Years | 16 (1.6%) | 86 (9.0%) |
| 60 to 64 Years | 86 (8.5%) | 149 (15.5%) |
| 65 to 69 Years | 90 (8.9%) | 99 (10.3%) |
| 70 to 74 Years | 44 (4.4%) | 86 (9.0%) |
| 75 to 79 Years | 143 (14.2%) | 28 (2.9%) |
| 80 to 84 Years | 36 (3.6%) | 70 (7.3%) |
| 85 Years and over | 37 (3.7%) | 19 (2.0%) |
| Total | 1,009 (100.0%) | 960 (100.0%) |
Families and Households in H Rivera Colon
Median Family Size in H Rivera Colon
The median family size in H Rivera Colon is 3.40 persons per family, with single female/mother families (184 | 43.4%) accounting for the largest median family size of 4.01 persons per family. On the other hand, single male/father families (9 | 2.1%) represent the smallest median family size with 2.56 persons per family.
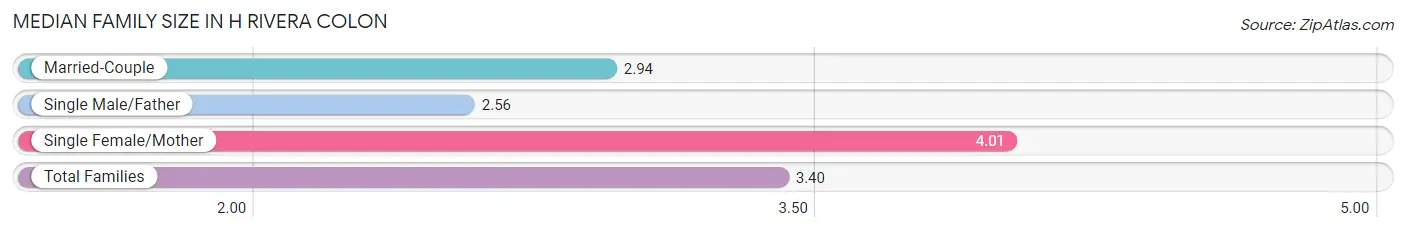
| Family Type | # Families | Family Size |
| Married-Couple | 231 (54.5%) | 2.94 |
| Single Male/Father | 9 (2.1%) | 2.56 |
| Single Female/Mother | 184 (43.4%) | 4.01 |
| Total Families | 424 (100.0%) | 3.40 |
Median Household Size in H Rivera Colon
The median household size in H Rivera Colon is 2.31 persons per household, with single female/mother households (184 | 21.6%) accounting for the largest median household size of 4.23 persons per household. non-family households (427 | 50.2%) represent the smallest median household size with 1.13 persons per household.
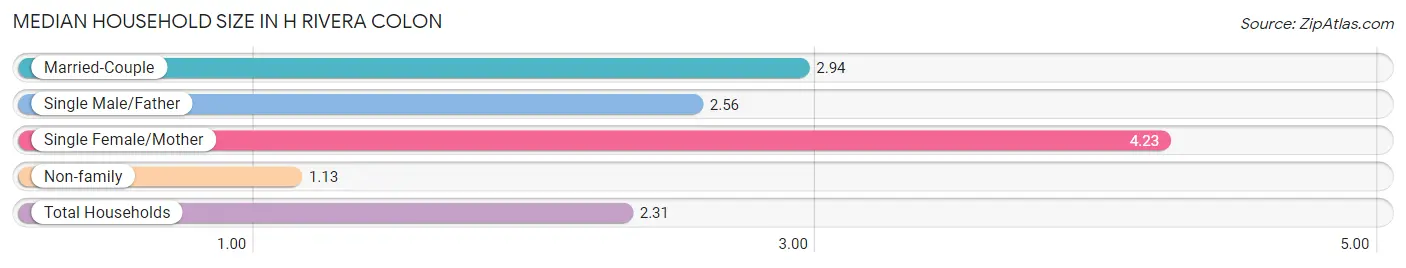
| Household Type | # Households | Household Size |
| Married-Couple | 231 (27.1%) | 2.94 |
| Single Male/Father | 9 (1.1%) | 2.56 |
| Single Female/Mother | 184 (21.6%) | 4.23 |
| Non-family | 427 (50.2%) | 1.13 |
| Total Households | 851 (100.0%) | 2.31 |
Household Size by Marriage Status in H Rivera Colon
Out of a total of 851 households in H Rivera Colon, 424 (49.8%) are family households, while 427 (50.2%) are nonfamily households. The most numerous type of family households are 3-person households, comprising 190, and the most common type of nonfamily households are 1-person households, comprising 370.
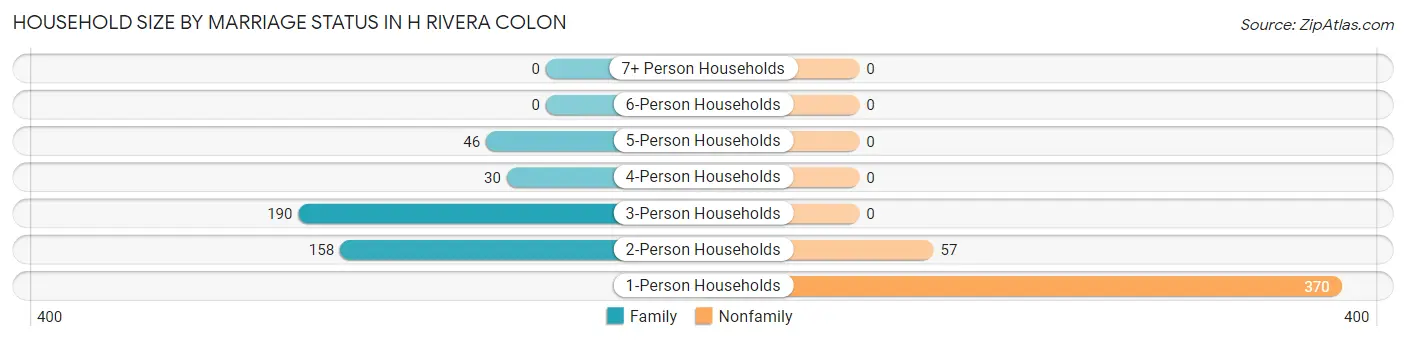
| Household Size | Family Households | Nonfamily Households |
| 1-Person Households | - | 370 (43.5%) |
| 2-Person Households | 158 (18.6%) | 57 (6.7%) |
| 3-Person Households | 190 (22.3%) | 0 (0.0%) |
| 4-Person Households | 30 (3.5%) | 0 (0.0%) |
| 5-Person Households | 46 (5.4%) | 0 (0.0%) |
| 6-Person Households | 0 (0.0%) | 0 (0.0%) |
| 7+ Person Households | 0 (0.0%) | 0 (0.0%) |
| Total | 424 (49.8%) | 427 (50.2%) |
Female Fertility in H Rivera Colon
Fertility by Age in H Rivera Colon
| Age Bracket | Women with Births | Births / 1,000 Women |
| 15 to 19 years | 0 (0.0%) | 0.0 |
| 20 to 34 years | 0 (0.0%) | 0.0 |
| 35 to 50 years | 0 (0.0%) | 0.0 |
| Total | 0 (0.0%) | 0.0 |
Fertility by Age by Marriage Status in H Rivera Colon
| Age Bracket | Married | Unmarried |
| 15 to 19 years | 0 (0.0%) | 0 (0.0%) |
| 20 to 34 years | 0 (0.0%) | 0 (0.0%) |
| 35 to 50 years | 0 (0.0%) | 0 (0.0%) |
| Total | 0 (0.0%) | 0 (0.0%) |
Fertility by Education in H Rivera Colon
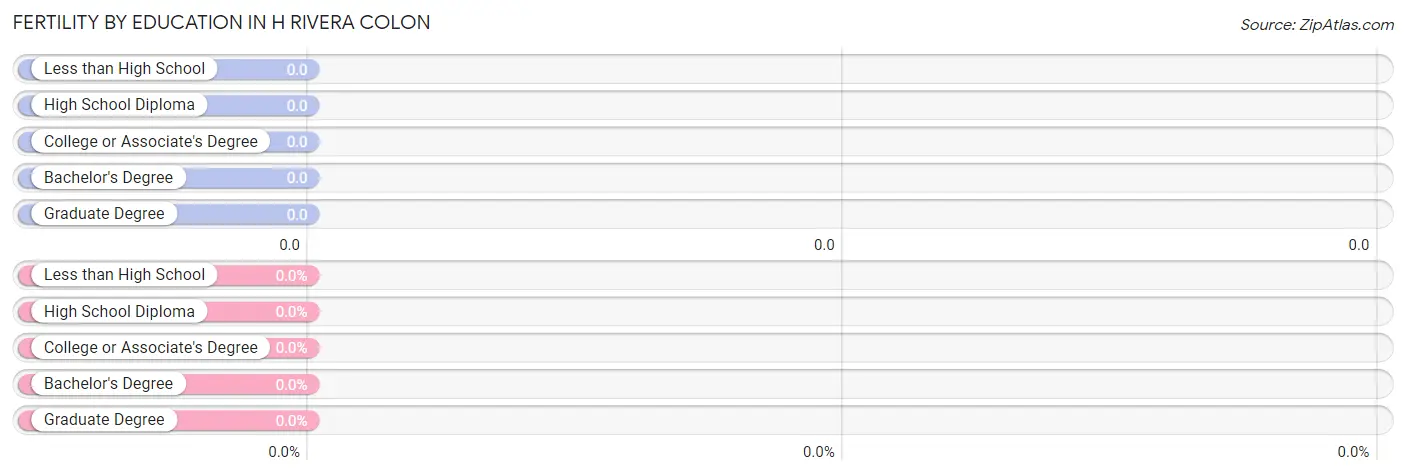
| Educational Attainment | Women with Births | Births / 1,000 Women |
| Less than High School | 0 (0.0%) | 0.0 |
| High School Diploma | 0 (0.0%) | 0.0 |
| College or Associate's Degree | 0 (0.0%) | 0.0 |
| Bachelor's Degree | 0 (0.0%) | 0.0 |
| Graduate Degree | 0 (0.0%) | 0.0 |
| Total | 0 (0.0%) | 0.0 |
Fertility by Education by Marriage Status in H Rivera Colon
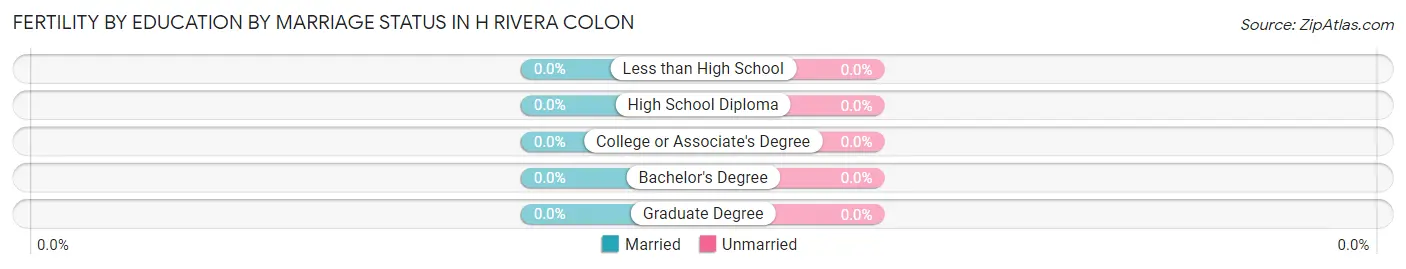
| Educational Attainment | Married | Unmarried |
| Less than High School | 0 (0.0%) | 0 (0.0%) |
| High School Diploma | 0 (0.0%) | 0 (0.0%) |
| College or Associate's Degree | 0 (0.0%) | 0 (0.0%) |
| Bachelor's Degree | 0 (0.0%) | 0 (0.0%) |
| Graduate Degree | 0 (0.0%) | 0 (0.0%) |
| Total | 0 (0.0%) | 0 (0.0%) |
Employment Characteristics in H Rivera Colon
Employment by Class of Employer in H Rivera Colon
Among the 540 employed individuals in H Rivera Colon, private company employees (385 | 71.3%), state government employees (46 | 8.5%), and local government employees (40 | 7.4%) make up the most common classes of employment.
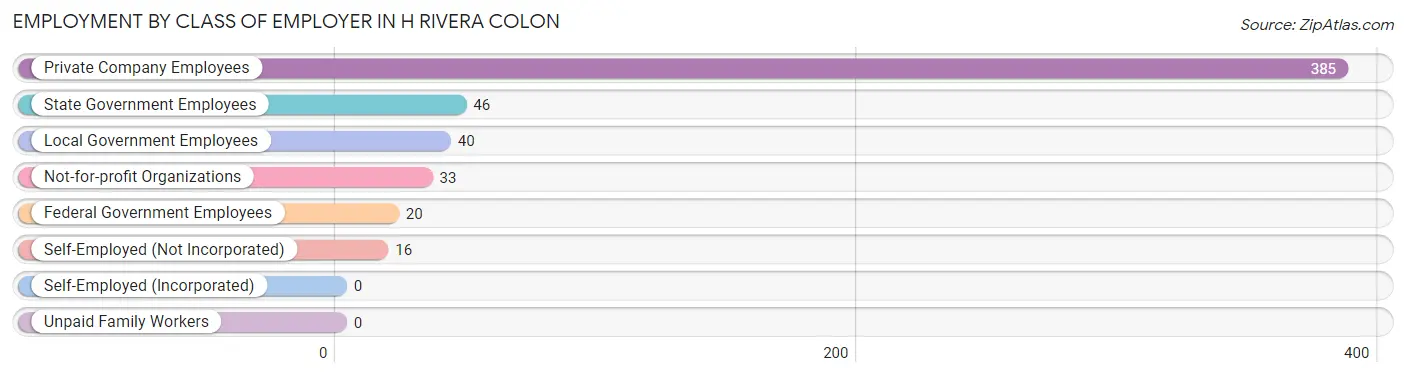
| Employer Class | # Employees | % Employees |
| Private Company Employees | 385 | 71.3% |
| Self-Employed (Incorporated) | 0 | 0.0% |
| Self-Employed (Not Incorporated) | 16 | 3.0% |
| Not-for-profit Organizations | 33 | 6.1% |
| Local Government Employees | 40 | 7.4% |
| State Government Employees | 46 | 8.5% |
| Federal Government Employees | 20 | 3.7% |
| Unpaid Family Workers | 0 | 0.0% |
| Total | 540 | 100.0% |
Employment Status by Age in H Rivera Colon
According to the labor force statistics for H Rivera Colon, out of the total population over 16 years of age (1,790), 32.5% or 582 individuals are in the labor force, with 7.1% or 41 of them unemployed. The age group with the highest labor force participation rate is 30 to 34 years, with 100.0% or 52 individuals in the labor force. Within the labor force, the 16 to 19 years age range has the highest percentage of unemployed individuals, with 100.0% or 19 of them being unemployed.
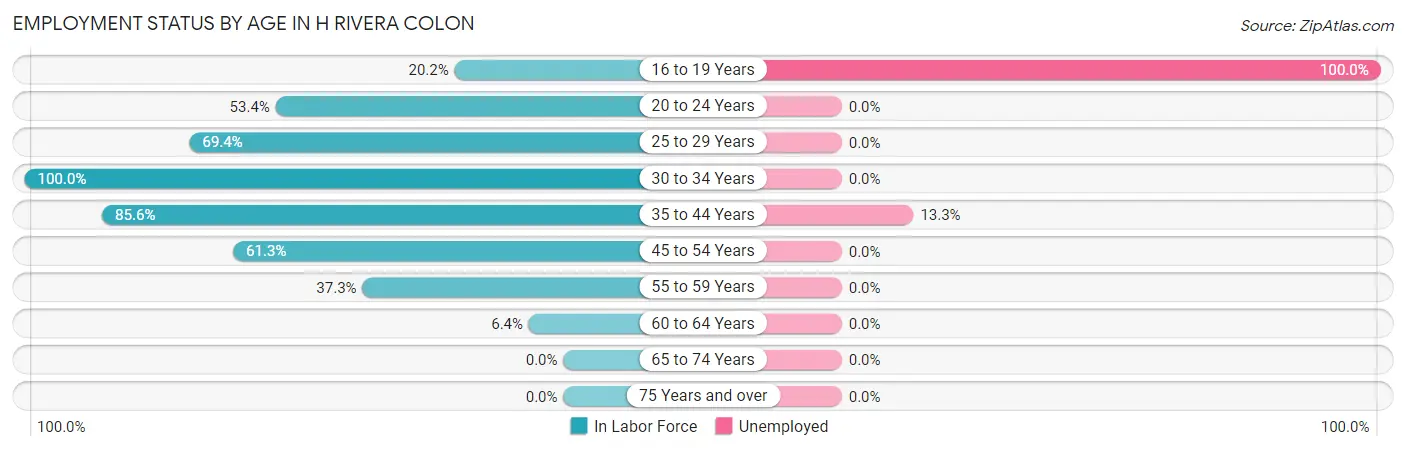
| Age Bracket | In Labor Force | Unemployed |
| 16 to 19 Years | 19 (20.2%) | 19 (100.0%) |
| 20 to 24 Years | 31 (53.4%) | 0 (0.0%) |
| 25 to 29 Years | 111 (69.4%) | 0 (0.0%) |
| 30 to 34 Years | 52 (100.0%) | 0 (0.0%) |
| 35 to 44 Years | 166 (85.6%) | 22 (13.3%) |
| 45 to 54 Years | 149 (61.3%) | 0 (0.0%) |
| 55 to 59 Years | 38 (37.3%) | 0 (0.0%) |
| 60 to 64 Years | 15 (6.4%) | 0 (0.0%) |
| 65 to 74 Years | 0 (0.0%) | 0 (0.0%) |
| 75 Years and over | 0 (0.0%) | 0 (0.0%) |
| Total | 582 (32.5%) | 41 (7.1%) |
Employment Status by Educational Attainment in H Rivera Colon
According to labor force statistics for H Rivera Colon, 53.9% of individuals (531) out of the total population between 25 and 64 years of age (986) are in the labor force, with 4.1% or 22 of them being unemployed. The group with the highest labor force participation rate are those with the educational attainment of college / associate degree, with 76.7% or 211 individuals in the labor force. Within the labor force, individuals with less than high school education have the highest percentage of unemployment, with 37.3% or 22 of them being unemployed.
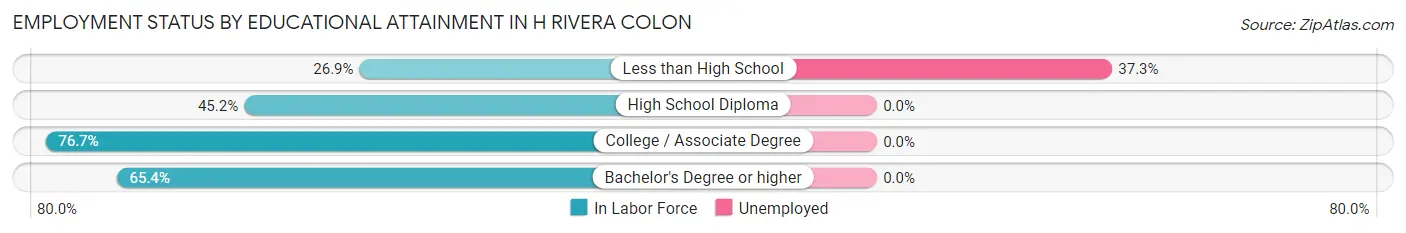
| Educational Attainment | In Labor Force | Unemployed |
| Less than High School | 59 (26.9%) | 82 (37.3%) |
| High School Diploma | 136 (45.2%) | 0 (0.0%) |
| College / Associate Degree | 211 (76.7%) | 0 (0.0%) |
| Bachelor's Degree or higher | 125 (65.4%) | 0 (0.0%) |
| Total | 531 (53.9%) | 40 (4.1%) |
Employment Occupations by Sex in H Rivera Colon
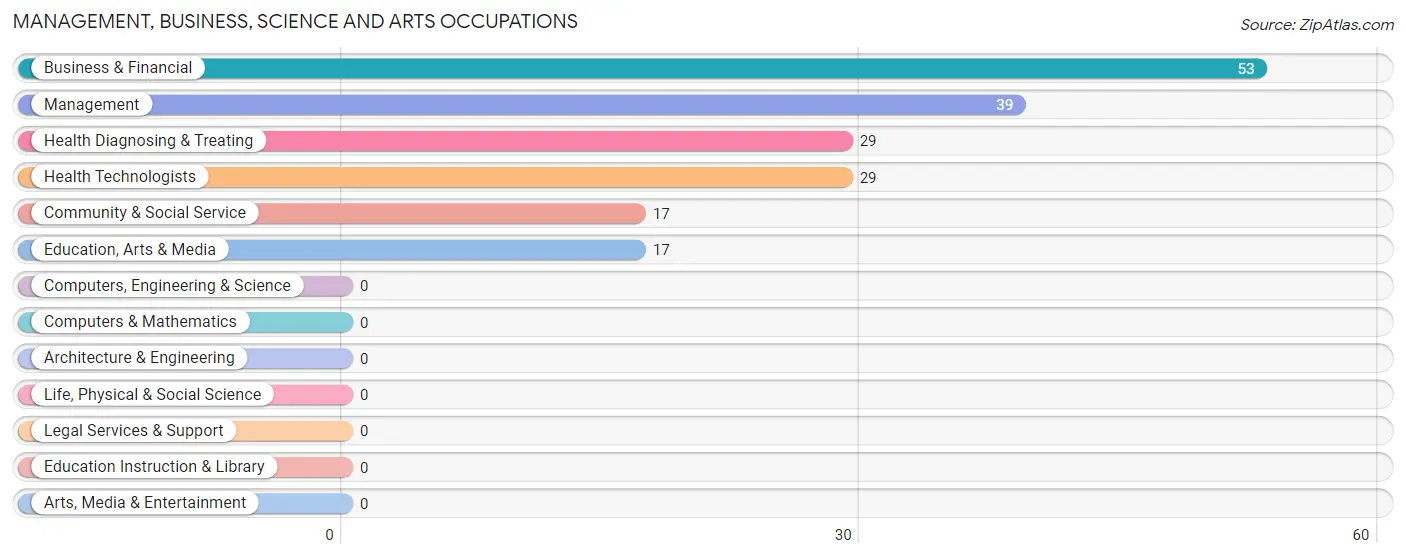
Management, Business, Science and Arts Occupations
The most common Management, Business, Science and Arts occupations in H Rivera Colon are Business & Financial (53 | 9.8%), Management (39 | 7.2%), Health Diagnosing & Treating (29 | 5.4%), Health Technologists (29 | 5.4%), and Community & Social Service (17 | 3.2%).
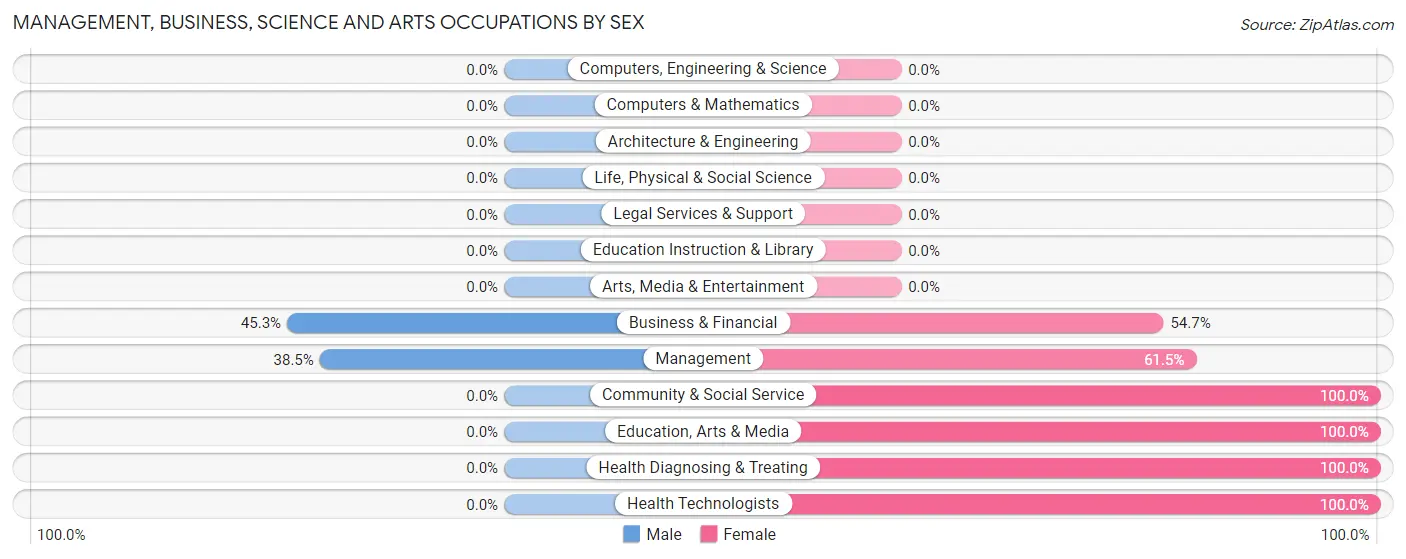
Management, Business, Science and Arts Occupations by Sex
Within the Management, Business, Science and Arts occupations in H Rivera Colon, the most male-oriented occupations are Business & Financial (45.3%), and Management (38.5%), while the most female-oriented occupations are Community & Social Service (100.0%), Education, Arts & Media (100.0%), and Health Diagnosing & Treating (100.0%).
| Occupation | Male | Female |
| Management | 15 (38.5%) | 24 (61.5%) |
| Business & Financial | 24 (45.3%) | 29 (54.7%) |
| Computers, Engineering & Science | 0 (0.0%) | 0 (0.0%) |
| Computers & Mathematics | 0 (0.0%) | 0 (0.0%) |
| Architecture & Engineering | 0 (0.0%) | 0 (0.0%) |
| Life, Physical & Social Science | 0 (0.0%) | 0 (0.0%) |
| Community & Social Service | 0 (0.0%) | 17 (100.0%) |
| Education, Arts & Media | 0 (0.0%) | 17 (100.0%) |
| Legal Services & Support | 0 (0.0%) | 0 (0.0%) |
| Education Instruction & Library | 0 (0.0%) | 0 (0.0%) |
| Arts, Media & Entertainment | 0 (0.0%) | 0 (0.0%) |
| Health Diagnosing & Treating | 0 (0.0%) | 29 (100.0%) |
| Health Technologists | 0 (0.0%) | 29 (100.0%) |
| Total (Category) | 39 (28.3%) | 99 (71.7%) |
| Total (Overall) | 252 (46.7%) | 288 (53.3%) |
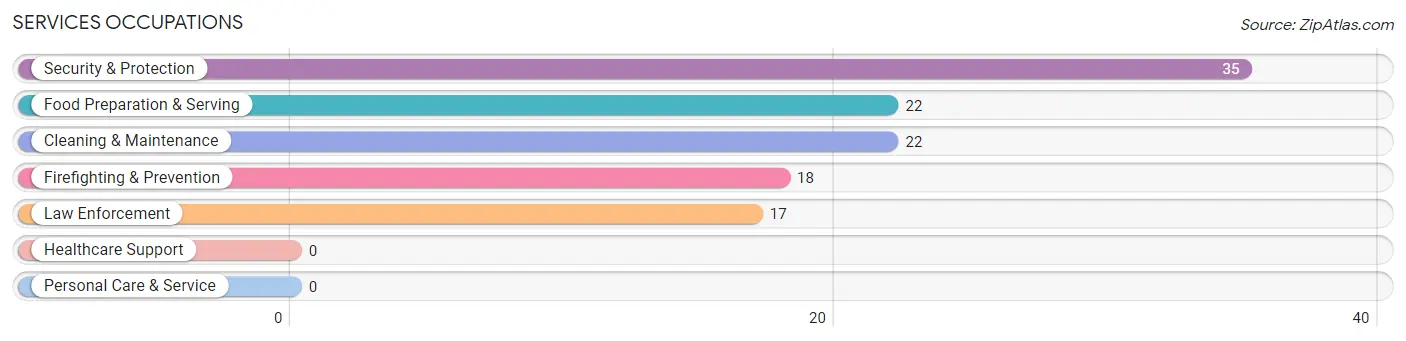
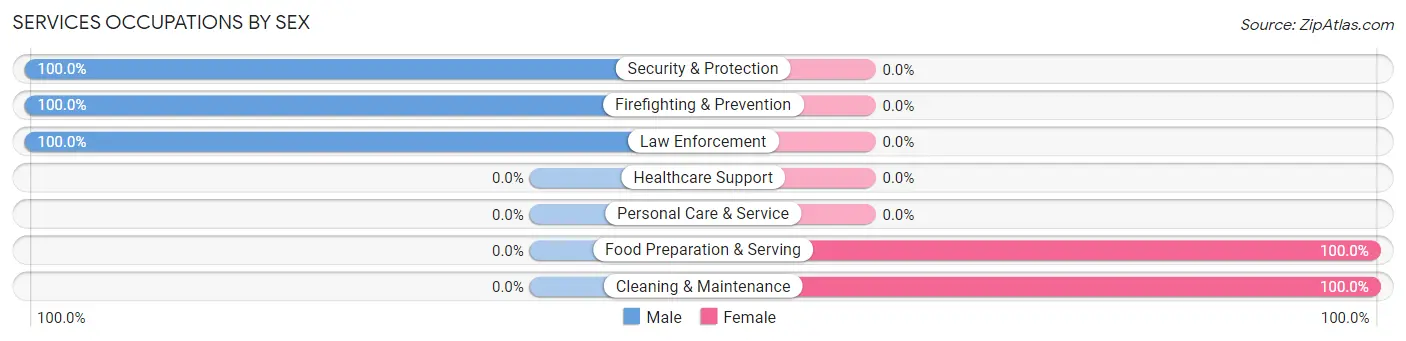
Services Occupations
The most common Services occupations in H Rivera Colon are Security & Protection (35 | 6.5%), Food Preparation & Serving (22 | 4.1%), Cleaning & Maintenance (22 | 4.1%), Firefighting & Prevention (18 | 3.3%), and Law Enforcement (17 | 3.2%).
Services Occupations by Sex
Within the Services occupations in H Rivera Colon, the most male-oriented occupations are Security & Protection (100.0%), Firefighting & Prevention (100.0%), and Law Enforcement (100.0%), while the most female-oriented occupations are Food Preparation & Serving (100.0%), and Cleaning & Maintenance (100.0%).
| Occupation | Male | Female |
| Healthcare Support | 0 (0.0%) | 0 (0.0%) |
| Security & Protection | 35 (100.0%) | 0 (0.0%) |
| Firefighting & Prevention | 18 (100.0%) | 0 (0.0%) |
| Law Enforcement | 17 (100.0%) | 0 (0.0%) |
| Food Preparation & Serving | 0 (0.0%) | 22 (100.0%) |
| Cleaning & Maintenance | 0 (0.0%) | 22 (100.0%) |
| Personal Care & Service | 0 (0.0%) | 0 (0.0%) |
| Total (Category) | 35 (44.3%) | 44 (55.7%) |
| Total (Overall) | 252 (46.7%) | 288 (53.3%) |
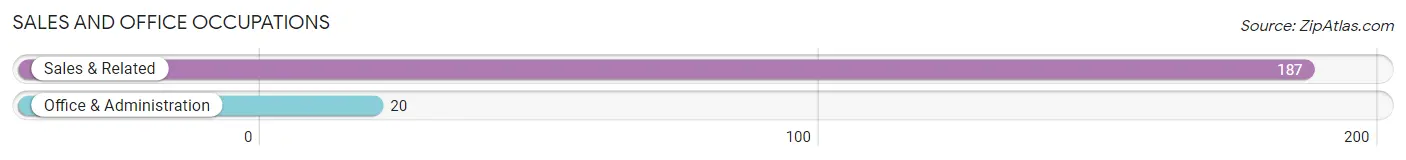
Sales and Office Occupations
The most common Sales and Office occupations in H Rivera Colon are Sales & Related (187 | 34.6%), and Office & Administration (20 | 3.7%).
Sales and Office Occupations by Sex
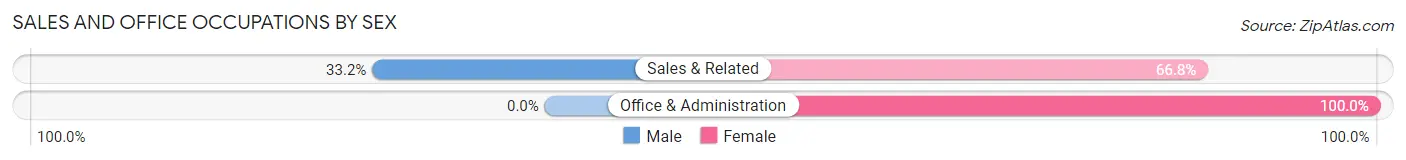
| Occupation | Male | Female |
| Sales & Related | 62 (33.2%) | 125 (66.8%) |
| Office & Administration | 0 (0.0%) | 20 (100.0%) |
| Total (Category) | 62 (29.9%) | 145 (70.1%) |
| Total (Overall) | 252 (46.7%) | 288 (53.3%) |
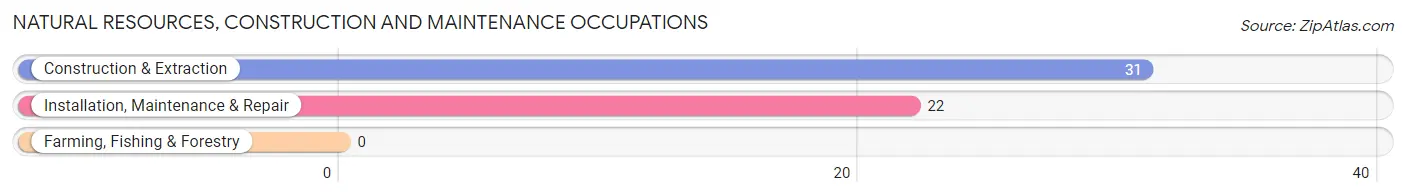
Natural Resources, Construction and Maintenance Occupations
The most common Natural Resources, Construction and Maintenance occupations in H Rivera Colon are Construction & Extraction (31 | 5.7%), and Installation, Maintenance & Repair (22 | 4.1%).
Natural Resources, Construction and Maintenance Occupations by Sex
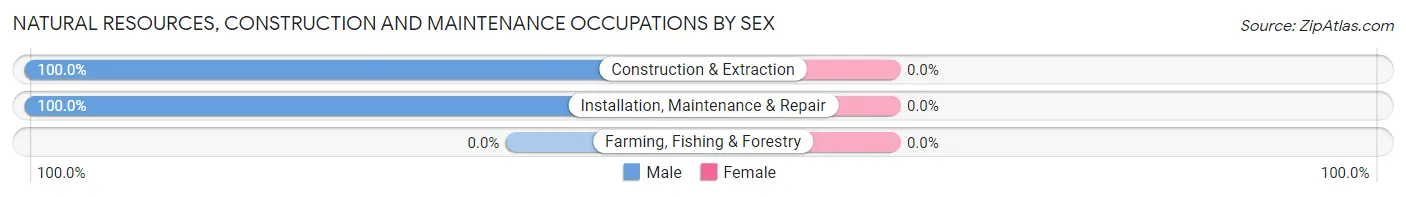
| Occupation | Male | Female |
| Farming, Fishing & Forestry | 0 (0.0%) | 0 (0.0%) |
| Construction & Extraction | 31 (100.0%) | 0 (0.0%) |
| Installation, Maintenance & Repair | 22 (100.0%) | 0 (0.0%) |
| Total (Category) | 53 (100.0%) | 0 (0.0%) |
| Total (Overall) | 252 (46.7%) | 288 (53.3%) |
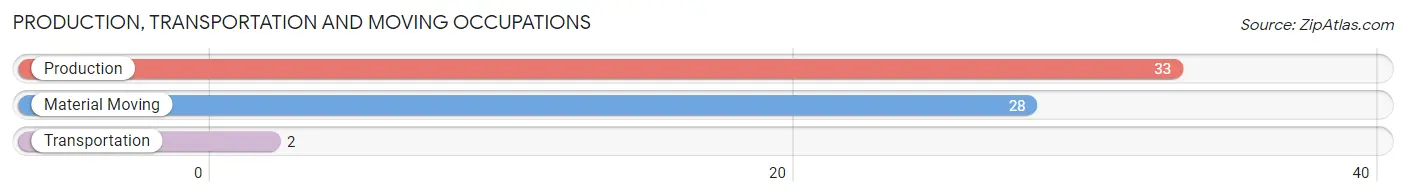
Production, Transportation and Moving Occupations
The most common Production, Transportation and Moving occupations in H Rivera Colon are Production (33 | 6.1%), Material Moving (28 | 5.2%), and Transportation (2 | 0.4%).
Production, Transportation and Moving Occupations by Sex
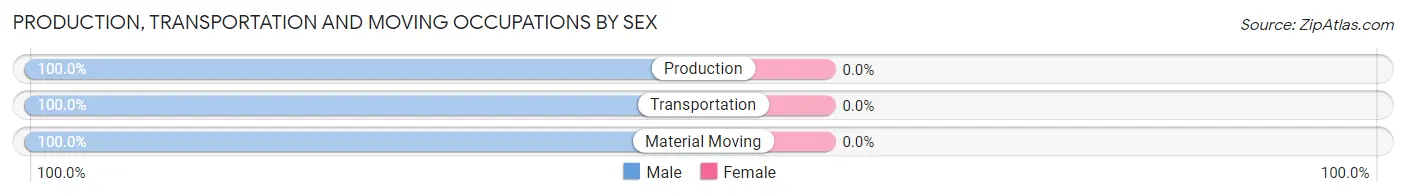
| Occupation | Male | Female |
| Production | 33 (100.0%) | 0 (0.0%) |
| Transportation | 2 (100.0%) | 0 (0.0%) |
| Material Moving | 28 (100.0%) | 0 (0.0%) |
| Total (Category) | 63 (100.0%) | 0 (0.0%) |
| Total (Overall) | 252 (46.7%) | 288 (53.3%) |
Employment Industries by Sex in H Rivera Colon
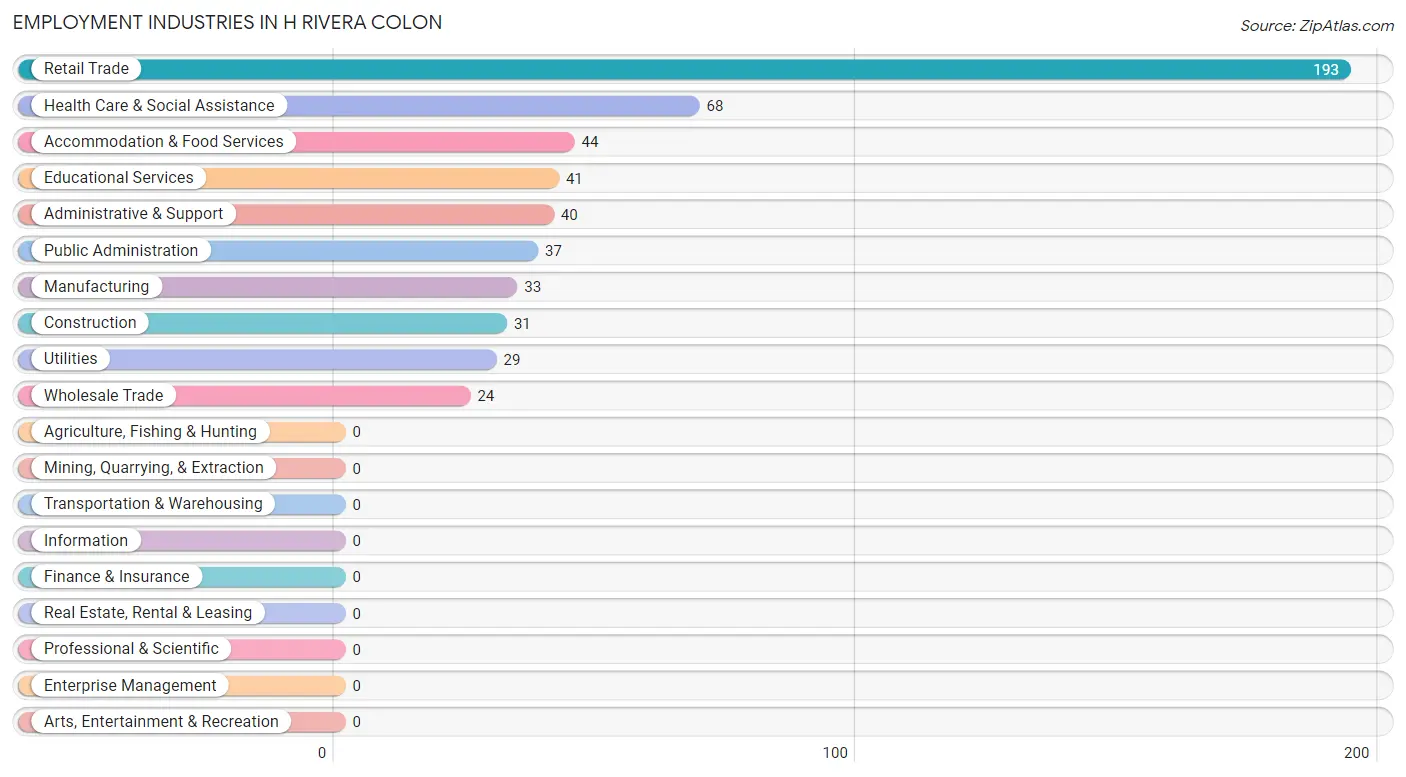
Employment Industries in H Rivera Colon
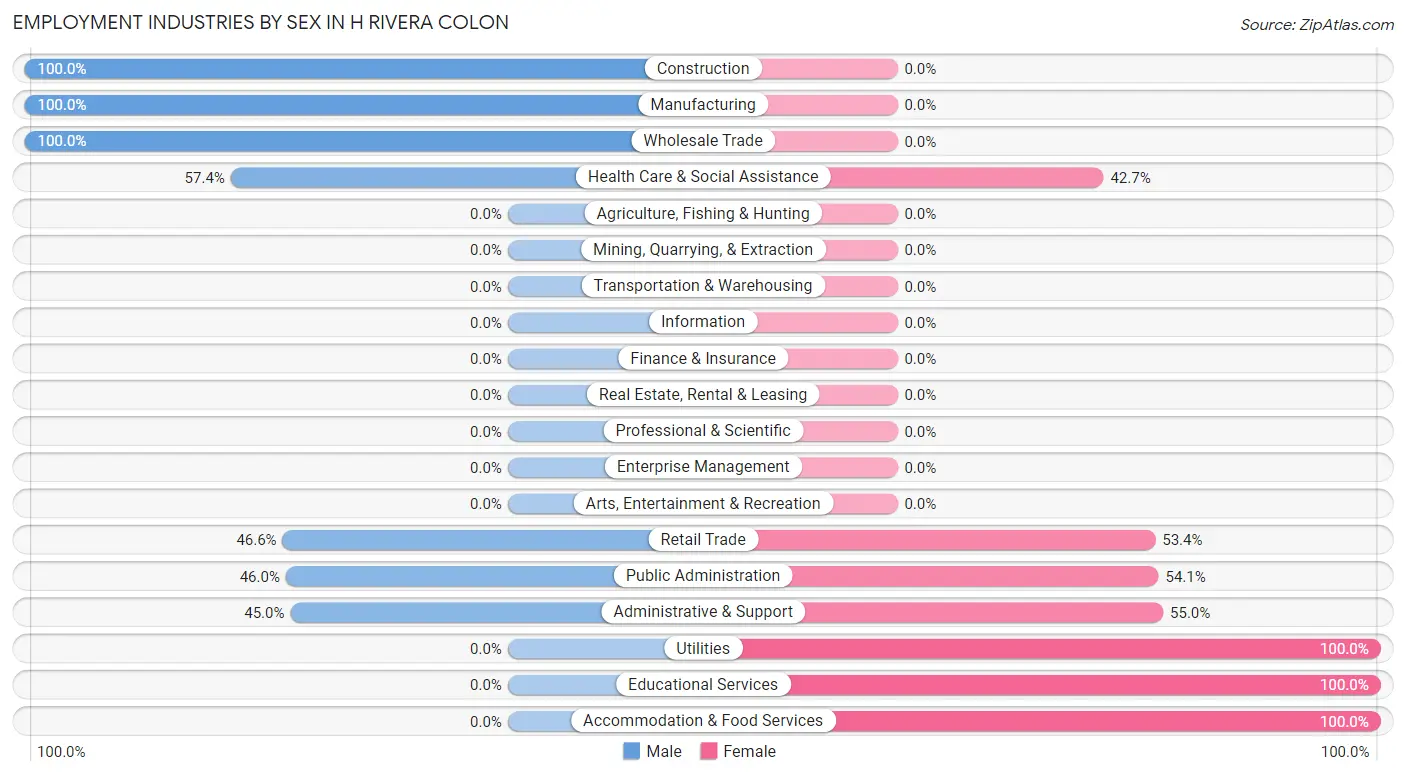
The major employment industries in H Rivera Colon include Retail Trade (193 | 35.7%), Health Care & Social Assistance (68 | 12.6%), Accommodation & Food Services (44 | 8.2%), Educational Services (41 | 7.6%), and Administrative & Support (40 | 7.4%).
Employment Industries by Sex in H Rivera Colon
The H Rivera Colon industries that see more men than women are Construction (100.0%), Manufacturing (100.0%), and Wholesale Trade (100.0%), whereas the industries that tend to have a higher number of women are Utilities (100.0%), Educational Services (100.0%), and Accommodation & Food Services (100.0%).
| Industry | Male | Female |
| Agriculture, Fishing & Hunting | 0 (0.0%) | 0 (0.0%) |
| Mining, Quarrying, & Extraction | 0 (0.0%) | 0 (0.0%) |
| Construction | 31 (100.0%) | 0 (0.0%) |
| Manufacturing | 33 (100.0%) | 0 (0.0%) |
| Wholesale Trade | 24 (100.0%) | 0 (0.0%) |
| Retail Trade | 90 (46.6%) | 103 (53.4%) |
| Transportation & Warehousing | 0 (0.0%) | 0 (0.0%) |
| Utilities | 0 (0.0%) | 29 (100.0%) |
| Information | 0 (0.0%) | 0 (0.0%) |
| Finance & Insurance | 0 (0.0%) | 0 (0.0%) |
| Real Estate, Rental & Leasing | 0 (0.0%) | 0 (0.0%) |
| Professional & Scientific | 0 (0.0%) | 0 (0.0%) |
| Enterprise Management | 0 (0.0%) | 0 (0.0%) |
| Administrative & Support | 18 (45.0%) | 22 (55.0%) |
| Educational Services | 0 (0.0%) | 41 (100.0%) |
| Health Care & Social Assistance | 39 (57.4%) | 29 (42.6%) |
| Arts, Entertainment & Recreation | 0 (0.0%) | 0 (0.0%) |
| Accommodation & Food Services | 0 (0.0%) | 44 (100.0%) |
| Public Administration | 17 (46.0%) | 20 (54.0%) |
| Total | 252 (46.7%) | 288 (53.3%) |
Education in H Rivera Colon
School Enrollment in H Rivera Colon
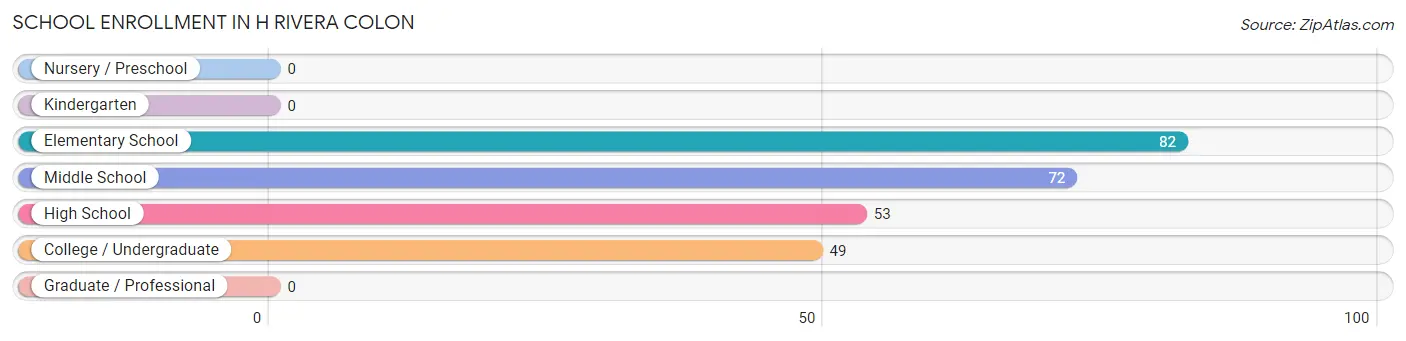
The most common levels of schooling among the 256 students in H Rivera Colon are elementary school (82 | 32.0%), middle school (72 | 28.1%), and high school (53 | 20.7%).
| School Level | # Students | % Students |
| Nursery / Preschool | 0 | 0.0% |
| Kindergarten | 0 | 0.0% |
| Elementary School | 82 | 32.0% |
| Middle School | 72 | 28.1% |
| High School | 53 | 20.7% |
| College / Undergraduate | 49 | 19.1% |
| Graduate / Professional | 0 | 0.0% |
| Total | 256 | 100.0% |
School Enrollment by Age by Funding Source in H Rivera Colon
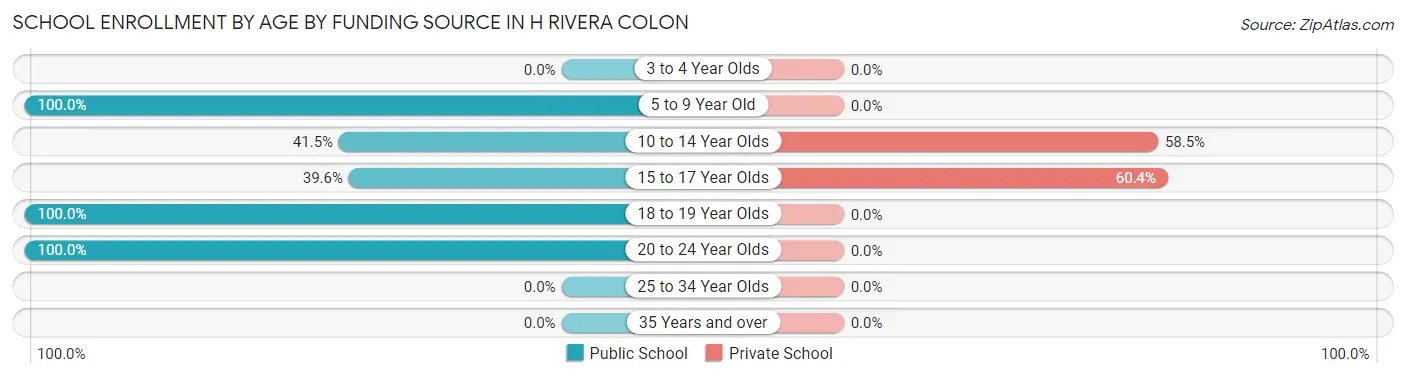
Out of a total of 256 students who are enrolled in schools in H Rivera Colon, 56 (21.9%) attend a private institution, while the remaining 200 (78.1%) are enrolled in public schools. The age group of 15 to 17 year olds has the highest likelihood of being enrolled in private schools, with 32 (60.4% in the age bracket) enrolled. Conversely, the age group of 5 to 9 year old has the lowest likelihood of being enrolled in a private school, with 113 (100.0% in the age bracket) attending a public institution.
| Age Bracket | Public School | Private School |
| 3 to 4 Year Olds | 0 (0.0%) | 0 (0.0%) |
| 5 to 9 Year Old | 113 (100.0%) | 0 (0.0%) |
| 10 to 14 Year Olds | 17 (41.5%) | 24 (58.5%) |
| 15 to 17 Year Olds | 21 (39.6%) | 32 (60.4%) |
| 18 to 19 Year Olds | 22 (100.0%) | 0 (0.0%) |
| 20 to 24 Year Olds | 27 (100.0%) | 0 (0.0%) |
| 25 to 34 Year Olds | 0 (0.0%) | 0 (0.0%) |
| 35 Years and over | 0 (0.0%) | 0 (0.0%) |
| Total | 200 (78.1%) | 56 (21.9%) |
Educational Attainment by Field of Study in H Rivera Colon
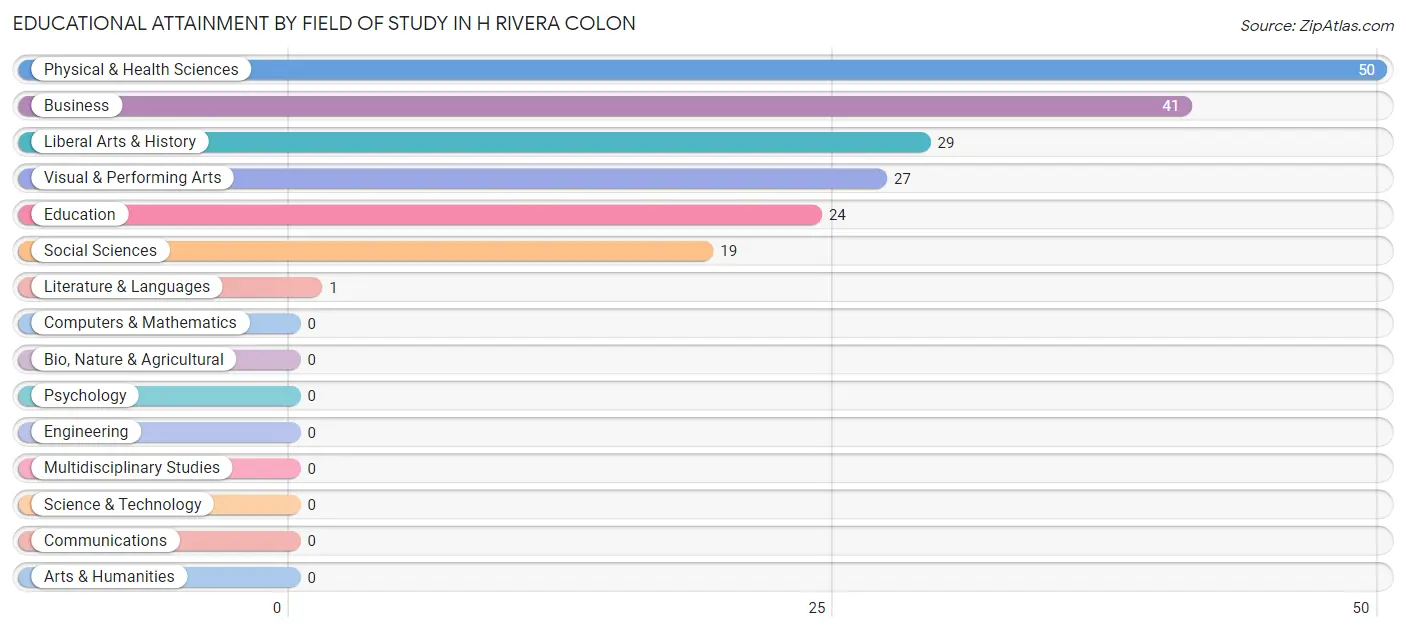
Physical & health sciences (50 | 26.2%), business (41 | 21.5%), liberal arts & history (29 | 15.2%), visual & performing arts (27 | 14.1%), and education (24 | 12.6%) are the most common fields of study among 191 individuals in H Rivera Colon who have obtained a bachelor's degree or higher.
| Field of Study | # Graduates | % Graduates |
| Computers & Mathematics | 0 | 0.0% |
| Bio, Nature & Agricultural | 0 | 0.0% |
| Physical & Health Sciences | 50 | 26.2% |
| Psychology | 0 | 0.0% |
| Social Sciences | 19 | 10.0% |
| Engineering | 0 | 0.0% |
| Multidisciplinary Studies | 0 | 0.0% |
| Science & Technology | 0 | 0.0% |
| Business | 41 | 21.5% |
| Education | 24 | 12.6% |
| Literature & Languages | 1 | 0.5% |
| Liberal Arts & History | 29 | 15.2% |
| Visual & Performing Arts | 27 | 14.1% |
| Communications | 0 | 0.0% |
| Arts & Humanities | 0 | 0.0% |
| Total | 191 | 100.0% |
Transportation & Commute in H Rivera Colon
Vehicle Availability by Sex in H Rivera Colon
The most prevalent vehicle ownership categories in H Rivera Colon are males with 4 vehicles (78, accounting for 31.2%) and females with 4 vehicles (58, making up 27.1%).
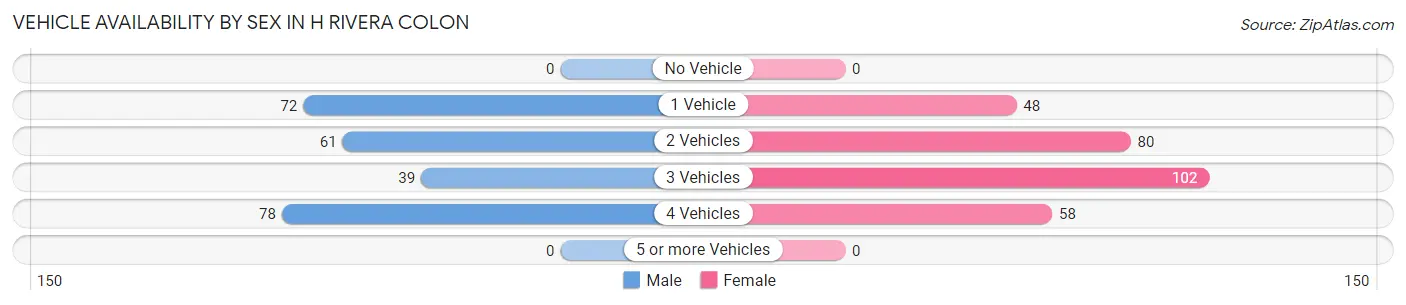
| Vehicles Available | Male | Female |
| No Vehicle | 0 (0.0%) | 0 (0.0%) |
| 1 Vehicle | 72 (28.8%) | 48 (16.7%) |
| 2 Vehicles | 61 (24.4%) | 80 (27.8%) |
| 3 Vehicles | 39 (15.6%) | 102 (35.4%) |
| 4 Vehicles | 78 (31.2%) | 58 (20.1%) |
| 5 or more Vehicles | 0 (0.0%) | 0 (0.0%) |
| Total | 250 (100.0%) | 288 (100.0%) |
Commute Time in H Rivera Colon
The most frequently occuring commute durations in H Rivera Colon are 60 to 89 minutes (99 commuters, 18.4%), 20 to 24 minutes (93 commuters, 17.3%), and 45 to 59 minutes (77 commuters, 14.3%).
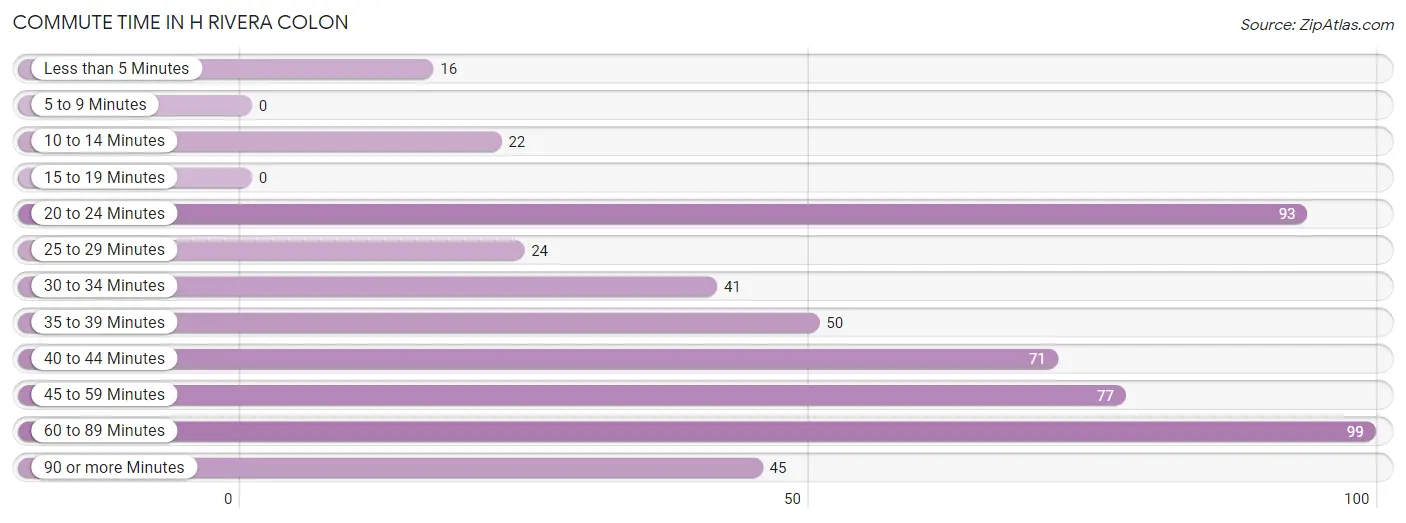
| Commute Time | # Commuters | % Commuters |
| Less than 5 Minutes | 16 | 3.0% |
| 5 to 9 Minutes | 0 | 0.0% |
| 10 to 14 Minutes | 22 | 4.1% |
| 15 to 19 Minutes | 0 | 0.0% |
| 20 to 24 Minutes | 93 | 17.3% |
| 25 to 29 Minutes | 24 | 4.5% |
| 30 to 34 Minutes | 41 | 7.6% |
| 35 to 39 Minutes | 50 | 9.3% |
| 40 to 44 Minutes | 71 | 13.2% |
| 45 to 59 Minutes | 77 | 14.3% |
| 60 to 89 Minutes | 99 | 18.4% |
| 90 or more Minutes | 45 | 8.4% |
Commute Time by Sex in H Rivera Colon
The most common commute times in H Rivera Colon are 35 to 39 minutes (50 commuters, 20.0%) for males and 20 to 24 minutes (78 commuters, 27.1%) for females.
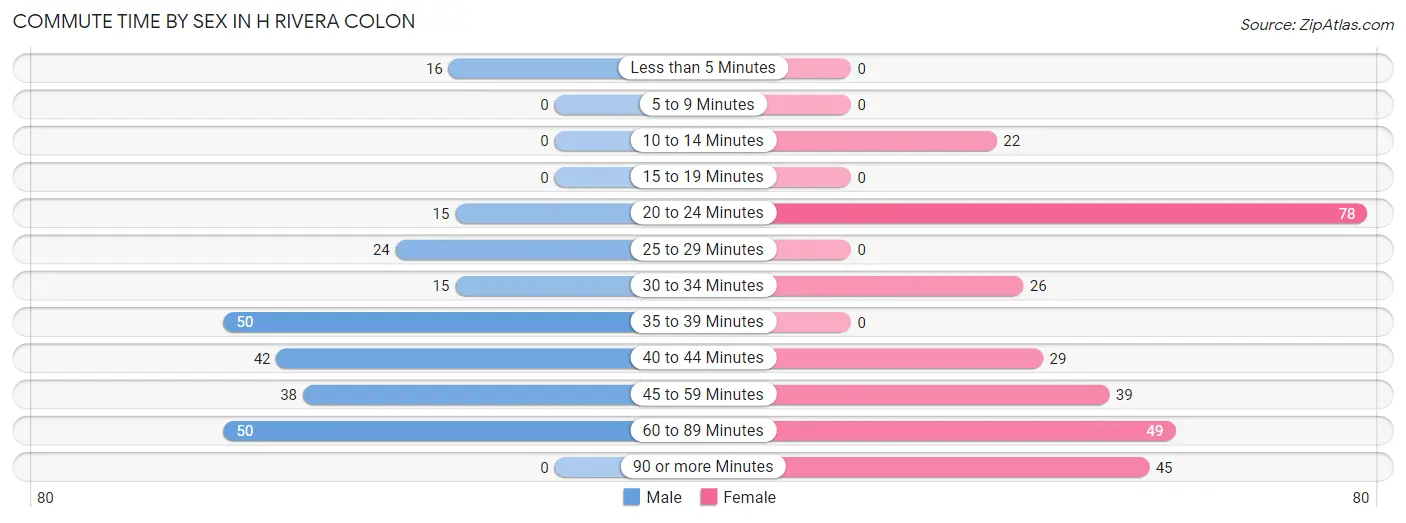
| Commute Time | Male | Female |
| Less than 5 Minutes | 16 (6.4%) | 0 (0.0%) |
| 5 to 9 Minutes | 0 (0.0%) | 0 (0.0%) |
| 10 to 14 Minutes | 0 (0.0%) | 22 (7.6%) |
| 15 to 19 Minutes | 0 (0.0%) | 0 (0.0%) |
| 20 to 24 Minutes | 15 (6.0%) | 78 (27.1%) |
| 25 to 29 Minutes | 24 (9.6%) | 0 (0.0%) |
| 30 to 34 Minutes | 15 (6.0%) | 26 (9.0%) |
| 35 to 39 Minutes | 50 (20.0%) | 0 (0.0%) |
| 40 to 44 Minutes | 42 (16.8%) | 29 (10.1%) |
| 45 to 59 Minutes | 38 (15.2%) | 39 (13.5%) |
| 60 to 89 Minutes | 50 (20.0%) | 49 (17.0%) |
| 90 or more Minutes | 0 (0.0%) | 45 (15.6%) |
Time of Departure to Work by Sex in H Rivera Colon
The most frequent times of departure to work in H Rivera Colon are 5:30 AM to 5:59 AM (113, 45.2%) for males and 5:30 AM to 5:59 AM (127, 44.1%) for females.
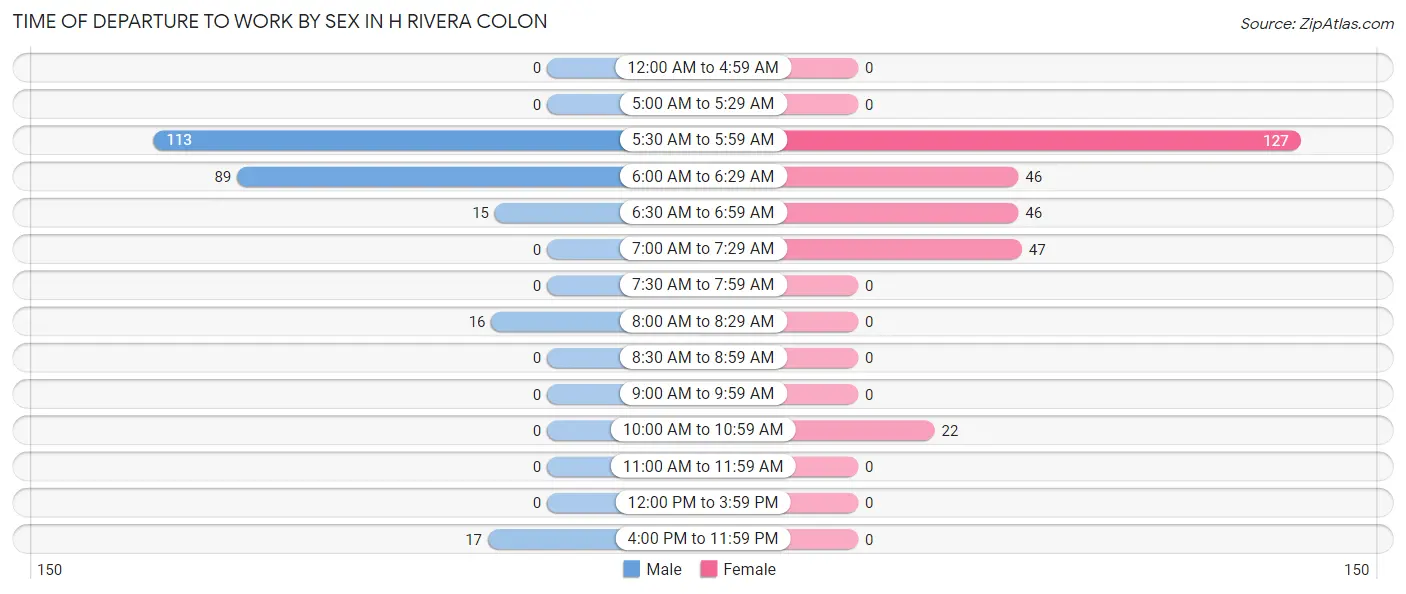
| Time of Departure | Male | Female |
| 12:00 AM to 4:59 AM | 0 (0.0%) | 0 (0.0%) |
| 5:00 AM to 5:29 AM | 0 (0.0%) | 0 (0.0%) |
| 5:30 AM to 5:59 AM | 113 (45.2%) | 127 (44.1%) |
| 6:00 AM to 6:29 AM | 89 (35.6%) | 46 (16.0%) |
| 6:30 AM to 6:59 AM | 15 (6.0%) | 46 (16.0%) |
| 7:00 AM to 7:29 AM | 0 (0.0%) | 47 (16.3%) |
| 7:30 AM to 7:59 AM | 0 (0.0%) | 0 (0.0%) |
| 8:00 AM to 8:29 AM | 16 (6.4%) | 0 (0.0%) |
| 8:30 AM to 8:59 AM | 0 (0.0%) | 0 (0.0%) |
| 9:00 AM to 9:59 AM | 0 (0.0%) | 0 (0.0%) |
| 10:00 AM to 10:59 AM | 0 (0.0%) | 22 (7.6%) |
| 11:00 AM to 11:59 AM | 0 (0.0%) | 0 (0.0%) |
| 12:00 PM to 3:59 PM | 0 (0.0%) | 0 (0.0%) |
| 4:00 PM to 11:59 PM | 17 (6.8%) | 0 (0.0%) |
| Total | 250 (100.0%) | 288 (100.0%) |
Housing Occupancy in H Rivera Colon
Occupancy by Ownership in H Rivera Colon
Of the total 851 dwellings in H Rivera Colon, owner-occupied units account for 594 (69.8%), while renter-occupied units make up 257 (30.2%).
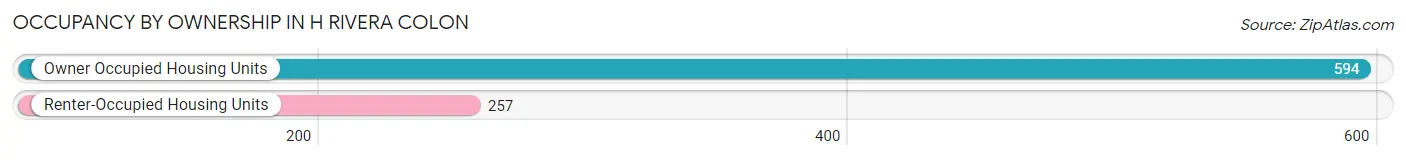
| Occupancy | # Housing Units | % Housing Units |
| Owner Occupied Housing Units | 594 | 69.8% |
| Renter-Occupied Housing Units | 257 | 30.2% |
| Total Occupied Housing Units | 851 | 100.0% |
Occupancy by Household Size in H Rivera Colon
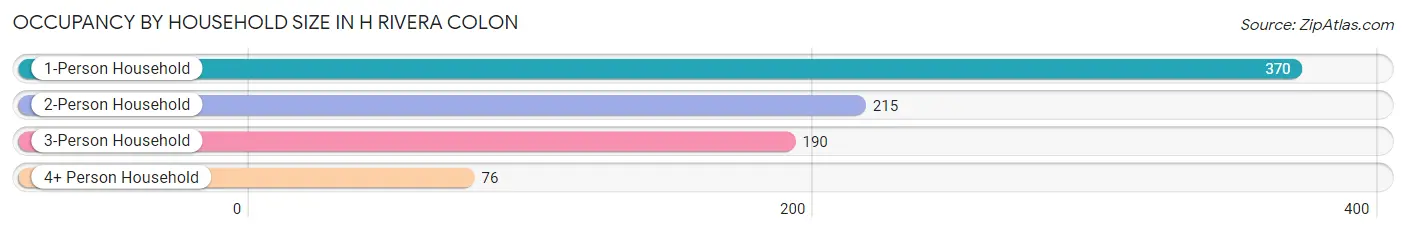
| Household Size | # Housing Units | % Housing Units |
| 1-Person Household | 370 | 43.5% |
| 2-Person Household | 215 | 25.3% |
| 3-Person Household | 190 | 22.3% |
| 4+ Person Household | 76 | 8.9% |
| Total Housing Units | 851 | 100.0% |
Occupancy by Ownership by Household Size in H Rivera Colon
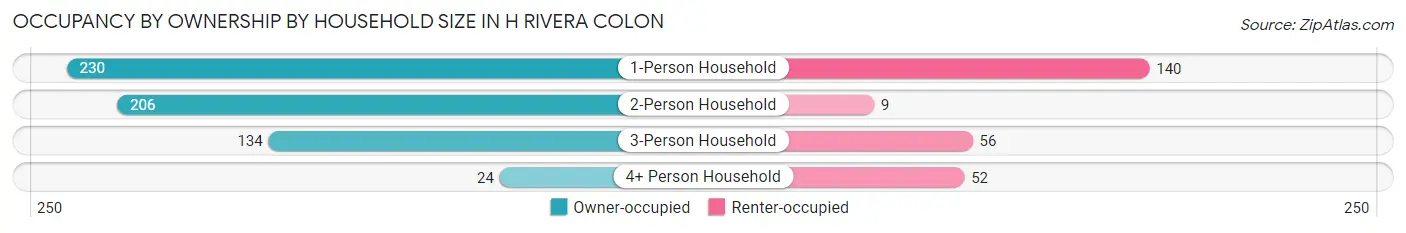
| Household Size | Owner-occupied | Renter-occupied |
| 1-Person Household | 230 (62.2%) | 140 (37.8%) |
| 2-Person Household | 206 (95.8%) | 9 (4.2%) |
| 3-Person Household | 134 (70.5%) | 56 (29.5%) |
| 4+ Person Household | 24 (31.6%) | 52 (68.4%) |
| Total Housing Units | 594 (69.8%) | 257 (30.2%) |
Occupancy by Educational Attainment in H Rivera Colon
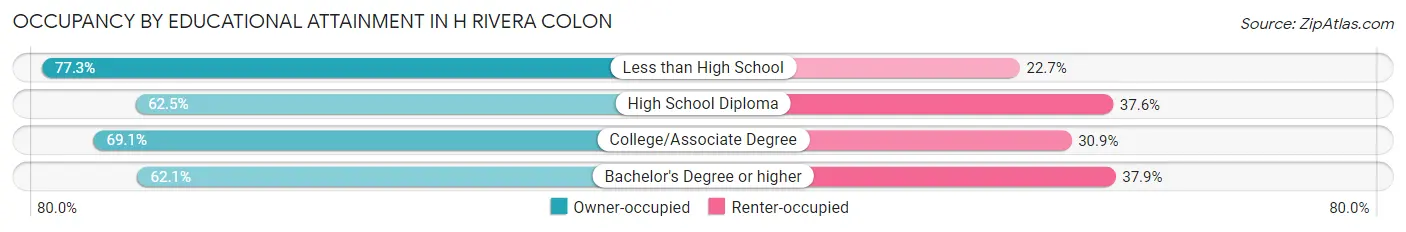
| Household Size | Owner-occupied | Renter-occupied |
| Less than High School | 265 (77.3%) | 78 (22.7%) |
| High School Diploma | 168 (62.5%) | 101 (37.6%) |
| College/Associate Degree | 125 (69.1%) | 56 (30.9%) |
| Bachelor's Degree or higher | 36 (62.1%) | 22 (37.9%) |
Occupancy by Age of Householder in H Rivera Colon
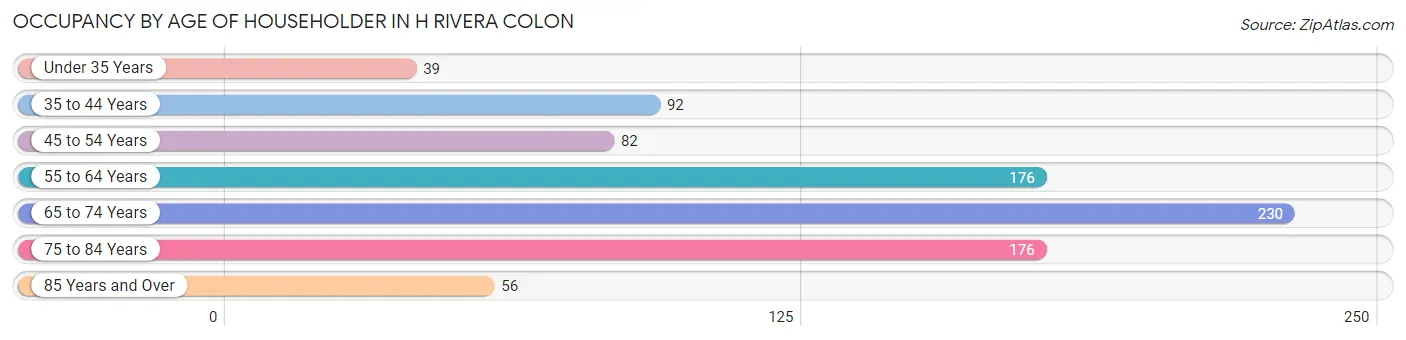
| Age Bracket | # Households | % Households |
| Under 35 Years | 39 | 4.6% |
| 35 to 44 Years | 92 | 10.8% |
| 45 to 54 Years | 82 | 9.6% |
| 55 to 64 Years | 176 | 20.7% |
| 65 to 74 Years | 230 | 27.0% |
| 75 to 84 Years | 176 | 20.7% |
| 85 Years and Over | 56 | 6.6% |
| Total | 851 | 100.0% |
Housing Finances in H Rivera Colon
Median Income by Occupancy in H Rivera Colon
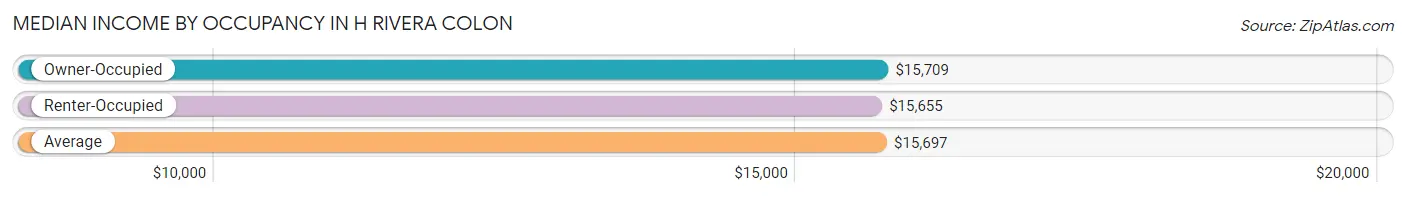
| Occupancy Type | # Households | Median Income |
| Owner-Occupied | 594 (69.8%) | $15,709 |
| Renter-Occupied | 257 (30.2%) | $15,655 |
| Average | 851 (100.0%) | $15,697 |
Occupancy by Householder Income Bracket in H Rivera Colon
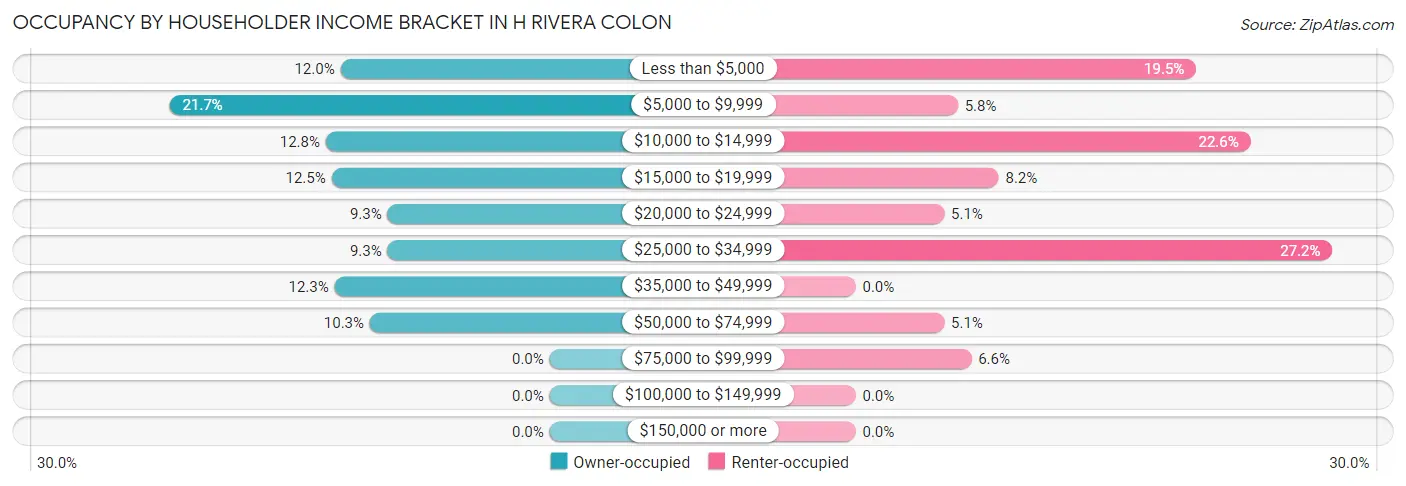
| Income Bracket | Owner-occupied | Renter-occupied |
| Less than $5,000 | 71 (11.9%) | 50 (19.5%) |
| $5,000 to $9,999 | 129 (21.7%) | 15 (5.8%) |
| $10,000 to $14,999 | 76 (12.8%) | 58 (22.6%) |
| $15,000 to $19,999 | 74 (12.5%) | 21 (8.2%) |
| $20,000 to $24,999 | 55 (9.3%) | 13 (5.1%) |
| $25,000 to $34,999 | 55 (9.3%) | 70 (27.2%) |
| $35,000 to $49,999 | 73 (12.3%) | 0 (0.0%) |
| $50,000 to $74,999 | 61 (10.3%) | 13 (5.1%) |
| $75,000 to $99,999 | 0 (0.0%) | 17 (6.6%) |
| $100,000 to $149,999 | 0 (0.0%) | 0 (0.0%) |
| $150,000 or more | 0 (0.0%) | 0 (0.0%) |
| Total | 594 (100.0%) | 257 (100.0%) |
Monthly Housing Cost Tiers in H Rivera Colon
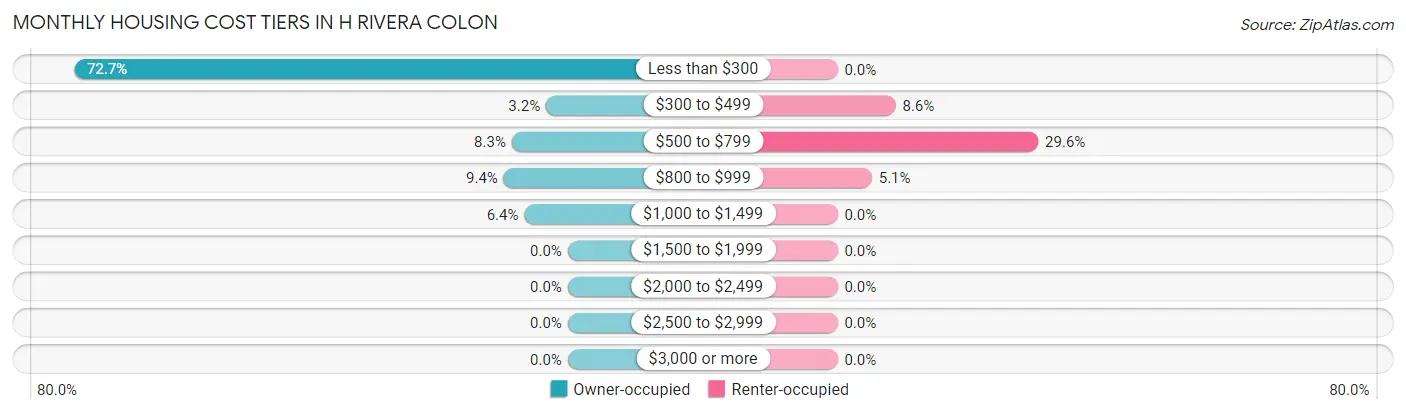
| Monthly Cost | Owner-occupied | Renter-occupied |
| Less than $300 | 432 (72.7%) | 0 (0.0%) |
| $300 to $499 | 19 (3.2%) | 22 (8.6%) |
| $500 to $799 | 49 (8.3%) | 76 (29.6%) |
| $800 to $999 | 56 (9.4%) | 13 (5.1%) |
| $1,000 to $1,499 | 38 (6.4%) | 0 (0.0%) |
| $1,500 to $1,999 | 0 (0.0%) | 0 (0.0%) |
| $2,000 to $2,499 | 0 (0.0%) | 0 (0.0%) |
| $2,500 to $2,999 | 0 (0.0%) | 0 (0.0%) |
| $3,000 or more | 0 (0.0%) | 0 (0.0%) |
| Total | 594 (100.0%) | 257 (100.0%) |
Physical Housing Characteristics in H Rivera Colon
Housing Structures in H Rivera Colon
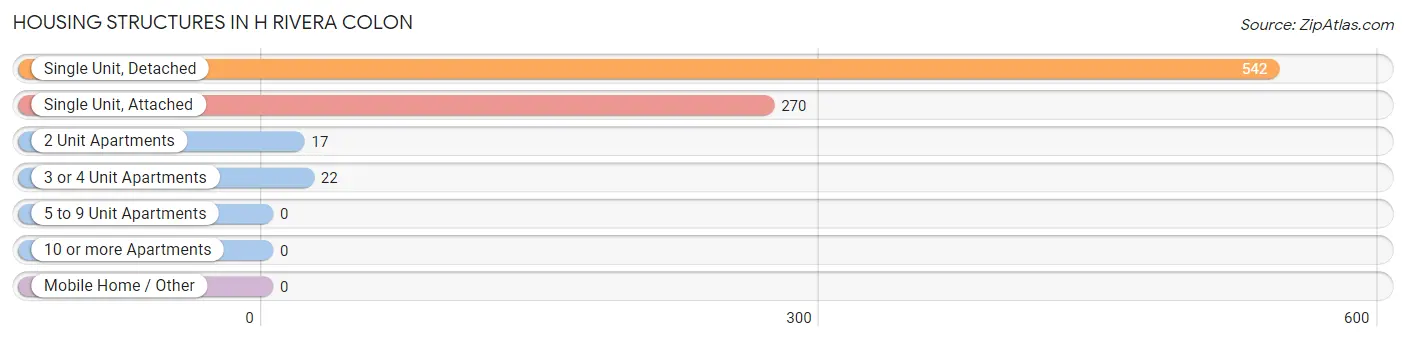
| Structure Type | # Housing Units | % Housing Units |
| Single Unit, Detached | 542 | 63.7% |
| Single Unit, Attached | 270 | 31.7% |
| 2 Unit Apartments | 17 | 2.0% |
| 3 or 4 Unit Apartments | 22 | 2.6% |
| 5 to 9 Unit Apartments | 0 | 0.0% |
| 10 or more Apartments | 0 | 0.0% |
| Mobile Home / Other | 0 | 0.0% |
| Total | 851 | 100.0% |
Housing Structures by Occupancy in H Rivera Colon
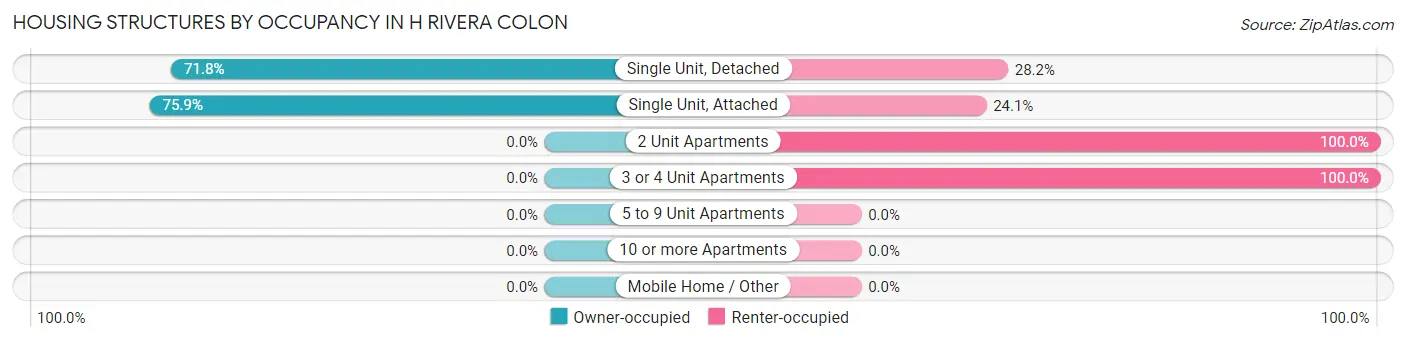
| Structure Type | Owner-occupied | Renter-occupied |
| Single Unit, Detached | 389 (71.8%) | 153 (28.2%) |
| Single Unit, Attached | 205 (75.9%) | 65 (24.1%) |
| 2 Unit Apartments | 0 (0.0%) | 17 (100.0%) |
| 3 or 4 Unit Apartments | 0 (0.0%) | 22 (100.0%) |
| 5 to 9 Unit Apartments | 0 (0.0%) | 0 (0.0%) |
| 10 or more Apartments | 0 (0.0%) | 0 (0.0%) |
| Mobile Home / Other | 0 (0.0%) | 0 (0.0%) |
| Total | 594 (69.8%) | 257 (30.2%) |
Housing Structures by Number of Rooms in H Rivera Colon
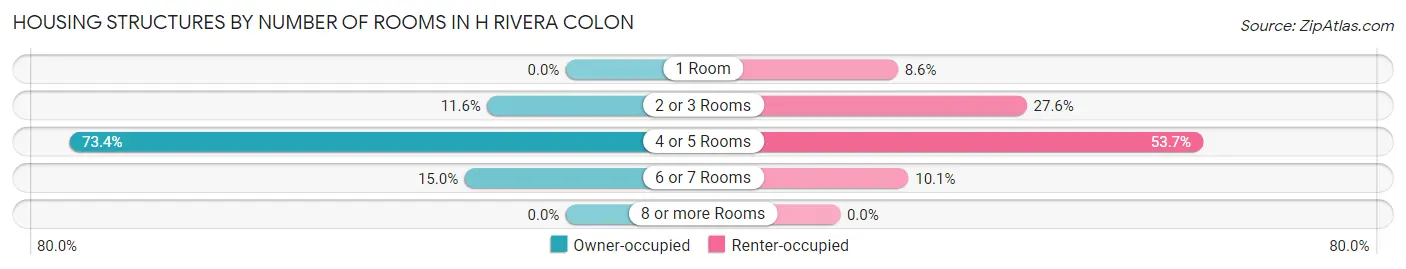
| Number of Rooms | Owner-occupied | Renter-occupied |
| 1 Room | 0 (0.0%) | 22 (8.6%) |
| 2 or 3 Rooms | 69 (11.6%) | 71 (27.6%) |
| 4 or 5 Rooms | 436 (73.4%) | 138 (53.7%) |
| 6 or 7 Rooms | 89 (15.0%) | 26 (10.1%) |
| 8 or more Rooms | 0 (0.0%) | 0 (0.0%) |
| Total | 594 (100.0%) | 257 (100.0%) |
Housing Structure by Heating Type in H Rivera Colon
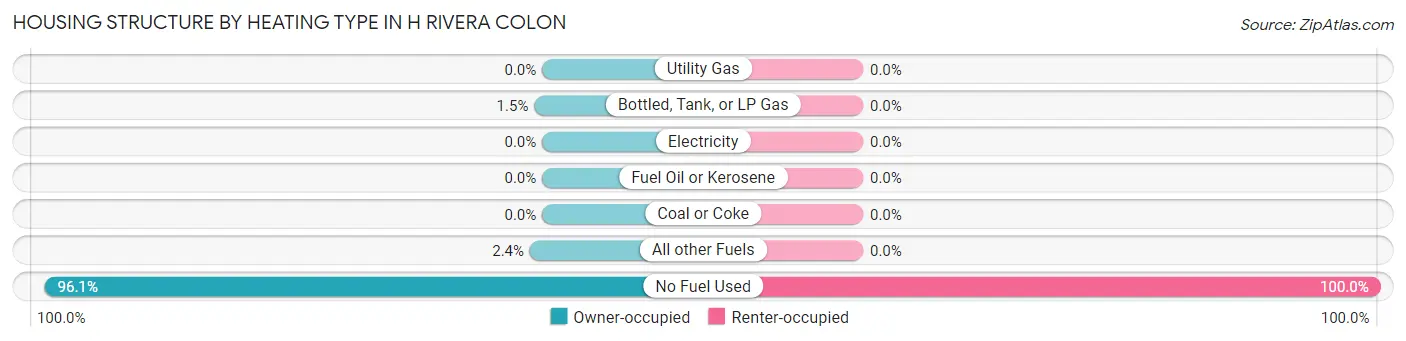
| Heating Type | Owner-occupied | Renter-occupied |
| Utility Gas | 0 (0.0%) | 0 (0.0%) |
| Bottled, Tank, or LP Gas | 9 (1.5%) | 0 (0.0%) |
| Electricity | 0 (0.0%) | 0 (0.0%) |
| Fuel Oil or Kerosene | 0 (0.0%) | 0 (0.0%) |
| Coal or Coke | 0 (0.0%) | 0 (0.0%) |
| All other Fuels | 14 (2.4%) | 0 (0.0%) |
| No Fuel Used | 571 (96.1%) | 257 (100.0%) |
| Total | 594 (100.0%) | 257 (100.0%) |
Household Vehicle Usage in H Rivera Colon
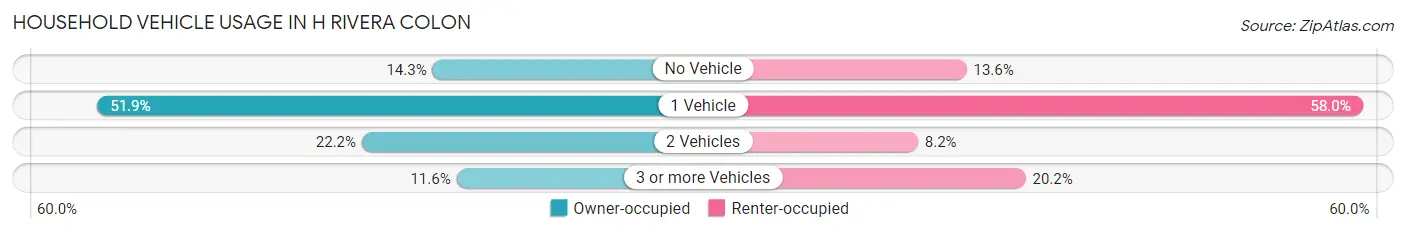
| Vehicles per Household | Owner-occupied | Renter-occupied |
| No Vehicle | 85 (14.3%) | 35 (13.6%) |
| 1 Vehicle | 308 (51.8%) | 149 (58.0%) |
| 2 Vehicles | 132 (22.2%) | 21 (8.2%) |
| 3 or more Vehicles | 69 (11.6%) | 52 (20.2%) |
| Total | 594 (100.0%) | 257 (100.0%) |
Real Estate & Mortgages in H Rivera Colon
Real Estate and Mortgage Overview in H Rivera Colon
| Characteristic | Without Mortgage | With Mortgage |
| Housing Units | 451 | 143 |
| Median Property Value | $82,500 | $123,400 |
| Median Household Income | $11,328 | $0 |
| Monthly Housing Costs | $167 | $0 |
| Real Estate Taxes | - | - |
Property Value by Mortgage Status in H Rivera Colon
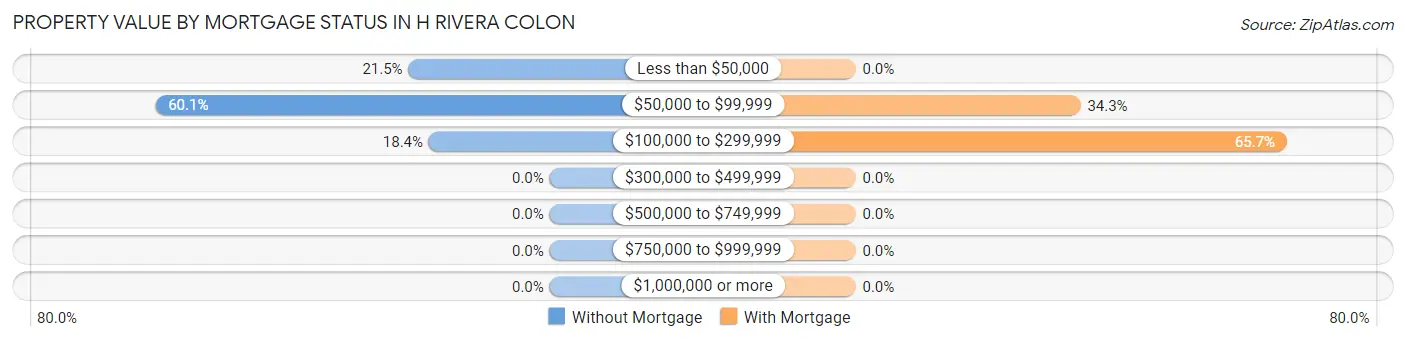
| Property Value | Without Mortgage | With Mortgage |
| Less than $50,000 | 97 (21.5%) | 0 (0.0%) |
| $50,000 to $99,999 | 271 (60.1%) | 49 (34.3%) |
| $100,000 to $299,999 | 83 (18.4%) | 94 (65.7%) |
| $300,000 to $499,999 | 0 (0.0%) | 0 (0.0%) |
| $500,000 to $749,999 | 0 (0.0%) | 0 (0.0%) |
| $750,000 to $999,999 | 0 (0.0%) | 0 (0.0%) |
| $1,000,000 or more | 0 (0.0%) | 0 (0.0%) |
| Total | 451 (100.0%) | 143 (100.0%) |
Household Income by Mortgage Status in H Rivera Colon
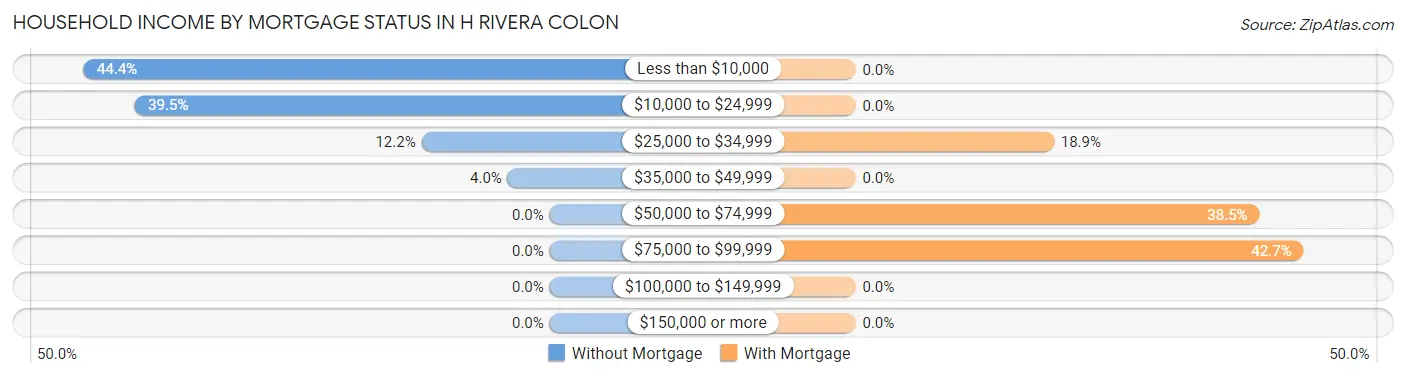
| Household Income | Without Mortgage | With Mortgage |
| Less than $10,000 | 200 (44.4%) | 0 (0.0%) |
| $10,000 to $24,999 | 178 (39.5%) | 0 (0.0%) |
| $25,000 to $34,999 | 55 (12.2%) | 27 (18.9%) |
| $35,000 to $49,999 | 18 (4.0%) | 0 (0.0%) |
| $50,000 to $74,999 | 0 (0.0%) | 55 (38.5%) |
| $75,000 to $99,999 | 0 (0.0%) | 61 (42.7%) |
| $100,000 to $149,999 | 0 (0.0%) | 0 (0.0%) |
| $150,000 or more | 0 (0.0%) | 0 (0.0%) |
| Total | 451 (100.0%) | 143 (100.0%) |
Property Value to Household Income Ratio in H Rivera Colon
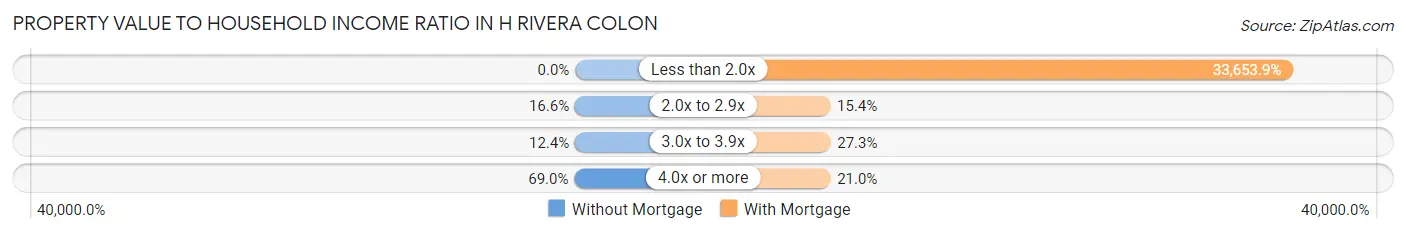
| Value-to-Income Ratio | Without Mortgage | With Mortgage |
| Less than 2.0x | 0 (0.0%) | 48,125 (33,653.8%) |
| 2.0x to 2.9x | 75 (16.6%) | 22 (15.4%) |
| 3.0x to 3.9x | 56 (12.4%) | 39 (27.3%) |
| 4.0x or more | 311 (69.0%) | 30 (21.0%) |
| Total | 451 (100.0%) | 143 (100.0%) |
Real Estate Taxes by Mortgage Status in H Rivera Colon
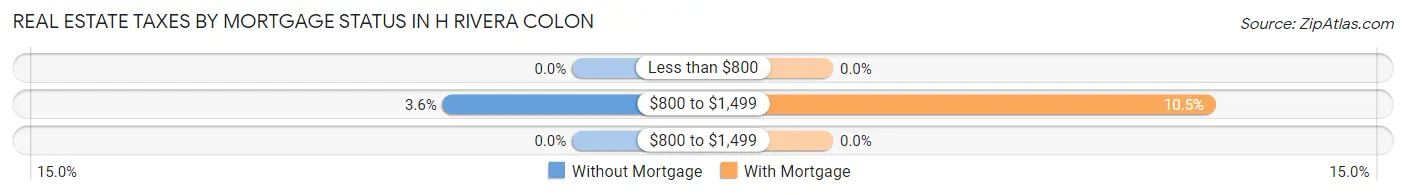
| Property Taxes | Without Mortgage | With Mortgage |
| Less than $800 | 0 (0.0%) | 0 (0.0%) |
| $800 to $1,499 | 16 (3.5%) | 15 (10.5%) |
| $800 to $1,499 | 0 (0.0%) | 0 (0.0%) |
| Total | 451 (100.0%) | 143 (100.0%) |
Health & Disability in H Rivera Colon
Health Insurance Coverage by Age in H Rivera Colon
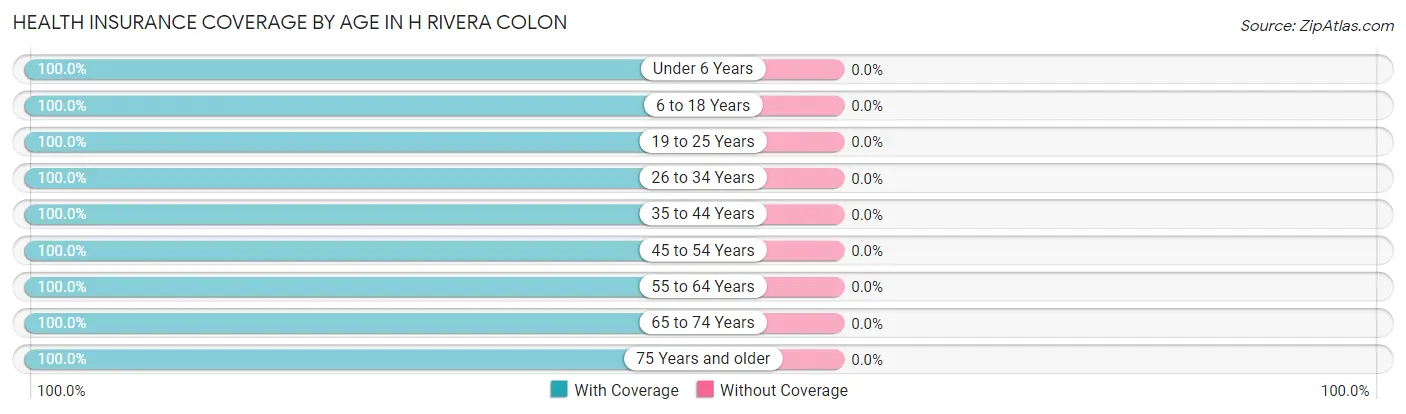
| Age Bracket | With Coverage | Without Coverage |
| Under 6 Years | 25 (100.0%) | 0 (0.0%) |
| 6 to 18 Years | 226 (100.0%) | 0 (0.0%) |
| 19 to 25 Years | 80 (100.0%) | 0 (0.0%) |
| 26 to 34 Years | 212 (100.0%) | 0 (0.0%) |
| 35 to 44 Years | 194 (100.0%) | 0 (0.0%) |
| 45 to 54 Years | 243 (100.0%) | 0 (0.0%) |
| 55 to 64 Years | 337 (100.0%) | 0 (0.0%) |
| 65 to 74 Years | 319 (100.0%) | 0 (0.0%) |
| 75 Years and older | 333 (100.0%) | 0 (0.0%) |
| Total | 1,969 (100.0%) | 0 (0.0%) |
Health Insurance Coverage by Citizenship Status in H Rivera Colon
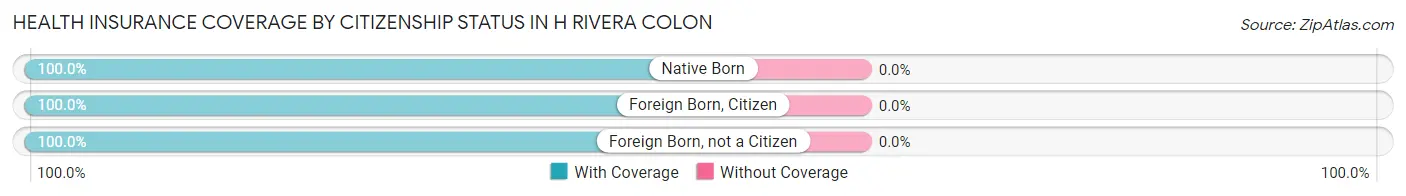
| Citizenship Status | With Coverage | Without Coverage |
| Native Born | 25 (100.0%) | 0 (0.0%) |
| Foreign Born, Citizen | 226 (100.0%) | 0 (0.0%) |
| Foreign Born, not a Citizen | 80 (100.0%) | 0 (0.0%) |
Health Insurance Coverage by Household Income in H Rivera Colon
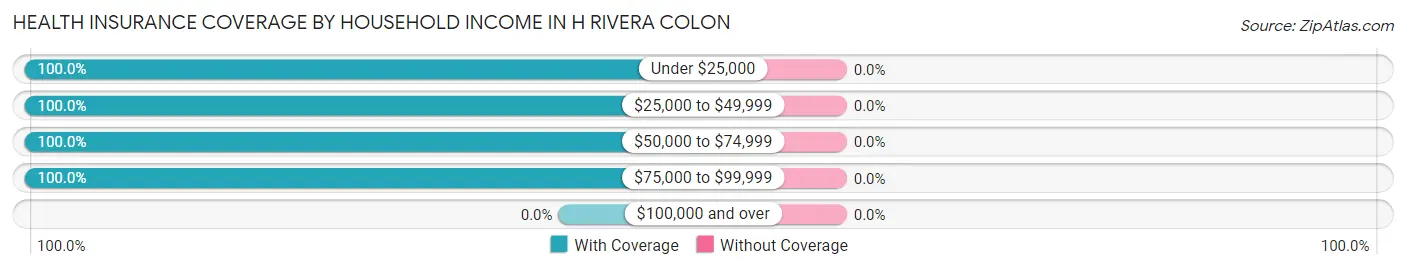
| Household Income | With Coverage | Without Coverage |
| Under $25,000 | 954 (100.0%) | 0 (0.0%) |
| $25,000 to $49,999 | 616 (100.0%) | 0 (0.0%) |
| $50,000 to $74,999 | 297 (100.0%) | 0 (0.0%) |
| $75,000 to $99,999 | 98 (100.0%) | 0 (0.0%) |
| $100,000 and over | 0 (0.0%) | 0 (0.0%) |
Public vs Private Health Insurance Coverage by Age in H Rivera Colon
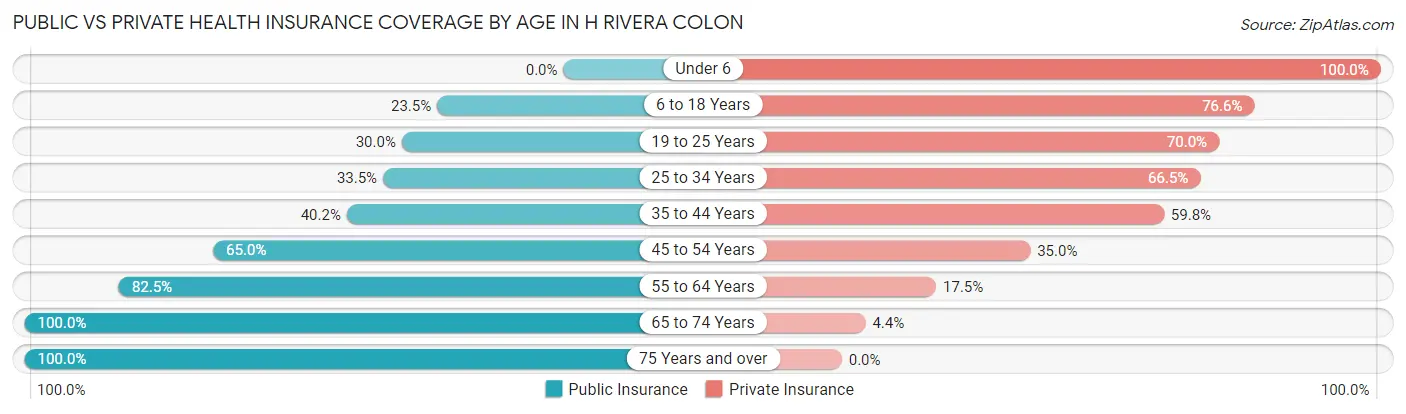
| Age Bracket | Public Insurance | Private Insurance |
| Under 6 | 0 (0.0%) | 25 (100.0%) |
| 6 to 18 Years | 53 (23.4%) | 173 (76.5%) |
| 19 to 25 Years | 24 (30.0%) | 56 (70.0%) |
| 25 to 34 Years | 71 (33.5%) | 141 (66.5%) |
| 35 to 44 Years | 78 (40.2%) | 116 (59.8%) |
| 45 to 54 Years | 158 (65.0%) | 85 (35.0%) |
| 55 to 64 Years | 278 (82.5%) | 59 (17.5%) |
| 65 to 74 Years | 319 (100.0%) | 14 (4.4%) |
| 75 Years and over | 333 (100.0%) | 0 (0.0%) |
| Total | 1,314 (66.7%) | 669 (34.0%) |
Disability Status by Sex by Age in H Rivera Colon
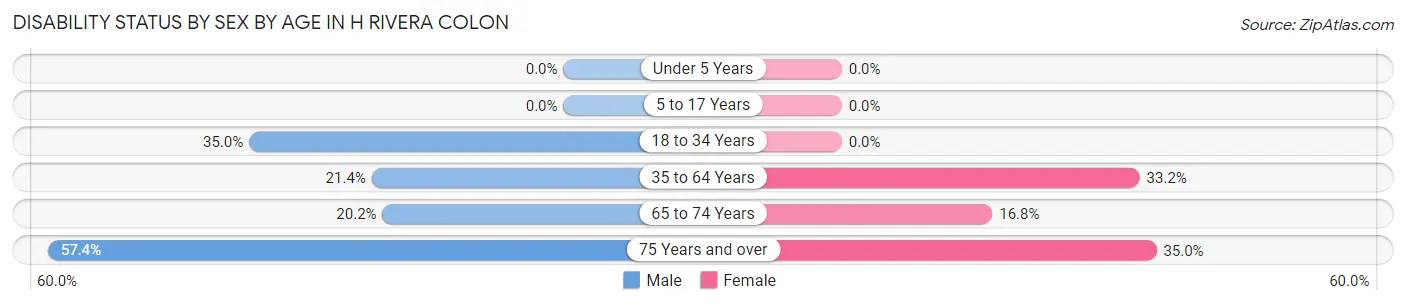
| Age Bracket | Male | Female |
| Under 5 Years | 0 (0.0%) | 0 (0.0%) |
| 5 to 17 Years | 0 (0.0%) | 0 (0.0%) |
| 18 to 34 Years | 49 (35.0%) | 0 (0.0%) |
| 35 to 64 Years | 79 (21.3%) | 134 (33.2%) |
| 65 to 74 Years | 27 (20.2%) | 31 (16.8%) |
| 75 Years and over | 124 (57.4%) | 41 (35.0%) |
Disability Class by Sex by Age in H Rivera Colon
Disability Class: Hearing Difficulty
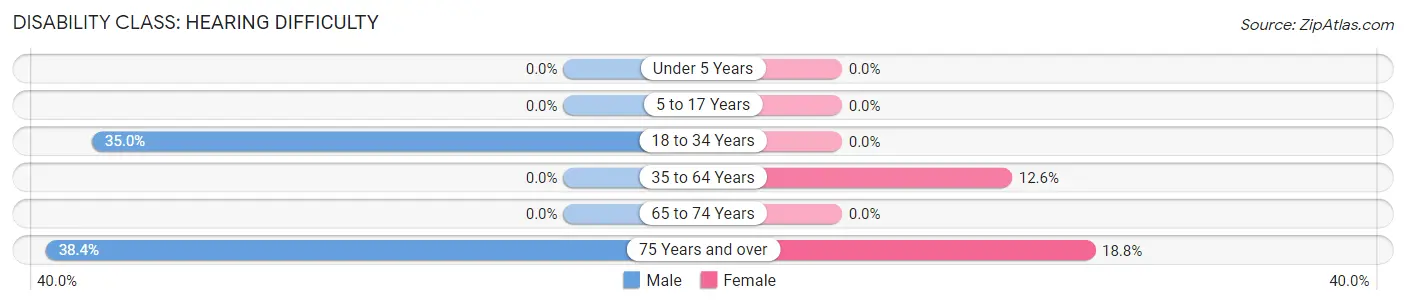
| Age Bracket | Male | Female |
| Under 5 Years | 0 (0.0%) | 0 (0.0%) |
| 5 to 17 Years | 0 (0.0%) | 0 (0.0%) |
| 18 to 34 Years | 49 (35.0%) | 0 (0.0%) |
| 35 to 64 Years | 0 (0.0%) | 51 (12.6%) |
| 65 to 74 Years | 0 (0.0%) | 0 (0.0%) |
| 75 Years and over | 83 (38.4%) | 22 (18.8%) |
Disability Class: Vision Difficulty
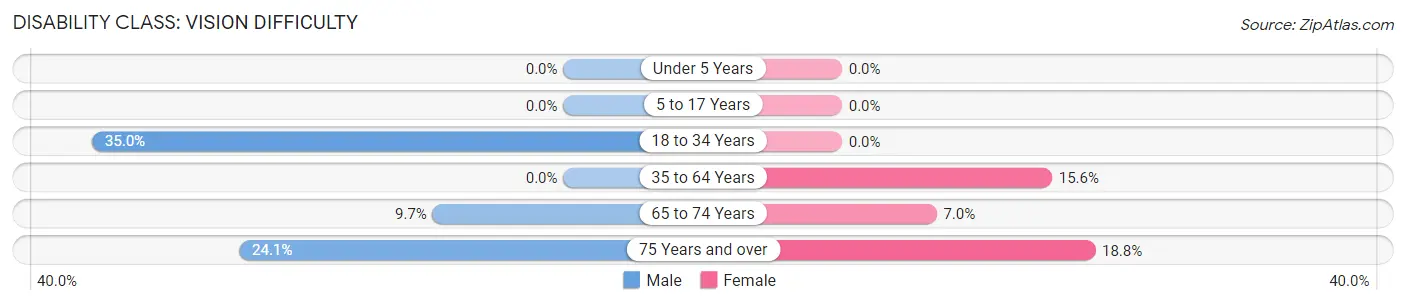
| Age Bracket | Male | Female |
| Under 5 Years | 0 (0.0%) | 0 (0.0%) |
| 5 to 17 Years | 0 (0.0%) | 0 (0.0%) |
| 18 to 34 Years | 49 (35.0%) | 0 (0.0%) |
| 35 to 64 Years | 0 (0.0%) | 63 (15.6%) |
| 65 to 74 Years | 13 (9.7%) | 13 (7.0%) |
| 75 Years and over | 52 (24.1%) | 22 (18.8%) |
Disability Class: Cognitive Difficulty
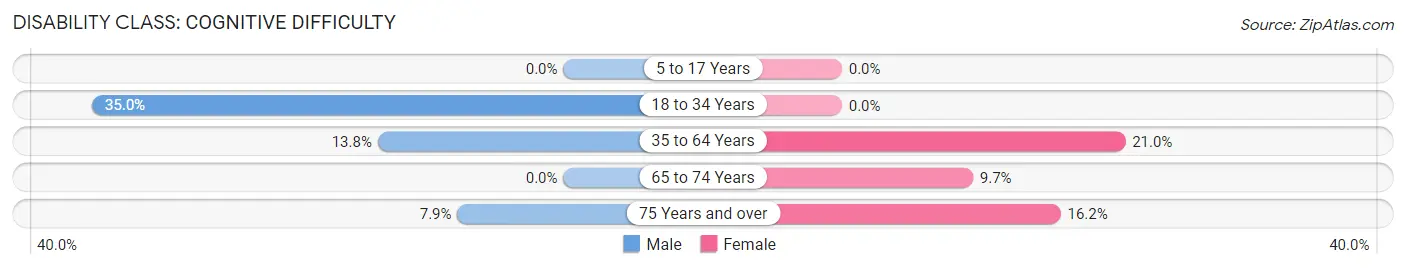
| Age Bracket | Male | Female |
| 5 to 17 Years | 0 (0.0%) | 0 (0.0%) |
| 18 to 34 Years | 49 (35.0%) | 0 (0.0%) |
| 35 to 64 Years | 51 (13.8%) | 85 (21.0%) |
| 65 to 74 Years | 0 (0.0%) | 18 (9.7%) |
| 75 Years and over | 17 (7.9%) | 19 (16.2%) |
Disability Class: Ambulatory Difficulty
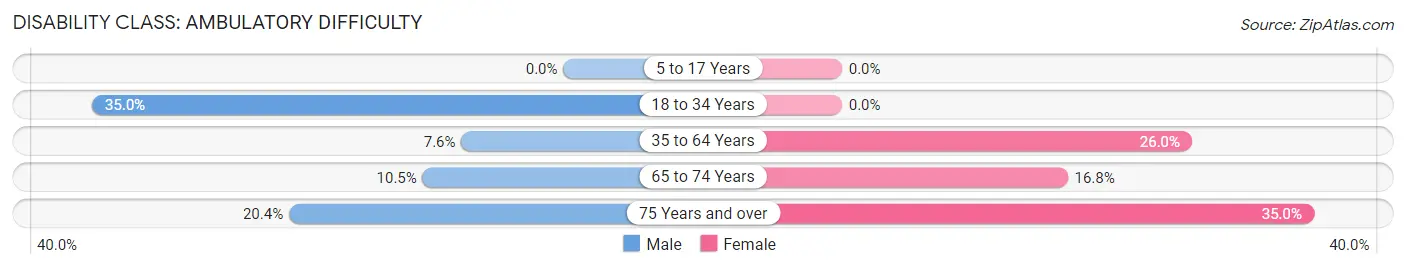
| Age Bracket | Male | Female |
| 5 to 17 Years | 0 (0.0%) | 0 (0.0%) |
| 18 to 34 Years | 49 (35.0%) | 0 (0.0%) |
| 35 to 64 Years | 28 (7.6%) | 105 (26.0%) |
| 65 to 74 Years | 14 (10.4%) | 31 (16.8%) |
| 75 Years and over | 44 (20.4%) | 41 (35.0%) |
Disability Class: Self-Care Difficulty
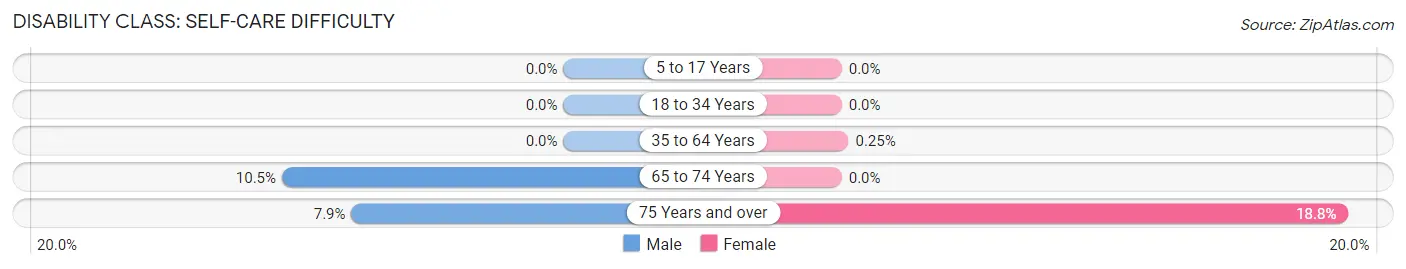
| Age Bracket | Male | Female |
| 5 to 17 Years | 0 (0.0%) | 0 (0.0%) |
| 18 to 34 Years | 0 (0.0%) | 0 (0.0%) |
| 35 to 64 Years | 0 (0.0%) | 1 (0.3%) |
| 65 to 74 Years | 14 (10.4%) | 0 (0.0%) |
| 75 Years and over | 17 (7.9%) | 22 (18.8%) |
Technology Access in H Rivera Colon
Computing Device Access in H Rivera Colon
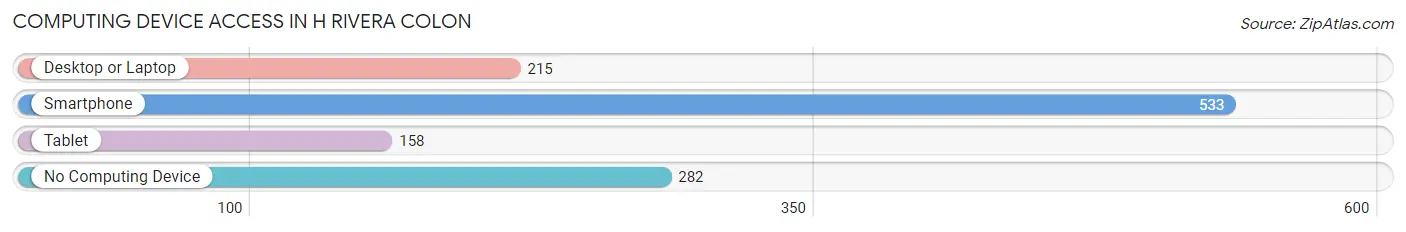
| Device Type | # Households | % Households |
| Desktop or Laptop | 215 | 25.3% |
| Smartphone | 533 | 62.6% |
| Tablet | 158 | 18.6% |
| No Computing Device | 282 | 33.1% |
| Total | 851 | 100.0% |
Internet Access in H Rivera Colon
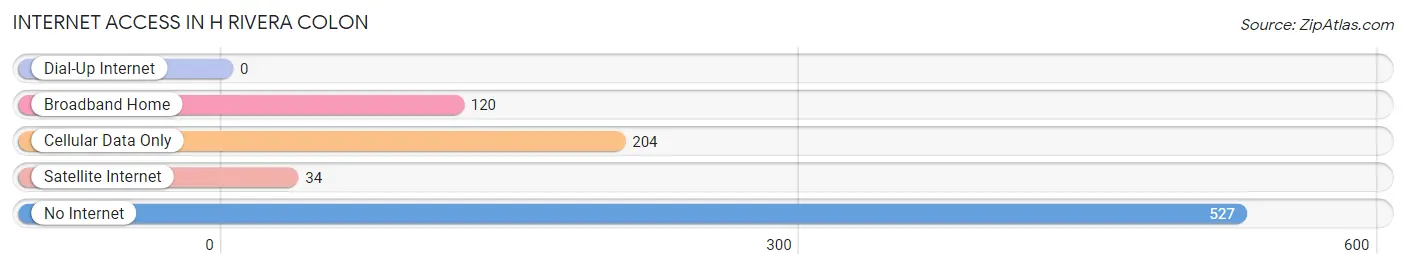
| Internet Type | # Households | % Households |
| Dial-Up Internet | 0 | 0.0% |
| Broadband Home | 120 | 14.1% |
| Cellular Data Only | 204 | 24.0% |
| Satellite Internet | 34 | 4.0% |
| No Internet | 527 | 61.9% |
| Total | 851 | 100.0% |
H Rivera Colon Summary
Puerto Rico, officially known as the Commonwealth of Puerto Rico, is an unincorporated territory of the United States located in the northeastern Caribbean Sea. It is an archipelago that includes the main island of Puerto Rico and a number of smaller islands, such as Vieques, Culebra, and Mona. The capital and most populous city is San Juan. With a population of 3.2 million, it is the third-largest island in the Caribbean after Cuba and Hispaniola.
History
The history of Puerto Rico dates back to the early 16th century when it was colonized by the Spanish. The island was originally inhabited by the Taíno people, who were later displaced by the Spanish. The Spanish established a settlement in 1508 and named it San Juan Bautista. The island was then divided into two provinces, San Juan and San Germán.
In 1898, after the Spanish-American War, Puerto Rico became a U.S. territory. In 1917, the Jones-Shafroth Act granted U.S. citizenship to all Puerto Ricans. In 1952, Puerto Rico became a Commonwealth of the United States, with its own constitution and government.
Geography
Puerto Rico is located in the northeastern Caribbean Sea, east of the Dominican Republic and west of the Virgin Islands. It is the smallest and most eastern of the Greater Antilles. The main island is approximately 100 miles long and 35 miles wide, with a total area of 3,515 square miles. The terrain is mostly mountainous, with the highest point being Cerro de Punta at 4,390 feet. The climate is tropical, with temperatures ranging from 70 to 90 degrees Fahrenheit.
Economy
Puerto Rico has a mixed economy, with a large public sector and a smaller private sector. The main industries are tourism, pharmaceuticals, and manufacturing. The government is the largest employer, followed by the tourism industry. The main exports are chemicals, electronics, and medical equipment.
The currency is the U.S. dollar, and the official language is Spanish. The per capita GDP was $18,000 in 2019.
Demographics
Puerto Rico has a population of 3.2 million, with a median age of 40.7 years. The population is mostly of Spanish and African descent, with smaller numbers of other ethnicities. The majority of the population is Roman Catholic, with smaller numbers of other Christian denominations.
The official language is Spanish but English is also widely spoken The literacy rate is 94 7
Conclusion
Puerto Rico is an unincorporated territory of the United States located in the northeastern Caribbean Sea. It has a rich history, diverse geography, and a mixed economy. The population is mostly of Spanish and African descent, with a median age of 40.7 years. The official language is Spanish, but English is also widely spoken. The per capita GDP was $18,000 in 2019.
Common Questions
What is Per Capita Income in H Rivera Colon?
Per Capita income in H Rivera Colon is $11,305.
What is the Median Family Income in H Rivera Colon?
Median Family Income in H Rivera Colon is $28,125.
What is the Median Household income in H Rivera Colon?
Median Household Income in H Rivera Colon is $15,697.
What is Income or Wage Gap in H Rivera Colon?
Income or Wage Gap in H Rivera Colon is 22.7%.
Women in H Rivera Colon earn 77.3 cents for every dollar earned by a man.
What is Family Income Deficit in H Rivera Colon?
Family Income Deficit in H Rivera Colon is $5,950.
Families that are below poverty line in H Rivera Colon earn $5,950 less on average than the poverty threshold level.
What is Inequality or Gini Index in H Rivera Colon?
Inequality or Gini Index in H Rivera Colon is 0.48.
What is the Total Population of H Rivera Colon?
Total Population of H Rivera Colon is 1,969.
What is the Total Male Population of H Rivera Colon?
Total Male Population of H Rivera Colon is 1,009.
What is the Total Female Population of H Rivera Colon?
Total Female Population of H Rivera Colon is 960.
What is the Ratio of Males per 100 Females in H Rivera Colon?
There are 105.10 Males per 100 Females in H Rivera Colon.
What is the Ratio of Females per 100 Males in H Rivera Colon?
There are 95.14 Females per 100 Males in H Rivera Colon.
What is the Median Population Age in H Rivera Colon?
Median Population Age in H Rivera Colon is 56.1 Years.
What is the Average Family Size in H Rivera Colon
Average Family Size in H Rivera Colon is 3.4 People.
What is the Average Household Size in H Rivera Colon
Average Household Size in H Rivera Colon is 2.3 People.
How Large is the Labor Force in H Rivera Colon?
There are 582 People in the Labor Forcein in H Rivera Colon.
What is the Percentage of People in the Labor Force in H Rivera Colon?
32.5% of People are in the Labor Force in H Rivera Colon.
What is the Unemployment Rate in H Rivera Colon?
Unemployment Rate in H Rivera Colon is 7.1%.