Zip Codes with the Highest Percentage of Families with Income Below $10,000 in Brooklyn, NY
RELATED REPORTS & OPTIONS
Family Income | $0-10k
Brooklyn
Compare Zip Codes
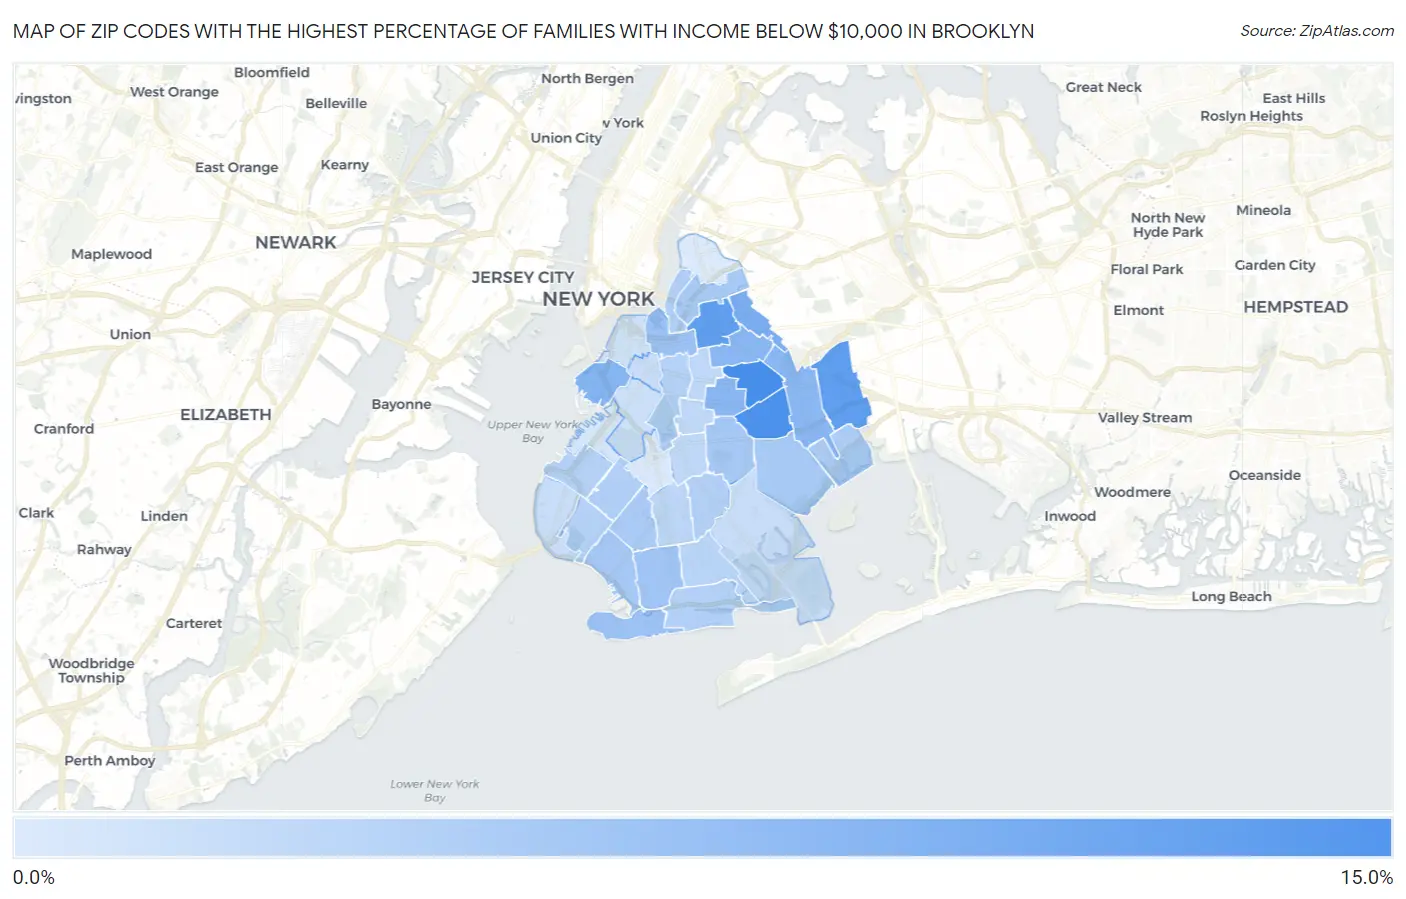
Map of Zip Codes with the Highest Percentage of Families with Income Below $10,000 in Brooklyn
1.0%
11.2%
Zip Codes with the Highest Percentage of Families with Income Below $10,000 in Brooklyn, NY
| Zip Code | Families with Income < $10k | vs State | vs National | |
| 1. | 11233 | 11.2% | 3.4%(+7.80)#67 | 3.1%(+8.10)#1,527 |
| 2. | 11212 | 10.8% | 3.4%(+7.40)#70 | 3.1%(+7.70)#1,642 |
| 3. | 11208 | 9.4% | 3.4%(+6.00)#91 | 3.1%(+6.30)#2,148 |
| 4. | 11206 | 9.4% | 3.4%(+6.00)#92 | 3.1%(+6.30)#2,149 |
| 5. | 11237 | 7.7% | 3.4%(+4.30)#140 | 3.1%(+4.60)#3,126 |
| 6. | 11231 | 6.8% | 3.4%(+3.40)#174 | 3.1%(+3.70)#3,797 |
| 7. | 11207 | 6.6% | 3.4%(+3.20)#182 | 3.1%(+3.50)#3,985 |
| 8. | 11213 | 6.6% | 3.4%(+3.20)#183 | 3.1%(+3.50)#3,987 |
| 9. | 11221 | 6.5% | 3.4%(+3.10)#188 | 3.1%(+3.40)#4,086 |
| 10. | 11224 | 5.5% | 3.4%(+2.10)#235 | 3.1%(+2.40)#5,298 |
| 11. | 11205 | 5.3% | 3.4%(+1.90)#247 | 3.1%(+2.20)#5,595 |
| 12. | 11223 | 5.0% | 3.4%(+1.60)#265 | 3.1%(+1.90)#6,072 |
| 13. | 11214 | 4.7% | 3.4%(+1.30)#296 | 3.1%(+1.60)#6,597 |
| 14. | 11203 | 4.7% | 3.4%(+1.30)#297 | 3.1%(+1.60)#6,601 |
| 15. | 11236 | 4.5% | 3.4%(+1.10)#313 | 3.1%(+1.40)#6,977 |
| 16. | 11211 | 4.5% | 3.4%(+1.10)#314 | 3.1%(+1.40)#6,979 |
| 17. | 11204 | 4.3% | 3.4%(+0.900)#331 | 3.1%(+1.20)#7,390 |
| 18. | 11239 | 4.2% | 3.4%(+0.800)#344 | 3.1%(+1.10)#7,700 |
| 19. | 11219 | 3.9% | 3.4%(+0.500)#381 | 3.1%(+0.800)#8,365 |
| 20. | 11249 | 3.9% | 3.4%(+0.500)#384 | 3.1%(+0.800)#8,384 |
| 21. | 11220 | 3.8% | 3.4%(+0.400)#393 | 3.1%(+0.700)#8,626 |
| 22. | 11238 | 3.8% | 3.4%(+0.400)#394 | 3.1%(+0.700)#8,634 |
| 23. | 11235 | 3.7% | 3.4%(+0.300)#407 | 3.1%(+0.600)#8,916 |
| 24. | 11210 | 3.7% | 3.4%(+0.300)#408 | 3.1%(+0.600)#8,921 |
| 25. | 11228 | 3.7% | 3.4%(+0.300)#409 | 3.1%(+0.600)#8,936 |
| 26. | 11229 | 3.3% | 3.4%(-0.100)#461 | 3.1%(+0.200)#10,094 |
| 27. | 11230 | 3.1% | 3.4%(-0.300)#491 | 3.1%(=0.000)#10,737 |
| 28. | 11226 | 3.0% | 3.4%(-0.400)#509 | 3.1%(-0.100)#11,066 |
| 29. | 11216 | 3.0% | 3.4%(-0.400)#511 | 3.1%(-0.100)#11,070 |
| 30. | 11225 | 2.9% | 3.4%(-0.500)#532 | 3.1%(-0.200)#11,428 |
| 31. | 11234 | 2.3% | 3.4%(-1.10)#650 | 3.1%(-0.800)#13,858 |
| 32. | 11209 | 2.3% | 3.4%(-1.10)#651 | 3.1%(-0.800)#13,865 |
| 33. | 11217 | 2.3% | 3.4%(-1.10)#653 | 3.1%(-0.800)#13,899 |
| 34. | 11215 | 2.1% | 3.4%(-1.30)#688 | 3.1%(-1.000)#14,760 |
| 35. | 11201 | 1.9% | 3.4%(-1.50)#730 | 3.1%(-1.20)#15,715 |
| 36. | 11232 | 1.4% | 3.4%(-2.00)#849 | 3.1%(-1.70)#18,252 |
| 37. | 11218 | 1.2% | 3.4%(-2.20)#902 | 3.1%(-1.90)#19,182 |
| 38. | 11222 | 1.0% | 3.4%(-2.40)#961 | 3.1%(-2.10)#20,218 |
1
Common Questions
What are the Top 10 Zip Codes with the Highest Percentage of Families with Income Below $10,000 in Brooklyn, NY?
Top 10 Zip Codes with the Highest Percentage of Families with Income Below $10,000 in Brooklyn, NY are:
What zip code has the Highest Percentage of Families with Income Below $10,000 in Brooklyn, NY?
11233 has the Highest Percentage of Families with Income Below $10,000 in Brooklyn, NY with 11.2%.
What is the Percentage of Families with Income Below $10,000 in New York?
Percentage of Families with Income Below $10,000 in New York is 3.4%.
What is the Percentage of Families with Income Below $10,000 in the United States?
Percentage of Families with Income Below $10,000 in the United States is 3.1%.