Zip Codes with the Highest Percentage of Households Without a Vehicle in Brooklyn, NY
RELATED REPORTS & OPTIONS
Households without a Cars
Brooklyn
Compare Zip Codes
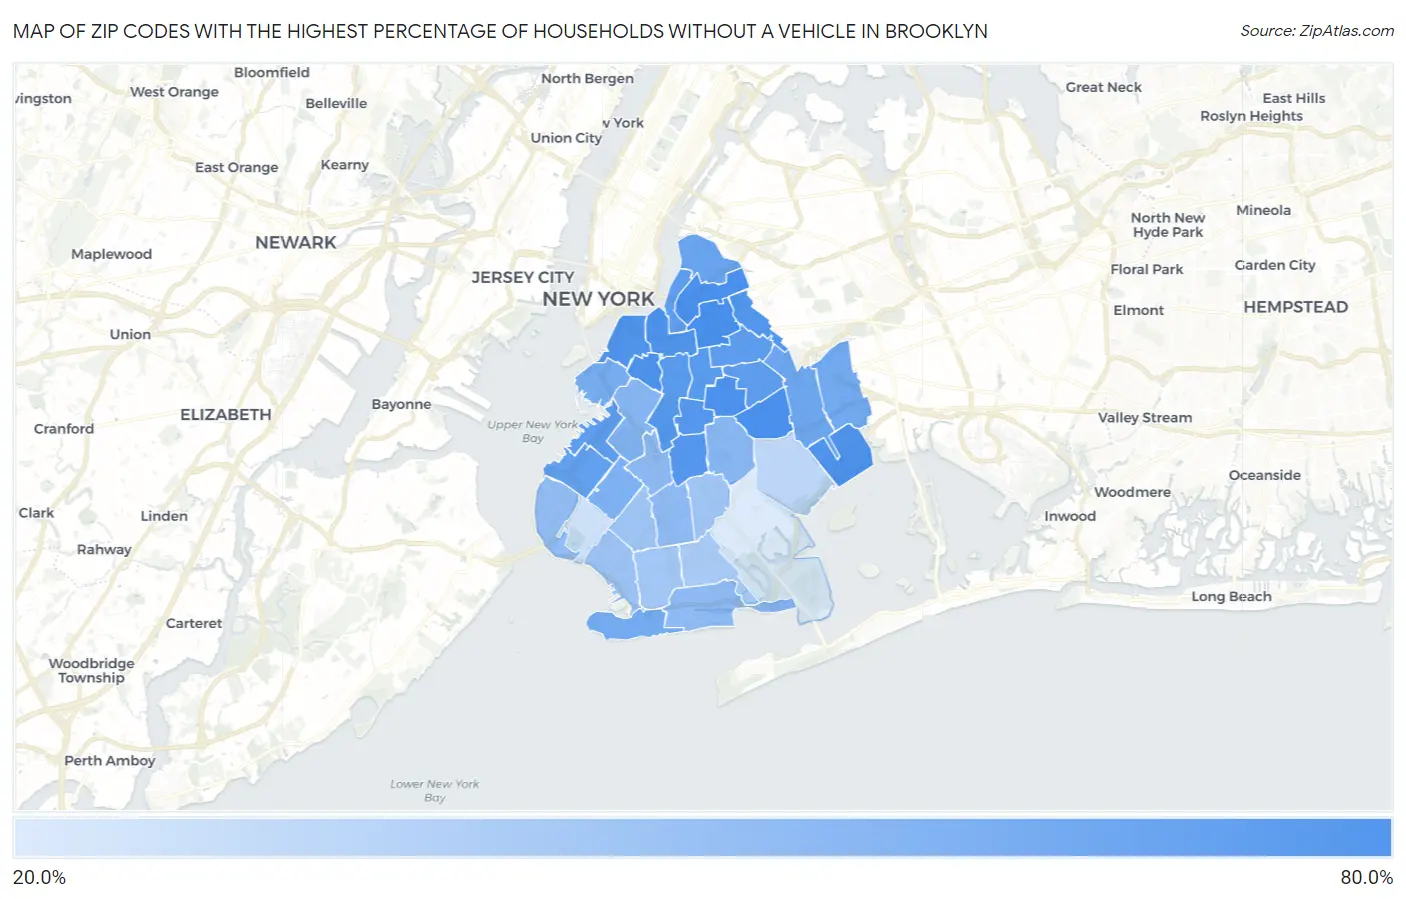
Map of Zip Codes with the Highest Percentage of Households Without a Vehicle in Brooklyn
25.9%
70.7%
Zip Codes with the Highest Percentage of Households Without a Vehicle in Brooklyn, NY
| Zip Code | Housholds Without a Car | vs State | vs National | |
| 1. | 11206 | 70.7% | 29.0%(+41.7)#53 | 8.3%(+62.4)#187 |
| 2. | 11212 | 70.0% | 29.0%(+41.0)#57 | 8.3%(+61.7)#191 |
| 3. | 11211 | 69.9% | 29.0%(+40.9)#58 | 8.3%(+61.6)#194 |
| 4. | 11213 | 69.0% | 29.0%(+40.0)#62 | 8.3%(+60.7)#202 |
| 5. | 11217 | 68.9% | 29.0%(+39.9)#64 | 8.3%(+60.6)#204 |
| 6. | 11201 | 67.5% | 29.0%(+38.5)#66 | 8.3%(+59.2)#213 |
| 7. | 11205 | 67.3% | 29.0%(+38.3)#68 | 8.3%(+59.0)#216 |
| 8. | 11239 | 67.3% | 29.0%(+38.3)#69 | 8.3%(+59.0)#217 |
| 9. | 11237 | 66.7% | 29.0%(+37.7)#71 | 8.3%(+58.4)#221 |
| 10. | 11225 | 66.2% | 29.0%(+37.2)#73 | 8.3%(+57.9)#227 |
| 11. | 11226 | 66.1% | 29.0%(+37.1)#74 | 8.3%(+57.8)#230 |
| 12. | 11238 | 65.5% | 29.0%(+36.5)#76 | 8.3%(+57.2)#233 |
| 13. | 11216 | 65.4% | 29.0%(+36.4)#78 | 8.3%(+57.1)#235 |
| 14. | 11233 | 63.0% | 29.0%(+34.0)#79 | 8.3%(+54.7)#248 |
| 15. | 11232 | 62.9% | 29.0%(+33.9)#80 | 8.3%(+54.6)#250 |
| 16. | 11221 | 62.7% | 29.0%(+33.7)#81 | 8.3%(+54.4)#252 |
| 17. | 11249 | 62.4% | 29.0%(+33.4)#82 | 8.3%(+54.1)#255 |
| 18. | 11220 | 61.7% | 29.0%(+32.7)#84 | 8.3%(+53.4)#260 |
| 19. | 11222 | 59.3% | 29.0%(+30.3)#89 | 8.3%(+51.0)#275 |
| 20. | 11207 | 57.8% | 29.0%(+28.8)#91 | 8.3%(+49.5)#282 |
| 21. | 11208 | 56.4% | 29.0%(+27.4)#94 | 8.3%(+48.1)#298 |
| 22. | 11224 | 55.8% | 29.0%(+26.8)#95 | 8.3%(+47.5)#303 |
| 23. | 11231 | 54.7% | 29.0%(+25.7)#98 | 8.3%(+46.4)#310 |
| 24. | 11219 | 52.4% | 29.0%(+23.4)#100 | 8.3%(+44.1)#324 |
| 25. | 11215 | 50.3% | 29.0%(+21.3)#104 | 8.3%(+42.0)#340 |
| 26. | 11203 | 49.7% | 29.0%(+20.7)#105 | 8.3%(+41.4)#349 |
| 27. | 11218 | 48.0% | 29.0%(+19.0)#108 | 8.3%(+39.7)#364 |
| 28. | 11230 | 47.6% | 29.0%(+18.6)#109 | 8.3%(+39.3)#367 |
| 29. | 11235 | 47.6% | 29.0%(+18.6)#110 | 8.3%(+39.3)#368 |
| 30. | 11209 | 47.0% | 29.0%(+18.0)#111 | 8.3%(+38.7)#379 |
| 31. | 11214 | 44.2% | 29.0%(+15.2)#118 | 8.3%(+35.9)#420 |
| 32. | 11204 | 43.1% | 29.0%(+14.1)#127 | 8.3%(+34.8)#450 |
| 33. | 11210 | 41.9% | 29.0%(+12.9)#134 | 8.3%(+33.6)#475 |
| 34. | 11223 | 41.8% | 29.0%(+12.8)#135 | 8.3%(+33.5)#479 |
| 35. | 11229 | 40.1% | 29.0%(+11.1)#139 | 8.3%(+31.8)#509 |
| 36. | 11236 | 34.7% | 29.0%(+5.70)#149 | 8.3%(+26.4)#640 |
| 37. | 11228 | 29.5% | 29.0%(+0.500)#183 | 8.3%(+21.2)#824 |
| 38. | 11234 | 25.9% | 29.0%(-3.10)#197 | 8.3%(+17.6)#1,003 |
1
Common Questions
What are the Top 10 Zip Codes with the Highest Percentage of Households Without a Vehicle in Brooklyn, NY?
Top 10 Zip Codes with the Highest Percentage of Households Without a Vehicle in Brooklyn, NY are:
What zip code has the Highest Percentage of Households Without a Vehicle in Brooklyn, NY?
11206 has the Highest Percentage of Households Without a Vehicle in Brooklyn, NY with 70.7%.
What is the Percentage of Households Without a Vehicle in New York?
Percentage of Households Without a Vehicle in New York is 29.0%.
What is the Percentage of Households Without a Vehicle in the United States?
Percentage of Households Without a Vehicle in the United States is 8.3%.