Zip Codes with the Highest Percentage of Population Employed in Accommodation & Food Services in Brooklyn, NY

RELATED REPORTS & OPTIONS

Accommodation & Food Services
Population
Families and Households
Female Fertility
Female Fertility (Unmarried)
Race (Community Size)
Race (Percentage)
Ancestry (Community Size)
AfghanAfricanAlbanianAlsatianAmericanApacheArabArgentineanArmenianAssyrian / Chaldean / SyriacAustralianAustrianBahamianBangladeshiBarbadianBasqueBelgianBelizeanBermudanBhutaneseBlackfeetBolivianBrazilianBritishBritish West IndianBulgarianBurmeseCajunCambodianCanadianCape VerdeanCarpatho RusynCelticCentral AmericanCentral American IndianCherokeeChickasawChileanChippewaChoctawColombianCosta RicanCreekCroatianCrowCubanCypriotCzechCzechoslovakianDanishDominicanDutchDutch West IndianEastern EuropeanEcuadorianEgyptianEnglishEstonianEthiopianEuropeanFilipinoFinnishFrenchFrench American IndianFrench CanadianGermanGerman RussianGhanaianGreekGuamanian / ChamorroGuatemalanGuyaneseHaitianHonduranHungarianIcelanderIndian (Asian)IndonesianIranianIraqiIrishIroquoisIsraeliItalianJamaicanJapaneseJordanianKenyanKoreanLaotianLatvianLebaneseLiberianLithuanianLumbeeLuxembourgerMacedonianMalaysianMalteseMexicanMexican American IndianMongolianMoroccanNative HawaiianNavajoNew ZealanderNicaraguanNigerianNorthern EuropeanNorwegianOkinawanPakistaniPalestinianPanamanianParaguayanPennsylvania GermanPeruvianPolishPortuguesePuebloPuerto RicanRomanianRussianSalvadoranSamoanScandinavianScotch-IrishScottishSeminoleSenegaleseSerbianSierra LeoneanSiouxSlavicSlovakSloveneSomaliSouth AfricanSouth AmericanSouth American IndianSoviet UnionSpaniardSpanishSpanish AmericanSpanish American IndianSri LankanSubsaharan AfricanSudaneseSwedishSwissSyrianThaiTrinidadian and TobagonianTurkishU.S. Virgin IslanderUgandanUkrainianUruguayanVenezuelanVietnameseWelshWest IndianYugoslavian
Ancestry (Percentage)
AfghanAfricanAlbanianAlsatianAmericanApacheArabArgentineanArmenianAssyrian / Chaldean / SyriacAustralianAustrianBahamianBangladeshiBarbadianBasqueBelgianBelizeanBermudanBhutaneseBlackfeetBolivianBrazilianBritishBritish West IndianBulgarianBurmeseCajunCambodianCanadianCape VerdeanCarpatho RusynCelticCentral AmericanCentral American IndianCherokeeChickasawChileanChippewaChoctawColombianCosta RicanCreekCroatianCrowCubanCypriotCzechCzechoslovakianDanishDominicanDutchDutch West IndianEastern EuropeanEcuadorianEgyptianEnglishEstonianEthiopianEuropeanFilipinoFinnishFrenchFrench American IndianFrench CanadianGermanGerman RussianGhanaianGreekGuamanian / ChamorroGuatemalanGuyaneseHaitianHonduranHungarianIcelanderIndian (Asian)IndonesianIranianIraqiIrishIroquoisIsraeliItalianJamaicanJapaneseJordanianKenyanKoreanLaotianLatvianLebaneseLiberianLithuanianLumbeeLuxembourgerMacedonianMalaysianMalteseMexicanMexican American IndianMongolianMoroccanNative HawaiianNavajoNew ZealanderNicaraguanNigerianNorthern EuropeanNorwegianOkinawanPakistaniPalestinianPanamanianParaguayanPennsylvania GermanPeruvianPolishPortuguesePuebloPuerto RicanRomanianRussianSalvadoranSamoanScandinavianScotch-IrishScottishSeminoleSenegaleseSerbianSierra LeoneanSiouxSlavicSlovakSloveneSomaliSouth AfricanSouth AmericanSouth American IndianSoviet UnionSpaniardSpanishSpanish AmericanSpanish American IndianSri LankanSubsaharan AfricanSudaneseSwedishSwissSyrianThaiTrinidadian and TobagonianTurkishU.S. Virgin IslanderUgandanUkrainianUruguayanVenezuelanVietnameseWelshWest IndianYugoslavian
Immigrant Origin (Total)
AfghanistanAfricaAlbaniaArgentinaArmeniaAsiaAustraliaAustriaBahamasBangladeshBarbadosBelarusBelgiumBelizeBoliviaBosnia and HerzegovinaBrazilBulgariaBurma / MyanmarCambodiaCameroonCanadaCaribbeanCentral AmericaChileChinaColombiaCongoCosta RicaCroatiaCubaCzechoslovakiaDenmarkDominicaDominican RepublicEastern AfricaEastern AsiaEastern EuropeEcuadorEgyptEl SalvadorEnglandEritreaEthiopiaEuropeFranceGermanyGhanaGreeceGrenadaGuatemalaGuyanaHaitiHondurasHong KongHungaryIndiaIndonesiaIranIraqIrelandIsraelItalyJamaicaJapanJordanKazakhstanKenyaKoreaKuwaitLaosLatin AmericaLatviaLebanonLiberiaLithuaniaMalaysiaMexicoMicronesiaMiddle AfricaMoldovaMoroccoNepalNetherlandsNicaraguaNigeriaNorth MacedoniaNorthern AfricaNorthern EuropeNorwayOceaniaPakistanPanamaPeruPhilippinesPolandPortugalRomaniaRussiaSaudi ArabiaScotlandSenegalSerbiaSierra LeoneSingaporeSomaliaSouth AfricaSouth AmericaSouth Central AsiaSouth Eastern AsiaSouthern EuropeSpainSri LankaSt. Vincent and the GrenadinesSudanSwedenSwitzerlandSyriaTaiwanThailandTrinidad and TobagoTurkeyUgandaUkraineUruguayUzbekistanVenezuelaVietnamWest IndiesWestern AfricaWestern AsiaWestern EuropeYemenZaireZimbabwe
Immigrant Origin (Percentage)
AfghanistanAfricaAlbaniaArgentinaArmeniaAsiaAustraliaAustriaBahamasBangladeshBarbadosBelarusBelgiumBelizeBoliviaBosnia and HerzegovinaBrazilBulgariaBurma / MyanmarCambodiaCameroonCanadaCaribbeanCentral AmericaChileChinaColombiaCongoCosta RicaCroatiaCubaCzechoslovakiaDenmarkDominicaDominican RepublicEastern AfricaEastern AsiaEastern EuropeEcuadorEgyptEl SalvadorEnglandEritreaEthiopiaEuropeFranceGermanyGhanaGreeceGrenadaGuatemalaGuyanaHaitiHondurasHong KongHungaryIndiaIndonesiaIranIraqIrelandIsraelItalyJamaicaJapanJordanKazakhstanKenyaKoreaKuwaitLaosLatin AmericaLatviaLebanonLiberiaLithuaniaMalaysiaMexicoMicronesiaMiddle AfricaMoldovaMoroccoNepalNetherlandsNicaraguaNigeriaNorth MacedoniaNorthern AfricaNorthern EuropeNorwayOceaniaPakistanPanamaPeruPhilippinesPolandPortugalRomaniaRussiaSaudi ArabiaScotlandSenegalSerbiaSierra LeoneSingaporeSomaliaSouth AfricaSouth AmericaSouth Central AsiaSouth Eastern AsiaSouthern EuropeSpainSri LankaSt. Vincent and the GrenadinesSudanSwedenSwitzerlandSyriaTaiwanThailandTrinidad and TobagoTurkeyUgandaUkraineUruguayUzbekistanVenezuelaVietnamWest IndiesWestern AfricaWestern AsiaWestern EuropeYemenZaireZimbabwe
Income
Income (Families)
Income (Households)
Poverty
Poverty (Families)
Unemployment
Employment Occupations
Employment Industries
Employer Class
Commute Time
Commute Means
School Enrollment
Education by Degree Field
Occupancy
Finances
Physical Characteristics
Brooklyn
Compare Zip Codes
Comparison Subject

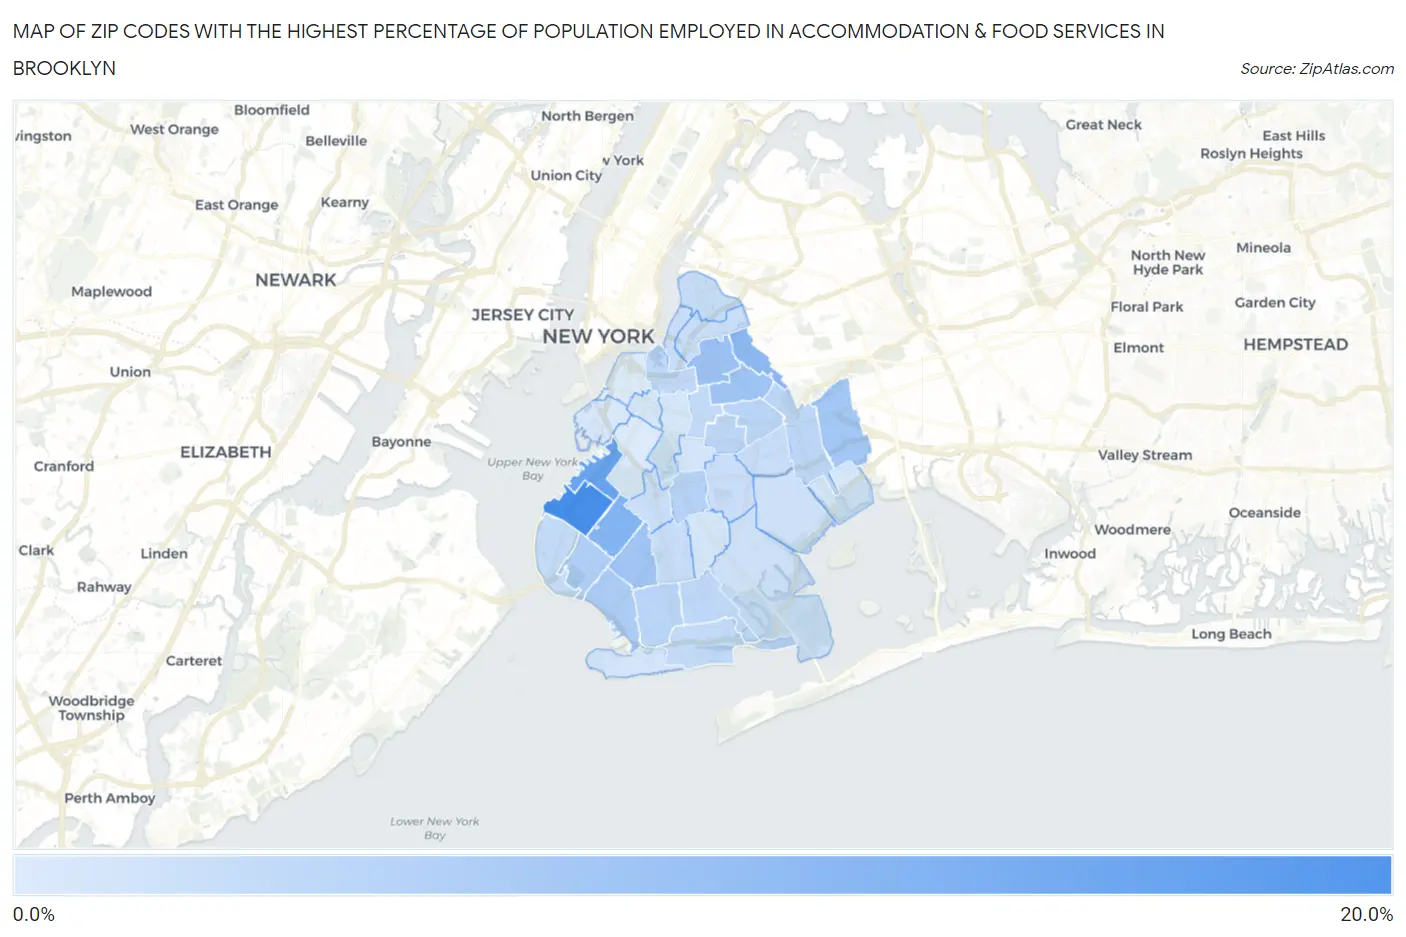
Map of Zip Codes with the Highest Percentage of Population Employed in Accommodation & Food Services in Brooklyn

0.0%
20.0%
Zip Codes with the Highest Percentage of Population Employed in Accommodation & Food Services in Brooklyn Map

Zip Codes with the Highest Percentage of Population Employed in Accommodation & Food Services in Brooklyn, NY

Zip Code % Employed vs State vs National
1.1122018.5%6.2%(+12.4)#496.9%(+11.6)#1,011
2.1123214.6%6.2%(+8.39)#876.9%(+7.67)#1,805
3.1121911.8%6.2%(+5.67)#1486.9%(+4.95)#2,933
4.1123711.0%6.2%(+4.81)#1826.9%(+4.10)#3,573
5.112069.1%6.2%(+2.98)#2796.9%(+2.27)#5,731
6.112219.0%6.2%(+2.85)#2906.9%(+2.13)#5,928
7.112048.6%6.2%(+2.46)#3226.9%(+1.74)#6,594
8.112088.5%6.2%(+2.37)#3286.9%(+1.65)#6,763
9.112147.6%6.2%(+1.48)#4096.9%(+0.759)#8,652
10.112287.0%6.2%(+0.844)#4946.9%(+0.128)#10,272
11.112266.5%6.2%(+0.299)#5686.9%(-0.418)#11,956
12.112236.2%6.2%(+0.042)#6186.9%(-0.674)#12,773
13.112336.1%6.2%(-0.056)#6486.9%(-0.773)#13,110
14.112135.9%6.2%(-0.269)#6796.9%(-0.986)#13,787
15.112075.9%6.2%(-0.306)#6926.9%(-1.02)#13,925
16.112055.7%6.2%(-0.429)#7126.9%(-1.15)#14,266
17.112295.6%6.2%(-0.520)#7266.9%(-1.24)#14,553
18.112095.3%6.2%(-0.899)#8126.9%(-1.62)#15,887
19.112165.2%6.2%(-1.01)#8366.9%(-1.73)#16,271
20.112355.1%6.2%(-1.10)#8566.9%(-1.82)#16,596
21.112225.1%6.2%(-1.11)#8586.9%(-1.83)#16,633
22.112304.8%6.2%(-1.37)#9176.9%(-2.08)#17,496
23.112124.8%6.2%(-1.39)#9256.9%(-2.11)#17,569
24.112114.7%6.2%(-1.51)#9566.9%(-2.22)#17,960
25.112184.5%6.2%(-1.69)#9886.9%(-2.40)#18,581
26.112494.4%6.2%(-1.79)#1,0096.9%(-2.51)#18,910
27.112034.4%6.2%(-1.79)#1,0106.9%(-2.51)#18,918
28.112344.1%6.2%(-2.03)#1,0556.9%(-2.75)#19,720
29.112364.1%6.2%(-2.11)#1,0726.9%(-2.82)#19,952
30.112253.6%6.2%(-2.58)#1,1536.9%(-3.30)#21,506
31.112243.5%6.2%(-2.65)#1,1686.9%(-3.37)#21,722
32.112383.3%6.2%(-2.83)#1,1956.9%(-3.55)#22,298
33.112103.3%6.2%(-2.89)#1,2126.9%(-3.61)#22,467
34.112173.3%6.2%(-2.90)#1,2176.9%(-3.62)#22,513
35.112393.3%6.2%(-2.90)#1,2186.9%(-3.62)#22,515
36.112313.1%6.2%(-3.10)#1,2506.9%(-3.82)#23,057
37.112152.7%6.2%(-3.50)#1,3206.9%(-4.22)#24,089
38.112012.6%6.2%(-3.52)#1,3246.9%(-4.24)#24,133

Common Questions

What are the Top 10 Zip Codes with the Highest Percentage of Population Employed in Accommodation & Food Services in Brooklyn, NY?
Top 10 Zip Codes with the Highest Percentage of Population Employed in Accommodation & Food Services in Brooklyn, NY are:
#1
18.5%
#2
14.6%
#3
11.8%
#4
11.0%
#5
9.1%
#6
9.0%
#7
8.6%
#8
8.5%
#9
7.6%
#10
7.0%
What zip code has the Highest Percentage of Population Employed in Accommodation & Food Services in Brooklyn, NY?
11220 has the Highest Percentage of Population Employed in Accommodation & Food Services in Brooklyn, NY with 18.5%.
What is the Percentage of Population Employed in Accommodation & Food Services in New York?
Percentage of Population Employed in Accommodation & Food Services in New York is 6.2%.
What is the Percentage of Population Employed in Accommodation & Food Services in the United States?
Percentage of Population Employed in Accommodation & Food Services in the United States is 6.9%.