Zip Codes with the Highest Percentage of Households with Income Below $10,000 in Brooklyn, NY
RELATED REPORTS & OPTIONS
Household Income | $0-10k
Brooklyn
Compare Zip Codes
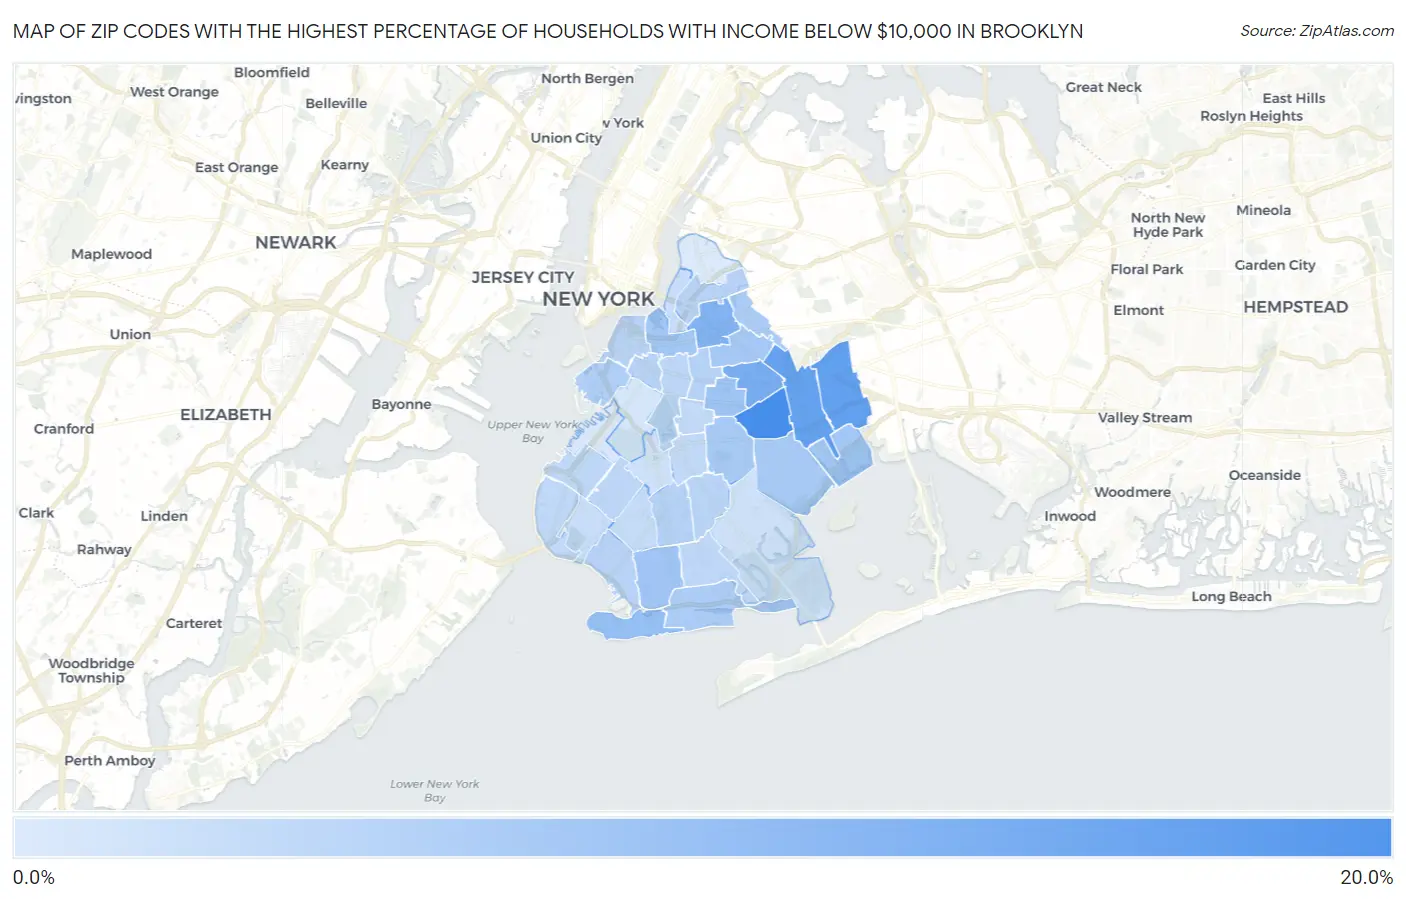
Map of Zip Codes with the Highest Percentage of Households with Income Below $10,000 in Brooklyn
2.8%
15.2%
Zip Codes with the Highest Percentage of Households with Income Below $10,000 in Brooklyn, NY
| Zip Code | Households with Income < $10k | vs State | vs National | |
| 1. | 11212 | 15.2% | 5.6%(+9.60)#53 | 4.9%(+10.3)#1,472 |
| 2. | 11208 | 12.8% | 5.6%(+7.20)#91 | 4.9%(+7.90)#2,150 |
| 3. | 11207 | 12.6% | 5.6%(+7.00)#96 | 4.9%(+7.70)#2,226 |
| 4. | 11233 | 11.0% | 5.6%(+5.40)#125 | 4.9%(+6.10)#2,941 |
| 5. | 11206 | 10.3% | 5.6%(+4.70)#145 | 4.9%(+5.40)#3,357 |
| 6. | 11224 | 8.6% | 5.6%(+3.00)#219 | 4.9%(+3.70)#4,815 |
| 7. | 11213 | 7.8% | 5.6%(+2.20)#263 | 4.9%(+2.90)#5,793 |
| 8. | 11223 | 7.5% | 5.6%(+1.90)#276 | 4.9%(+2.60)#6,189 |
| 9. | 11205 | 7.4% | 5.6%(+1.80)#283 | 4.9%(+2.50)#6,336 |
| 10. | 11239 | 7.4% | 5.6%(+1.80)#289 | 4.9%(+2.50)#6,370 |
| 11. | 11221 | 7.2% | 5.6%(+1.60)#301 | 4.9%(+2.30)#6,610 |
| 12. | 11236 | 7.1% | 5.6%(+1.50)#311 | 4.9%(+2.20)#6,764 |
| 13. | 11203 | 7.1% | 5.6%(+1.50)#312 | 4.9%(+2.20)#6,765 |
| 14. | 11235 | 6.7% | 5.6%(+1.10)#339 | 4.9%(+1.80)#7,514 |
| 15. | 11237 | 6.7% | 5.6%(+1.10)#341 | 4.9%(+1.80)#7,522 |
| 16. | 11231 | 6.3% | 5.6%(+0.700)#377 | 4.9%(+1.40)#8,308 |
| 17. | 11230 | 5.9% | 5.6%(+0.300)#411 | 4.9%(+1.00)#9,183 |
| 18. | 11216 | 5.9% | 5.6%(+0.300)#412 | 4.9%(+1.00)#9,187 |
| 19. | 11214 | 5.7% | 5.6%(+0.100)#440 | 4.9%(+0.800)#9,681 |
| 20. | 11201 | 5.7% | 5.6%(+0.100)#441 | 4.9%(+0.800)#9,684 |
| 21. | 11211 | 5.7% | 5.6%(+0.100)#442 | 4.9%(+0.800)#9,686 |
| 22. | 11217 | 5.7% | 5.6%(+0.100)#443 | 4.9%(+0.800)#9,700 |
| 23. | 11210 | 5.6% | 5.6%(=0.000)#452 | 4.9%(+0.700)#9,947 |
| 24. | 11219 | 5.3% | 5.6%(-0.300)#495 | 4.9%(+0.400)#10,707 |
| 25. | 11238 | 5.3% | 5.6%(-0.300)#497 | 4.9%(+0.400)#10,712 |
| 26. | 11220 | 5.2% | 5.6%(-0.400)#513 | 4.9%(+0.300)#11,028 |
| 27. | 11209 | 5.2% | 5.6%(-0.400)#514 | 4.9%(+0.300)#11,032 |
| 28. | 11229 | 5.1% | 5.6%(-0.500)#533 | 4.9%(+0.200)#11,318 |
| 29. | 11226 | 5.0% | 5.6%(-0.600)#554 | 4.9%(+0.100)#11,640 |
| 30. | 11225 | 4.9% | 5.6%(-0.700)#568 | 4.9%(=0.000)#11,964 |
| 31. | 11204 | 4.6% | 5.6%(-1.000)#621 | 4.9%(-0.300)#12,948 |
| 32. | 11228 | 4.5% | 5.6%(-1.10)#637 | 4.9%(-0.400)#13,328 |
| 33. | 11249 | 4.4% | 5.6%(-1.20)#656 | 4.9%(-0.500)#13,670 |
| 34. | 11218 | 3.9% | 5.6%(-1.70)#764 | 4.9%(-1.00)#15,576 |
| 35. | 11234 | 3.8% | 5.6%(-1.80)#787 | 4.9%(-1.10)#15,957 |
| 36. | 11215 | 3.3% | 5.6%(-2.30)#893 | 4.9%(-1.60)#18,029 |
| 37. | 11232 | 3.0% | 5.6%(-2.60)#961 | 4.9%(-1.90)#19,367 |
| 38. | 11222 | 2.8% | 5.6%(-2.80)#1,012 | 4.9%(-2.10)#20,246 |
1
Common Questions
What are the Top 10 Zip Codes with the Highest Percentage of Households with Income Below $10,000 in Brooklyn, NY?
Top 10 Zip Codes with the Highest Percentage of Households with Income Below $10,000 in Brooklyn, NY are:
What zip code has the Highest Percentage of Households with Income Below $10,000 in Brooklyn, NY?
11212 has the Highest Percentage of Households with Income Below $10,000 in Brooklyn, NY with 15.2%.
What is the Percentage of Households with Income Below $10,000 in New York?
Percentage of Households with Income Below $10,000 in New York is 5.6%.
What is the Percentage of Households with Income Below $10,000 in the United States?
Percentage of Households with Income Below $10,000 in the United States is 4.9%.