Zip Codes with the Highest Percentage of Population with a Degree in Visual and Performing Arts in Rochester, NH
RELATED REPORTS & OPTIONS
Visual and Performing Arts
Rochester
Compare Zip Codes
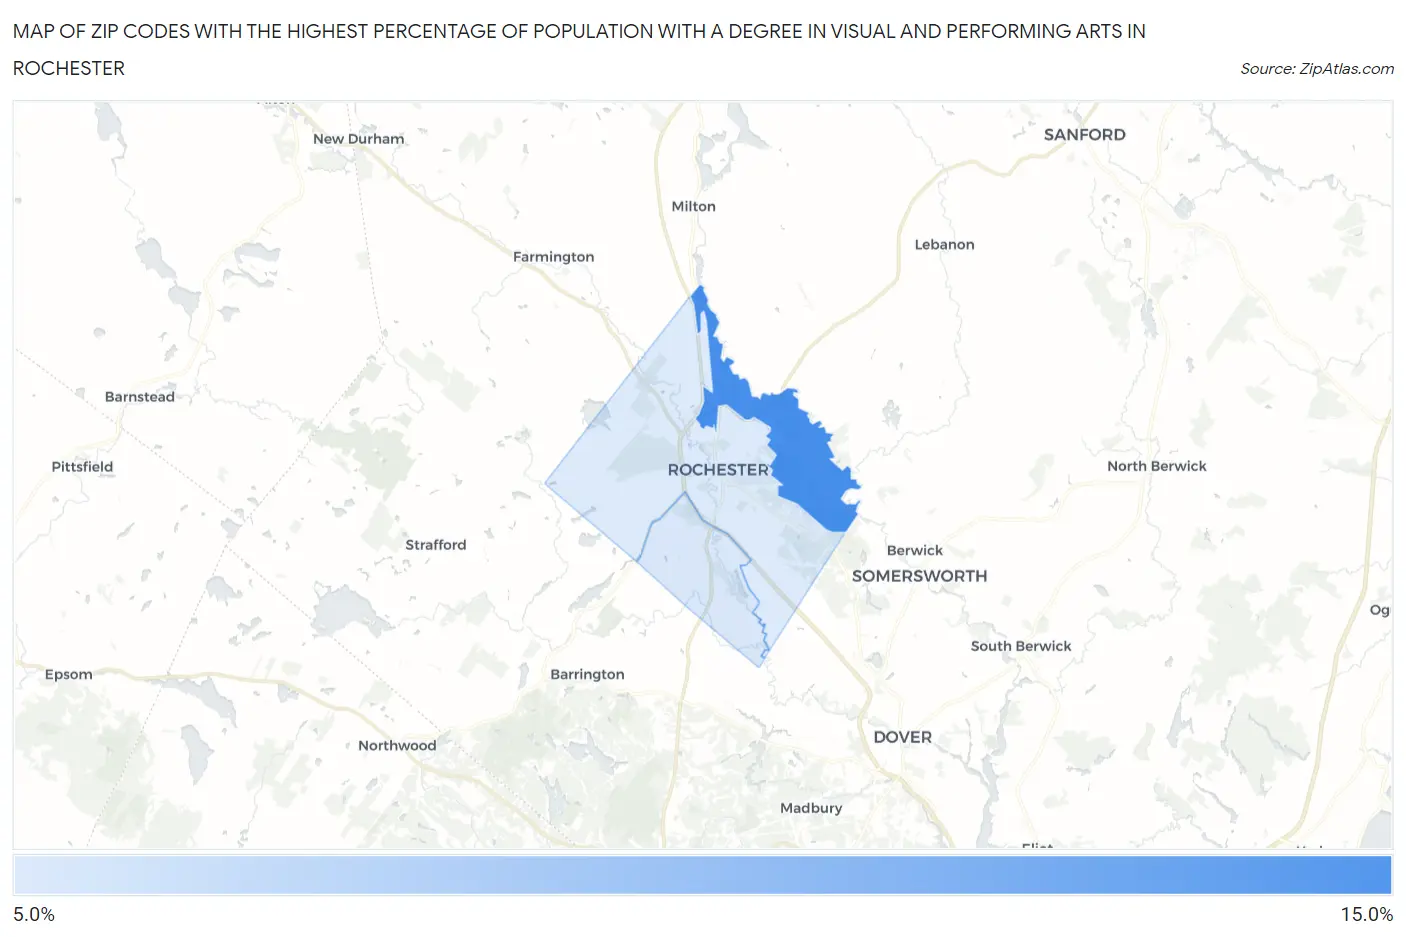
Map of Zip Codes with the Highest Percentage of Population with a Degree in Visual and Performing Arts in Rochester
5.8%
11.1%
Zip Codes with the Highest Percentage of Population with a Degree in Visual and Performing Arts in Rochester, NH
| Zip Code | % Graduates | vs State | vs National | |
| 1. | 03868 | 11.1% | 4.2%(+6.85)#14 | 4.3%(+6.85)#1,510 |
| 2. | 03839 | 6.0% | 4.2%(+1.77)#61 | 4.3%(+1.76)#4,864 |
| 3. | 03867 | 5.8% | 4.2%(+1.59)#67 | 4.3%(+1.58)#5,128 |
1
Common Questions
What are the Top Zip Codes with the Highest Percentage of Population with a Degree in Visual and Performing Arts in Rochester, NH?
Top Zip Codes with the Highest Percentage of Population with a Degree in Visual and Performing Arts in Rochester, NH are:
What zip code has the Highest Percentage of Population with a Degree in Visual and Performing Arts in Rochester, NH?
03868 has the Highest Percentage of Population with a Degree in Visual and Performing Arts in Rochester, NH with 11.1%.
What is the Percentage of Population with a Degree in Visual and Performing Arts in Rochester, NH?
Percentage of Population with a Degree in Visual and Performing Arts in Rochester is 7.2%.
What is the Percentage of Population with a Degree in Visual and Performing Arts in New Hampshire?
Percentage of Population with a Degree in Visual and Performing Arts in New Hampshire is 4.2%.
What is the Percentage of Population with a Degree in Visual and Performing Arts in the United States?
Percentage of Population with a Degree in Visual and Performing Arts in the United States is 4.3%.