Zip Codes with the Highest Percentage of Population Employed in Sales & Related in Billings, MT
RELATED REPORTS & OPTIONS
Sales & Related
Billings
Compare Zip Codes
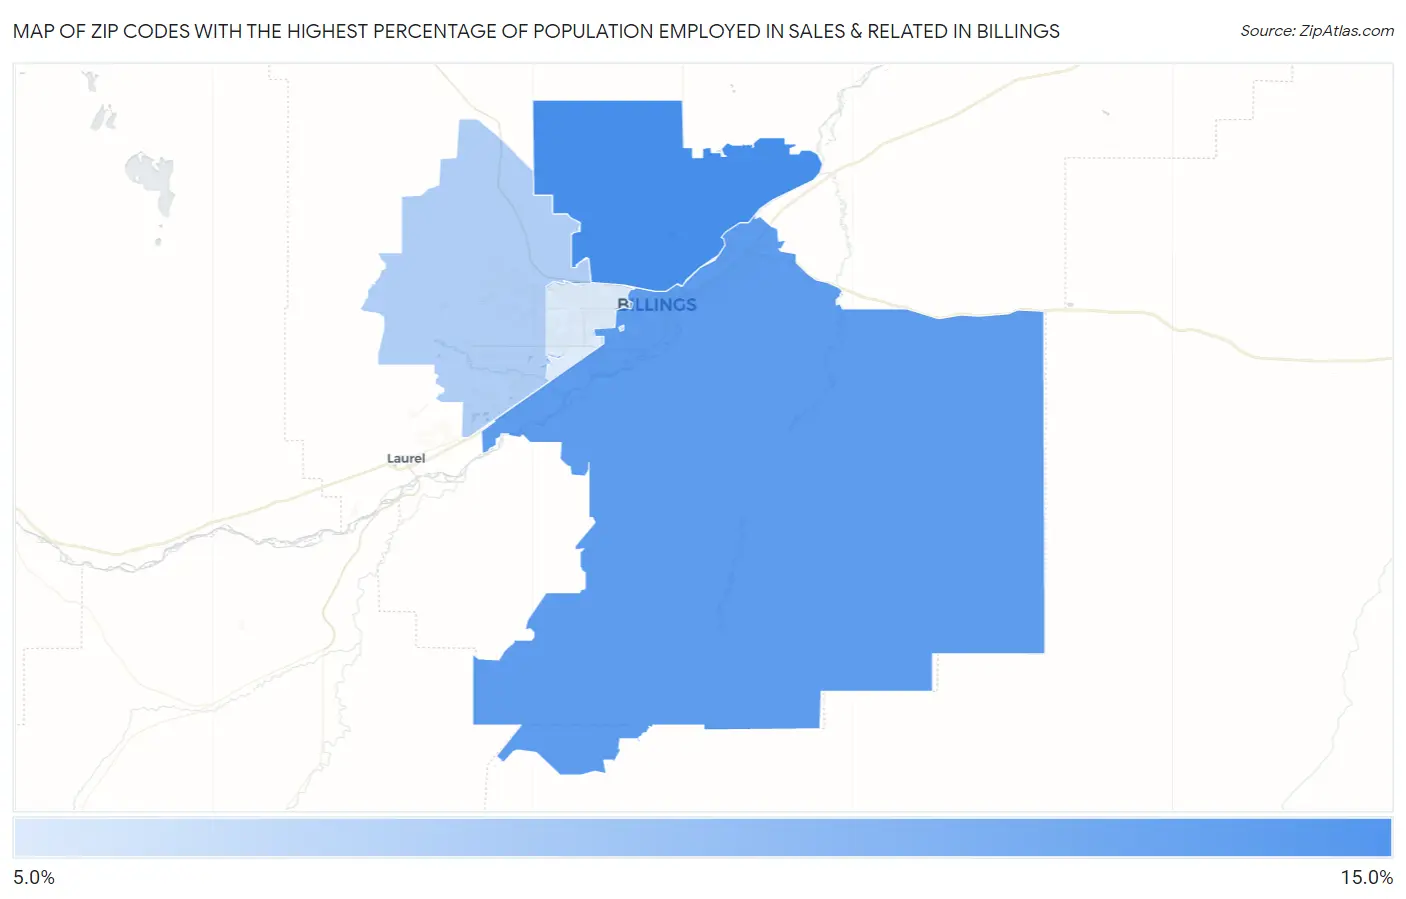
Map of Zip Codes with the Highest Percentage of Population Employed in Sales & Related in Billings
9.8%
12.9%
Zip Codes with the Highest Percentage of Population Employed in Sales & Related in Billings, MT
| Zip Code | % Employed | vs State | vs National | |
| 1. | 59105 | 12.9% | 9.6%(+3.35)#41 | 9.6%(+3.33)#4,565 |
| 2. | 59101 | 12.4% | 9.6%(+2.87)#45 | 9.6%(+2.85)#5,251 |
| 3. | 59106 | 10.7% | 9.6%(+1.14)#73 | 9.6%(+1.12)#8,963 |
| 4. | 59102 | 9.8% | 9.6%(+0.179)#92 | 9.6%(+0.159)#11,845 |
1
Common Questions
What are the Top 3 Zip Codes with the Highest Percentage of Population Employed in Sales & Related in Billings, MT?
Top 3 Zip Codes with the Highest Percentage of Population Employed in Sales & Related in Billings, MT are:
What zip code has the Highest Percentage of Population Employed in Sales & Related in Billings, MT?
59105 has the Highest Percentage of Population Employed in Sales & Related in Billings, MT with 12.9%.
What is the Percentage of Population Employed in Sales & Related in Billings, MT?
Percentage of Population Employed in Sales & Related in Billings is 11.6%.
What is the Percentage of Population Employed in Sales & Related in Montana?
Percentage of Population Employed in Sales & Related in Montana is 9.6%.
What is the Percentage of Population Employed in Sales & Related in the United States?
Percentage of Population Employed in Sales & Related in the United States is 9.6%.