Zip Codes with the Highest Percentage of Not-for-profit Organizations in Detroit, MI
RELATED REPORTS & OPTIONS
Not-for-profit Organizations
Detroit
Compare Zip Codes
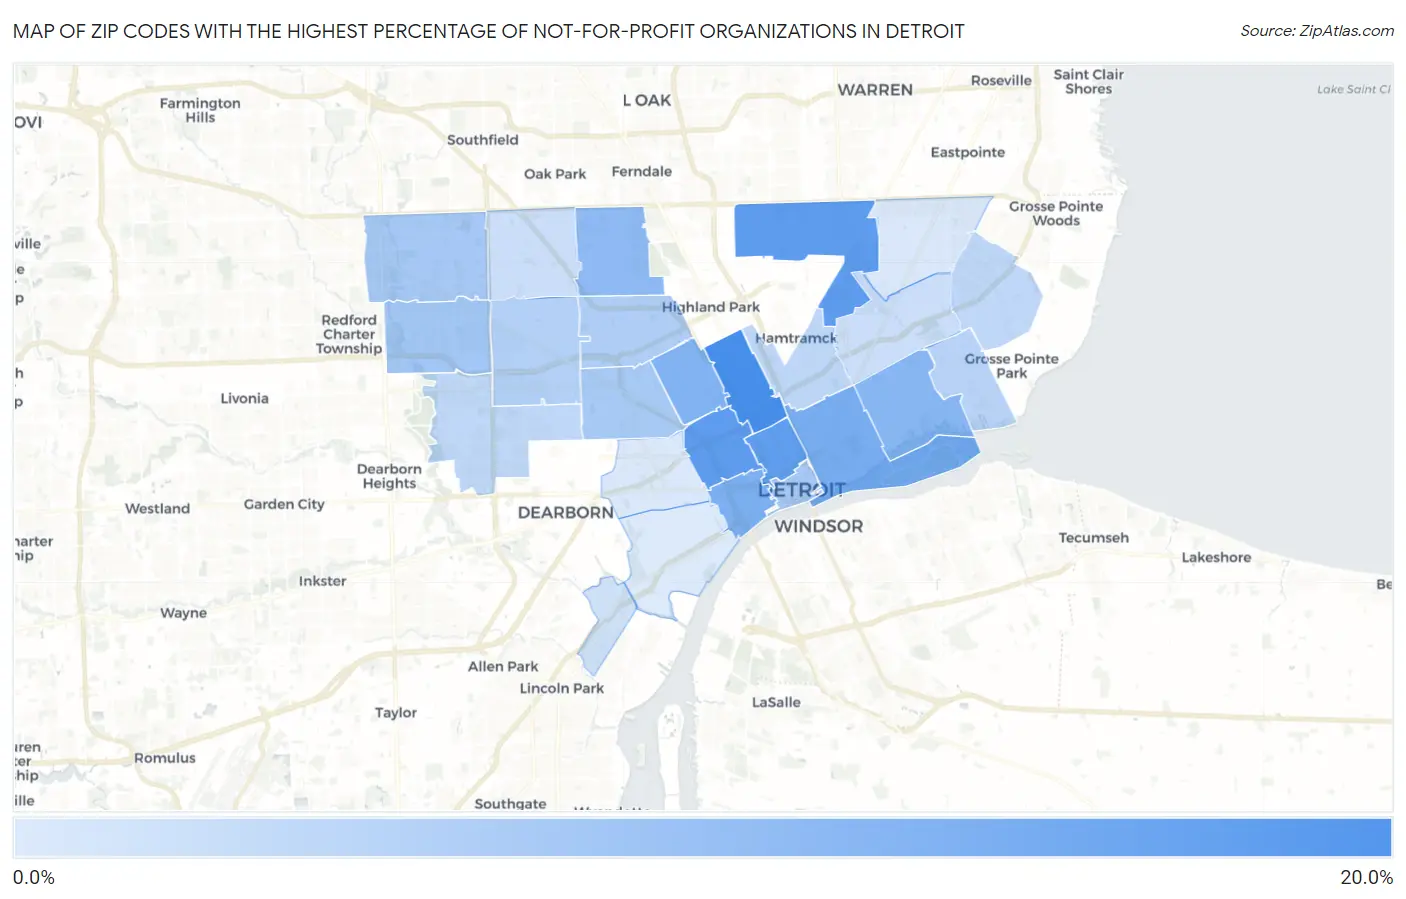
Map of Zip Codes with the Highest Percentage of Not-for-profit Organizations in Detroit
6.4%
17.2%
Zip Codes with the Highest Percentage of Not-for-profit Organizations in Detroit, MI
| Zip Code | % Employed in Not-for-profit | vs State | vs National | |
| 1. | 48202 | 17.2% | 9.6%(+7.57)#31 | 8.4%(+8.77)#1,953 |
| 2. | 48234 | 15.5% | 9.6%(+5.90)#45 | 8.4%(+7.10)#2,663 |
| 3. | 48208 | 15.5% | 9.6%(+5.81)#46 | 8.4%(+7.01)#2,698 |
| 4. | 48201 | 15.3% | 9.6%(+5.62)#49 | 8.4%(+6.82)#2,793 |
| 5. | 48207 | 13.5% | 9.6%(+3.90)#90 | 8.4%(+5.10)#3,967 |
| 6. | 48216 | 13.3% | 9.6%(+3.70)#93 | 8.4%(+4.90)#4,164 |
| 7. | 48206 | 12.9% | 9.6%(+3.26)#113 | 8.4%(+4.47)#4,582 |
| 8. | 48214 | 12.4% | 9.6%(+2.71)#137 | 8.4%(+3.91)#5,199 |
| 9. | 48221 | 12.0% | 9.6%(+2.33)#160 | 8.4%(+3.53)#5,671 |
| 10. | 48223 | 10.4% | 9.6%(+0.780)#279 | 8.4%(+1.98)#8,069 |
| 11. | 48219 | 10.3% | 9.6%(+0.680)#294 | 8.4%(+1.88)#8,248 |
| 12. | 48226 | 10.2% | 9.6%(+0.573)#303 | 8.4%(+1.77)#8,469 |
| 13. | 48204 | 10.1% | 9.6%(+0.495)#311 | 8.4%(+1.70)#8,631 |
| 14. | 48238 | 9.6% | 9.6%(-0.091)#385 | 8.4%(+1.11)#9,850 |
| 15. | 48227 | 9.2% | 9.6%(-0.415)#420 | 8.4%(+0.786)#10,524 |
| 16. | 48215 | 9.0% | 9.6%(-0.683)#445 | 8.4%(+0.518)#11,147 |
| 17. | 48211 | 8.6% | 9.6%(-1.06)#489 | 8.4%(+0.142)#12,057 |
| 18. | 48224 | 8.4% | 9.6%(-1.22)#511 | 8.4%(-0.021)#12,490 |
| 19. | 48228 | 8.4% | 9.6%(-1.23)#514 | 8.4%(-0.032)#12,522 |
| 20. | 48213 | 7.7% | 9.6%(-1.90)#589 | 8.4%(-0.695)#14,329 |
| 21. | 48235 | 7.6% | 9.6%(-2.02)#607 | 8.4%(-0.815)#14,680 |
| 22. | 48217 | 7.3% | 9.6%(-2.35)#638 | 8.4%(-1.15)#15,713 |
| 23. | 48205 | 6.6% | 9.6%(-3.05)#716 | 8.4%(-1.85)#17,759 |
| 24. | 48210 | 6.5% | 9.6%(-3.16)#724 | 8.4%(-1.96)#18,055 |
| 25. | 48209 | 6.4% | 9.6%(-3.25)#739 | 8.4%(-2.05)#18,337 |
1
Common Questions
What are the Top 10 Zip Codes with the Highest Percentage of Not-for-profit Organizations in Detroit, MI?
Top 10 Zip Codes with the Highest Percentage of Not-for-profit Organizations in Detroit, MI are:
What zip code has the Highest Percentage of Not-for-profit Organizations in Detroit, MI?
48202 has the Highest Percentage of Not-for-profit Organizations in Detroit, MI with 17.2%.
What is the Percentage of Not-for-profit Organizations in Detroit, MI?
Percentage of Not-for-profit Organizations in Detroit is 10.1%.
What is the Percentage of Not-for-profit Organizations in Michigan?
Percentage of Not-for-profit Organizations in Michigan is 9.6%.
What is the Percentage of Not-for-profit Organizations in the United States?
Percentage of Not-for-profit Organizations in the United States is 8.4%.