Zip Codes with the Highest Poverty Level Among Females Between Ages 25 and 34 in Detroit, MI
RELATED REPORTS & OPTIONS
Highest Poverty | Female 25-34
Detroit
Compare Zip Codes
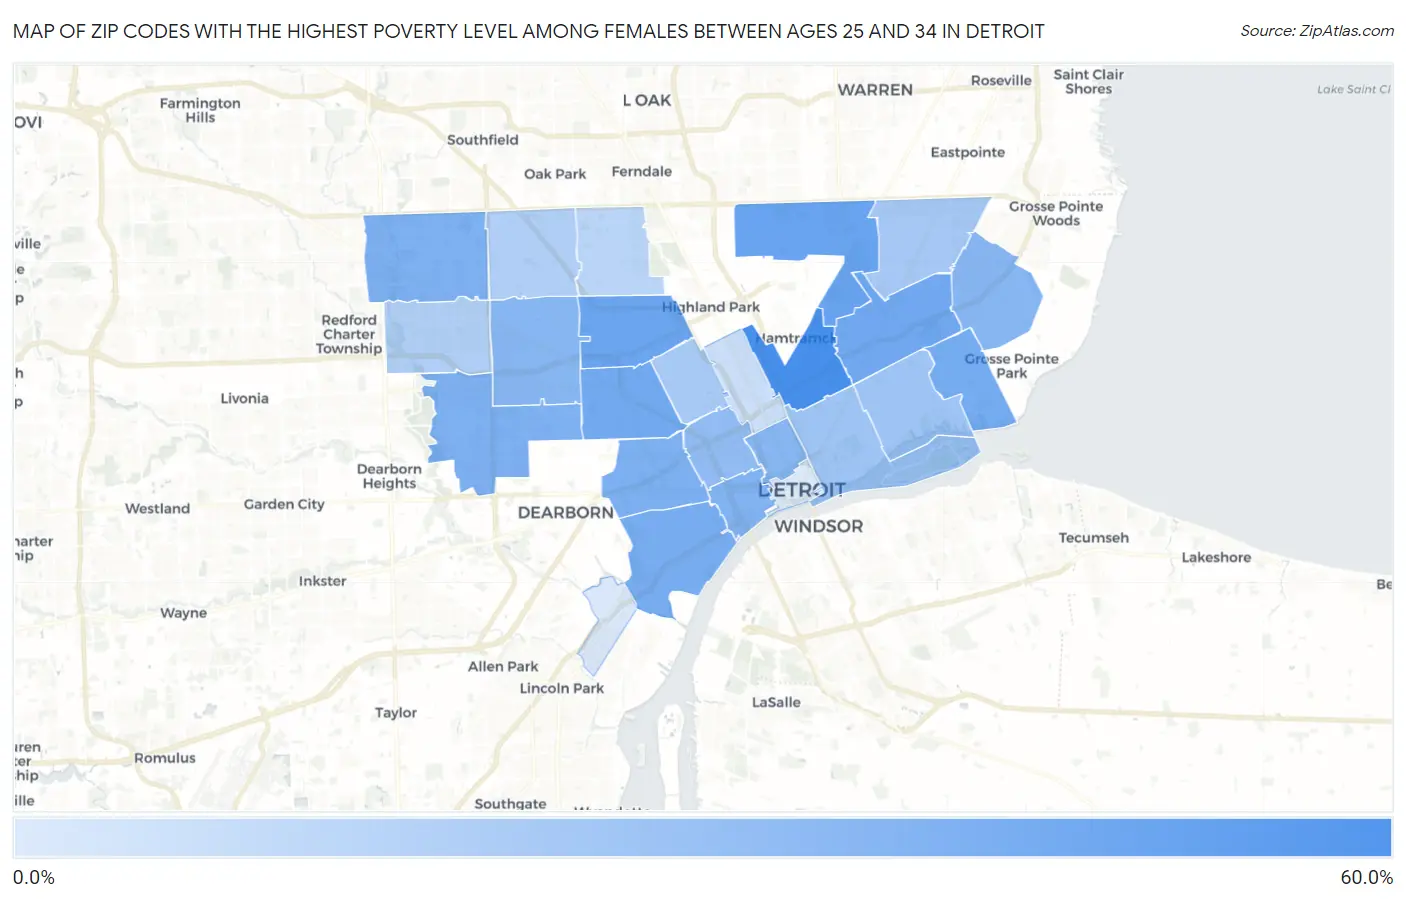
Map of Zip Codes with the Highest Poverty Level Among Females Between Ages 25 and 34 in Detroit
10.6%
53.7%
Zip Codes with the Highest Poverty Level Among Females Between Ages 25 and 34 in Detroit, MI
| Zip Code | Female Poverty | vs State | vs National | |
| 1. | 48211 | 53.7% | 16.5%(+37.1)#25 | 14.5%(+39.2)#1,423 |
| 2. | 48234 | 42.2% | 16.5%(+25.7)#54 | 14.5%(+27.7)#2,410 |
| 3. | 48238 | 41.4% | 16.5%(+24.8)#57 | 14.5%(+26.9)#2,515 |
| 4. | 48213 | 40.2% | 16.5%(+23.7)#61 | 14.5%(+25.7)#2,653 |
| 5. | 48204 | 39.7% | 16.5%(+23.1)#65 | 14.5%(+25.2)#2,758 |
| 6. | 48215 | 38.9% | 16.5%(+22.4)#67 | 14.5%(+24.4)#2,858 |
| 7. | 48209 | 38.3% | 16.5%(+21.8)#72 | 14.5%(+23.8)#2,940 |
| 8. | 48210 | 36.8% | 16.5%(+20.3)#77 | 14.5%(+22.4)#3,189 |
| 9. | 48219 | 36.0% | 16.5%(+19.5)#86 | 14.5%(+21.5)#3,347 |
| 10. | 48228 | 36.0% | 16.5%(+19.4)#88 | 14.5%(+21.5)#3,360 |
| 11. | 48216 | 35.1% | 16.5%(+18.5)#94 | 14.5%(+20.6)#3,540 |
| 12. | 48224 | 33.6% | 16.5%(+17.1)#106 | 14.5%(+19.1)#3,796 |
| 13. | 48227 | 33.2% | 16.5%(+16.7)#112 | 14.5%(+18.7)#3,954 |
| 14. | 48201 | 33.2% | 16.5%(+16.7)#113 | 14.5%(+18.7)#3,965 |
| 15. | 48208 | 30.7% | 16.5%(+14.2)#129 | 14.5%(+16.2)#4,509 |
| 16. | 48214 | 26.7% | 16.5%(+10.2)#171 | 14.5%(+12.2)#5,791 |
| 17. | 48207 | 26.7% | 16.5%(+10.2)#172 | 14.5%(+12.2)#5,802 |
| 18. | 48205 | 24.9% | 16.5%(+8.40)#207 | 14.5%(+10.4)#6,461 |
| 19. | 48206 | 24.6% | 16.5%(+8.03)#211 | 14.5%(+10.1)#6,605 |
| 20. | 48223 | 22.0% | 16.5%(+5.52)#255 | 14.5%(+7.55)#7,702 |
| 21. | 48235 | 21.9% | 16.5%(+5.36)#258 | 14.5%(+7.39)#7,760 |
| 22. | 48221 | 19.3% | 16.5%(+2.78)#318 | 14.5%(+4.81)#9,178 |
| 23. | 48202 | 15.4% | 16.5%(-1.16)#427 | 14.5%(+0.871)#11,753 |
| 24. | 48217 | 11.2% | 16.5%(-5.36)#550 | 14.5%(-3.33)#14,961 |
| 25. | 48226 | 10.6% | 16.5%(-5.93)#563 | 14.5%(-3.90)#15,483 |
1
Common Questions
What are the Top 10 Zip Codes with the Highest Poverty Level Among Females Between Ages 25 and 34 in Detroit, MI?
Top 10 Zip Codes with the Highest Poverty Level Among Females Between Ages 25 and 34 in Detroit, MI are:
What zip code has the Highest Poverty Level Among Females Between Ages 25 and 34 in Detroit, MI?
48211 has the Highest Poverty Level Among Females Between Ages 25 and 34 in Detroit, MI with 53.7%.
What is the Poverty Level Among Females Between Ages 25 and 34 in Detroit, MI?
Poverty Level Among Females Between Ages 25 and 34 in Detroit is 30.8%.
What is the Poverty Level Among Females Between Ages 25 and 34 in Michigan?
Poverty Level Among Females Between Ages 25 and 34 in Michigan is 16.5%.
What is the Poverty Level Among Females Between Ages 25 and 34 in the United States?
Poverty Level Among Females Between Ages 25 and 34 in the United States is 14.5%.