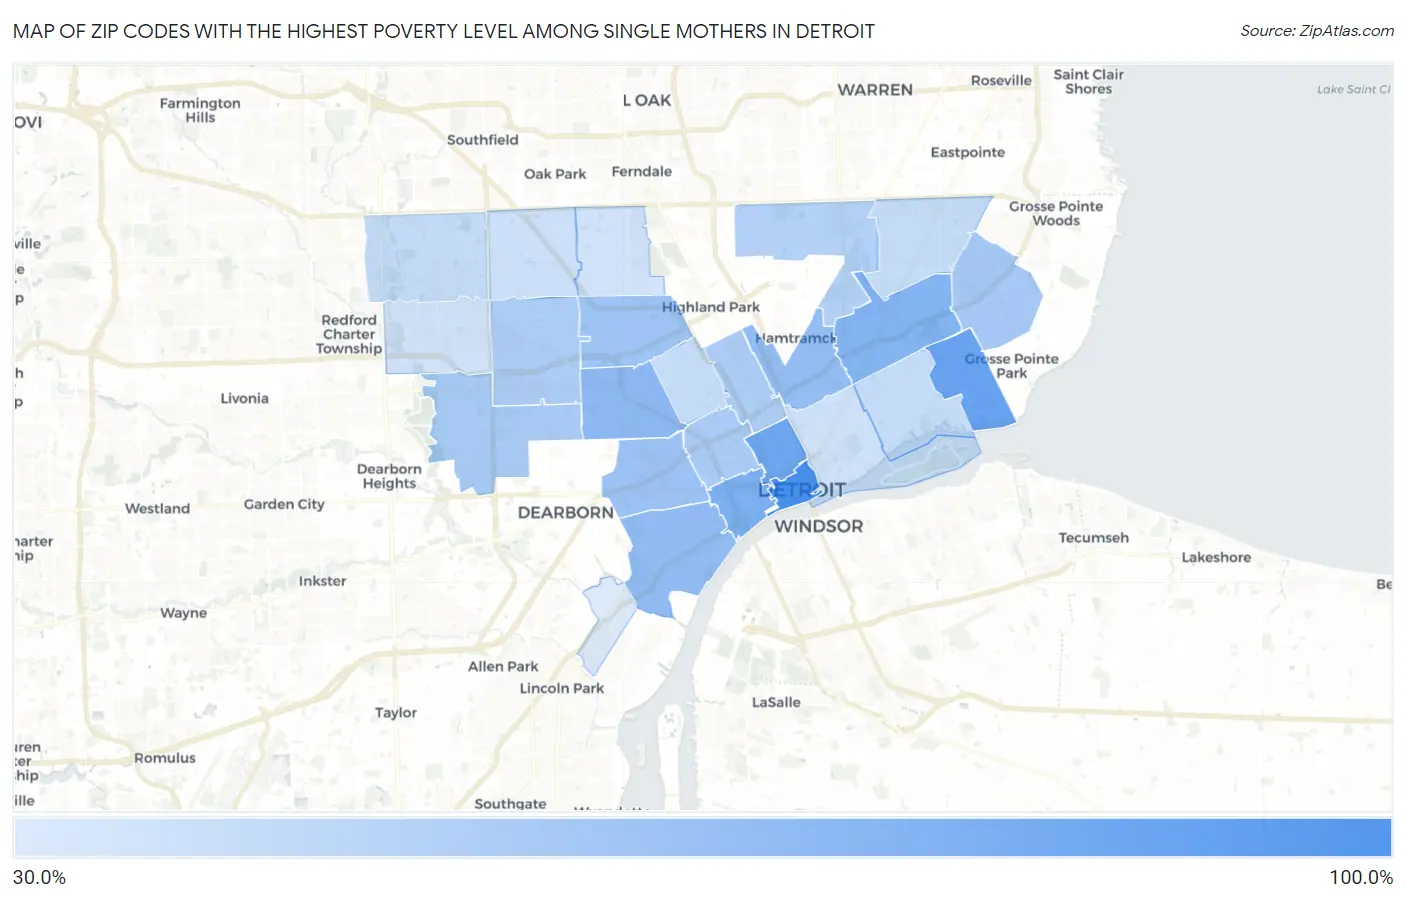
Zip Codes with the Highest Poverty Level Among Single Mothers in Detroit, MI
RELATED REPORTS & OPTIONS
Highest Poverty | Single Mother
Detroit
Compare Zip Codes
Map of Zip Codes with the Highest Poverty Level Among Single Mothers in Detroit
34.4%
83.3%
Zip Codes with the Highest Poverty Level Among Single Mothers in Detroit, MI
| Zip Code | Single Mother Poverty | vs State | vs National | |
| 1. | 48226 | 83.3% | 35.5%(+47.8)#31 | 33.1%(+50.2)#2,004 |
| 2. | 48215 | 71.5% | 35.5%(+35.9)#55 | 33.1%(+38.3)#2,936 |
| 3. | 48201 | 69.1% | 35.5%(+33.5)#67 | 33.1%(+35.9)#3,206 |
| 4. | 48216 | 63.9% | 35.5%(+28.4)#98 | 33.1%(+30.8)#3,857 |
| 5. | 48213 | 62.0% | 35.5%(+26.4)#111 | 33.1%(+28.8)#4,142 |
| 6. | 48204 | 59.2% | 35.5%(+23.7)#125 | 33.1%(+26.1)#4,604 |
| 7. | 48209 | 57.5% | 35.5%(+22.0)#136 | 33.1%(+24.4)#4,916 |
| 8. | 48211 | 56.9% | 35.5%(+21.3)#144 | 33.1%(+23.7)#5,076 |
| 9. | 48210 | 53.6% | 35.5%(+18.1)#170 | 33.1%(+20.5)#5,752 |
| 10. | 48238 | 53.0% | 35.5%(+17.5)#176 | 33.1%(+19.9)#5,886 |
| 11. | 48224 | 51.0% | 35.5%(+15.5)#191 | 33.1%(+17.9)#6,329 |
| 12. | 48228 | 49.8% | 35.5%(+14.3)#212 | 33.1%(+16.7)#6,822 |
| 13. | 48208 | 49.5% | 35.5%(+13.9)#213 | 33.1%(+16.3)#6,883 |
| 14. | 48202 | 48.6% | 35.5%(+13.1)#219 | 33.1%(+15.5)#7,085 |
| 15. | 48227 | 48.4% | 35.5%(+12.8)#223 | 33.1%(+15.2)#7,153 |
| 16. | 48234 | 46.3% | 35.5%(+10.8)#260 | 33.1%(+13.2)#7,776 |
| 17. | 48219 | 42.0% | 35.5%(+6.42)#302 | 33.1%(+8.82)#9,089 |
| 18. | 48205 | 41.3% | 35.5%(+5.75)#313 | 33.1%(+8.15)#9,314 |
| 19. | 48206 | 41.3% | 35.5%(+5.73)#314 | 33.1%(+8.13)#9,325 |
| 20. | 48214 | 40.9% | 35.5%(+5.41)#320 | 33.1%(+7.81)#9,440 |
| 21. | 48235 | 39.1% | 35.5%(+3.56)#343 | 33.1%(+5.96)#10,119 |
| 22. | 48207 | 38.6% | 35.5%(+3.10)#351 | 33.1%(+5.51)#10,277 |
| 23. | 48221 | 37.9% | 35.5%(+2.41)#358 | 33.1%(+4.81)#10,514 |
| 24. | 48223 | 37.5% | 35.5%(+1.96)#364 | 33.1%(+4.36)#10,731 |
| 25. | 48217 | 34.4% | 35.5%(-1.09)#409 | 33.1%(+1.31)#11,859 |
1
Common Questions
What are the Top 10 Zip Codes with the Highest Poverty Level Among Single Mothers in Detroit, MI?
Top 10 Zip Codes with the Highest Poverty Level Among Single Mothers in Detroit, MI are:
What zip code has the Highest Poverty Level Among Single Mothers in Detroit, MI?
48226 has the Highest Poverty Level Among Single Mothers in Detroit, MI with 83.3%.
What is the Poverty Level Among Single Mothers in Detroit, MI?
Poverty Level Among Single Mothers in Detroit is 47.8%.
What is the Poverty Level Among Single Mothers in Michigan?
Poverty Level Among Single Mothers in Michigan is 35.5%.
What is the Poverty Level Among Single Mothers in the United States?
Poverty Level Among Single Mothers in the United States is 33.1%.