Zip Codes with the Highest Percentage of Self-Employed / Incorporated in Detroit, MI
RELATED REPORTS & OPTIONS
Self-Employed / Incorporated
Detroit
Compare Zip Codes
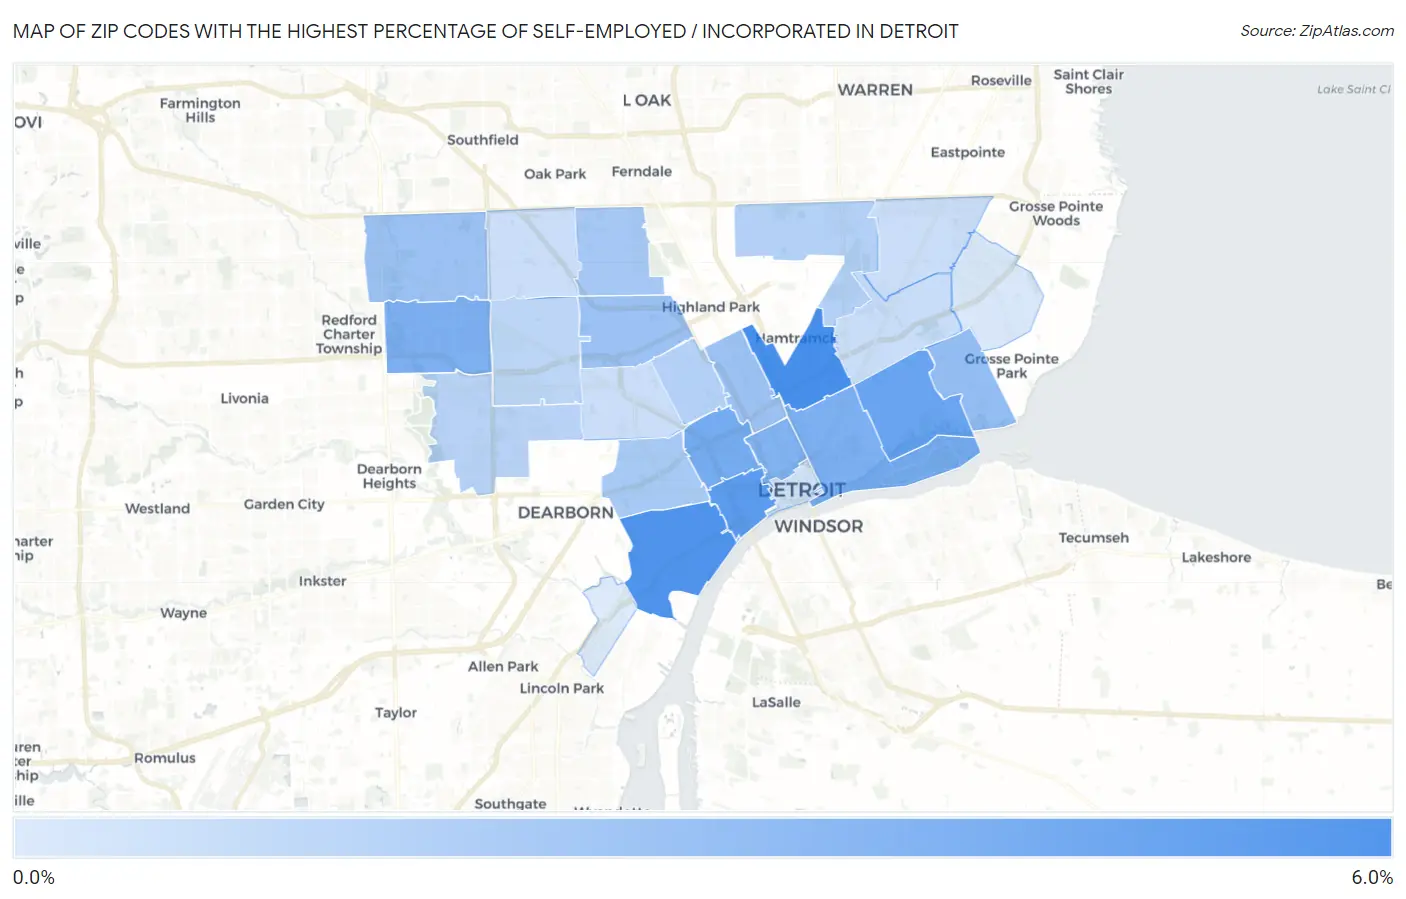
Map of Zip Codes with the Highest Percentage of Self-Employed / Incorporated in Detroit
0.0%
6.0%
Zip Codes with the Highest Percentage of Self-Employed / Incorporated in Detroit, MI
| Zip Code | % Self-Employed / Incorporated | vs State | vs National | |
| 1. | 48211 | 5.3% | 3.4%(+1.92)#189 | 3.8%(+1.51)#7,755 |
| 2. | 48209 | 5.0% | 3.4%(+1.64)#219 | 3.8%(+1.23)#8,463 |
| 3. | 48216 | 4.6% | 3.4%(+1.22)#262 | 3.8%(+0.806)#9,711 |
| 4. | 48214 | 4.2% | 3.4%(+0.782)#324 | 3.8%(+0.371)#11,206 |
| 5. | 48208 | 3.9% | 3.4%(+0.458)#383 | 3.8%(+0.047)#12,490 |
| 6. | 48207 | 3.7% | 3.4%(+0.247)#420 | 3.8%(-0.164)#13,383 |
| 7. | 48223 | 3.5% | 3.4%(+0.132)#432 | 3.8%(-0.279)#13,859 |
| 8. | 48201 | 3.5% | 3.4%(+0.102)#437 | 3.8%(-0.309)#13,991 |
| 9. | 48215 | 2.9% | 3.4%(-0.549)#551 | 3.8%(-0.960)#17,106 |
| 10. | 48202 | 2.7% | 3.4%(-0.750)#596 | 3.8%(-1.16)#18,122 |
| 11. | 48219 | 2.6% | 3.4%(-0.758)#599 | 3.8%(-1.17)#18,165 |
| 12. | 48238 | 2.6% | 3.4%(-0.790)#607 | 3.8%(-1.20)#18,357 |
| 13. | 48221 | 2.3% | 3.4%(-1.08)#663 | 3.8%(-1.50)#19,764 |
| 14. | 48210 | 2.3% | 3.4%(-1.15)#680 | 3.8%(-1.56)#20,086 |
| 15. | 48234 | 1.9% | 3.4%(-1.53)#743 | 3.8%(-1.94)#21,929 |
| 16. | 48206 | 1.9% | 3.4%(-1.53)#746 | 3.8%(-1.95)#21,956 |
| 17. | 48228 | 1.7% | 3.4%(-1.68)#772 | 3.8%(-2.09)#22,540 |
| 18. | 48227 | 1.6% | 3.4%(-1.81)#792 | 3.8%(-2.22)#23,109 |
| 19. | 48213 | 1.2% | 3.4%(-2.21)#848 | 3.8%(-2.63)#24,674 |
| 20. | 48204 | 1.2% | 3.4%(-2.25)#850 | 3.8%(-2.66)#24,784 |
| 21. | 48205 | 1.1% | 3.4%(-2.26)#852 | 3.8%(-2.68)#24,852 |
| 22. | 48235 | 1.1% | 3.4%(-2.27)#853 | 3.8%(-2.69)#24,882 |
| 23. | 48226 | 0.98% | 3.4%(-2.42)#867 | 3.8%(-2.83)#25,326 |
| 24. | 48224 | 0.69% | 3.4%(-2.72)#891 | 3.8%(-3.13)#26,090 |
| 25. | 48217 | 0.57% | 3.4%(-2.83)#899 | 3.8%(-3.24)#26,362 |
1
Common Questions
What are the Top 10 Zip Codes with the Highest Percentage of Self-Employed / Incorporated in Detroit, MI?
Top 10 Zip Codes with the Highest Percentage of Self-Employed / Incorporated in Detroit, MI are:
What zip code has the Highest Percentage of Self-Employed / Incorporated in Detroit, MI?
48211 has the Highest Percentage of Self-Employed / Incorporated in Detroit, MI with 5.3%.
What is the Percentage of Self-Employed / Incorporated in Detroit, MI?
Percentage of Self-Employed / Incorporated in Detroit is 2.2%.
What is the Percentage of Self-Employed / Incorporated in Michigan?
Percentage of Self-Employed / Incorporated in Michigan is 3.4%.
What is the Percentage of Self-Employed / Incorporated in the United States?
Percentage of Self-Employed / Incorporated in the United States is 3.8%.