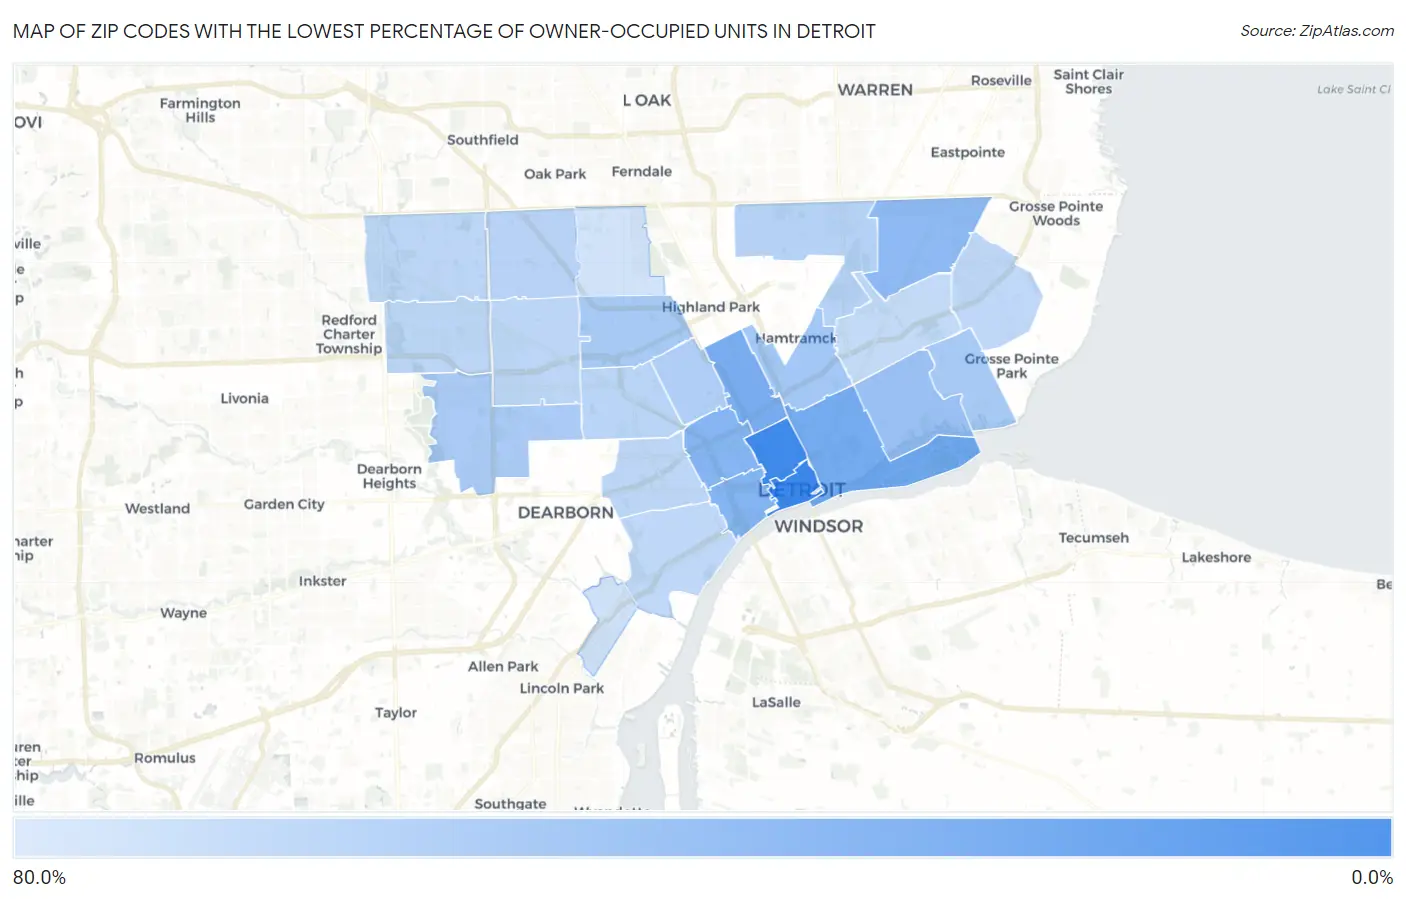
Zip Codes with the Lowest Percentage of Owner-Occupied Units in Detroit, MI
RELATED REPORTS & OPTIONS
Lowest Owner-Occupied
Detroit
Compare Zip Codes
Map of Zip Codes with the Lowest Percentage of Owner-Occupied Units in Detroit
64.0%
9.8%
Zip Codes with the Lowest Percentage of Owner-Occupied Units in Detroit, MI
| Zip Code | % Owner-Occupied | vs State | vs National | |
| 1. | 48226 | 9.8% | 72.5%(-62.7)#2 | 64.8%(-55.1)#162 |
| 2. | 48201 | 11.4% | 72.5%(-61.1)#4 | 64.8%(-53.4)#204 |
| 3. | 48207 | 28.1% | 72.5%(-44.4)#9 | 64.8%(-36.7)#663 |
| 4. | 48202 | 29.3% | 72.5%(-43.2)#10 | 64.8%(-35.5)#733 |
| 5. | 48216 | 32.9% | 72.5%(-39.6)#12 | 64.8%(-31.9)#934 |
| 6. | 48208 | 33.7% | 72.5%(-38.8)#13 | 64.8%(-31.1)#986 |
| 7. | 48205 | 36.8% | 72.5%(-35.7)#17 | 64.8%(-28.0)#1,237 |
| 8. | 48214 | 41.1% | 72.5%(-31.4)#23 | 64.8%(-23.7)#1,605 |
| 9. | 48211 | 45.2% | 72.5%(-27.3)#31 | 64.8%(-19.6)#2,067 |
| 10. | 48238 | 46.6% | 72.5%(-25.9)#33 | 64.8%(-18.2)#2,265 |
| 11. | 48215 | 46.9% | 72.5%(-25.6)#34 | 64.8%(-17.9)#2,306 |
| 12. | 48228 | 47.9% | 72.5%(-24.6)#36 | 64.8%(-16.9)#2,449 |
| 13. | 48206 | 50.1% | 72.5%(-22.4)#44 | 64.8%(-14.8)#2,806 |
| 14. | 48234 | 52.3% | 72.5%(-20.2)#48 | 64.8%(-12.5)#3,217 |
| 15. | 48235 | 53.3% | 72.5%(-19.2)#50 | 64.8%(-11.6)#3,386 |
| 16. | 48204 | 54.5% | 72.5%(-18.0)#54 | 64.8%(-10.3)#3,643 |
| 17. | 48219 | 55.2% | 72.5%(-17.3)#58 | 64.8%(-9.62)#3,814 |
| 18. | 48223 | 55.2% | 72.5%(-17.3)#59 | 64.8%(-9.62)#3,815 |
| 19. | 48227 | 55.4% | 72.5%(-17.1)#61 | 64.8%(-9.45)#3,856 |
| 20. | 48210 | 56.5% | 72.5%(-15.9)#65 | 64.8%(-8.27)#4,158 |
| 21. | 48209 | 56.9% | 72.5%(-15.6)#66 | 64.8%(-7.93)#4,250 |
| 22. | 48224 | 57.4% | 72.5%(-15.1)#70 | 64.8%(-7.45)#4,377 |
| 23. | 48213 | 58.1% | 72.5%(-14.3)#79 | 64.8%(-6.67)#4,577 |
| 24. | 48217 | 63.0% | 72.5%(-9.52)#108 | 64.8%(-1.84)#6,179 |
| 25. | 48221 | 64.0% | 72.5%(-8.53)#113 | 64.8%(-0.847)#6,586 |
1
Common Questions
What are the Top 10 Zip Codes with the Lowest Percentage of Owner-Occupied Units in Detroit, MI?
Top 10 Zip Codes with the Lowest Percentage of Owner-Occupied Units in Detroit, MI are:
What zip code has the Lowest Percentage of Owner-Occupied Units in Detroit, MI?
48226 has the Lowest Percentage of Owner-Occupied Units in Detroit, MI with 9.8%.
What is the Percentage of Owner-Occupied Units in Detroit, MI?
Percentage of Owner-Occupied Units in Detroit is 48.8%.
What is the Percentage of Owner-Occupied Units in Michigan?
Percentage of Owner-Occupied Units in Michigan is 72.5%.
What is the Percentage of Owner-Occupied Units in the United States?
Percentage of Owner-Occupied Units in the United States is 64.8%.