Zip Codes with the Highest Percentage of Population Employed in Firefighting & Prevention in Detroit, MI
RELATED REPORTS & OPTIONS
Firefighting & Prevention
Detroit
Compare Zip Codes
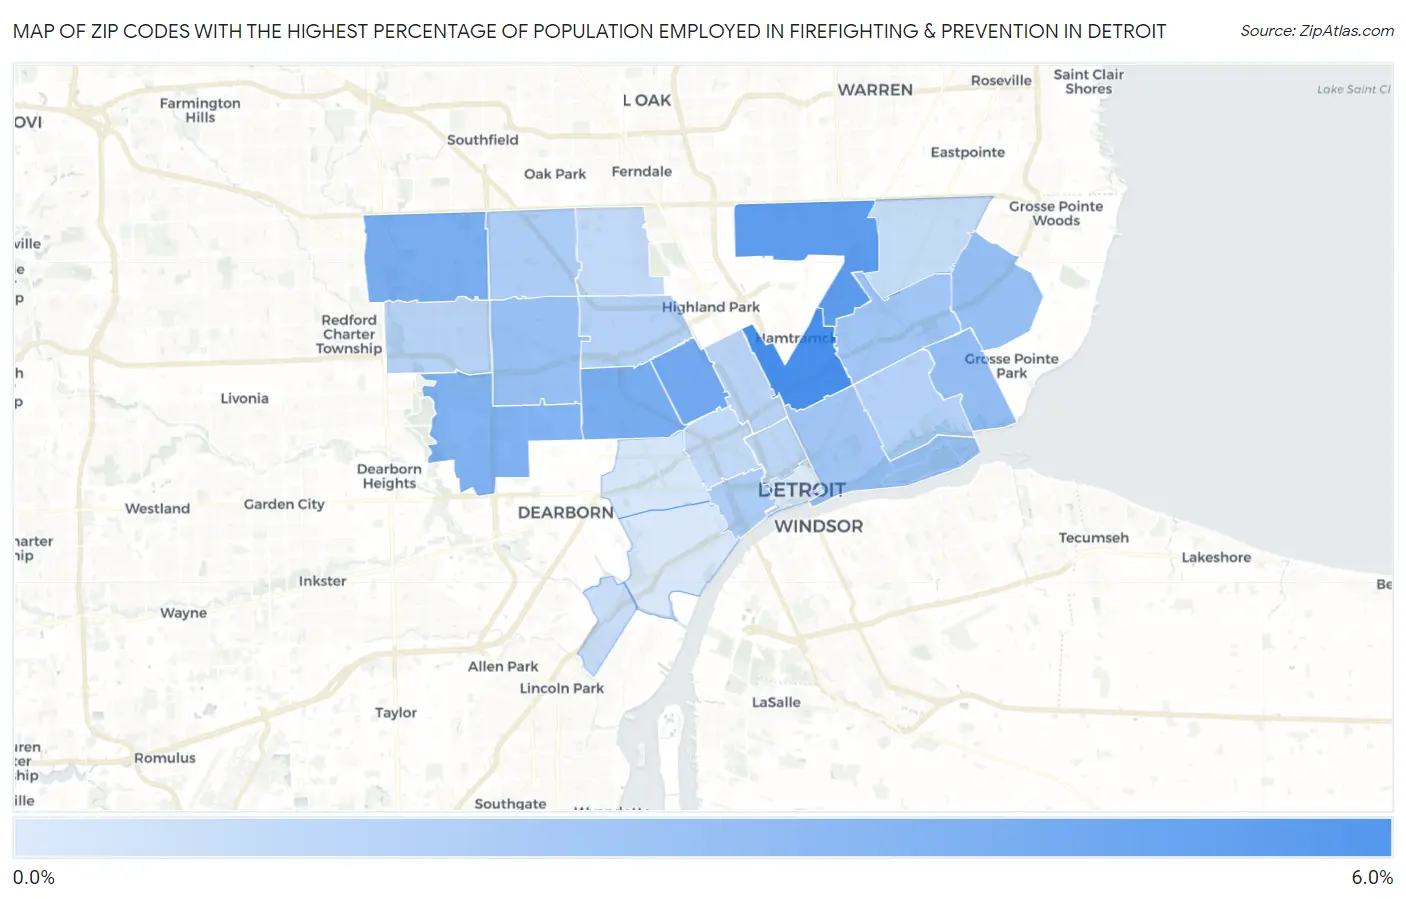
Map of Zip Codes with the Highest Percentage of Population Employed in Firefighting & Prevention in Detroit
0.66%
5.7%
Zip Codes with the Highest Percentage of Population Employed in Firefighting & Prevention in Detroit, MI
| Zip Code | % Employed | vs State | vs National | |
| 1. | 48211 | 5.7% | 0.89%(+4.83)#10 | 1.2%(+4.52)#729 |
| 2. | 48234 | 4.9% | 0.89%(+4.02)#13 | 1.2%(+3.72)#946 |
| 3. | 48206 | 4.3% | 0.89%(+3.40)#17 | 1.2%(+3.10)#1,210 |
| 4. | 48204 | 4.1% | 0.89%(+3.17)#22 | 1.2%(+2.87)#1,321 |
| 5. | 48219 | 4.0% | 0.89%(+3.08)#23 | 1.2%(+2.78)#1,379 |
| 6. | 48228 | 3.7% | 0.89%(+2.86)#26 | 1.2%(+2.56)#1,515 |
| 7. | 48215 | 3.1% | 0.89%(+2.25)#34 | 1.2%(+1.94)#2,104 |
| 8. | 48224 | 3.0% | 0.89%(+2.16)#37 | 1.2%(+1.86)#2,183 |
| 9. | 48227 | 2.9% | 0.89%(+2.04)#41 | 1.2%(+1.74)#2,338 |
| 10. | 48213 | 2.7% | 0.89%(+1.77)#48 | 1.2%(+1.46)#2,795 |
| 11. | 48207 | 2.6% | 0.89%(+1.73)#51 | 1.2%(+1.43)#2,867 |
| 12. | 48216 | 2.3% | 0.89%(+1.42)#64 | 1.2%(+1.12)#3,557 |
| 13. | 48235 | 2.3% | 0.89%(+1.39)#66 | 1.2%(+1.09)#3,624 |
| 14. | 48238 | 2.1% | 0.89%(+1.18)#79 | 1.2%(+0.883)#4,258 |
| 15. | 48214 | 2.0% | 0.89%(+1.13)#81 | 1.2%(+0.831)#4,456 |
| 16. | 48202 | 1.9% | 0.89%(+1.01)#93 | 1.2%(+0.704)#4,954 |
| 17. | 48223 | 1.9% | 0.89%(+0.996)#95 | 1.2%(+0.695)#4,996 |
| 18. | 48201 | 1.7% | 0.89%(+0.825)#108 | 1.2%(+0.525)#5,793 |
| 19. | 48208 | 1.6% | 0.89%(+0.690)#137 | 1.2%(+0.389)#6,520 |
| 20. | 48221 | 1.6% | 0.89%(+0.680)#138 | 1.2%(+0.380)#6,573 |
| 21. | 48205 | 1.4% | 0.89%(+0.520)#166 | 1.2%(+0.219)#7,617 |
| 22. | 48217 | 1.3% | 0.89%(+0.432)#185 | 1.2%(+0.131)#8,217 |
| 23. | 48210 | 0.88% | 0.89%(-0.004)#308 | 1.2%(-0.305)#12,361 |
| 24. | 48209 | 0.79% | 0.89%(-0.095)#354 | 1.2%(-0.396)#13,337 |
| 25. | 48226 | 0.66% | 0.89%(-0.225)#428 | 1.2%(-0.526)#14,797 |
1
Common Questions
What are the Top 10 Zip Codes with the Highest Percentage of Population Employed in Firefighting & Prevention in Detroit, MI?
Top 10 Zip Codes with the Highest Percentage of Population Employed in Firefighting & Prevention in Detroit, MI are:
What zip code has the Highest Percentage of Population Employed in Firefighting & Prevention in Detroit, MI?
48211 has the Highest Percentage of Population Employed in Firefighting & Prevention in Detroit, MI with 5.7%.
What is the Percentage of Population Employed in Firefighting & Prevention in Detroit, MI?
Percentage of Population Employed in Firefighting & Prevention in Detroit is 2.5%.
What is the Percentage of Population Employed in Firefighting & Prevention in Michigan?
Percentage of Population Employed in Firefighting & Prevention in Michigan is 0.89%.
What is the Percentage of Population Employed in Firefighting & Prevention in the United States?
Percentage of Population Employed in Firefighting & Prevention in the United States is 1.2%.