Zip Codes with the Highest Percentage of Population Employed in Legal Services & Support in Detroit, MI
RELATED REPORTS & OPTIONS
Legal Services & Support
Detroit
Compare Zip Codes
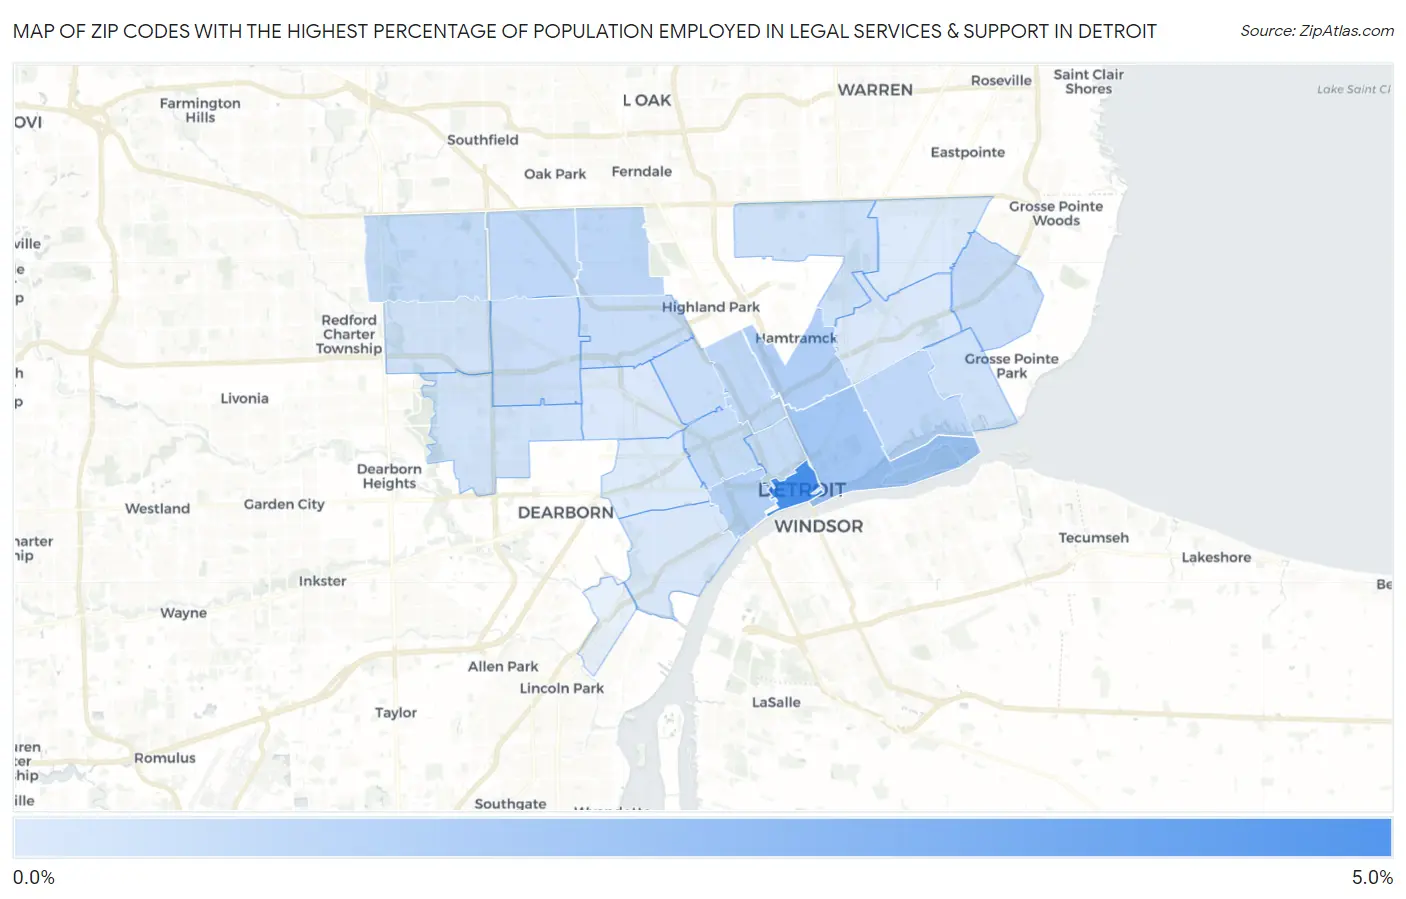
Map of Zip Codes with the Highest Percentage of Population Employed in Legal Services & Support in Detroit
0.16%
4.2%
Zip Codes with the Highest Percentage of Population Employed in Legal Services & Support in Detroit, MI
| Zip Code | % Employed | vs State | vs National | |
| 1. | 48226 | 4.2% | 0.89%(+3.27)#14 | 1.2%(+2.97)#1,046 |
| 2. | 48207 | 1.7% | 0.89%(+0.777)#89 | 1.2%(+0.479)#4,457 |
| 3. | 48211 | 1.3% | 0.89%(+0.438)#124 | 1.2%(+0.139)#5,819 |
| 4. | 48216 | 1.3% | 0.89%(+0.374)#138 | 1.2%(+0.075)#6,156 |
| 5. | 48221 | 1.0% | 0.89%(+0.146)#187 | 1.2%(-0.152)#7,610 |
| 6. | 48214 | 0.96% | 0.89%(+0.074)#210 | 1.2%(-0.224)#8,130 |
| 7. | 48202 | 0.95% | 0.89%(+0.067)#211 | 1.2%(-0.231)#8,192 |
| 8. | 48235 | 0.93% | 0.89%(+0.046)#215 | 1.2%(-0.252)#8,339 |
| 9. | 48219 | 0.80% | 0.89%(-0.086)#258 | 1.2%(-0.384)#9,446 |
| 10. | 48201 | 0.78% | 0.89%(-0.101)#263 | 1.2%(-0.400)#9,608 |
| 11. | 48208 | 0.74% | 0.89%(-0.148)#275 | 1.2%(-0.447)#10,035 |
| 12. | 48238 | 0.71% | 0.89%(-0.175)#282 | 1.2%(-0.474)#10,313 |
| 13. | 48206 | 0.71% | 0.89%(-0.179)#285 | 1.2%(-0.478)#10,344 |
| 14. | 48224 | 0.71% | 0.89%(-0.179)#286 | 1.2%(-0.478)#10,347 |
| 15. | 48227 | 0.66% | 0.89%(-0.222)#309 | 1.2%(-0.520)#10,802 |
| 16. | 48215 | 0.54% | 0.89%(-0.343)#361 | 1.2%(-0.642)#12,143 |
| 17. | 48234 | 0.49% | 0.89%(-0.395)#382 | 1.2%(-0.693)#12,750 |
| 18. | 48223 | 0.44% | 0.89%(-0.442)#409 | 1.2%(-0.741)#13,327 |
| 19. | 48228 | 0.44% | 0.89%(-0.447)#410 | 1.2%(-0.746)#13,376 |
| 20. | 48209 | 0.27% | 0.89%(-0.612)#507 | 1.2%(-0.910)#15,339 |
| 21. | 48204 | 0.24% | 0.89%(-0.646)#527 | 1.2%(-0.944)#15,758 |
| 22. | 48213 | 0.23% | 0.89%(-0.653)#530 | 1.2%(-0.951)#15,839 |
| 23. | 48205 | 0.18% | 0.89%(-0.710)#552 | 1.2%(-1.01)#16,448 |
| 24. | 48210 | 0.16% | 0.89%(-0.727)#567 | 1.2%(-1.03)#16,613 |
1
Common Questions
What are the Top 10 Zip Codes with the Highest Percentage of Population Employed in Legal Services & Support in Detroit, MI?
Top 10 Zip Codes with the Highest Percentage of Population Employed in Legal Services & Support in Detroit, MI are:
What zip code has the Highest Percentage of Population Employed in Legal Services & Support in Detroit, MI?
48226 has the Highest Percentage of Population Employed in Legal Services & Support in Detroit, MI with 4.2%.
What is the Percentage of Population Employed in Legal Services & Support in Detroit, MI?
Percentage of Population Employed in Legal Services & Support in Detroit is 0.71%.
What is the Percentage of Population Employed in Legal Services & Support in Michigan?
Percentage of Population Employed in Legal Services & Support in Michigan is 0.89%.
What is the Percentage of Population Employed in Legal Services & Support in the United States?
Percentage of Population Employed in Legal Services & Support in the United States is 1.2%.