Zip Codes with the Lowest Poverty Level in Detroit, MI

RELATED REPORTS & OPTIONS

Lowest Poverty
Population
Families and Households
Female Fertility
Female Fertility (Unmarried)
Race (Community Size)
Race (Percentage)
Ancestry (Community Size)
AfricanAlbanianAmericanApacheArabArgentineanArmenianAssyrian / Chaldean / SyriacAustralianAustrianBahamianBangladeshiBarbadianBelgianBelizeanBermudanBhutaneseBlackfeetBrazilianBritishBritish West IndianBurmeseCanadianCentral AmericanCentral American IndianCherokeeChippewaChoctawColombianCosta RicanCreekCroatianCubanCzechCzechoslovakianDanishDominicanDutchEastern EuropeanEcuadorianEgyptianEnglishEthiopianEuropeanFilipinoFinnishFrenchFrench American IndianFrench CanadianGermanGhanaianGreekGuamanian / ChamorroGuatemalanHaitianHonduranHungarianIndian (Asian)IndonesianIranianIraqiIrishIroquoisIsraeliItalianJamaicanJapaneseJordanianKoreanLebaneseLiberianLithuanianLumbeeMacedonianMalteseMexicanMexican American IndianMoroccanNative HawaiianNavajoNew ZealanderNicaraguanNigerianNorthern EuropeanNorwegianOttawaPakistaniPalestinianPanamanianPennsylvania GermanPeruvianPolishPortuguesePotawatomiPuerto RicanRomanianRussianSalvadoranSamoanScandinavianScotch-IrishScottishSenegaleseSerbianSlavicSlovakSloveneSouth AfricanSouth AmericanSouth American IndianSpaniardSpanishSri LankanSubsaharan AfricanSudaneseSwedishSwissSyrianThaiTrinidadian and TobagonianTurkishUkrainianVenezuelanVietnameseWelshWest IndianYugoslavian
Ancestry (Percentage)
AfricanAlbanianAmericanApacheArabArgentineanArmenianAssyrian / Chaldean / SyriacAustralianAustrianBahamianBangladeshiBarbadianBelgianBelizeanBermudanBhutaneseBlackfeetBrazilianBritishBritish West IndianBurmeseCanadianCentral AmericanCentral American IndianCherokeeChippewaChoctawColombianCosta RicanCreekCroatianCubanCzechCzechoslovakianDanishDominicanDutchEastern EuropeanEcuadorianEgyptianEnglishEthiopianEuropeanFilipinoFinnishFrenchFrench American IndianFrench CanadianGermanGhanaianGreekGuamanian / ChamorroGuatemalanHaitianHonduranHungarianIndian (Asian)IndonesianIranianIraqiIrishIroquoisIsraeliItalianJamaicanJapaneseJordanianKoreanLebaneseLiberianLithuanianLumbeeMacedonianMalteseMexicanMexican American IndianMoroccanNative HawaiianNavajoNew ZealanderNicaraguanNigerianNorthern EuropeanNorwegianOttawaPakistaniPalestinianPanamanianPennsylvania GermanPeruvianPolishPortuguesePotawatomiPuerto RicanRomanianRussianSalvadoranSamoanScandinavianScotch-IrishScottishSenegaleseSerbianSlavicSlovakSloveneSouth AfricanSouth AmericanSouth American IndianSpaniardSpanishSri LankanSubsaharan AfricanSudaneseSwedishSwissSyrianThaiTrinidadian and TobagonianTurkishUkrainianVenezuelanVietnameseWelshWest IndianYugoslavian
Immigrant Origin (Total)
Immigrant Origin (Percentage)
Income
Income (Families)
Income (Households)
Poverty
Poverty (Families)
Unemployment
Employment Occupations
Employment Industries
Employer Class
Commute Time
Commute Means
School Enrollment
Education by Degree Field
Occupancy
Finances
Physical Characteristics
Detroit
Compare Zip Codes
Comparison Subject

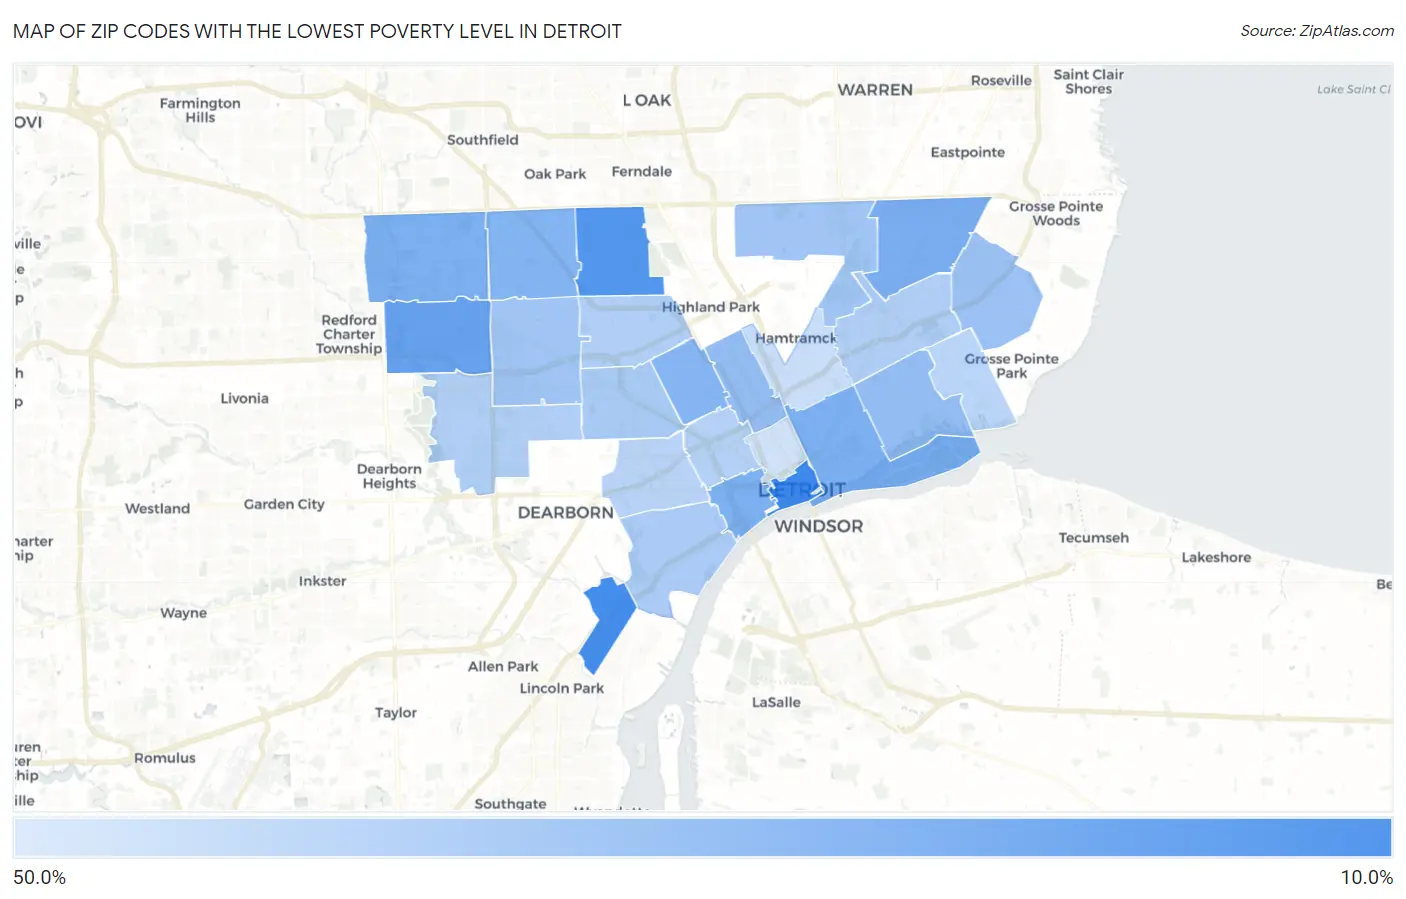
Map of Zip Codes with the Lowest Poverty Level in Detroit

50.0%
0.0%
Zip Codes with the Lowest Poverty Level in Detroit Map

Zip Codes with the Lowest Poverty Level in Detroit, MI

Zip Code Poverty vs State vs National
1.4822614.6%13.1%(+1.42)#66312.5%(+2.02)#20,231
2.4821716.4%13.1%(+3.29)#73812.5%(+3.89)#22,261
3.4822118.8%13.1%(+5.69)#80012.5%(+6.29)#24,264
4.4822322.6%13.1%(+9.50)#85912.5%(+10.1)#26,607
5.4820526.4%13.1%(+13.3)#88212.5%(+13.9)#27,982
6.4821926.7%13.1%(+13.5)#88412.5%(+14.1)#28,051
7.4820726.7%13.1%(+13.6)#88512.5%(+14.2)#28,055
8.4821627.3%13.1%(+14.2)#88912.5%(+14.8)#28,210
9.4823528.1%13.1%(+15.0)#89112.5%(+15.6)#28,411
10.4820628.4%13.1%(+15.3)#89312.5%(+15.9)#28,481
11.4821431.4%13.1%(+18.2)#90712.5%(+18.8)#29,061
12.4820231.5%13.1%(+18.3)#90812.5%(+18.9)#29,080
13.4822433.3%13.1%(+20.2)#92012.5%(+20.8)#29,411
14.4822734.2%13.1%(+21.0)#92412.5%(+21.6)#29,529
15.4823434.4%13.1%(+21.2)#93012.5%(+21.8)#29,561
16.4820435.8%13.1%(+22.7)#93512.5%(+23.3)#29,740
17.4820936.4%13.1%(+23.2)#93712.5%(+23.8)#29,805
18.4821337.0%13.1%(+23.8)#93812.5%(+24.4)#29,873
19.4822837.6%13.1%(+24.5)#93912.5%(+25.1)#29,929
20.4823837.8%13.1%(+24.7)#94012.5%(+25.3)#29,948
21.4820838.2%13.1%(+25.1)#94112.5%(+25.7)#29,983
22.4821039.2%13.1%(+26.0)#94412.5%(+26.6)#30,049
23.4821539.9%13.1%(+26.8)#94512.5%(+27.4)#30,108
24.4821142.9%13.1%(+29.8)#95012.5%(+30.4)#30,293
25.4820144.8%13.1%(+31.6)#95312.5%(+32.2)#30,380

Common Questions

What are the Top 10 Zip Codes with the Lowest Poverty Level in Detroit, MI?
Top 10 Zip Codes with the Lowest Poverty Level in Detroit, MI are:
#1
14.6%
#2
16.4%
#3
18.8%
#4
22.6%
#5
26.4%
#6
26.7%
#7
26.7%
#8
27.3%
#9
28.1%
#10
28.4%
What zip code has the Lowest Poverty Level in Detroit, MI?
48226 has the Lowest Poverty Level in Detroit, MI with 14.6%.
What is the Poverty Level in Detroit, MI?
Poverty Level in Detroit is 31.5%.
What is the Poverty Level in Michigan?
Poverty Level in Michigan is 13.1%.
What is the Poverty Level in the United States?
Poverty Level in the United States is 12.5%.