Zip Codes with the Highest Percentage of Self-Employed / Not Incorporated in Glenview, IL
RELATED REPORTS & OPTIONS
Self-Employed / Not Incorporated
Glenview
Compare Zip Codes
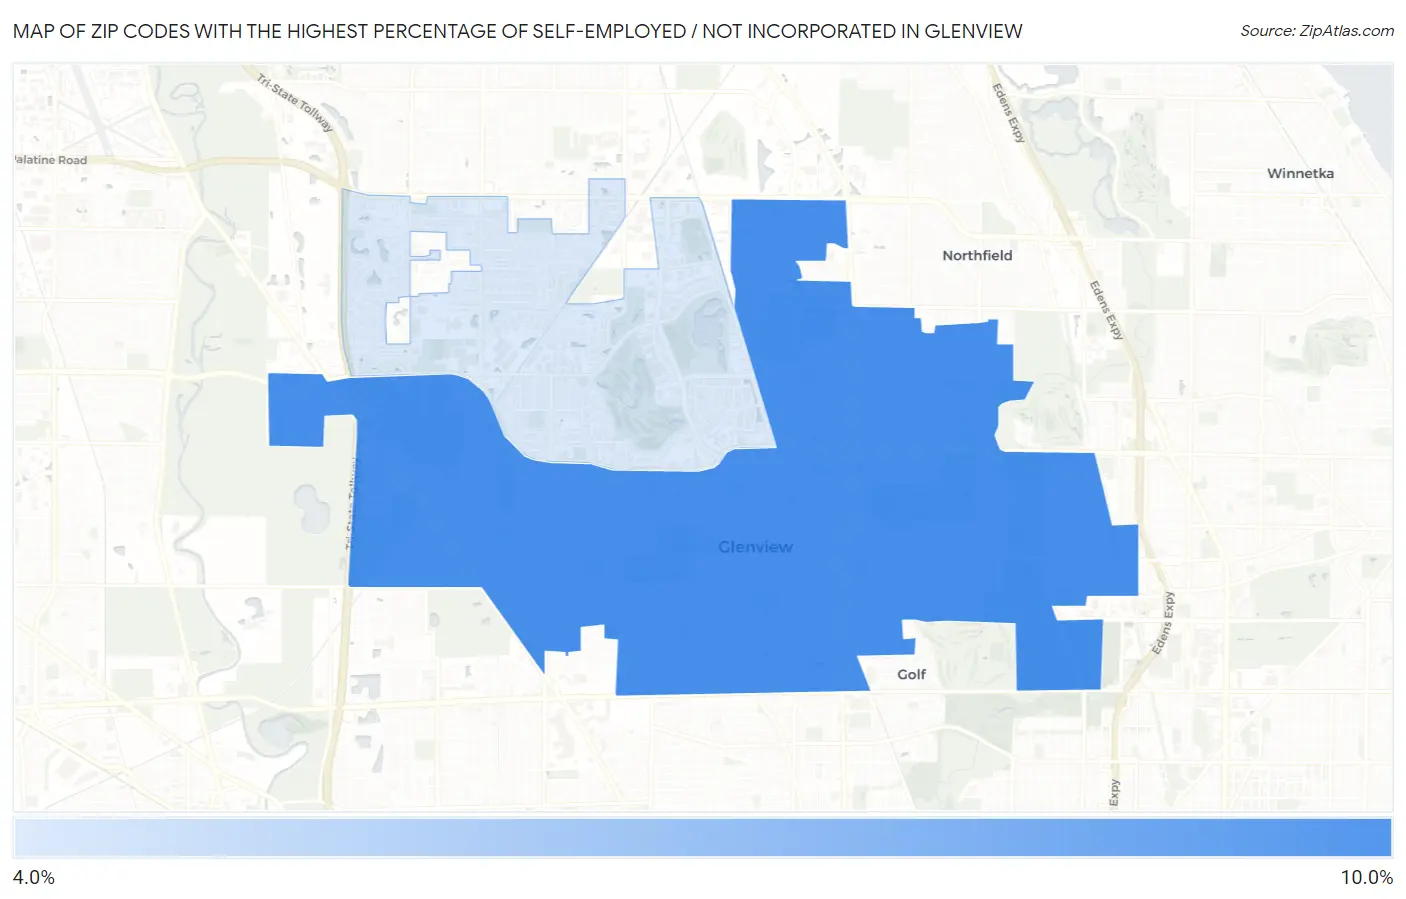
Map of Zip Codes with the Highest Percentage of Self-Employed / Not Incorporated in Glenview
0.0%
10.0%
Zip Codes with the Highest Percentage of Self-Employed / Not Incorporated in Glenview, IL
| Zip Code | % Self-Employed / Not Incorporated | vs State | vs National | |
| 1. | 60025 | 8.5% | 4.5%(+3.92)#292 | 5.8%(+2.64)#9,742 |
| 2. | 60026 | 4.9% | 4.5%(+0.352)#679 | 5.8%(-0.926)#20,082 |
1
Common Questions
What are the Top Zip Codes with the Highest Percentage of Self-Employed / Not Incorporated in Glenview, IL?
Top Zip Codes with the Highest Percentage of Self-Employed / Not Incorporated in Glenview, IL are:
What zip code has the Highest Percentage of Self-Employed / Not Incorporated in Glenview, IL?
60025 has the Highest Percentage of Self-Employed / Not Incorporated in Glenview, IL with 8.5%.
What is the Percentage of Self-Employed / Not Incorporated in Glenview, IL?
Percentage of Self-Employed / Not Incorporated in Glenview is 6.1%.
What is the Percentage of Self-Employed / Not Incorporated in Illinois?
Percentage of Self-Employed / Not Incorporated in Illinois is 4.5%.
What is the Percentage of Self-Employed / Not Incorporated in the United States?
Percentage of Self-Employed / Not Incorporated in the United States is 5.8%.