Zip Codes with the Highest Percentage of Population Employed in Computer & Mathematics in Glenview, IL
RELATED REPORTS & OPTIONS
Computer & Mathematics
Glenview
Compare Zip Codes
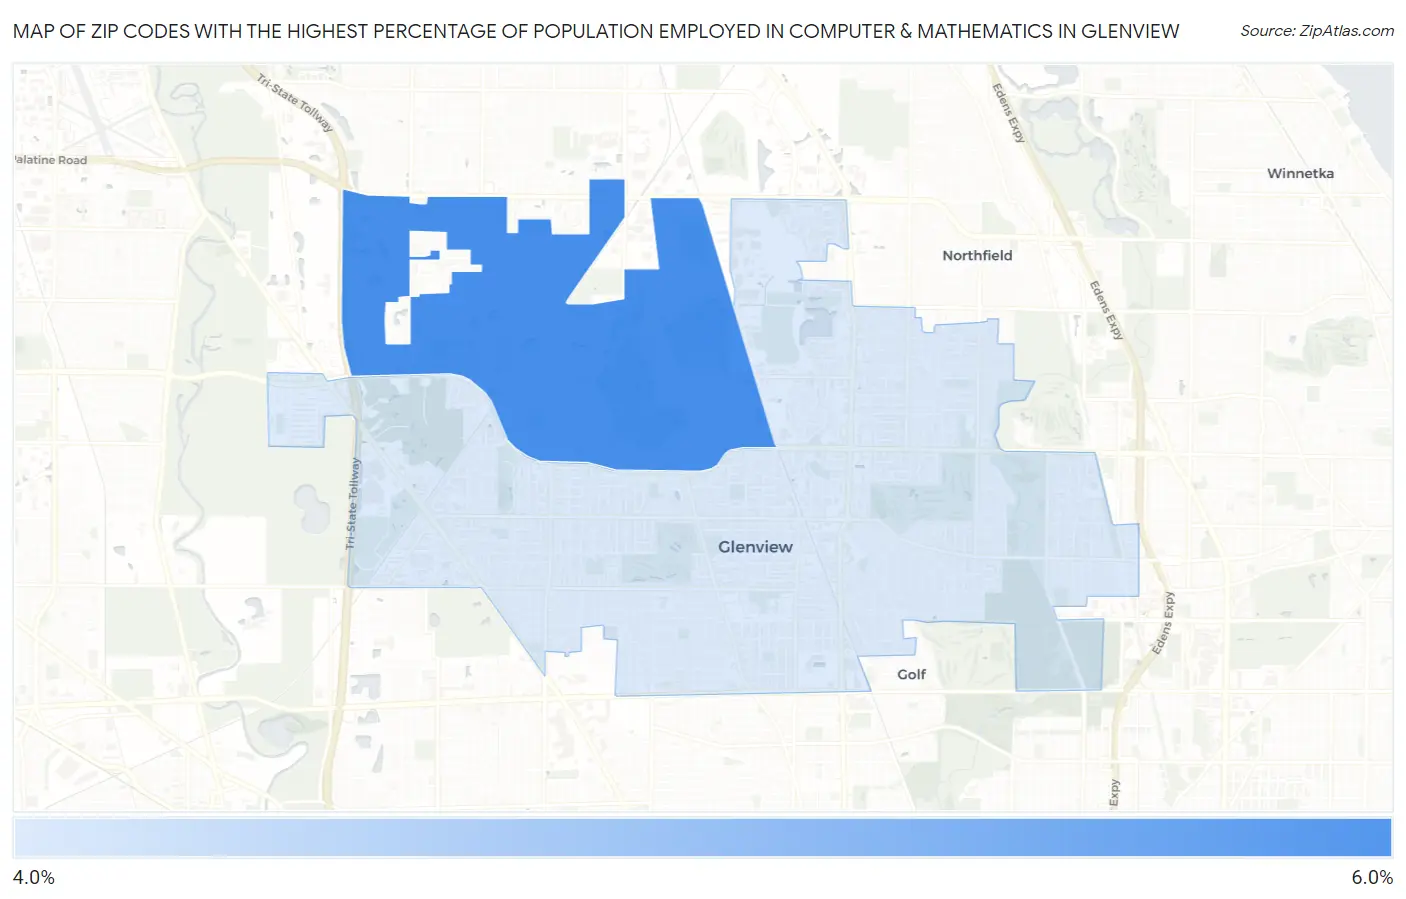
Map of Zip Codes with the Highest Percentage of Population Employed in Computer & Mathematics in Glenview
4.6%
5.6%
Zip Codes with the Highest Percentage of Population Employed in Computer & Mathematics in Glenview, IL
| Zip Code | % Employed | vs State | vs National | |
| 1. | 60026 | 5.6% | 3.6%(+1.99)#114 | 3.5%(+2.03)#2,728 |
| 2. | 60025 | 4.6% | 3.6%(+1.08)#166 | 3.5%(+1.12)#3,881 |
1
Common Questions
What are the Top Zip Codes with the Highest Percentage of Population Employed in Computer & Mathematics in Glenview, IL?
Top Zip Codes with the Highest Percentage of Population Employed in Computer & Mathematics in Glenview, IL are:
What zip code has the Highest Percentage of Population Employed in Computer & Mathematics in Glenview, IL?
60026 has the Highest Percentage of Population Employed in Computer & Mathematics in Glenview, IL with 5.6%.
What is the Percentage of Population Employed in Computer & Mathematics in Glenview, IL?
Percentage of Population Employed in Computer & Mathematics in Glenview is 5.2%.
What is the Percentage of Population Employed in Computer & Mathematics in Illinois?
Percentage of Population Employed in Computer & Mathematics in Illinois is 3.6%.
What is the Percentage of Population Employed in Computer & Mathematics in the United States?
Percentage of Population Employed in Computer & Mathematics in the United States is 3.5%.