Zip Codes with the Highest Percentage of Population Employed in Arts, Entertainment & Recreation in Glenview, IL
RELATED REPORTS & OPTIONS
Arts, Entertainment & Recreation
Glenview
Compare Zip Codes
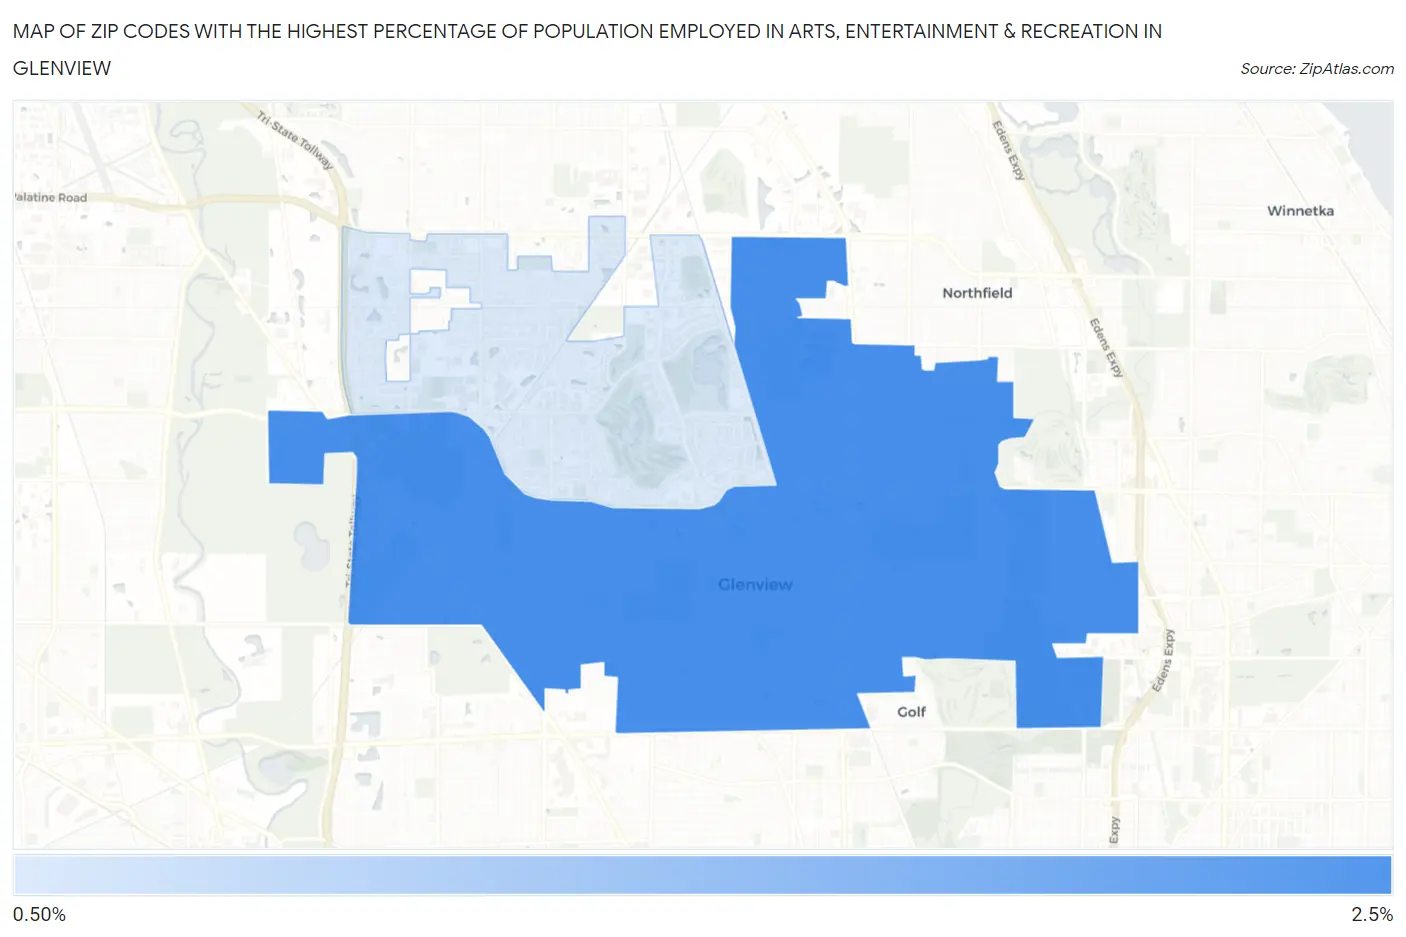
Map of Zip Codes with the Highest Percentage of Population Employed in Arts, Entertainment & Recreation in Glenview
0.81%
2.2%
Zip Codes with the Highest Percentage of Population Employed in Arts, Entertainment & Recreation in Glenview, IL
| Zip Code | % Employed | vs State | vs National | |
| 1. | 60025 | 2.2% | 1.9%(+0.277)#275 | 2.1%(+0.130)#8,561 |
| 2. | 60026 | 0.81% | 1.9%(-1.12)#711 | 2.1%(-1.27)#18,290 |
1
Common Questions
What are the Top Zip Codes with the Highest Percentage of Population Employed in Arts, Entertainment & Recreation in Glenview, IL?
Top Zip Codes with the Highest Percentage of Population Employed in Arts, Entertainment & Recreation in Glenview, IL are:
What zip code has the Highest Percentage of Population Employed in Arts, Entertainment & Recreation in Glenview, IL?
60025 has the Highest Percentage of Population Employed in Arts, Entertainment & Recreation in Glenview, IL with 2.2%.
What is the Percentage of Population Employed in Arts, Entertainment & Recreation in Glenview, IL?
Percentage of Population Employed in Arts, Entertainment & Recreation in Glenview is 2.0%.
What is the Percentage of Population Employed in Arts, Entertainment & Recreation in Illinois?
Percentage of Population Employed in Arts, Entertainment & Recreation in Illinois is 1.9%.
What is the Percentage of Population Employed in Arts, Entertainment & Recreation in the United States?
Percentage of Population Employed in Arts, Entertainment & Recreation in the United States is 2.1%.