Zip Codes with the Highest Percentage of Population Employed in Security & Protection in Glenview, IL
RELATED REPORTS & OPTIONS
Security & Protection
Glenview
Compare Zip Codes
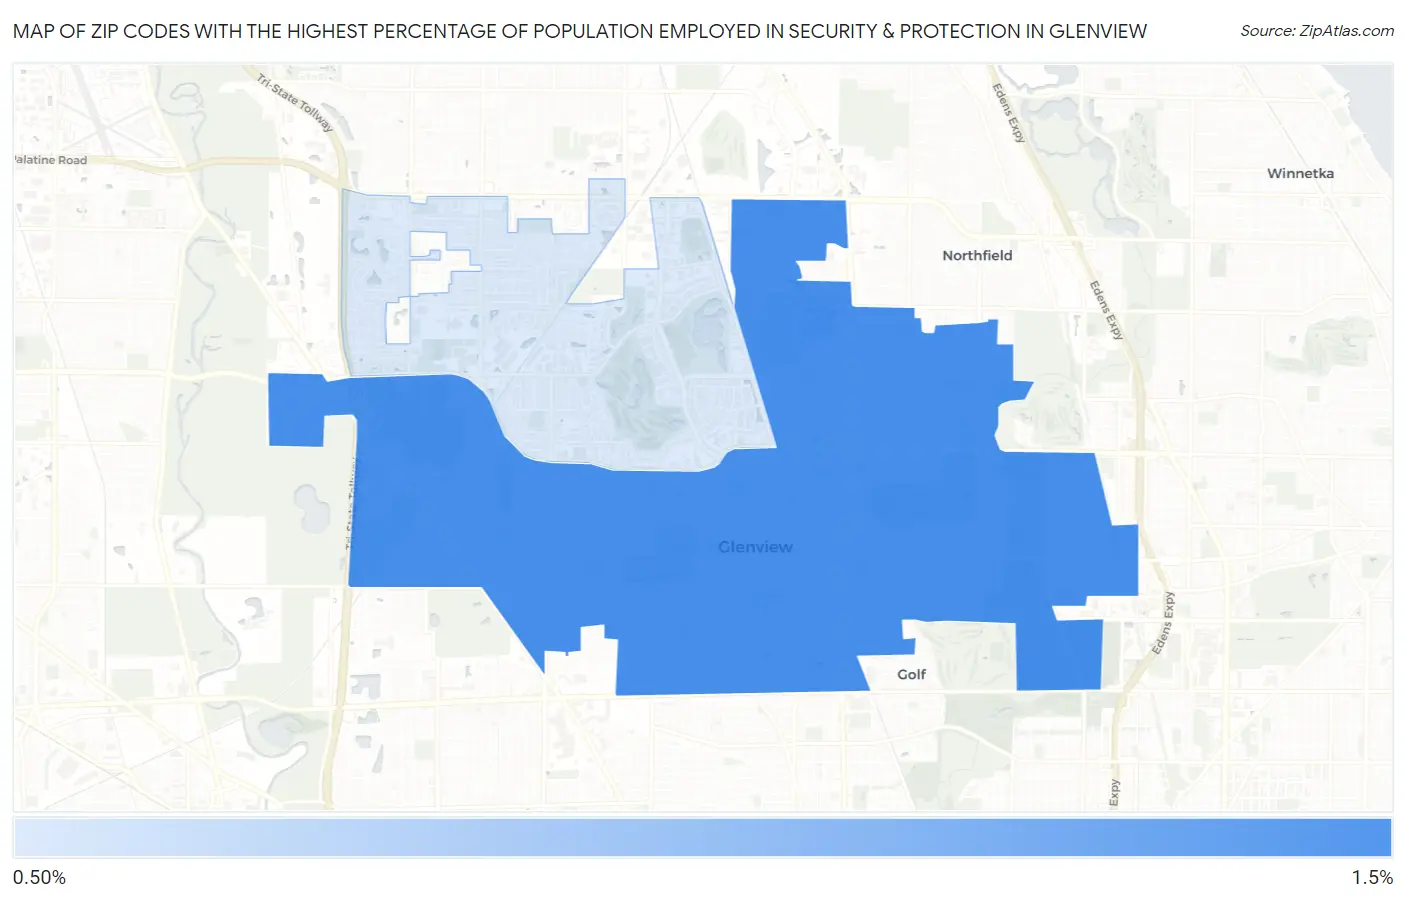
Map of Zip Codes with the Highest Percentage of Population Employed in Security & Protection in Glenview
0.54%
1.1%
Zip Codes with the Highest Percentage of Population Employed in Security & Protection in Glenview, IL
| Zip Code | % Employed | vs State | vs National | |
| 1. | 60025 | 1.1% | 2.2%(-1.08)#847 | 2.1%(-1.04)#19,220 |
| 2. | 60026 | 0.54% | 2.2%(-1.65)#1,034 | 2.1%(-1.61)#23,002 |
1
Common Questions
What are the Top Zip Codes with the Highest Percentage of Population Employed in Security & Protection in Glenview, IL?
Top Zip Codes with the Highest Percentage of Population Employed in Security & Protection in Glenview, IL are:
What zip code has the Highest Percentage of Population Employed in Security & Protection in Glenview, IL?
60025 has the Highest Percentage of Population Employed in Security & Protection in Glenview, IL with 1.1%.
What is the Percentage of Population Employed in Security & Protection in Glenview, IL?
Percentage of Population Employed in Security & Protection in Glenview is 0.66%.
What is the Percentage of Population Employed in Security & Protection in Illinois?
Percentage of Population Employed in Security & Protection in Illinois is 2.2%.
What is the Percentage of Population Employed in Security & Protection in the United States?
Percentage of Population Employed in Security & Protection in the United States is 2.1%.