Immigrants from Philippines vs Lithuanian GED/Equivalency
COMPARE
Immigrants from Philippines
Lithuanian
GED/Equivalency
GED/Equivalency Comparison
Immigrants from Philippines
Lithuanians
84.8%
GED/EQUIVALENCY
10.0/ 100
METRIC RATING
213th/ 347
METRIC RANK
88.9%
GED/EQUIVALENCY
99.9/ 100
METRIC RATING
12th/ 347
METRIC RANK
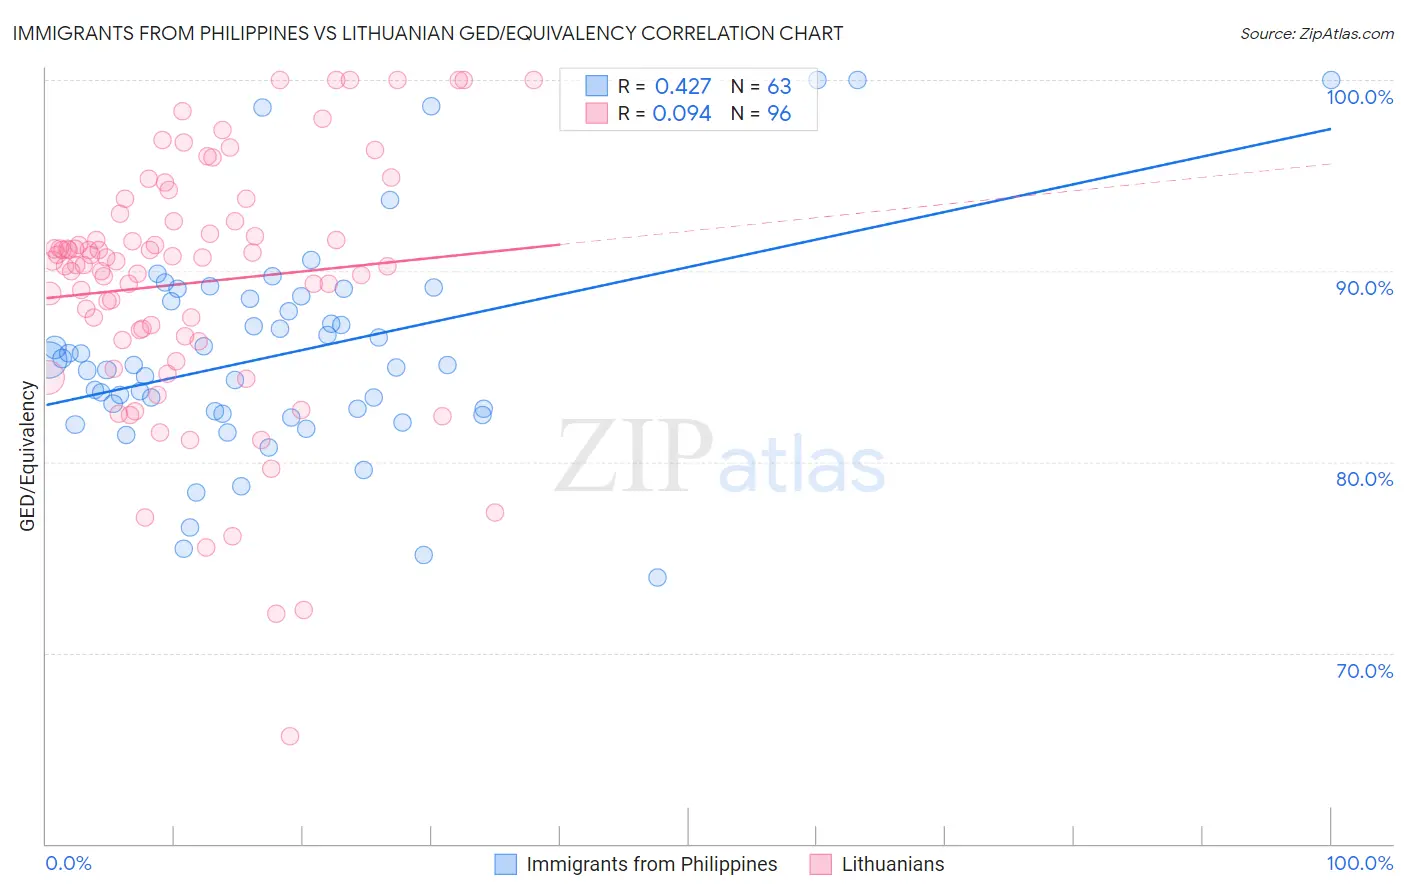
Immigrants from Philippines vs Lithuanian GED/Equivalency Correlation Chart
The statistical analysis conducted on geographies consisting of 471,300,535 people shows a moderate positive correlation between the proportion of Immigrants from Philippines and percentage of population with at least ged/equivalency education in the United States with a correlation coefficient (R) of 0.427 and weighted average of 84.8%. Similarly, the statistical analysis conducted on geographies consisting of 421,947,832 people shows a slight positive correlation between the proportion of Lithuanians and percentage of population with at least ged/equivalency education in the United States with a correlation coefficient (R) of 0.094 and weighted average of 88.9%, a difference of 4.9%.
GED/Equivalency Correlation Summary
| Measurement | Immigrants from Philippines | Lithuanian |
| Minimum | 73.9% | 65.6% |
| Maximum | 100.0% | 100.0% |
| Range | 26.1% | 34.4% |
| Mean | 85.7% | 89.4% |
| Median | 85.0% | 90.5% |
| Interquartile 25% (IQ1) | 82.5% | 86.5% |
| Interquartile 75% (IQ3) | 88.5% | 92.6% |
| Interquartile Range (IQR) | 6.0% | 6.1% |
| Standard Deviation (Sample) | 5.6% | 6.6% |
| Standard Deviation (Population) | 5.6% | 6.5% |
Similar Demographics by GED/Equivalency
Demographics Similar to Immigrants from Philippines by GED/Equivalency
In terms of ged/equivalency, the demographic groups most similar to Immigrants from Philippines are Immigrants from Somalia (84.8%, a difference of 0.030%), Osage (84.8%, a difference of 0.030%), South American (84.8%, a difference of 0.050%), Peruvian (84.7%, a difference of 0.050%), and Immigrants from Micronesia (84.7%, a difference of 0.080%).
| Demographics | Rating | Rank | GED/Equivalency |
| Samoans | 13.7 /100 | #206 | Poor 84.9% |
| Hmong | 13.1 /100 | #207 | Poor 84.9% |
| Marshallese | 12.5 /100 | #208 | Poor 84.9% |
| Colombians | 12.3 /100 | #209 | Poor 84.9% |
| Immigrants | Cameroon | 12.1 /100 | #210 | Poor 84.9% |
| South Americans | 10.9 /100 | #211 | Poor 84.8% |
| Immigrants | Somalia | 10.6 /100 | #212 | Poor 84.8% |
| Immigrants | Philippines | 10.0 /100 | #213 | Poor 84.8% |
| Osage | 9.5 /100 | #214 | Tragic 84.8% |
| Peruvians | 9.2 /100 | #215 | Tragic 84.7% |
| Immigrants | Micronesia | 8.7 /100 | #216 | Tragic 84.7% |
| Nigerians | 8.6 /100 | #217 | Tragic 84.7% |
| Alaska Natives | 8.6 /100 | #218 | Tragic 84.7% |
| Potawatomi | 8.2 /100 | #219 | Tragic 84.7% |
| Americans | 8.2 /100 | #220 | Tragic 84.7% |
Demographics Similar to Lithuanians by GED/Equivalency
In terms of ged/equivalency, the demographic groups most similar to Lithuanians are Immigrants from Iran (88.9%, a difference of 0.010%), Bulgarian (89.0%, a difference of 0.040%), Cypriot (88.9%, a difference of 0.040%), Okinawan (88.9%, a difference of 0.050%), and Norwegian (89.0%, a difference of 0.080%).
| Demographics | Rating | Rank | GED/Equivalency |
| Latvians | 100.0 /100 | #5 | Exceptional 89.2% |
| Thais | 100.0 /100 | #6 | Exceptional 89.1% |
| Eastern Europeans | 99.9 /100 | #7 | Exceptional 89.1% |
| Carpatho Rusyns | 99.9 /100 | #8 | Exceptional 89.1% |
| Chinese | 99.9 /100 | #9 | Exceptional 89.0% |
| Norwegians | 99.9 /100 | #10 | Exceptional 89.0% |
| Bulgarians | 99.9 /100 | #11 | Exceptional 89.0% |
| Lithuanians | 99.9 /100 | #12 | Exceptional 88.9% |
| Immigrants | Iran | 99.9 /100 | #13 | Exceptional 88.9% |
| Cypriots | 99.9 /100 | #14 | Exceptional 88.9% |
| Okinawans | 99.9 /100 | #15 | Exceptional 88.9% |
| Immigrants | Taiwan | 99.9 /100 | #16 | Exceptional 88.8% |
| Croatians | 99.9 /100 | #17 | Exceptional 88.8% |
| Slovenes | 99.9 /100 | #18 | Exceptional 88.8% |
| Swedes | 99.9 /100 | #19 | Exceptional 88.8% |