Immigrants from Philippines vs Immigrants from Caribbean GED/Equivalency
COMPARE
Immigrants from Philippines
Immigrants from Caribbean
GED/Equivalency
GED/Equivalency Comparison
Immigrants from Philippines
Immigrants from Caribbean
84.8%
GED/EQUIVALENCY
10.0/ 100
METRIC RATING
213th/ 347
METRIC RANK
80.5%
GED/EQUIVALENCY
0.0/ 100
METRIC RATING
317th/ 347
METRIC RANK
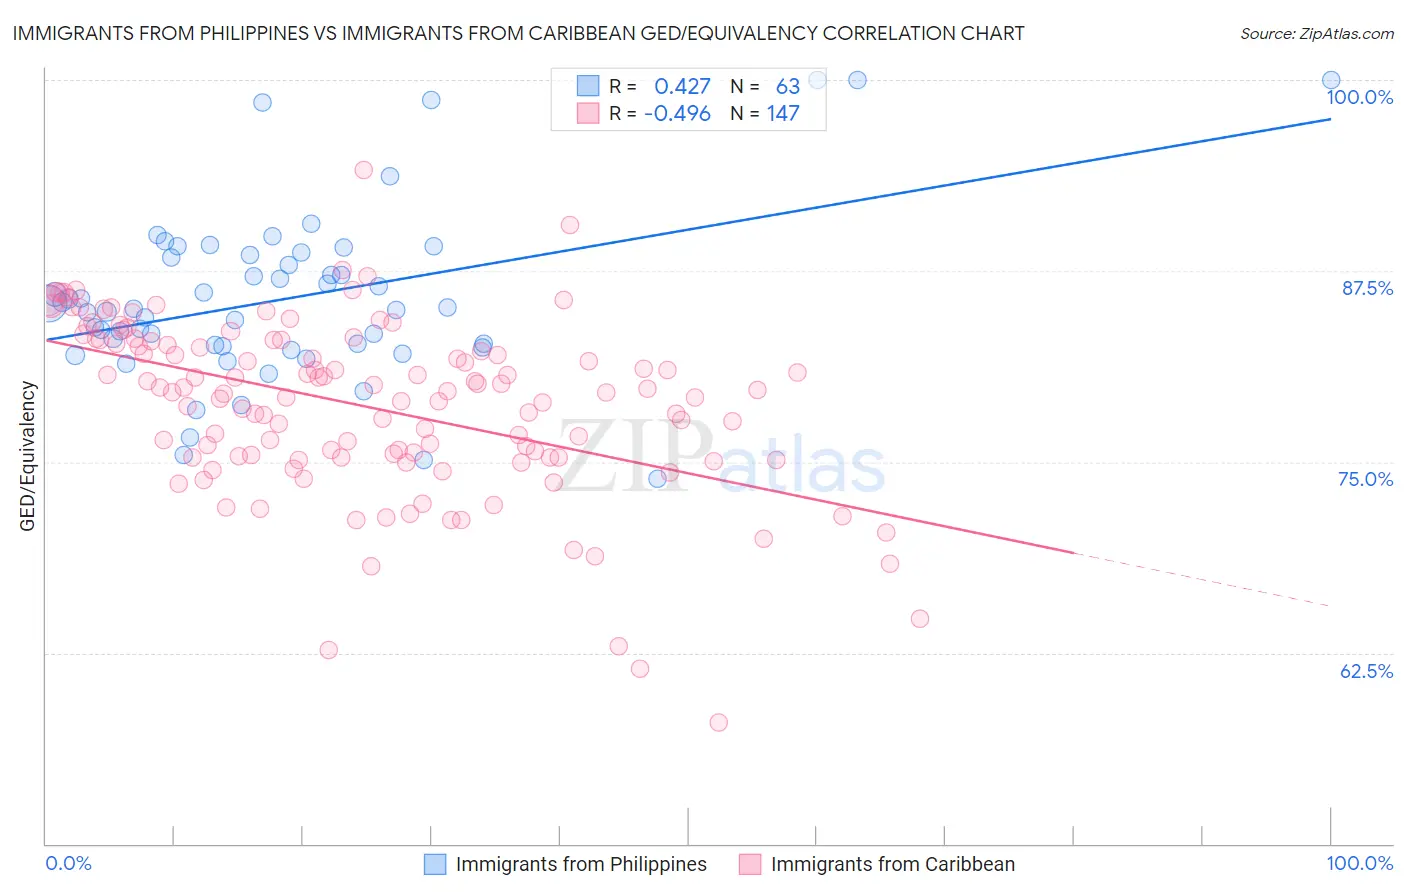
Immigrants from Philippines vs Immigrants from Caribbean GED/Equivalency Correlation Chart
The statistical analysis conducted on geographies consisting of 471,300,535 people shows a moderate positive correlation between the proportion of Immigrants from Philippines and percentage of population with at least ged/equivalency education in the United States with a correlation coefficient (R) of 0.427 and weighted average of 84.8%. Similarly, the statistical analysis conducted on geographies consisting of 450,064,654 people shows a moderate negative correlation between the proportion of Immigrants from Caribbean and percentage of population with at least ged/equivalency education in the United States with a correlation coefficient (R) of -0.496 and weighted average of 80.5%, a difference of 5.3%.
GED/Equivalency Correlation Summary
| Measurement | Immigrants from Philippines | Immigrants from Caribbean |
| Minimum | 73.9% | 58.0% |
| Maximum | 100.0% | 94.1% |
| Range | 26.1% | 36.2% |
| Mean | 85.7% | 78.7% |
| Median | 85.0% | 79.5% |
| Interquartile 25% (IQ1) | 82.5% | 75.3% |
| Interquartile 75% (IQ3) | 88.5% | 82.9% |
| Interquartile Range (IQR) | 6.0% | 7.6% |
| Standard Deviation (Sample) | 5.6% | 5.7% |
| Standard Deviation (Population) | 5.6% | 5.7% |
Similar Demographics by GED/Equivalency
Demographics Similar to Immigrants from Philippines by GED/Equivalency
In terms of ged/equivalency, the demographic groups most similar to Immigrants from Philippines are Immigrants from Somalia (84.8%, a difference of 0.030%), Osage (84.8%, a difference of 0.030%), South American (84.8%, a difference of 0.050%), Peruvian (84.7%, a difference of 0.050%), and Immigrants from Micronesia (84.7%, a difference of 0.080%).
| Demographics | Rating | Rank | GED/Equivalency |
| Samoans | 13.7 /100 | #206 | Poor 84.9% |
| Hmong | 13.1 /100 | #207 | Poor 84.9% |
| Marshallese | 12.5 /100 | #208 | Poor 84.9% |
| Colombians | 12.3 /100 | #209 | Poor 84.9% |
| Immigrants | Cameroon | 12.1 /100 | #210 | Poor 84.9% |
| South Americans | 10.9 /100 | #211 | Poor 84.8% |
| Immigrants | Somalia | 10.6 /100 | #212 | Poor 84.8% |
| Immigrants | Philippines | 10.0 /100 | #213 | Poor 84.8% |
| Osage | 9.5 /100 | #214 | Tragic 84.8% |
| Peruvians | 9.2 /100 | #215 | Tragic 84.7% |
| Immigrants | Micronesia | 8.7 /100 | #216 | Tragic 84.7% |
| Nigerians | 8.6 /100 | #217 | Tragic 84.7% |
| Alaska Natives | 8.6 /100 | #218 | Tragic 84.7% |
| Potawatomi | 8.2 /100 | #219 | Tragic 84.7% |
| Americans | 8.2 /100 | #220 | Tragic 84.7% |
Demographics Similar to Immigrants from Caribbean by GED/Equivalency
In terms of ged/equivalency, the demographic groups most similar to Immigrants from Caribbean are Yaqui (80.5%, a difference of 0.020%), Immigrants from Belize (80.5%, a difference of 0.020%), Central American Indian (80.6%, a difference of 0.10%), Apache (80.7%, a difference of 0.24%), and Immigrants from Cuba (80.2%, a difference of 0.43%).
| Demographics | Rating | Rank | GED/Equivalency |
| Immigrants | Guyana | 0.0 /100 | #310 | Tragic 81.0% |
| Natives/Alaskans | 0.0 /100 | #311 | Tragic 80.9% |
| Nicaraguans | 0.0 /100 | #312 | Tragic 80.9% |
| Cape Verdeans | 0.0 /100 | #313 | Tragic 80.9% |
| Belizeans | 0.0 /100 | #314 | Tragic 80.9% |
| Apache | 0.0 /100 | #315 | Tragic 80.7% |
| Central American Indians | 0.0 /100 | #316 | Tragic 80.6% |
| Immigrants | Caribbean | 0.0 /100 | #317 | Tragic 80.5% |
| Yaqui | 0.0 /100 | #318 | Tragic 80.5% |
| Immigrants | Belize | 0.0 /100 | #319 | Tragic 80.5% |
| Immigrants | Cuba | 0.0 /100 | #320 | Tragic 80.2% |
| Yup'ik | 0.0 /100 | #321 | Tragic 80.0% |
| Lumbee | 0.0 /100 | #322 | Tragic 80.0% |
| Immigrants | Nicaragua | 0.0 /100 | #323 | Tragic 79.9% |
| Mexican American Indians | 0.0 /100 | #324 | Tragic 79.4% |