Alsatian vs Immigrants from Hong Kong GED/Equivalency
COMPARE
Alsatian
Immigrants from Hong Kong
GED/Equivalency
GED/Equivalency Comparison
Alsatians
Immigrants from Hong Kong
86.0%
GED/EQUIVALENCY
64.3/ 100
METRIC RATING
165th/ 347
METRIC RANK
86.9%
GED/EQUIVALENCY
93.8/ 100
METRIC RATING
117th/ 347
METRIC RANK
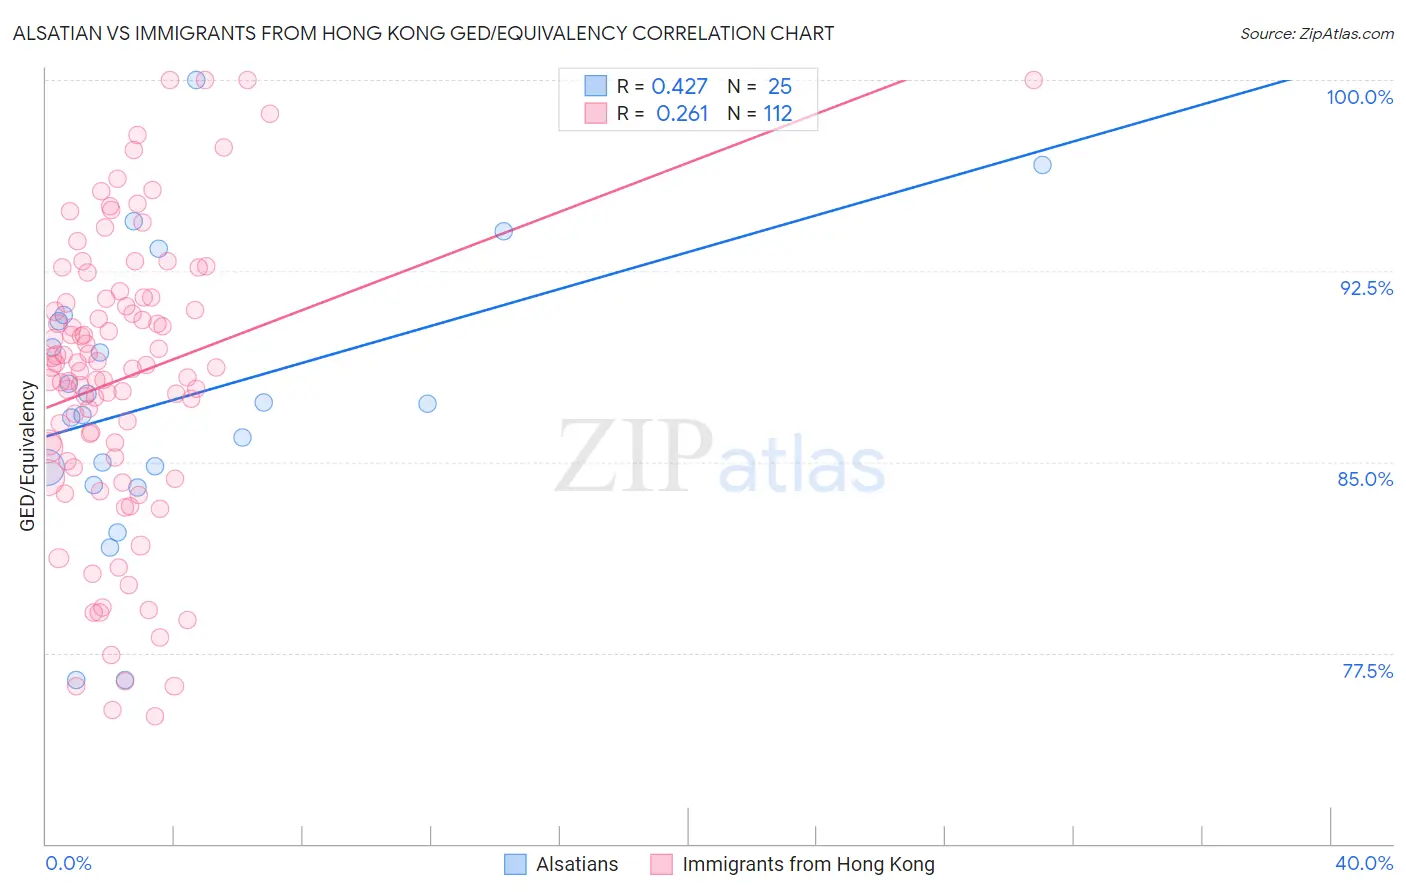
Alsatian vs Immigrants from Hong Kong GED/Equivalency Correlation Chart
The statistical analysis conducted on geographies consisting of 82,682,365 people shows a moderate positive correlation between the proportion of Alsatians and percentage of population with at least ged/equivalency education in the United States with a correlation coefficient (R) of 0.427 and weighted average of 86.0%. Similarly, the statistical analysis conducted on geographies consisting of 253,990,250 people shows a weak positive correlation between the proportion of Immigrants from Hong Kong and percentage of population with at least ged/equivalency education in the United States with a correlation coefficient (R) of 0.261 and weighted average of 86.9%, a difference of 1.1%.
GED/Equivalency Correlation Summary
| Measurement | Alsatian | Immigrants from Hong Kong |
| Minimum | 76.4% | 75.0% |
| Maximum | 100.0% | 100.0% |
| Range | 23.6% | 25.0% |
| Mean | 87.5% | 88.3% |
| Median | 87.3% | 88.7% |
| Interquartile 25% (IQ1) | 84.5% | 85.1% |
| Interquartile 75% (IQ3) | 90.6% | 91.4% |
| Interquartile Range (IQR) | 6.2% | 6.3% |
| Standard Deviation (Sample) | 5.6% | 5.7% |
| Standard Deviation (Population) | 5.5% | 5.7% |
Similar Demographics by GED/Equivalency
Demographics Similar to Alsatians by GED/Equivalency
In terms of ged/equivalency, the demographic groups most similar to Alsatians are Immigrants from Albania (86.0%, a difference of 0.0%), Ethiopian (86.0%, a difference of 0.010%), Venezuelan (86.0%, a difference of 0.030%), Ugandan (86.1%, a difference of 0.040%), and Sierra Leonean (86.0%, a difference of 0.050%).
| Demographics | Rating | Rank | GED/Equivalency |
| German Russians | 72.1 /100 | #158 | Good 86.2% |
| Immigrants | Kenya | 71.8 /100 | #159 | Good 86.2% |
| Immigrants | Morocco | 69.5 /100 | #160 | Good 86.1% |
| Immigrants | Syria | 69.3 /100 | #161 | Good 86.1% |
| Immigrants | Iraq | 68.1 /100 | #162 | Good 86.1% |
| Ugandans | 66.3 /100 | #163 | Good 86.1% |
| Venezuelans | 65.5 /100 | #164 | Good 86.0% |
| Alsatians | 64.3 /100 | #165 | Good 86.0% |
| Immigrants | Albania | 64.2 /100 | #166 | Good 86.0% |
| Ethiopians | 63.7 /100 | #167 | Good 86.0% |
| Sierra Leoneans | 61.8 /100 | #168 | Good 86.0% |
| Immigrants | Ethiopia | 61.2 /100 | #169 | Good 86.0% |
| Afghans | 59.7 /100 | #170 | Average 85.9% |
| Immigrants | Chile | 57.3 /100 | #171 | Average 85.9% |
| Bermudans | 55.1 /100 | #172 | Average 85.8% |
Demographics Similar to Immigrants from Hong Kong by GED/Equivalency
In terms of ged/equivalency, the demographic groups most similar to Immigrants from Hong Kong are French Canadian (86.9%, a difference of 0.050%), Immigrants from China (86.9%, a difference of 0.050%), Swiss (87.0%, a difference of 0.070%), Mongolian (87.0%, a difference of 0.080%), and Immigrants from Kazakhstan (87.0%, a difference of 0.090%).
| Demographics | Rating | Rank | GED/Equivalency |
| Egyptians | 95.3 /100 | #110 | Exceptional 87.1% |
| French | 95.2 /100 | #111 | Exceptional 87.1% |
| Tlingit-Haida | 94.8 /100 | #112 | Exceptional 87.0% |
| Assyrians/Chaldeans/Syriacs | 94.8 /100 | #113 | Exceptional 87.0% |
| Immigrants | Kazakhstan | 94.7 /100 | #114 | Exceptional 87.0% |
| Mongolians | 94.6 /100 | #115 | Exceptional 87.0% |
| Swiss | 94.5 /100 | #116 | Exceptional 87.0% |
| Immigrants | Hong Kong | 93.8 /100 | #117 | Exceptional 86.9% |
| French Canadians | 93.2 /100 | #118 | Exceptional 86.9% |
| Immigrants | China | 93.2 /100 | #119 | Exceptional 86.9% |
| Scotch-Irish | 91.6 /100 | #120 | Exceptional 86.8% |
| Immigrants | Lebanon | 90.9 /100 | #121 | Exceptional 86.8% |
| Immigrants | Jordan | 90.8 /100 | #122 | Exceptional 86.8% |
| Immigrants | Italy | 90.5 /100 | #123 | Exceptional 86.7% |
| Immigrants | Egypt | 90.4 /100 | #124 | Exceptional 86.7% |