Alsatian vs Immigrants from Senegal GED/Equivalency
COMPARE
Alsatian
Immigrants from Senegal
GED/Equivalency
GED/Equivalency Comparison
Alsatians
Immigrants from Senegal
86.0%
GED/EQUIVALENCY
64.3/ 100
METRIC RATING
165th/ 347
METRIC RANK
83.8%
GED/EQUIVALENCY
1.2/ 100
METRIC RATING
245th/ 347
METRIC RANK
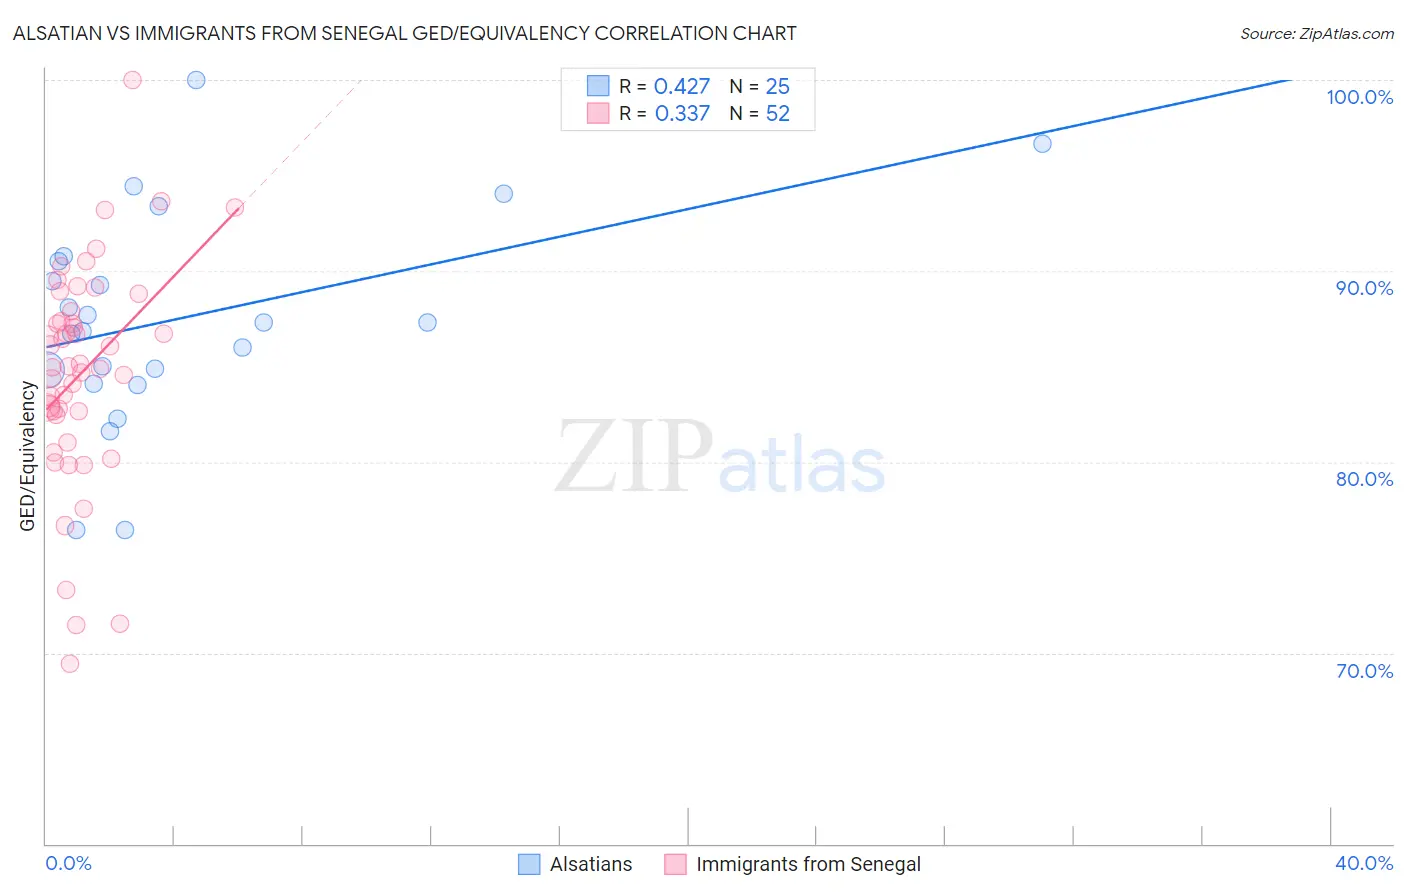
Alsatian vs Immigrants from Senegal GED/Equivalency Correlation Chart
The statistical analysis conducted on geographies consisting of 82,682,365 people shows a moderate positive correlation between the proportion of Alsatians and percentage of population with at least ged/equivalency education in the United States with a correlation coefficient (R) of 0.427 and weighted average of 86.0%. Similarly, the statistical analysis conducted on geographies consisting of 90,130,297 people shows a mild positive correlation between the proportion of Immigrants from Senegal and percentage of population with at least ged/equivalency education in the United States with a correlation coefficient (R) of 0.337 and weighted average of 83.8%, a difference of 2.6%.
GED/Equivalency Correlation Summary
| Measurement | Alsatian | Immigrants from Senegal |
| Minimum | 76.4% | 69.5% |
| Maximum | 100.0% | 100.0% |
| Range | 23.6% | 30.5% |
| Mean | 87.5% | 84.7% |
| Median | 87.3% | 85.0% |
| Interquartile 25% (IQ1) | 84.5% | 82.5% |
| Interquartile 75% (IQ3) | 90.6% | 87.6% |
| Interquartile Range (IQR) | 6.2% | 5.1% |
| Standard Deviation (Sample) | 5.6% | 5.8% |
| Standard Deviation (Population) | 5.5% | 5.7% |
Similar Demographics by GED/Equivalency
Demographics Similar to Alsatians by GED/Equivalency
In terms of ged/equivalency, the demographic groups most similar to Alsatians are Immigrants from Albania (86.0%, a difference of 0.0%), Ethiopian (86.0%, a difference of 0.010%), Venezuelan (86.0%, a difference of 0.030%), Ugandan (86.1%, a difference of 0.040%), and Sierra Leonean (86.0%, a difference of 0.050%).
| Demographics | Rating | Rank | GED/Equivalency |
| German Russians | 72.1 /100 | #158 | Good 86.2% |
| Immigrants | Kenya | 71.8 /100 | #159 | Good 86.2% |
| Immigrants | Morocco | 69.5 /100 | #160 | Good 86.1% |
| Immigrants | Syria | 69.3 /100 | #161 | Good 86.1% |
| Immigrants | Iraq | 68.1 /100 | #162 | Good 86.1% |
| Ugandans | 66.3 /100 | #163 | Good 86.1% |
| Venezuelans | 65.5 /100 | #164 | Good 86.0% |
| Alsatians | 64.3 /100 | #165 | Good 86.0% |
| Immigrants | Albania | 64.2 /100 | #166 | Good 86.0% |
| Ethiopians | 63.7 /100 | #167 | Good 86.0% |
| Sierra Leoneans | 61.8 /100 | #168 | Good 86.0% |
| Immigrants | Ethiopia | 61.2 /100 | #169 | Good 86.0% |
| Afghans | 59.7 /100 | #170 | Average 85.9% |
| Immigrants | Chile | 57.3 /100 | #171 | Average 85.9% |
| Bermudans | 55.1 /100 | #172 | Average 85.8% |
Demographics Similar to Immigrants from Senegal by GED/Equivalency
In terms of ged/equivalency, the demographic groups most similar to Immigrants from Senegal are Chickasaw (83.8%, a difference of 0.020%), Immigrants from Ghana (83.9%, a difference of 0.030%), Cherokee (83.9%, a difference of 0.040%), Immigrants from Western Africa (83.8%, a difference of 0.050%), and Blackfeet (83.8%, a difference of 0.070%).
| Demographics | Rating | Rank | GED/Equivalency |
| Immigrants | Peru | 2.7 /100 | #238 | Tragic 84.2% |
| Immigrants | Bahamas | 2.6 /100 | #239 | Tragic 84.2% |
| Immigrants | South Eastern Asia | 2.5 /100 | #240 | Tragic 84.1% |
| Senegalese | 1.9 /100 | #241 | Tragic 84.0% |
| Sri Lankans | 1.9 /100 | #242 | Tragic 84.0% |
| Cherokee | 1.3 /100 | #243 | Tragic 83.9% |
| Immigrants | Ghana | 1.3 /100 | #244 | Tragic 83.9% |
| Immigrants | Senegal | 1.2 /100 | #245 | Tragic 83.8% |
| Chickasaw | 1.2 /100 | #246 | Tragic 83.8% |
| Immigrants | Western Africa | 1.1 /100 | #247 | Tragic 83.8% |
| Blackfeet | 1.1 /100 | #248 | Tragic 83.8% |
| Crow | 1.1 /100 | #249 | Tragic 83.8% |
| Shoshone | 1.0 /100 | #250 | Tragic 83.7% |
| Spanish Americans | 0.8 /100 | #251 | Tragic 83.6% |
| Bahamians | 0.8 /100 | #252 | Tragic 83.6% |