Alsatian vs Inupiat GED/Equivalency
COMPARE
Alsatian
Inupiat
GED/Equivalency
GED/Equivalency Comparison
Alsatians
Inupiat
86.0%
GED/EQUIVALENCY
64.3/ 100
METRIC RATING
165th/ 347
METRIC RANK
83.1%
GED/EQUIVALENCY
0.2/ 100
METRIC RATING
261st/ 347
METRIC RANK
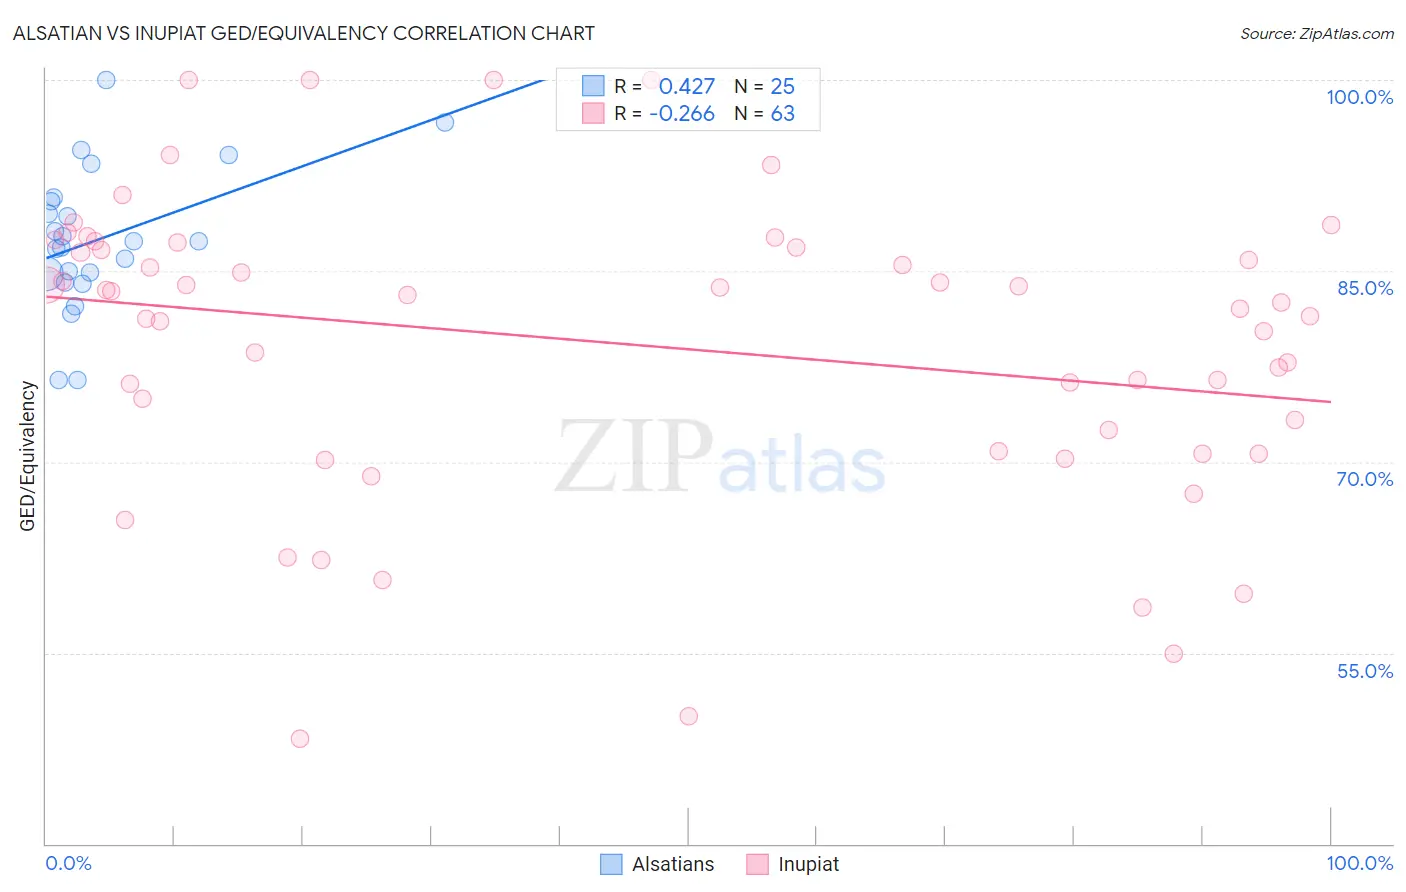
Alsatian vs Inupiat GED/Equivalency Correlation Chart
The statistical analysis conducted on geographies consisting of 82,682,365 people shows a moderate positive correlation between the proportion of Alsatians and percentage of population with at least ged/equivalency education in the United States with a correlation coefficient (R) of 0.427 and weighted average of 86.0%. Similarly, the statistical analysis conducted on geographies consisting of 96,349,240 people shows a weak negative correlation between the proportion of Inupiat and percentage of population with at least ged/equivalency education in the United States with a correlation coefficient (R) of -0.266 and weighted average of 83.1%, a difference of 3.5%.
GED/Equivalency Correlation Summary
| Measurement | Alsatian | Inupiat |
| Minimum | 76.4% | 48.2% |
| Maximum | 100.0% | 100.0% |
| Range | 23.6% | 51.8% |
| Mean | 87.5% | 79.3% |
| Median | 87.3% | 82.5% |
| Interquartile 25% (IQ1) | 84.5% | 70.8% |
| Interquartile 75% (IQ3) | 90.6% | 86.8% |
| Interquartile Range (IQR) | 6.2% | 16.0% |
| Standard Deviation (Sample) | 5.6% | 11.7% |
| Standard Deviation (Population) | 5.5% | 11.6% |
Similar Demographics by GED/Equivalency
Demographics Similar to Alsatians by GED/Equivalency
In terms of ged/equivalency, the demographic groups most similar to Alsatians are Immigrants from Albania (86.0%, a difference of 0.0%), Ethiopian (86.0%, a difference of 0.010%), Venezuelan (86.0%, a difference of 0.030%), Ugandan (86.1%, a difference of 0.040%), and Sierra Leonean (86.0%, a difference of 0.050%).
| Demographics | Rating | Rank | GED/Equivalency |
| German Russians | 72.1 /100 | #158 | Good 86.2% |
| Immigrants | Kenya | 71.8 /100 | #159 | Good 86.2% |
| Immigrants | Morocco | 69.5 /100 | #160 | Good 86.1% |
| Immigrants | Syria | 69.3 /100 | #161 | Good 86.1% |
| Immigrants | Iraq | 68.1 /100 | #162 | Good 86.1% |
| Ugandans | 66.3 /100 | #163 | Good 86.1% |
| Venezuelans | 65.5 /100 | #164 | Good 86.0% |
| Alsatians | 64.3 /100 | #165 | Good 86.0% |
| Immigrants | Albania | 64.2 /100 | #166 | Good 86.0% |
| Ethiopians | 63.7 /100 | #167 | Good 86.0% |
| Sierra Leoneans | 61.8 /100 | #168 | Good 86.0% |
| Immigrants | Ethiopia | 61.2 /100 | #169 | Good 86.0% |
| Afghans | 59.7 /100 | #170 | Average 85.9% |
| Immigrants | Chile | 57.3 /100 | #171 | Average 85.9% |
| Bermudans | 55.1 /100 | #172 | Average 85.8% |
Demographics Similar to Inupiat by GED/Equivalency
In terms of ged/equivalency, the demographic groups most similar to Inupiat are Immigrants from Armenia (83.1%, a difference of 0.0%), Immigrants from Congo (83.1%, a difference of 0.010%), Bangladeshi (83.1%, a difference of 0.020%), West Indian (83.1%, a difference of 0.030%), and Kiowa (83.1%, a difference of 0.040%).
| Demographics | Rating | Rank | GED/Equivalency |
| Creek | 0.7 /100 | #254 | Tragic 83.6% |
| Colville | 0.5 /100 | #255 | Tragic 83.4% |
| Africans | 0.5 /100 | #256 | Tragic 83.4% |
| Jamaicans | 0.4 /100 | #257 | Tragic 83.3% |
| Malaysians | 0.4 /100 | #258 | Tragic 83.3% |
| Immigrants | Vietnam | 0.3 /100 | #259 | Tragic 83.2% |
| Choctaw | 0.3 /100 | #260 | Tragic 83.1% |
| Inupiat | 0.2 /100 | #261 | Tragic 83.1% |
| Immigrants | Armenia | 0.2 /100 | #262 | Tragic 83.1% |
| Immigrants | Congo | 0.2 /100 | #263 | Tragic 83.1% |
| Bangladeshis | 0.2 /100 | #264 | Tragic 83.1% |
| West Indians | 0.2 /100 | #265 | Tragic 83.1% |
| Kiowa | 0.2 /100 | #266 | Tragic 83.1% |
| Trinidadians and Tobagonians | 0.2 /100 | #267 | Tragic 83.0% |
| Immigrants | Burma/Myanmar | 0.2 /100 | #268 | Tragic 83.0% |